chapter 3. demographics and socio-economic status
TRANSCRIPT
CHAPTER 3 / DEMOGRAPHICS AND SOCIO-ECONOMIC STATUS PAGE 3-1
CHAPTER 3. DEMOGRAPHICS AND SOCIO-ECONOMIC STATUS

PAGE 3-2 CHAPTER 3 / DEMOGRAPHICS AND SOCIO-ECONOMIC STATUS
3.1 Introduction
The development of a long-term transport framework that
provides opportunities for economic growth and creates
inclusive communities where people can work, live and play
requires a strategic understanding of the country’s
demographic characteristics and socio-economic status.
The characteristics of the population measured in terms of
population growth, provincial population share, income,
employment status, population density and provincial
contribution to the economy are key indicators informing
strategic planning.
In tracking and monitoring demographic and socio-
economic changes, the NATMAP 2050 relied on Census 2001
and National Household Travel Survey 2003 data. These data
sources were updated in 2011 and again in 2013. Comparing
these data sets provides a powerful indication of
demographic and socio economic trends and of whether
planning policy has had an effect over the past decade. By
considering the changes that have come about, it is possible
to determine the appropriate focus of transport planning
and transport investment.
This chapter provides an overview of the status of South
Africa’s demography. It presents observations from the
population analyses and forecasting carried out during the
NATMAP 2050 analysis process, the population's socio-
economic status, and the interventions required to align the
population forecast with the NATMAP 2050 Vision.
CHAPTER 3 / DEMOGRAPHICS AND SOCIO-ECONOMIC STATUS PAGE 3-3
FIGURE 3-1: TOTAL POPULATION OF SOUTH AFRICA INCLUDING
CENSUS 2011 DATA (Source: STATSSA, 2011)
3.2 Status of Demographic and Socio-
Economic Characteristics
3.2.1 Demographic characteristics
Spatial distribution and density are critical in designing
sound transportation systems that will meet and support the
geographical mobility of the population. Highlighted below
are key characteristics of South Africa's population.
POPULATION
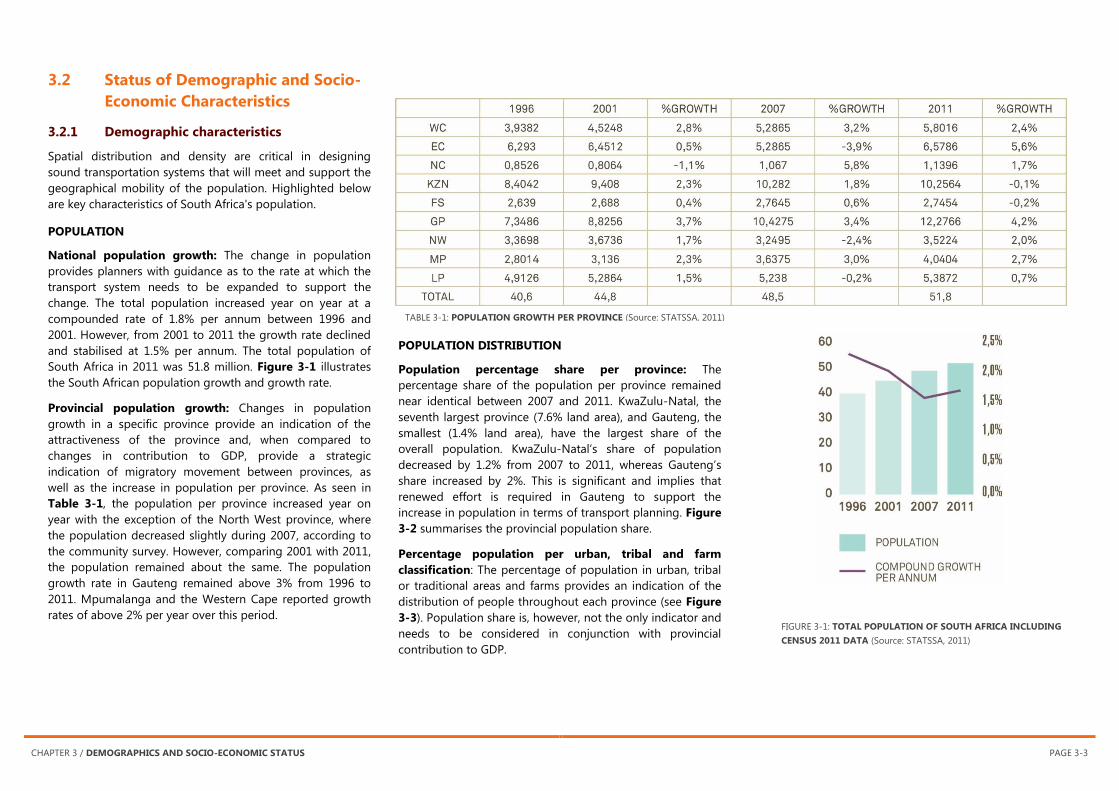
National population growth: The change in population
provides planners with guidance as to the rate at which the
transport system needs to be expanded to support the
change. The total population increased year on year at a
compounded rate of 1.8% per annum between 1996 and
2001. However, from 2001 to 2011 the growth rate declined
and stabilised at 1.5% per annum. The total population of
South Africa in 2011 was 51.8 million. Figure 3-1 illustrates
the South African population growth and growth rate.
Provincial population growth: Changes in population
growth in a specific province provide an indication of the
attractiveness of the province and, when compared to
changes in contribution to GDP, provide a strategic
indication of migratory movement between provinces, as
well as the increase in population per province. As seen in
Table 3-1, the population per province increased year on
year with the exception of the North West province, where
the population decreased slightly during 2007, according to
the community survey. However, comparing 2001 with 2011,
the population remained about the same. The population
growth rate in Gauteng remained above 3% from 1996 to
2011. Mpumalanga and the Western Cape reported growth
rates of above 2% per year over this period.
POPULATION DISTRIBUTION
Population percentage share per province: The
percentage share of the population per province remained
near identical between 2007 and 2011. KwaZulu-Natal, the
seventh largest province (7.6% land area), and Gauteng, the
smallest (1.4% land area), have the largest share of the
overall population. KwaZulu-Natal’s share of population
decreased by 1.2% from 2007 to 2011, whereas Gauteng’s
share increased by 2%. This is significant and implies that
renewed effort is required in Gauteng to support the
increase in population in terms of transport planning. Figure
3-2 summarises the provincial population share.
Percentage population per urban, tribal and farm
classification: The percentage of population in urban, tribal
or traditional areas and farms provides an indication of the
distribution of people throughout each province (see Figure
3-3). Population share is, however, not the only indicator and
needs to be considered in conjunction with provincial
contribution to GDP.
TABLE 3-1: POPULATION GROWTH PER PROVINCE (Source: STATSSA, 2011)

PAGE 3-4 CHAPTER 3 / DEMOGRAPHICS AND SOCIO-ECONOMIC STATUS
Table 3-2: COMPARISON OF ANNUALISED POPULATION GROWTH AND
GVA CHANGE PER CATEGORY OF AREA BETWEEN 1996 AND 2011
(Source: STATSSA 2011)
In the provinces with the highest contribution to GDP (see
Figure 3-10), the largest portion of the population lives in
urban areas, especially in Gauteng, KwaZulu-Natal and the
Western Cape. The majority (78%) of the population within
the Limpopo Province lives in tribal areas. Tribal areas are
typically villages inhabited by self-sustaining citizens. Villages
take the form of pockets of houses/huts clustered
throughout an area perforated by large grassland/fields/
farmland in between. Urban areas include formal and
informal urban residential areas and commercial and
subsistence farming.
The fact that, in several provinces, more than 50% of the
population lives in tribal areas has a significant bearing on
the approach to providing access in these rural areas. The
provision of rural transport considerations in the NATMAP
2050 will, therefore, have to identify means to support and
enhance accessibility in these areas.
Distribution of population between metropolitan areas
and secondary development nodes: Todes and Harrison
(2013) provide insight into the change in total population
within metropolitan and other secondary nodes. The authors
prepared a research study on the change of population and
gross value added (GVA) per area category. For the purposes
of the study to compare population growth and economic
contribution, urban areas were categorised based on spatial
extent, economic activity and population. The categories and
typical examples of cities are (refer to Figure 3-4):
An inner core: consisting of the large metropolitan
agglomerations and secondary cities (e.g. the Gauteng
City-Region, the Western Cape Urban Agglomeration, the
KwaZulu-Natal Coastal Urban Agglomeration, Nelson
Mandela Bay, Mangaung, Buffalo City, Msunduzi,
Polokwane, the Free State Goldfields, Mbombela,
Polowane, Sol Plaatje and the Cape South Coast Tourism
Belt)
An outer core: consisting of large towns with major
service functions, medium-sized mining centres, peri-
urban agglomerations around the inner core, and large
agglomerations around previous homeland capitals (e.g.
Newcastle, Kroonstad, Grahamstown, Phalaborwa,
Mthatha and Thohoyandou)
A semi-periphery: consisting of medium-sized towns
with an established infrastructure, secondary mining
outliers and the more densely settled parts of the
previous Bantustans with local economies producing
more than R1 billion per year (e.g. Vryheid, Kuruman and
Springbok)
A periphery: consisting of small service centres with
established infrastructure, small mining economies and
previous Bantustan economies with outputs of more than
R0.4–R1 billion per year (e.g. Calvinia and Dannhauser)
A deep periphery: comprising very marginal local
economies with outputs of less than R0.4 billion per year
(e.g. Jansenville, Tarkastad, Boshof, Harding, Pofadder and
Warrenton).
FIGURE 3-2: POPULATION PERCENTAGE SHARE PER PROVINCE
(Source: STATSSA, 1996, 2001, 2007, 2011)
FIGURE 3-3: PERCENTAGE POPULATION URBAN, TRIBAL OR
TRADITIONAL AREAS AND FARMS (Source: STATSSA, 2011)

CHAPTER 3 / DEMOGRAPHICS AND SOCIO-ECONOMIC STATUS PAGE 3-5
FIGURE 3-4: DISTRIBUTION OF POPULATION BETWEEN METROPOLITAN AREAS AND SECONDARY DEVELOPMENT NODES (Source: Todes & Harrison, 2013)
PAGE 3-6 CHAPTER 3 / DEMOGRAPHICS AND SOCIO-ECONOMIC STATUS
Table 3-2 illustrates the comparison of annualised
population growth and GVA change per category of area
between 1996 and 2011. In 1996, the GVA contribution made
by the inner core settlements was 79.4%. Their contribution
increased to 81.4% in 2011. However, the more peripheral
the area, the lower the GVA growth. Figure 3-4 also shows
that in the inner core, significant levels of population growth
occurred. South Africa’s average annual population growth
of 1.6% between 1996 and 2011 is comparatively low, and
the growth that has occurred is overwhelmingly
concentrated in the inner core.
The changes reflected are very general because the diversity
within each spatial category vary considerably. However,
these changes provide insight into migratory patterns and
demonstrate that the majority of people migrate to areas
where economic activity is increasing. This trend emphasises
that transport investment needs to be focused carefully to
ensure that all these categorised areas enjoy optimal
provision of transport services and infrastructure. An
integrated investment approach is, therefore, required to
ensure economic growth throughout the country.
PEOPLE WITH SPECIAL NEEDS
Due to the differences in the questions asked during the
1996, 2001 and 2007 community surveys, it is not possible to
compare the results directly. The latest report also does not
include statistics on children under the age of 5 or on
persons with psycho-social and certain neurological
disabilities due to data limitations, and should, therefore, not
be used for purposes of describing the overall disability
prevalence or profile of persons with disabilities in South
Africa.
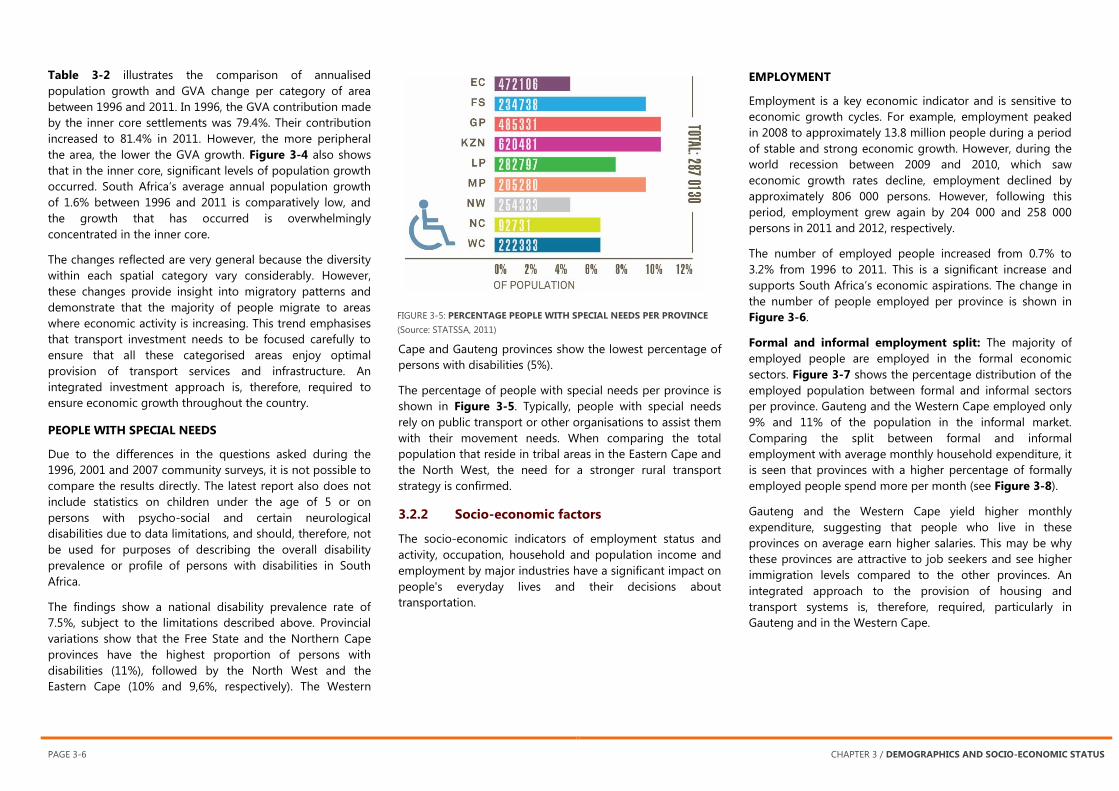
The findings show a national disability prevalence rate of
7.5%, subject to the limitations described above. Provincial
variations show that the Free State and the Northern Cape
provinces have the highest proportion of persons with
disabilities (11%), followed by the North West and the
Eastern Cape (10% and 9,6%, respectively). The Western
Cape and Gauteng provinces show the lowest percentage of
persons with disabilities (5%).
The percentage of people with special needs per province is
shown in Figure 3-5. Typically, people with special needs
rely on public transport or other organisations to assist them
with their movement needs. When comparing the total
population that reside in tribal areas in the Eastern Cape and
the North West, the need for a stronger rural transport
strategy is confirmed.
3.2.2 Socio-economic factors
The socio-economic indicators of employment status and
activity, occupation, household and population income and
employment by major industries have a significant impact on
people's everyday lives and their decisions about
transportation.
EMPLOYMENT
Employment is a key economic indicator and is sensitive to
economic growth cycles. For example, employment peaked
in 2008 to approximately 13.8 million people during a period
of stable and strong economic growth. However, during the
world recession between 2009 and 2010, which saw
economic growth rates decline, employment declined by
approximately 806 000 persons. However, following this
period, employment grew again by 204 000 and 258 000
persons in 2011 and 2012, respectively.
The number of employed people increased from 0.7% to
3.2% from 1996 to 2011. This is a significant increase and
supports South Africa’s economic aspirations. The change in
the number of people employed per province is shown in
Figure 3-6.
Formal and informal employment split: The majority of
employed people are employed in the formal economic
sectors. Figure 3-7 shows the percentage distribution of the
employed population between formal and informal sectors
per province. Gauteng and the Western Cape employed only
9% and 11% of the population in the informal market.
Comparing the split between formal and informal
employment with average monthly household expenditure, it
is seen that provinces with a higher percentage of formally
employed people spend more per month (see Figure 3-8).
Gauteng and the Western Cape yield higher monthly
expenditure, suggesting that people who live in these
provinces on average earn higher salaries. This may be why
these provinces are attractive to job seekers and see higher
immigration levels compared to the other provinces. An
integrated approach to the provision of housing and
transport systems is, therefore, required, particularly in
Gauteng and in the Western Cape.
FIGURE 3-5: PERCENTAGE PEOPLE WITH SPECIAL NEEDS PER PROVINCE
(Source: STATSSA, 2011)

CHAPTER 3 / DEMOGRAPHICS AND SOCIO-ECONOMIC STATUS PAGE 3-7
FIGURE 3-6: NUMBER OF EMPLOYED PEOPLE PER PROVINCE 1996
TO 2011 (Source: STATSSA, 2011)
FIGURE 3-7: EMPLOYED POPULATION PER MAIN SECTOR;
2011 (Source: STATSSA, 2011)
FIGURE 3-8: MONTHLY HOUSEHOLD INCOME PER
PROVINCE (Source: STATSSA, 2011)
PAGE 3-8 CHAPTER 3 / DEMOGRAPHICS AND SOCIO-ECONOMIC STATUS
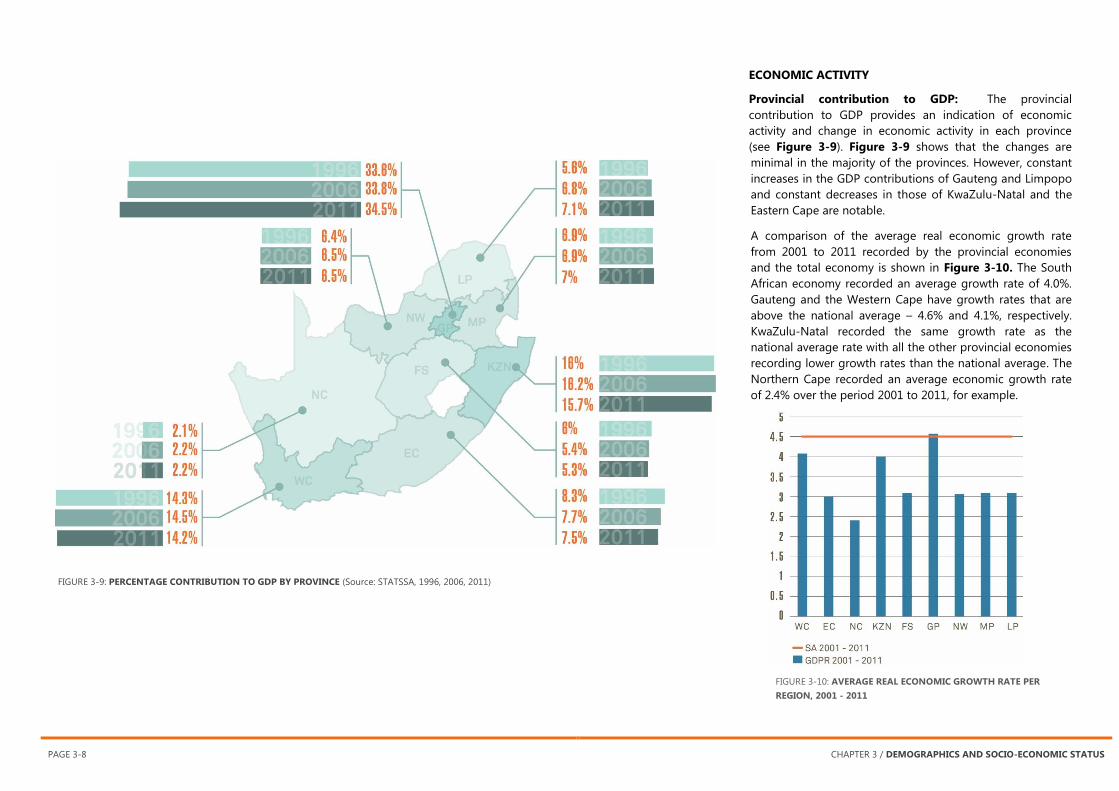
FIGURE 3-10: AVERAGE REAL ECONOMIC GROWTH RATE PER
REGION, 2001 - 2011
ECONOMIC ACTIVITY
Provincial contribution to GDP: The provincial
contribution to GDP provides an indication of economic
activity and change in economic activity in each province
(see Figure 3-9). Figure 3-9 shows that the changes are
minimal in the majority of the provinces. However, constant
increases in the GDP contributions of Gauteng and Limpopo
and constant decreases in those of KwaZulu-Natal and the
Eastern Cape are notable.
A comparison of the average real economic growth rate
from 2001 to 2011 recorded by the provincial economies
and the total economy is shown in Figure 3-10. The South
African economy recorded an average growth rate of 4.0%.
Gauteng and the Western Cape have growth rates that are
above the national average – 4.6% and 4.1%, respectively.
KwaZulu-Natal recorded the same growth rate as the
national average rate with all the other provincial economies
recording lower growth rates than the national average. The
Northern Cape recorded an average economic growth rate
of 2.4% over the period 2001 to 2011, for example.
FIGURE 3-9: PERCENTAGE CONTRIBUTION TO GDP BY PROVINCE (Source: STATSSA, 1996, 2006, 2011)

CHAPTER 3 / DEMOGRAPHICS AND SOCIO-ECONOMIC STATUS PAGE 3-9
3.3 Future Demographic and Socio-
Economic Characteristics
Several models are used to project the population of South
Africa. The NATMAP 2050 used several population growth
scenarios to estimate the transport demand for the 15-, 20-
and 40-year horizons. During the development of the
transport demand models, several assumptions were made
in relation to economic growth, land use patterns and
population growth rates. For each of the horizon years, three
scenarios were developed: a low, medium and high growth
scenario. Figure 3-11 illustrates the projected population to
2050 comparing the NATMAP 2050 demand models to the
Actuarial Society of South Africa (ASSA) population model of
2011. The figure shows that, for each of the NATMAP 2050
horizon years, the developed scenarios align very well with
the latest ASSA model. The significance of the ASSA model is
that it is regularly updated with the latest available fertility,
mortality and HIV data and is, therefore, a very good
comparative data set.
The inference drawn from this comparison is that the
demand models developed for the NATMAP 2050 remain
relevant, especially when looking at the low scenario forecast
for 2025, the medium scenario forecast for 2030 and the low
scenario forecast for 2050.
The NATMAP 2050 population projections were also carried
out at national, provincial, and local government level. The
results of the socio-economic scenarios provided input into
the transportation demand model. The middle scenario was
used to evaluate the impact of the proposed development
model on the transport system. Proposals were made per
scenario to provide an effective and efficient transport
system.
The main population and socio-economic projected
outcomes from the NATMAP scenarios are:
Population increase: The total population for the years
2030 and 2050 is expected to be between 52 and 57
million and between 55 and 63 million respectively – a
potential increase of almost 15 million people by 2050.
Population density: The total population density in
Gauteng is expected to almost double from 58 persons
per hectare to 105 persons per hectare between 2005 and
2050. KwaZulu-Natal will increase from 10 to 12 persons
per hectare and the Western Cape from 3 to 6 persons
per hectare. Nationally, the population density will remain
the same.
Unemployment: Unemployment is expected to decline
from 38% in 2005 to between 8% and 20% by 2050.
Employment shift: The structural shift away from primary
sector employment is projected for the agricultural and
mining sectors.
Rural provinces: Rural provinces have a predominantly
low-income-earning population who typically travel
longer distances to destinations offering opportunities.
These longer travel distances imply higher transport cost
to these travellers, who are least able to afford it.
FIGURE 3-11: NATMAP PROJECTED POPULATION COMPARED
TO ASSA 2011 (Source: ASSA, 2011)

PAGE 3-10 CHAPTER 3 / DEMOGRAPHICS AND SOCIO-ECONOMIC STATUS
The following issues and concerns relating to the South
African future population include:
Continued uneven population distribution ranging
from very low density in deep rural areas to densely
populated metropolitan areas. Uneven population
distribution is also associated with economic activity that
is concentrated in metropolitan areas. It gives rise to the
effects of urbanisation and the tendency of the
population to migrate from rural areas to urban areas.
The 2030 provincial population share in comparison with
Census 2011 (illustrated in Figure 3-12) shows that the
highest increase in population – an increase of about 8% –
will occur in Gauteng.
All the other provinces will experience a slight increase in
population by 2030 as compared to 2011, except for the
Eastern Cape, the North West and the Free State.
Economically attractive provinces: Gauteng and the
Western Cape have been and are projected to continue to
be more economically attractive for people from the other
provinces.
Emigration and immigration: At international level,
South Africa has experienced significant emigration –
particularly skilled labour. There is also concern about
large numbers of immigrants entering the country from
neighbouring countries in search of economic
opportunities and socio-political security.
Informal settlements: The urban areas of South Africa
are faced with the challenge of informal settlements
mushrooming over a short period. Some people move to
urban areas and settle in informal areas in the hope of
eventually securing employment. This creates settlements
that become pockets of poverty within urban areas,
putting pressure on the provision of housing, basic
services, and public transport services.
High unemployment rates in South Africa are a
persistent challenge: Some industries, particularly
agriculture and mining, are on the decline due to
increasing production costs and a shrinking resource
base. It is noteworthy that these are the primary industries
that employ a large percentage of the unskilled
population.
HIV/AIDS: HIV/AIDS have had a significant effect in
shaping the demographic profile of South Africa's
population in the past and is predicted to continue to do
so, though perhaps at a lower rate, in the future.
Education: The level of education of many South Africans
is another concern. Figure 3-13 illustrates persons aged
20 years and older with no formal schooling. Persons with
no schooling decreased significantly since 2002. However,
Limpopo and Mpumalanga reported that more than 10%
of persons aged 20 years and older have no formal
schooling.
Travel and freight costs: The fragmentation of
population settlements and associated economic activity
in the various areas of South Africa pose a challenge to
the transport industry. High travel costs are associated
with the movement of workers over long distances and
inappropriate land use planning (e.g. apartheid planning).
The transportation of freight from place of extraction/
production to place of processing/sale is significant
enough to require attention when planning transport
infrastructure. On the other hand, increased urbanisation
and infill development will promote more efficient
transport systems due to higher population and activity
densities.
FIGURE 3-12: PROJECTED PROVINCIAL POPULATION DISTRIBUTION
COMPARISON TO 2030, ASSA 2011 AND CENSUS 2011 (Source: ASSA,
2011; STATSSA, 2011)
FIGURE 3-13: PERCENTAGE OF PERSONS AGED 20 YEARS AND OLDER
WITH NO FORMAL SCHOOLING PER PROVINCE, 2002 AND 2013
(Source: General Household Survey 2013)

CHAPTER 3 / DEMOGRAPHICS AND SOCIO-ECONOMIC STATUS PAGE 3-11
3.4 The Socio-Economic Role of
Transport
Transportation means personal mobility as well as access to
goods, services and information. It is an essential human
activity that makes a critical input to social development and
national and global economies. The transport sector has a
fundamental influence on socio-economic development.
Therefore, all players in the transport sector have an
important role in making sure that the transport services
necessary to economy and quality of life are provided in the
most sustainable manner.
Work carried out by the Asian Development Bank Institute
(ADBI, 2010) reveals that investment in and the expansion of
transport infrastructure and trade facilitate national poverty
reduction and enhance socio economic development. These
elements also reduce transaction and opportunity costs and
enhance market penetration with improved access and
mobility. Improved transportation infrastructure gives rise to
complex economic interactions, with the exact causal
relationship between economic growth and infrastructure
and transport investment being unclear. However, the
linkages create positive effects. Essentially, the benefits of
improved accessibility and mobility in transport are
transmitted between markets and to households, including
implications for poverty alleviation.
The increased exposure to new businesses that comes with
greater connectivity increases the opportunities for improved
technological adaptation. Indeed, it has been shown that
improving connectivity has been shown to raise work force
productivity, increase school attendance and improve
working conditions and even wage levels.
If we, then, agree that transport supports socio-economic
development, one of the questions in our local context is –
what strategy do we employ to enhance transport’s role in
socio-economic development? Here we have to consider, for
example, the level of investment or subsidisation required in
public transport to enable it to support socio-economic
needs. Accessibility and mobility in rural areas, especially in
relation to those who cannot afford to travel to reach
opportunities, are crucial to allow all members of society to
access the economy and have a better quality of life. A
balance has to be struck, though, between demand, needs,
priorities and funding constraints.
It is recommended that this question be explored and
definitive guidelines be provided about the socio-economic
role of transport in South Africa and the financial
implications it will have in the future.
3.5 Implications for Transport
Planning
The findings and projections highlighted above have the
following implications for transport:
Demand shift for transport: The decline in population
levels in some provinces and the increase in the more
economically viable provinces will shift the demand for
transport towards economically attractive provinces.
Pockets of poverty and infrastructure maintenance:
The pockets of poverty dispersed across several provinces
present a public transport planning challenge, as
emigration from these areas makes it difficult to project
demand patterns and, in turn, the return on investment.
Public transport dependence: The proportion of the
population earning a low income will remain dominant
over the planning period. Hence, continued dependence
on affordable public transport.
Transport infrastructure: Most of the provinces’ rates of
formal employment have been projected to increase over
the period leading to 2050. The demand for transport will
grow, as will car ownership, resulting in more pressure to
improve transport infrastructure and the quality of public
transport systems. Improved public transport with a wider
geographical network will help suppress the dependency
on single-occupancy vehicle trips over time.
Emigration from rural areas to urban areas: This
phenomenon will persist if the lack of or limited
development and poor service delivery continue in these
areas. Improved service delivery needs to be supported by
economic growth in industries within rural areas.
Beneficiation around the primary sector needs to be
strengthened to support and enhance economic growth
in rural areas.
Investment: Rapid urbanisation in the major metropolitan
and more economically developed areas necessitates

PAGE 3-12 CHAPTER 3 / DEMOGRAPHICS AND SOCIO-ECONOMIC STATUS
better transport infrastructure, which will require a greater
focus on investment needs in transport and related
services. This investment is necessary to ensure that
mobility and accessibility levels are maintained to
continue supporting economic growth, efficiency and
productivity.
3.6 Recommendations and
Interventions Proposed
Informal economic activity survey: The analysis of
economic activities and population needs in the informal
sector of the economy and commercial and subsistence
agricultural activities requires research and detailed data
collection. The purpose of collecting the data is to
determine the needs of the population that earn their
income in these segments to enable spatial, infrastructure
and transport planners to provide context-sensitive
solutions and to enhance and build on the existing
economic activities. Furthermore, changes required in
policy and legislation can be informed through this data.
Land policies: Given the continued influx of the
population to more economically developed metropolitan
and other urban areas, an integrated approach between
land use planning, housing provision, municipal services,
social amenities and public transport provision should be
implemented by all spheres of government. Detail policies
relating to land use and transport planning are provided
in later chapters of this report.
Densification and corridor infill development: The use
of vacant land and property within built-up areas should
take place along public transport corridors to improve
public transport ridership. The provision of community
facilities should become a priority in nodes supported by
transport corridors.
Development of rural areas: The development of rural
areas to provide infrastructure that promotes sustainable
economic activity is required in order to minimise the
emigration of people from rural areas, and to maintain
rural transport infrastructure. Beneficiation
(industrialisation) around the primary sector needs to be
strengthened to support and enhance economic growth
and job creation in rural areas.
Demand-driven, developmental and responsive public
transport systems planning: A large proportion of South
Africans fall in the low-income bracket and are dependent
on public transport to access opportunities. This statistic is
projected to reduce over time, given the implementation
of sufficient supporting economic job-creating measures.
Whilst it is financially unsustainable to provide full
demand-responsive public transport as a social service
(heavily subsidised) up to 2050, due consideration must
be given to a package of measures lifting many South
Africans out of poverty to enable the provision and
affordability of world-class public transport – so that
public transport does not continue to be seen as a mode
of transport that caters for the poor but, rather, as one
that caters for all as a mode of choice.
Investment in infrastructure: Promote continued
investment in infrastructure in urban and rural areas.
Guidelines: Establish guidelines about the socio
economic role and financial implications of transport
in South Africa.
Development of Special Economic Zones (SEZs): SEZs
are critical to the government's objectives to advance
industrialisation, rural development, job creation as well
as attracting Foreign Direct Investment (FDI). Special
arrangements must be made for supporting infrastructure
to support these developments. Transport network
planning and transport services implementation should be
aligned with and support SEZs.