chapter 3 demand, supply, and market...
TRANSCRIPT

Chapter 3Chapter 3Chapter 3Chapter 3
Demand, Supply, andDemand, Supply, andMarket EquilibriumMarket Equilibrium
Asst.Prof. Dr. Serdar AYANAsst.Prof. Dr. Serdar AYAN
Law of Supply and Demand is the fundamental tool of economic analysis
In this presantation
we describe the rudiments of supply and demand analysis in steps
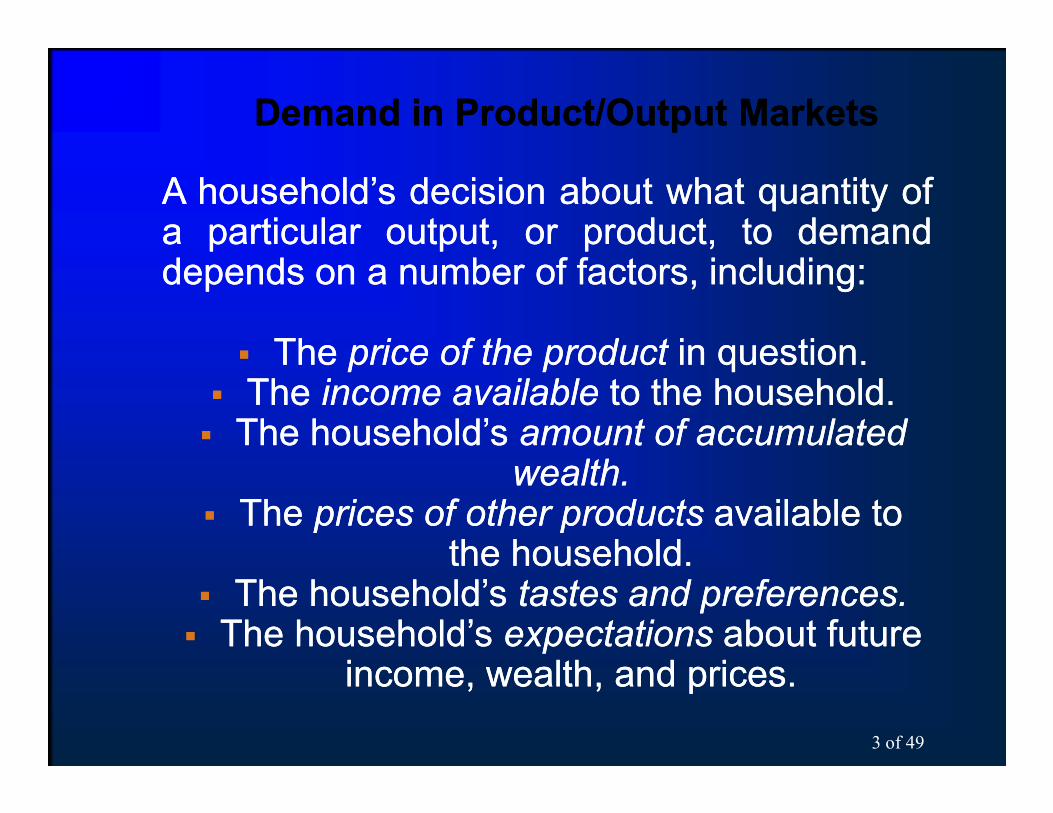
Demand in Product/Output MarketsDemand in Product/Output Markets
AA household’shousehold’s decisiondecision aboutabout whatwhat quantityquantity ofofaa particularparticular output,output, oror product,product, toto demanddemanddependsdepends onon aa numbernumber ofof factors,factors, includingincluding::
§§ The The price of the productprice of the product in question.in question.§§ The The income availableincome available to the household.to the household.
3 of 49
§§ The The income availableincome available to the household.to the household.§§ The household’s The household’s amount of accumulated amount of accumulated
wealth.wealth.§§ The The prices of other productsprices of other products available to available to
the household.the household.§§ The household’s The household’s tastes and preferences.tastes and preferences.
§§ The household’s The household’s expectations expectations about future about future income, wealth, and prices.income, wealth, and prices.

Demand in Product/Output MarketsDemand in Product/Output Markets
The most important relationship in individual The most important relationship in individual markets is that between market price and quantity markets is that between market price and quantity
demanded.demanded.
ChangesChanges inin QuantityQuantity DemandedDemanded versusversus ChangesChanges ininDemandDemand
ChangesChanges inin thethe priceprice ofof aa productproduct affectaffect thethe quantityquantity
4 of 49
ChangesChanges inin thethe priceprice ofof aa productproduct affectaffect thethe quantityquantitydemandeddemanded perper periodperiod.. ChangesChanges inin anyany otherother factor,factor,suchsuch asas incomeincome oror preferences,preferences, affectaffect demanddemand..Thus,Thus, wewe saysay thatthat anan increaseincrease inin thethe priceprice ofof CocaCoca--ColaCola isis likelylikely toto causecause aa decreasedecrease inin thethe quantityquantity ofofCocaCoca--ColaCola demandeddemanded.. However,However, wewe saysay thatthat ananincreaseincrease inin incomeincome isis likelylikely toto causecause anan increaseincrease ininthethe demanddemand forfor mostmost goodsgoods..

Demand in Product/Output MarketsDemand in Product/Output Markets
incomeincome TheThe sumsum ofof allall aa household’shousehold’s wages,wages,salaries,salaries, profits,profits, interestinterest payments,payments, rents,rents, andandotherother formsforms ofof earningsearnings inin aa givengiven periodperiod ofof
Income And WealthIncome And Wealth
Other Determinants of Household DemandOther Determinants of Household Demand
5 of 49
otherother formsforms ofof earningsearnings inin aa givengiven periodperiod ofoftimetime.. ItIt isis aa flowflow measuremeasure..
wealthwealth oror netnet worthworth TheThe totaltotal valuevalue ofof whatwhat aahouseholdhousehold ownsowns minusminus whatwhat itit owesowes.. ItIt isis aastockstock measuremeasure..

normalnormal goodsgoods GoodsGoods forfor whichwhich demanddemand goesgoesupup whenwhen incomeincome isis higherhigher andand forfor whichwhich demanddemandgoesgoes downdown whenwhen incomeincome isis lowerlower..
Demand in Product/Output MarketsDemand in Product/Output Markets
Income And WealthIncome And Wealth
Other Determinants of Household DemandOther Determinants of Household Demand
6 of 49
goesgoes downdown whenwhen incomeincome isis lowerlower..
inferiorinferior goodsgoods GoodsGoods forfor whichwhich demanddemand tendstendstoto fallfall whenwhen incomeincome risesrises..

substitutessubstitutes GoodsGoods thatthat cancan serveserve asasreplacementsreplacements forfor oneone anotheranother;; whenwhen thethe pricepriceofof oneone increases,increases, demanddemand forfor thethe otherother
Demand in Product/Output MarketsDemand in Product/Output Markets
Prices of Other Goods and ServicesPrices of Other Goods and Services
Other Determinants of Household DemandOther Determinants of Household Demand
7 of 49
ofof oneone increases,increases, demanddemand forfor thethe otherotherincreasesincreases..
complements,complements, complementarycomplementary goodsgoodsGoodsGoods thatthat “go“go together”together”;; aa decreasedecrease inin thethepriceprice ofof oneone resultsresults inin anan increaseincrease inin demanddemandforfor thethe otherother andand vicevice versaversa..

Demand in Product/Output MarketsDemand in Product/Output Markets
Tastes and PreferencesTastes and Preferences
Other Determinants of Household DemandOther Determinants of Household Demand
Income,Income, wealth,wealth, andand pricesprices ofof goodsgoods availableavailable areare thethethreethree factorsfactors thatthat determinedetermine thethe combinationscombinations ofof goodsgoodsandand servicesservices thatthat aa householdhousehold isis ableable toto buybuy..
8 of 49
ChangesChanges inin preferencespreferences cancan andand dodo manifestmanifest themselvesthemselvesinin marketmarket behaviorbehavior..
WithinWithin thethe constraintsconstraints ofof pricesprices andand incomes,incomes, preferencepreferenceshapesshapes thethe demanddemand curve,curve, butbut itit isis difficultdifficult toto generalizegeneralizeaboutabout tastestastes andand preferencespreferences.. First,First, theythey areare volatilevolatile..Second,Second, tastestastes areare idiosyncraticidiosyncratic..

Demand in Product/Output MarketsDemand in Product/Output Markets
Other Determinants of Household DemandOther Determinants of Household Demand
ExpectationsExpectations
WhatWhat youyou decidedecide toto buybuy todaytoday certainlycertainly dependsdepends onontoday’stoday’s pricesprices andand youryour currentcurrent incomeincome andand wealthwealth..
9 of 49
ThereThere areare manymany examplesexamples ofof thethe waysways expectationsexpectationsaffectaffect demanddemand..
Increasingly,Increasingly, economiceconomic theorytheory hashas comecome toto recognizerecognizethethe importanceimportance ofof expectationsexpectations..
ItIt isis importantimportant toto understandunderstand thatthat demanddemand dependsdepends ononmoremore thanthan justjust currentcurrent incomes,incomes, prices,prices, andand tastestastes..

The Quantity Demanded : It is the number of units consumers want to buy over a specified
period of time.
The Quantity Demanded of any product normally depends on its price. Quantity demanded also has a number of other determinants, including population size, consumer incomes, tastes and
the prices of other products.

Demand Schedule is a table showing how the quantity demanded of some product during a
specified period of time changes as the price of that product changes, holding all other that product changes, holding all other
determinants of quantity demanded constant
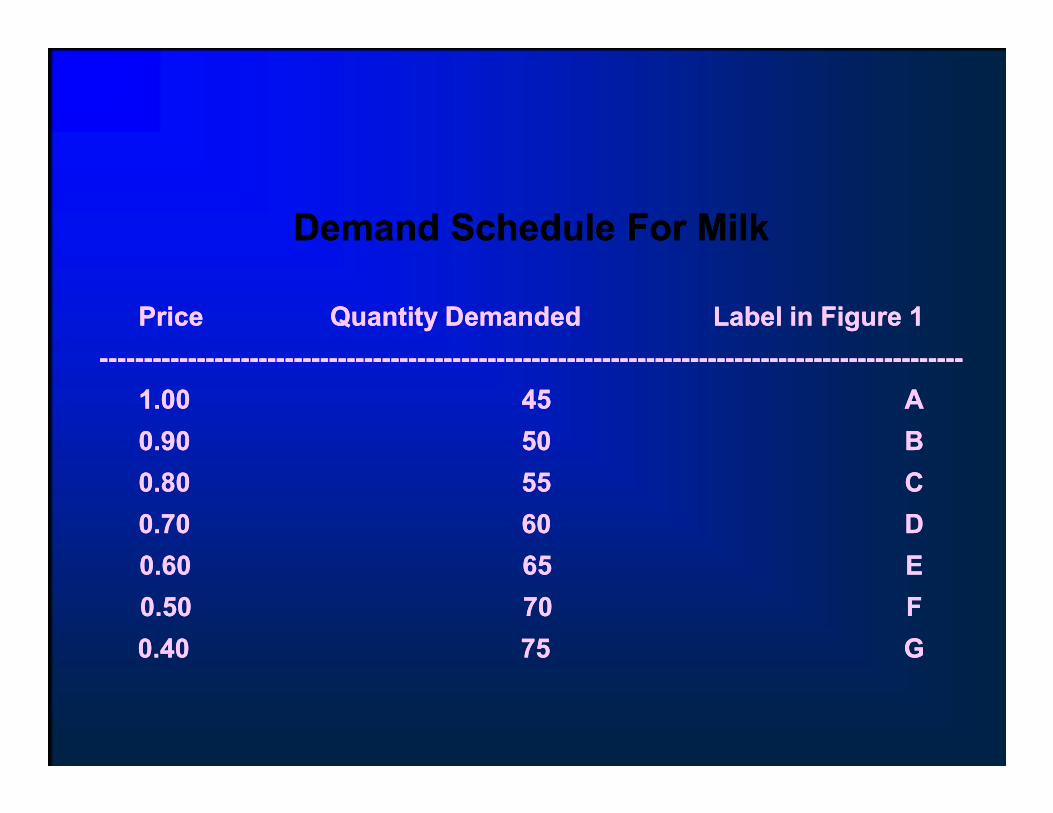
Demand Schedule For MilkDemand Schedule For Milk
PricePrice Quantity DemandedQuantity Demanded Label in Figure 1Label in Figure 1
----------------------------------------------------------------------------------------------------------------------------------------------------------------------------------------------------
1.001.00 4545 AA1.001.00 4545 AA
0.900.90 5050 BB
0.800.80 5555 CC
0.700.70 6060 DD
0.600.60 6565 EE
0.500.50 7070 FF
0.400.40 7575 GG

Demand Curve is a graphical depiction of a demand schedule. It shows how the quantity
demanded of some product during a specified period of time will change as the price of that period of time will change as the price of that
product changes, holding all other determinants of quantity demanded constant
As the price of an item rises, the quantity demanded normally falls. As the price falls, the
quantity demanded normally rises

Price 1.00 A 90 B 80 C 70 D 70 D 60 E 50 F 40 G 0 45 50 55 60 65 70 75 Quantity Demanded

The Quantity Supplied is the number of units sellers want to sell over a specified period of
time.
As the price of an item rises, the quantity supplied normally rises. As the price falls, the
quantity supplied normally falls

A supply schedule is a table showing how the quantity supplied of some product during a
specified period of time changes as the price of that product changes, holding all other that product changes, holding all other
determinants of quantity supplied constant

Supply Schedule For MilkSupply Schedule For Milk
PricePrice Quantity SuppliedQuantity Supplied Label İn Figure2.Label İn Figure2.
------------------------------------------------------------------------------------------------------------------------------------------------------------------------
1.001.00 9090 AA
0.900.90 8080 BB
0.800.80 7070 CC
0.700.70 6060 DD
0.600.60 5050 EE
0.500.50 4040 FF
0.400.40 3030 GG

A Supply Curve is a graphical depiction of a supply schedule. It shows how the quantity supplied of some product during a specified period of time will change as the price of that period of time will change as the price of that
product changes, holding all other determinants of quantity supplied constant.
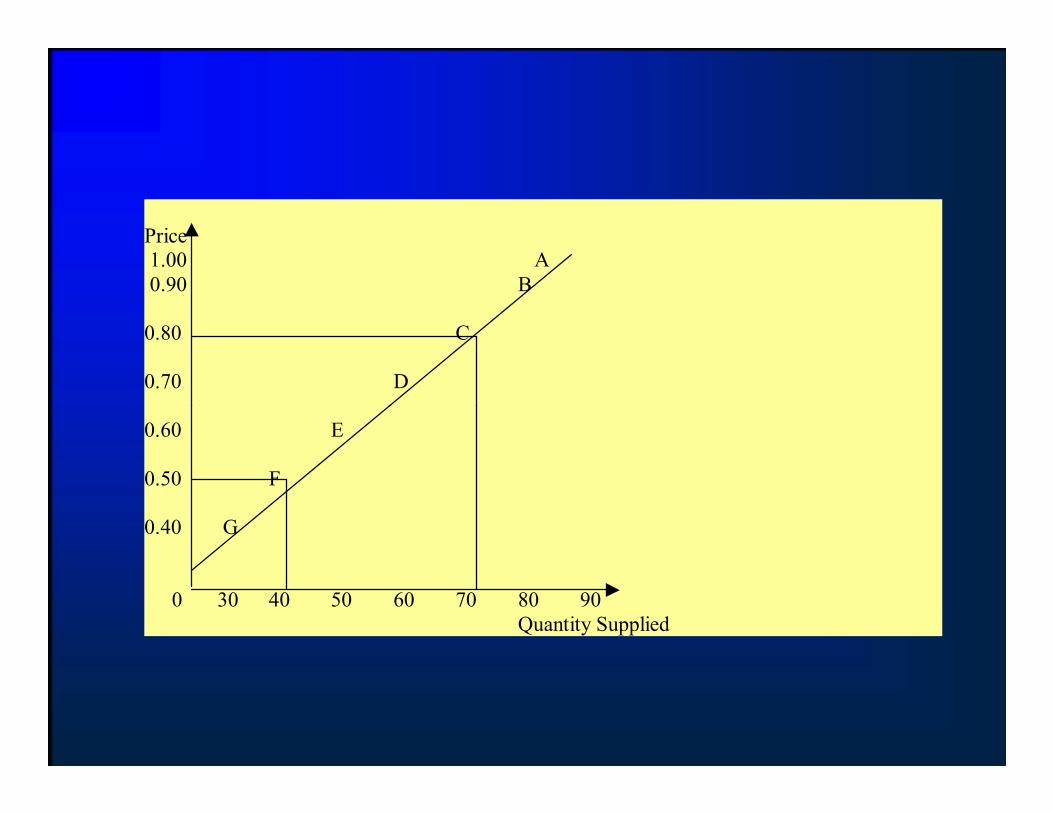
Price 1.00 A 0.90 B 0.80 C 0.70 D 0.60 E 0.50 F 0.40 G 0 30 40 50 60 70 80 90 Quantity Supplied

EQUILIBRIUM OF SUPPLY AND DEMAND
Shortage : is an excess of quantity demanded over quantity supplied. When there is a shortage, buyers can not purchase the shortage, buyers can not purchase the
quantities they desire
Surplus : is an excess of quantity demanded. When there is surplus, sellers can not sell the
quantities they desire to supply

An Equilibrium : is a situation in which there are no inherent forces that produce change.
The law of supply and demand states that, in a free market, the forces of supply and demand free market, the forces of supply and demand generally push the price toward the price at
which quantity supplied and quantity demanded are equal

Determination of the Equilibrium Price And Determination of the Equilibrium Price And Quantity of MilkQuantity of Milk
PricePrice Quantity D.Quantity D. Quantity SQuantity S Surplus or Short.Surplus or Short. Price wPrice w
----------------------------------------------------------------------------------------------------------------------------------------------------------------------------------------------------1.001.00 4545 9090 SurplusSurplus FallFall
0.900.90 5050 8080 SuplusSuplus FallFall
0.800.80 5555 7070 SuplusSuplus FallFall0.800.80 5555 7070 SuplusSuplus FallFall
0.700.70 6060 6060 NeitherNeither SAMESAME
0.600.60 6565 5050 ShortageShortage RiseRise
0.500.50 7070 4040 ShortageShortage RiseRise
0.400.40 7575 3030 ShortageShortage RiseRise

Price 1.00 A 0.90 B 0.80 C 0.70 D 0.60 E 0.50 F 0.40 G 0 30 40 50 60 70 80 90 Quantity

Demand in Product/Output MarketsDemand in Product/Output Markets
shiftshift ofof aa demanddemand curvecurve TheThe changechange thatthat takestakes placeplace inin aademanddemand curvecurve correspondingcorresponding toto aa newnew relationshiprelationship betweenbetweenquantityquantity demandeddemanded ofof aa goodgood andand priceprice ofof thatthat goodgood.. TheTheshiftshift isis broughtbrought aboutabout byby aa changechange inin thethe originaloriginal conditionsconditions..
movementmovement alongalong aa demanddemand curvecurve TheThe changechange inin quantityquantitydemandeddemanded broughtbrought aboutabout byby aa changechange inin priceprice..
Shift of Demand versus Movement Along a Demand CurveShift of Demand versus Movement Along a Demand Curve
24 of 49
demandeddemanded broughtbrought aboutabout byby aa changechange inin priceprice..
Change in price of a good or service leads toChange in price of a good or service leads toChange in Change in quantity demandedquantity demanded ((movement movement
along the demand curvealong the demand curve).).
Change in income, preferences, or prices of other Change in income, preferences, or prices of other goods or services leads togoods or services leads to
Change in Change in demand demand ((shift of the demand shift of the demand curvecurve).).

Shifts Of The Demand Curve
• Consumer Incomes : If average incomes increase, consumers may purchase more of
many goods. many goods.
Increases in income normally shift demand curves outward to the right.

D1 Price 1.00 A S 0.90 B D2 0.80 C 0.70 D 0.60 E 0.50 F D1 0.40 G D2 0 30 40 50 60 70 80 90 Quantity

Any factor that causes the demand curve to shift outward to the right or inward to the left does
not affect the supply curve, will raise the equilibrium price and the equilibrium quantityequilibrium price and the equilibrium quantity

•Population : Population growth should affect quantity demanded in more or less the same
way as increases in average incomes
• Consumer Prefences : A successfull advertising campaign etc....

•• Prices and Availability of related goods: Prices and Availability of related goods: Increases in the prices of goods that are Increases in the prices of goods that are
substitutes ( Soda/milk ) move the demand substitutes ( Soda/milk ) move the demand curve to the right, curve to the right,
Increses in the prices of goods that are normally Increses in the prices of goods that are normally used together with ( tea/sugar) shift the demand used together with ( tea/sugar) shift the demand
curve to the left.curve to the left.

As with demand, it is very important to distinguish As with demand, it is very important to distinguish between between movements alongmovements along supply curves (changes supply curves (changes in quantity supplied) and in quantity supplied) and shiftsshifts in supply curves in supply curves
(changes in supply):(changes in supply):
Supply in Product/Output MarketsSupply in Product/Output Markets
Shift of Supply versus Movement Along a Supply CurveShift of Supply versus Movement Along a Supply Curve
30 of 49
Change in price of a good or service leads toChange in price of a good or service leads toChange in Change in quantity suppliedquantity supplied ((movement movement
along a supply curvealong a supply curve).).
Change in income, preferences, or prices of other Change in income, preferences, or prices of other goods or services leads togoods or services leads to
Change in Change in supply supply ((shift of a supply curveshift of a supply curve).).

Shifts Of Supply Curve
• Size of Industry : For example if more milk producers enter the milk industry, the quantity
supplied at any given price probably will supplied at any given price probably will increase.
Any factor that shifts the supply curve outward to the right or inward to the left does not affect
the demand curve.

S1 Price 1.00 A 0.90 B 0.80 C S2 0.70 D 0.60 S1 E 0.50 F 0.40 G S2 0 30 40 50 60 70 80 90 Quantity

• Technological Progress : Cost-reducing technological progress shifts the supply curve
outward to the right
• Prices of Inputs : Increases in the prices of inputs that suppliers must buy will shift the inputs that suppliers must buy will shift the
supply curve inward to the left.
• Prices of Related Outputs : A change in the price of one good produced by a multiproduct industry may be expected to shift the supply
curves of all the other goods produced by that industry