chapter 3 demand for health care services. outline introduction of health insurance theoretical...
TRANSCRIPT

Chapter 3Demand for Health Care
Services
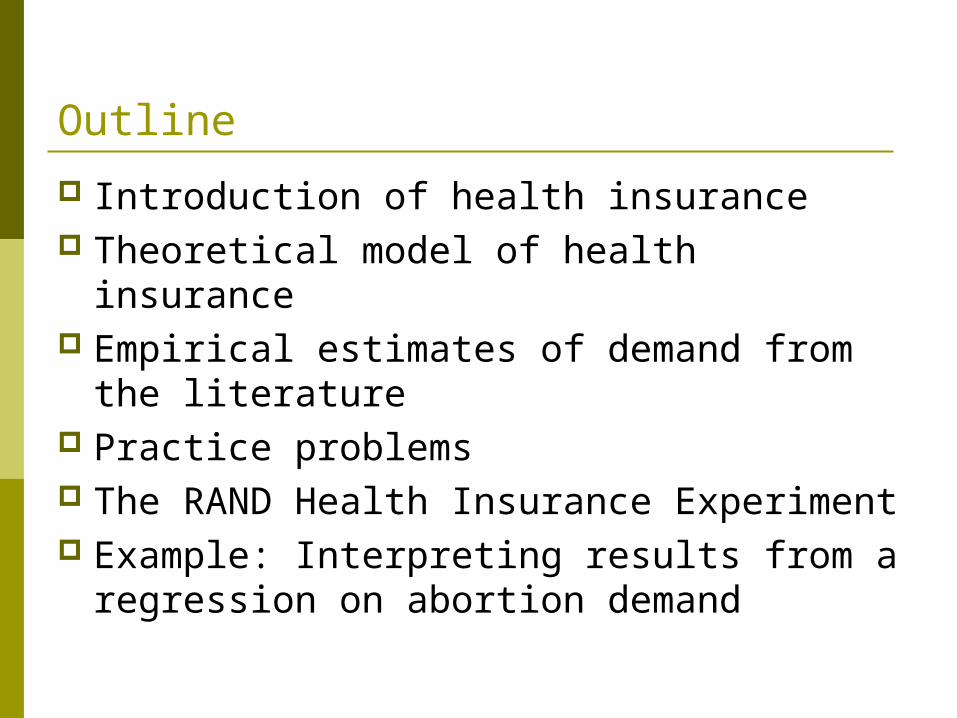
Outline
Introduction of health insurance Theoretical model of health insurance Empirical estimates of demand from the
literature Practice problems The RAND Health Insurance Experiment Example: Interpreting results from a
regression on abortion demand

Why Health Insurance?
Medical expenditure is extreme volatile 1% use 25% exp 5% use 50% exp 20% use 75% exp
Difficult to self-insured because some people are sicker than others
Health insurance is relatively new (at the end of 19th century) since treatment was not very effective before


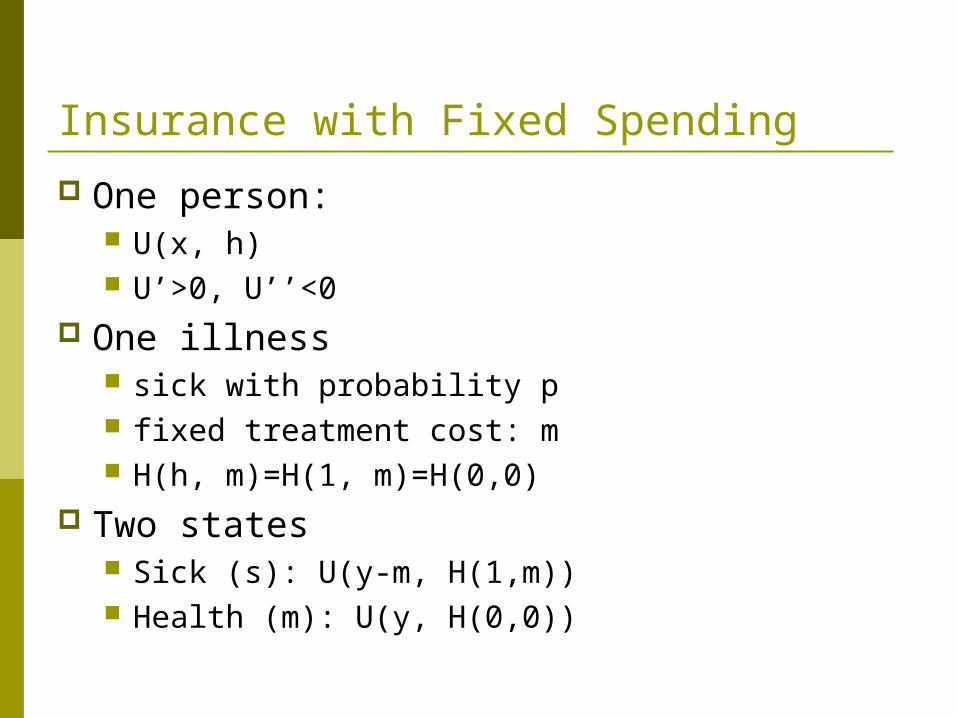
Insurance with Fixed Spending
One person: U(x, h) U’>0, U’’<0
One illness sick with probability p fixed treatment cost: m H(h, m)=H(1, m)=H(0,0)
Two states Sick (s): U(y-m, H(1,m)) Health (m): U(y, H(0,0))

Without insurance
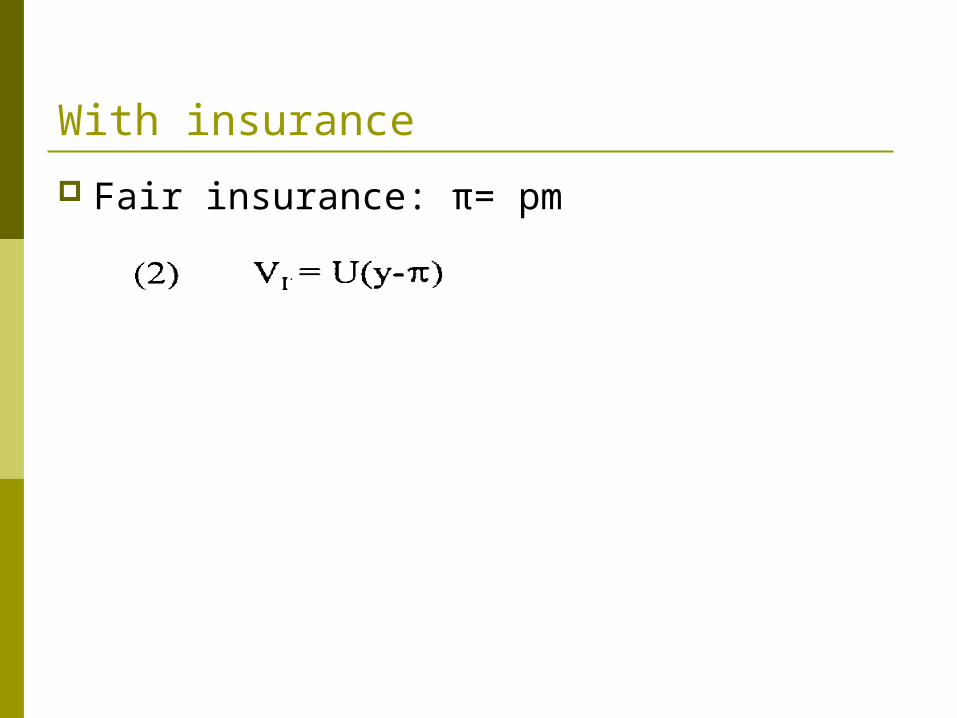
With insurance
Fair insurance: π= pm
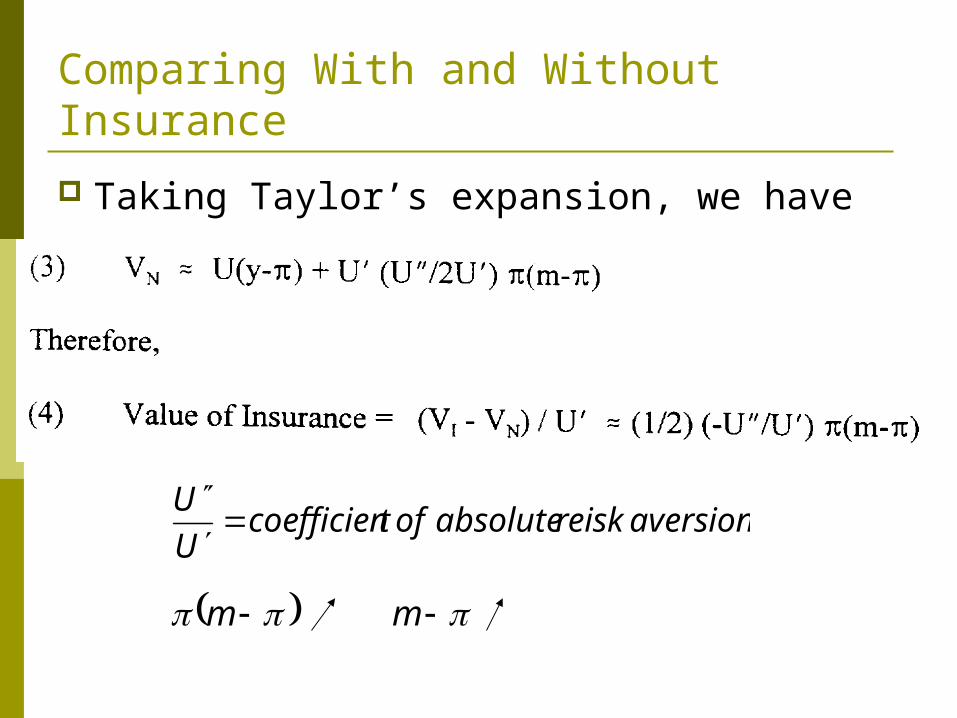
Comparing With and Without Insurance
Taking Taylor’s expansion, we have
aversionreiskabsoluteoftcoefficienU
U
mm


The insurance plan specifies the amount of money transferred to the bad state

Problem with Fixed Spending
Complete information All the sicknesses known All the treatment known No wasted resources in the policy
The insurance specifies the amount of money being transferred during the sickness (contingency plan)
The policy completely insures the health, but s it possible to insure someone’s health?

Estimating Demand for Medical Care
Quantity demanded = f( … ) out-of-pocket price real income time costs prices of substitutes and complements tastes and preferences profile state of health quality of care
Empirical Evidence
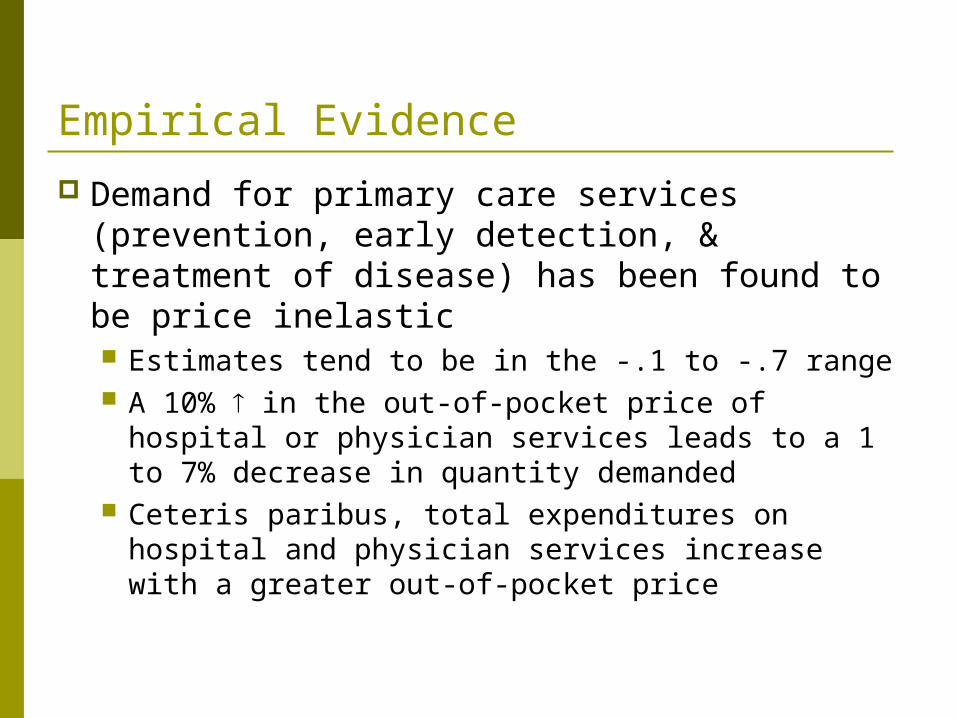
Demand for primary care services (prevention, early detection, & treatment of disease) has been found to be price inelastic Estimates tend to be in the -.1 to -.7 range A 10% in the out-of-pocket price of hospital
or physician services leads to a 1 to 7% decrease in quantity demanded
Ceteris paribus, total expenditures on hospital and physician services increase with a greater out-of-pocket price
Empirical Evidence (cont.)
Demand for other types of medical care is slightly more price elastic than demand for primary care
Consumers should be more price sensitive as the portion of the bill paid out of pocket increases

Out-of-Pocket Payments in the U.S.
Hypothesis: Consumers are more price sensitive if they pay a larger % of the health care bill
The fall in the % of out-of-pocket payments may explain the rapid rise in health care costs
1970 1980 2000 2007National health expenditures ($b) $74.9 $253.4 $1,353.2 $2,241.2% out of pocket 33.2% 22.9% 14.2% 12.0%
Out-of-Pocket Payments in the U.S.
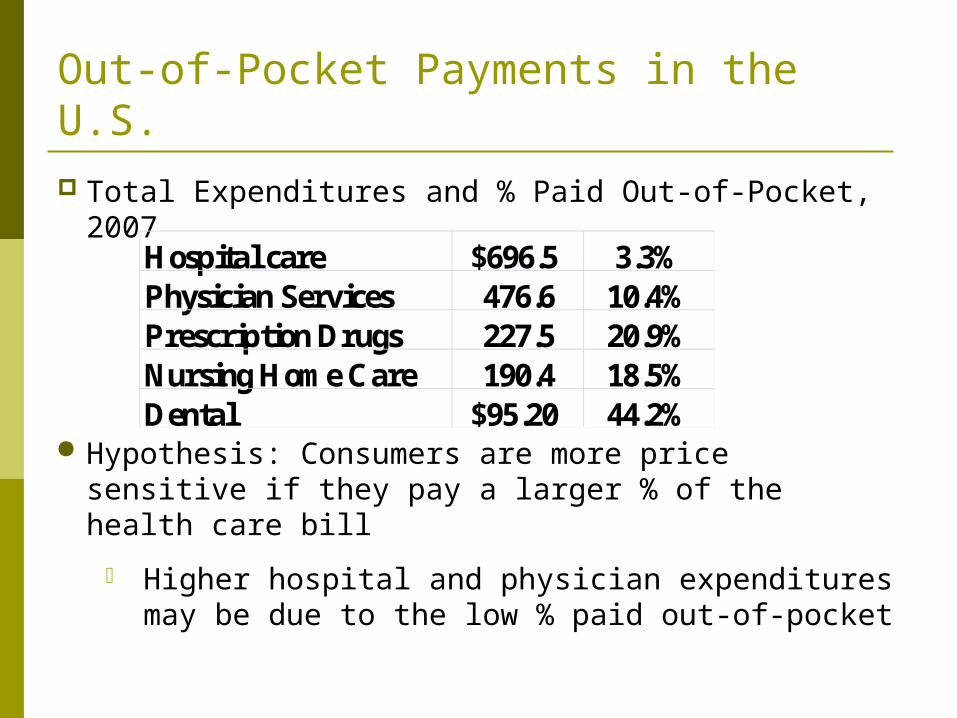
Total Expenditures and % Paid Out-of-Pocket, 2007
Hypothesis: Consumers are more price sensitive if they pay a larger % of the health care bill
Higher hospital and physician expenditures may be due to the low % paid out-of-pocket
Hospital care $696.5 3.3%Physician Services 476.6 10.4%Prescription Drugs 227.5 20.9%Nursing Home Care 190.4 18.5%Dental $95.20 44.2%
Out-of-Pocket Payments in the U.S. (cont.)
The previous 2 slides argue that: insurance coverage expenditures
But it may be the opposite: expenditures insurance coverage.
We cannot identify a causal effect using just this data

Empirical Evidence (cont.)
Studies which have examined price and quantity variation within service types have found that: The price elasticity of demand for dental
services for females is -.5 to -.7 The own-price elasticity of demand for nursing
home services is between -.73 and -2.4

Empirical Evidence (cont.)
At the individual level, the income elasticity of demand for medical services is below +1.0
The travel time elasticity of demand is almost as large as the own-price elasticity of demand
Little consensus on whether hospital care and ambulatory physician services are substitutes or complements
International Estimates of Income Elasticity
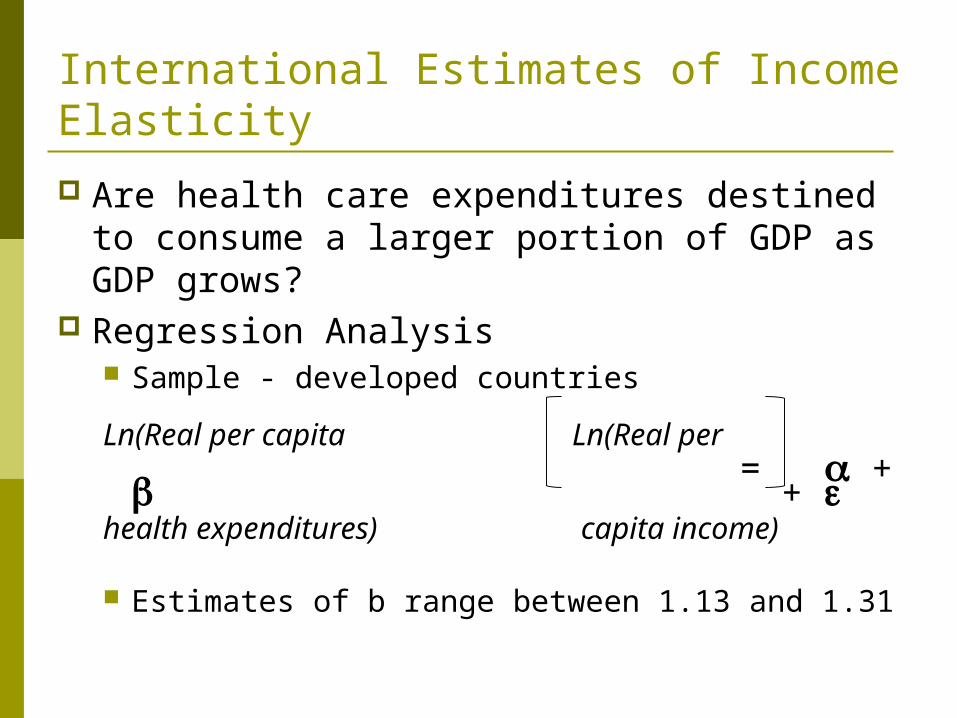
Are health care expenditures destined to consume a larger portion of GDP as GDP grows?
Regression Analysis Sample - developed countries
Ln(Real per capita Ln(Real per = +
+ health expenditures) capita income)
Estimates of b range between 1.13 and 1.31

Applying Demand Theory to Real Data
Demand analyses in health care must take insurance into account
Demand analyses are critical in shaping managerial and public policy decisions

The Rand Health Insurance Experiment (HIE) Research issues:
How does cost sharing affect demand for personal health care services?
How does cost sharing affect demand for particular services, e.g., hospital care, dental services?
Does use of personal health care services improve health?
How does a change from fee-for-service payment to capitation affect demand for personal health care services?
Rationale for studying HIE 30+ years after HIE completed

The Rand Health Insurance Experiment
A large, social science experiment to study individuals’ medical care under insurance
A large sample of families were provided differing levels of health insurance coverage Researchers then studied their subsequent
health care use
The Sample
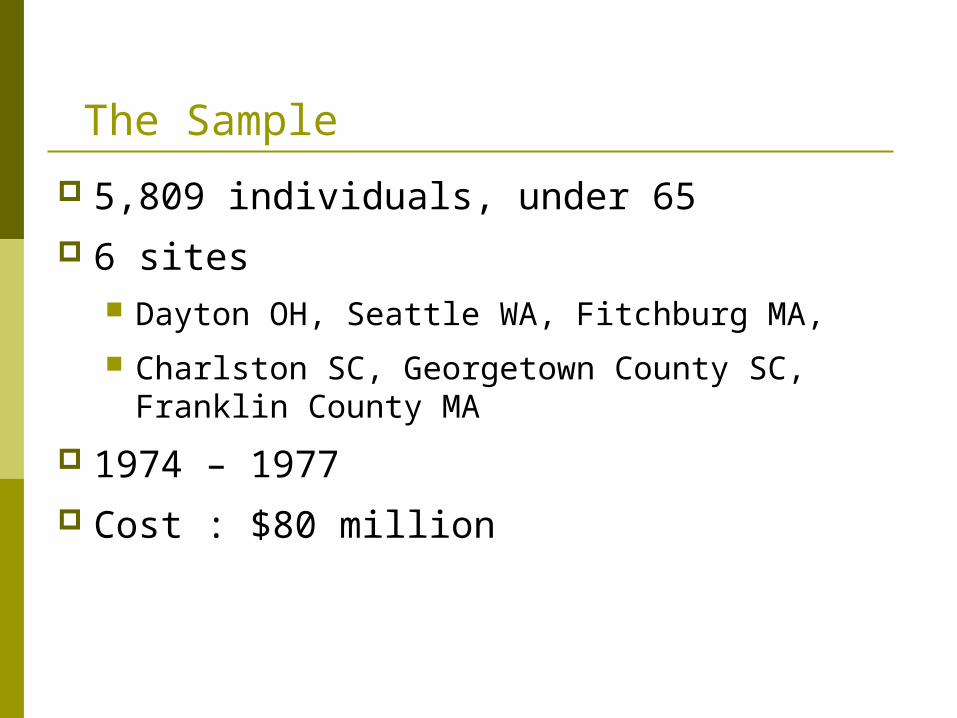
5,809 individuals, under 65 6 sites
Dayton OH, Seattle WA, Fitchburg MA,
Charlston SC, Georgetown County SC, Franklin County MA
1974 – 1977 Cost : $80 million

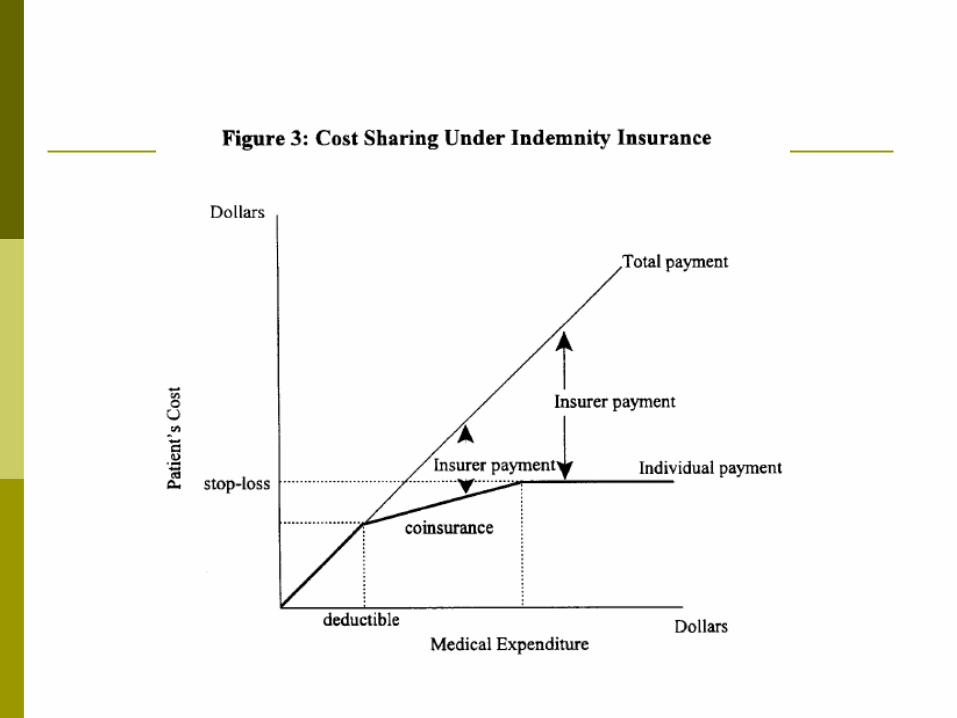
Insurance Plans in the Experiment
Families randomly assigned to 1 of 14 insurance plans differing in cost sharing rates and in maximum dollar expenditures per year (MDE or stop loss)
Free fee-for-service (FFS).- i.e., no coinsurance
25% copayment per physician visit 50% copayment per physician visit 95% copayment per physician visit
Insurance Plans in the Experiment
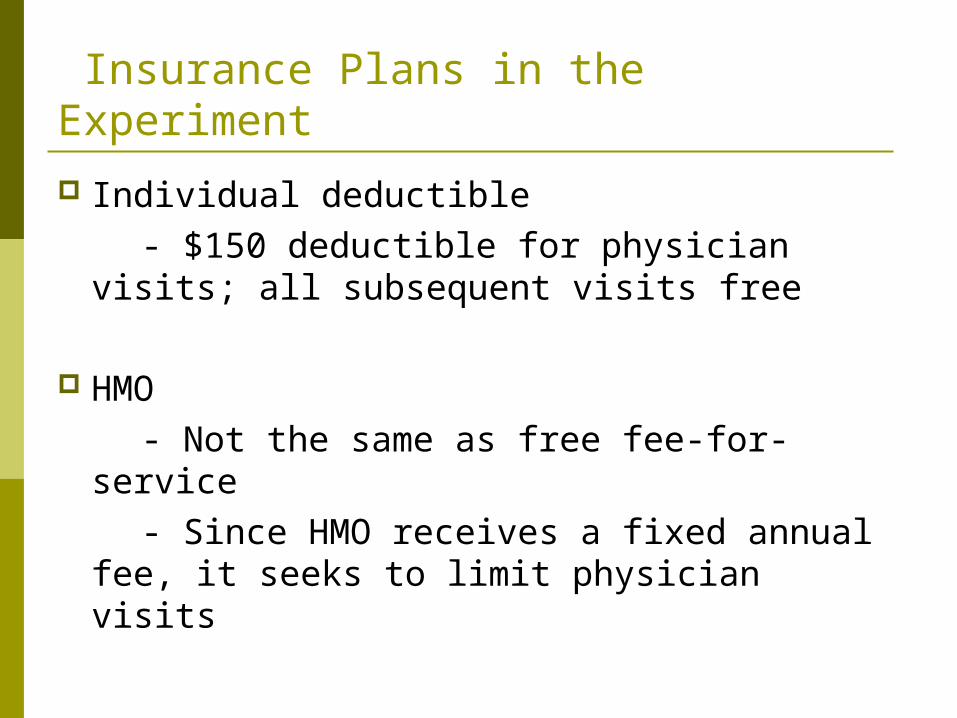
Individual deductible - $150 deductible for physician visits; all
subsequent visits free
HMO - Not the same as free fee-for-service - Since HMO receives a fixed annual fee,
it seeks to limit physician visits
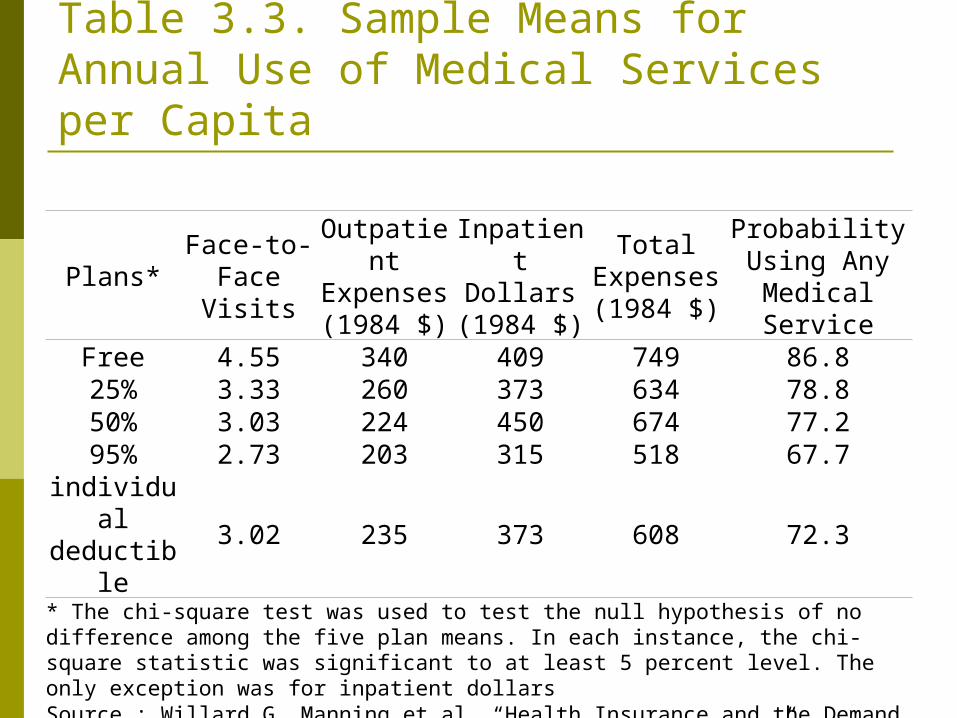
Table 3.3. Sample Means for Annual Use of Medical Services per Capita
Plans*Face-to-
Face Visits
Outpatient Expenses(1984 $)
Inpatient Dollars(1984 $)
Total Expenses(1984 $)
Probability Using Any
Medical ServiceFree 4.55 340 409 749 86.825% 3.33 260 373 634 78.850% 3.03 224 450 674 77.295% 2.73 203 315 518 67.7
individual deductible
3.02 235 373 608 72.3
* The chi-square test was used to test the null hypothesis of no difference among the five plan means. In each instance, the chi-square statistic was significant to at least 5 percent level. The only exception was for inpatient dollarsSource : Willard G. Manning et al. “Health Insurance and the Demand for Medical Care : Evidence from a Randomized Experiment,” American Economic Review 77 (June 1987), Table 2

Results (cont.)
No statistically significant difference in inpatient (hospital) expenses by insurance type Does NOT necessarily imply inelastic demand for
hospital services Experiment included $1,000 cap on out-of-pocket
medical expenses; 70% of hospital admissions costs $1,000 +
As coinsurance ↑‘s, probability of ANY use ↓‘s


Results (cont.)
As consumers’ copayments drop, demand for medical care becomes more price inelastic The data confirms the theory
Own Price Elasticity of Demand All Care Outpatient Care
Copay 0-25% -0.10 -0.13 Copay 25-95% -0.14 -0.21

Results (cont.)
Free fee-for-service (FFS) versus HMO coverage No difference in physician visits found But only 7.1% of HMO patients admitted to
hospital, versus 11.2% of FFS patients HMO patients cost 30% less than FFS
patients on average HMO’s do save money relative to FFS

Health Implications
The experiment verifies that ↑coinsurance → ↓demand for medical care
What are the implications for health outcomes? i.e restraining medical care expenditures is
not the only objective we care about, especially for the poor

Health Implications (cont.)
Poor adults (lowest 20% of income distribution) with high blood pressure experienced clinically significant improvement under free FFS plan, but not in cost sharing plan Similar findings for myopia, dental health Free FFS only improves health outcomes in 3
specific cases versus cost-sharing If want to restrain costs and maintain health,
targeted programs at these 3 health problems is more cost-effective than free care for all services

Was it worth it?
Rand Health Insurance Experiment cost $80 million
Initial results published in 1981 In the next 2 years, # of insurance companies with
first-dollar coinsurance for hospital care increased from 30% to 63%
# of insurance companies w/ annual deductible of $200 + per person ‘d from 4% to 21%
Estimated cost saving from ‘d demand for medical care = $7 billion
Government sponsored studies often yield important knowledge for business

Conclusions
Our economic model of demand provides hypotheses that we can test with real data
Although it is difficult to measure the quantity of medical services demanded and economic variables, both price and income effects are important determinants of the demand for medical care