chapter 3: daily breathing rates - oehha · pdf filetechnical support document for exposure...
TRANSCRIPT

Technical Support Document for Exposure Assessment and Stochastic Analysis, FINAL, August, 2012
3-1
3 Daily Breathing Rates 3.1 Introduction
This chapter presents age-specific breathing rates for use in health risk assessments for short-term exposure to maximum 1-hour facility emissions and for long-term daily average exposures resulting from continuous or repeated 8-hour exposure. The specified age ranges of interest in the “Hot Spots” program are ages third trimester, 0<2, 2<9, 2<16, 16<30 and 16-70 years.
The term ventilation rate has been frequently used for the metric of volume of air inhaled per minute (i.e., mL/min) and is used in this document to describe short-term, one hour exposures. For convenience, the term “breathing rate” is applied throughout this chapter for chronic daily exposure, both to the metric of volume of air inhaled per day (L/day) and the volume of air inhaled per kg body weight per day (L/kg-day). The normalized daily breathing rate in L/kg-day is the preferred metric for use in the “Hot Spots” program. The term “respiratory rate” is not used in this chapter interchangeably with “breathing rate” because respiratory rate usually represents the number of breaths taken per unit time, and not the volume of air taken in per unit time.
The 8-hour breathing rates were developed for specialized exposure scenarios that involve exposures only during facility operations of about 8-12 hours/day. Eight-hour breathing rates reflect exposures to off-site workers or exposures that may occur in schools when class is in session. Ventilation rates for 1-hour exposure were developed to meet the SB-352 mandate for school districts to conduct a risk assessment at school sites located within 100 meters of a freeway or busy roadway. These ventilation rates were developed for exposures to 1-hour maximum facility emissions that may occur during passive activities such as sitting at a desk during class instruction or during higher intensity activities such as play during recess.
OEHHA recommends the breathing rates presented in Section 3.2. Various published methods for deriving daily breathing rates and their advantages and limitations are discussed in Sections 3.3 to 3.7. Where possible, the breathing rates from these reports were re-evaluated to correspond with the five specific age groups used in OEHHA’s risk assessment guidelines.
At elevations above 5000 feet, the ventilation rate will increase due to lower air pressure (NOLS, 2012). The respiratory rate at this elevation peaks at one week and then slowly decreases over the next few months, although it tends to remain higher than its normal rate at sea level. There have been a few facilities located at 5000 feet or higher that have been required to produce a Hot Spots risk assessment. However, long-term residents at high altitude will have breathing rates near what is found in residents at sea level. OEHHA does not anticipate any adjustments will be needed to the breathing rates at higher altitudes in California, although the Districts should consider this issue and adjust if needed for very high altitude facilities.

Technical Support Document for Exposure Assessment and Stochastic Analysis, FINAL, August, 2012
3-2
3.2 Breathing Rate Recommendations
3.2.1 Long-Term Breathing Rates
The recommended long-term daily breathing rate point estimates in Table 3.1 are based on a mean of two different methods used to determine daily breathing rates, the doubly labeled water method and an energy intake approach based on food consumption data from the Continuing Survey of Food Intake of Individuals (CSFII) (See Section 3.5.5). These methods are described in detail below. The recommended distributions for stochastic analysis are presented in Tables 3.2a-b. The breathing rates normalized to body weight are expressed in L/kg-day, and the non-body weight-normalized breathing rates are expressed in m3/day. All values were rounded to two or three significant figures.
Table 3.1. Recommended Point Estimates for Long-Term Daily Breathing Rates
3rd Trimester
0<2 years
2<9 years
2<16 years
16<30 years
16<70 years
L/kg-day Mean 225 658 535 452 210 185 95th Percentile
361 1090 861 745 335 290
m3/day Mean 15.3 6.2 10.7 13.3 15.0 13.9 95th Percentile
23.4 11.2 16.4 22.6 23.5 22.9
OEHHA calculated mean and high end breathing rates for the third trimester assuming the dose to the fetus during the third trimester was the same as that to the mother.

Technical Support Document for Exposure Assessment and Stochastic Analysis, FINAL, August, 2012
3-3
TABLE 3.2a. Recommended Breathing Rate Distributions (L/kg-day) by Age Group for Stochastic Analysis
3rd Trimester
0<2 years
2<9 years
2<16 years
16<30 years
16-70 years
Distribution Max extreme
Max extreme
Max extreme
Log-normal
Logistic Logistic
Minimum 78 196 156 57 40 13 Maximum 491 2,584 1,713 1,692 635 860 Scale 59.31 568.09 125.59 40.92 36.19 Likeliest 191.50 152.12 462.61 Location -144.06 Mean 225 658 535 452 210 185 Std Dev 72 217 168 172 75 67 Skewness 0.83 2.01 1.64 1.11 0.83 1.32 Kurtosis 3.68 10.61 7.88 6.02 5.17 10.83 Percentiles 5% 127 416 328 216 96 86 10% 142 454 367 259 118 104 25% 179 525 427 331 161 141 50% 212 618 504 432 207 181 75% 260 723 602 545 252 222 80% 273 758 631 572 261 233 90% 333 934 732 659 307 262 95% 361 1090 861 745 335 290 99% 412 1430 1,140 996 432 361
Technical Support Document for Exposure Assessment and Stochastic Analysis, FINAL, August, 2012
3-4
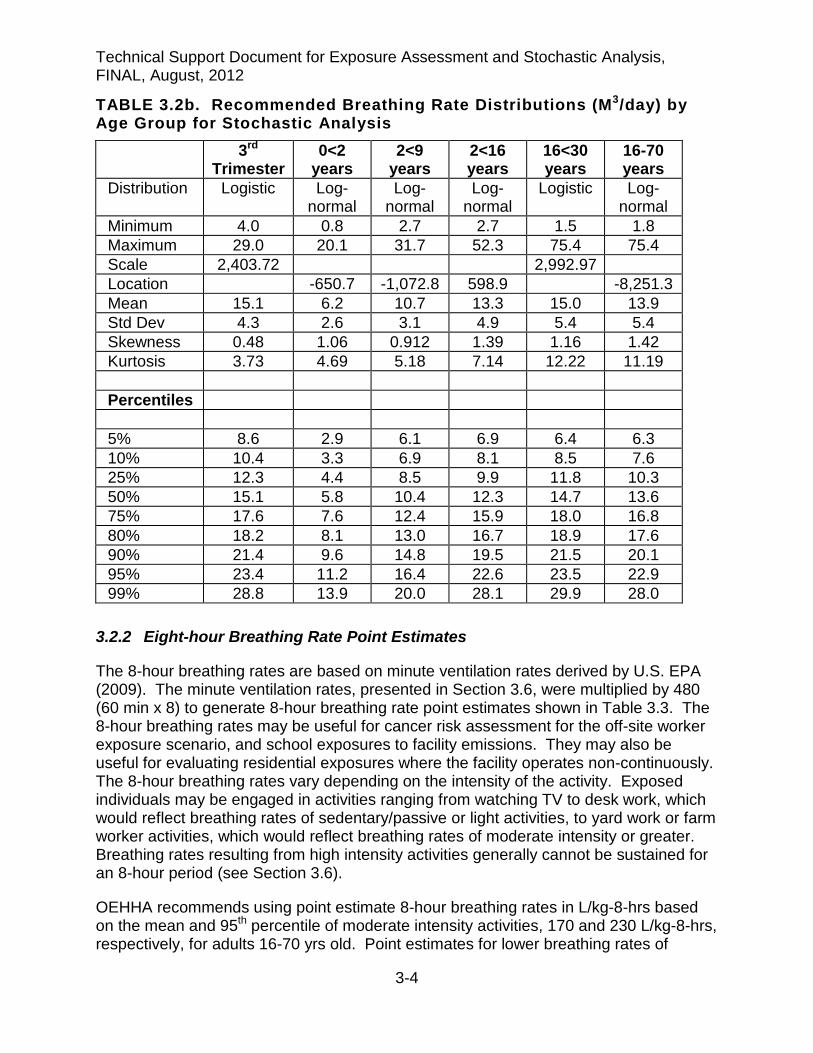
TABLE 3.2b. Recommended Breathing Rate Distributions (M3/day) by Age Group for Stochastic Analysis
3rd Trimester
0<2 years
2<9 years
2<16 years
16<30 years
16-70 years
Distribution Logistic Log-normal
Log-normal
Log-normal
Logistic Log-normal
Minimum 4.0 0.8 2.7 2.7 1.5 1.8 Maximum 29.0 20.1 31.7 52.3 75.4 75.4 Scale 2,403.72 2,992.97 Location -650.7 -1,072.8 598.9 -8,251.3 Mean 15.1 6.2 10.7 13.3 15.0 13.9 Std Dev 4.3 2.6 3.1 4.9 5.4 5.4 Skewness 0.48 1.06 0.912 1.39 1.16 1.42 Kurtosis 3.73 4.69 5.18 7.14 12.22 11.19 Percentiles 5% 8.6 2.9 6.1 6.9 6.4 6.3 10% 10.4 3.3 6.9 8.1 8.5 7.6 25% 12.3 4.4 8.5 9.9 11.8 10.3 50% 15.1 5.8 10.4 12.3 14.7 13.6 75% 17.6 7.6 12.4 15.9 18.0 16.8 80% 18.2 8.1 13.0 16.7 18.9 17.6 90% 21.4 9.6 14.8 19.5 21.5 20.1 95% 23.4 11.2 16.4 22.6 23.5 22.9 99% 28.8 13.9 20.0 28.1 29.9 28.0
3.2.2 Eight-hour Breathing Rate Point Estimates
The 8-hour breathing rates are based on minute ventilation rates derived by U.S. EPA (2009). The minute ventilation rates, presented in Section 3.6, were multiplied by 480 (60 min x 8) to generate 8-hour breathing rate point estimates shown in Table 3.3. The 8-hour breathing rates may be useful for cancer risk assessment for the off-site worker exposure scenario, and school exposures to facility emissions. They may also be useful for evaluating residential exposures where the facility operates non-continuously. The 8-hour breathing rates vary depending on the intensity of the activity. Exposed individuals may be engaged in activities ranging from watching TV to desk work, which would reflect breathing rates of sedentary/passive or light activities, to yard work or farm worker activities, which would reflect breathing rates of moderate intensity or greater. Breathing rates resulting from high intensity activities generally cannot be sustained for an 8-hour period (see Section 3.6).
OEHHA recommends using point estimate 8-hour breathing rates in L/kg-8-hrs based on the mean and 95th percentile of moderate intensity activities, 170 and 230 L/kg-8-hrs, respectively, for adults 16-70 yrs old. Point estimates for lower breathing rates of

Technical Support Document for Exposure Assessment and Stochastic Analysis, FINAL, August, 2012
3-5
sedentary/passive and light intensity work activities may be used in site-specific scenarios (i.e., work in which activity is limited to desk jobs or similar work). Pregnant women will generally participate in lower intensity activities than non-pregnant women, but as shown in Tables 3.1 and 3.2, breathing rate normalized to body weight will be slightly greater than breathing rates of adult men and non-pregnant women combined. OEHHA recommends using the mean and 95th percentile 8-hour breathing rates based on moderate intensity activity of 16<30 year-olds for third trimester women.
Table 3.3a. Eight Hour Breathing Rate (L/kg-8 Hr) Point Estimates for Males and Females Combined
0<2 years 2<9 years 2<16 years
16<30 years
16-70 years
Sedentary & Passive Activities (METS < 1.5) Mean 200 100 80 30 30 95th Percentile 250 140 120 40 40 Light Intensity Activities (1.5 < METs < 3.0) Mean 490 250 200 80 80 95th Percentile 600 340 270 100 100 Moderate Intensity Activities (3.0 < METs < 6.0) Mean 890 470 380 170 170 95th Percentile 1200 640 520 240 230
Table 3.3b. Eight-Hour Breathing Rate (M3/8-Hr) Point Estimates for Males and females Combined
0<2 years 2<9 years 2<16 years
16<30 years
16-70 years
Sedentary & Passive Activities (METS < 1.5) Mean 1.86 2.24 2.37 2.33 2.53 95th Percentile 2.69 2.99 3.20 3.23 3.34 Light Intensity Activities (1.5 < METs < 3.0) Mean 4.61 5.44 5.66 5.72 6.03 95th Percentile 6.51 7.10 7.52 7.75 7.80 Moderate Intensity Activities (3.0 < METs < 6.0) Mean 8.50 10.20 10.84 12.52 12.94 95th Percentile 12.36 13.47 14.52 18.08 18.07
3.2.3 Short-term (1-Hour) Ventilation Rate Point Estimates
One-hour ventilation rates (Tables 3.4a-b) were calculated from U.S. EPA (2009) minute ventilation rates (e.g., minute ventilation rate x 60) to meet the SB-352 mandate for school districts to conduct a risk assessment for school sites located within 100 M of a freeway or busy roadway. These ventilation rates allow assessment of exposures to facility emissions during the course of the school day.

Technical Support Document for Exposure Assessment and Stochastic Analysis, FINAL, August, 2012
3-6
The age groups for children mostly deviate from those child age groupings designed for AB2588. The age groups attempt to address specific school categories (e.g., kindergarten, grade school, high school) under SB-352. However, if 1-hr ventilation rates are required that fit the AB2588 age groups, 1-hr ventilation rates can be calculated from the 8-hr breathing rates shown in Tables 3.28a-b.
Table 3.4a. One-Hour Breathing Rates for SB352 School Sites in L/kg-60 min (Males and Females Combined)
0<2 Years
2<6 years
6<11 years
11<16 years
16-70 years
Sedentary & Passive Activities (METS < 1.5) Mean 25 17 10 6 4 95th Percentile 31 23 14 8 5 Light Intensity Activities (1.5 < METS < 3.0) Mean 61 41 23 14 10 95th Percentile 75 54 32 19 13 Moderate Intensity Activities (3.0 < METS < 6.0) Mean 110 76 44 28 21 95th Percentile 140 100 62 39 29 High Intensity Activities (METS ≥ 6.0) Mean - 140 82 55 38 95th Percentile - 190 110 80 56
Table 3.4b. One-Hour Breathing Rates for SB352 School Sites in M3/60 min (Males and Females Combined)
0<2 Years
2<6 years
6<11 years
11<16 years
16-70 years
Sedentary & Passive Activities (METS < 1.5) Mean 0.23 0.27 0.29 0.33 0.32 95th Percentile 0.34 0.36 0.39 0.45 0.42 Light Intensity Activities (1.5 < METS < 3.0) Mean 0.58 0.68 0.68 0.76 0.75 95th Percentile 0.81 0.86 0.91 1.03 0.97 Moderate Intensity Activities (3.0 < METS < 6.0) Mean 1.06 1.25 1.30 1.50 1.62 95th Percentile 1.54 1.63 1.73 2.05 2.26 High Intensity Activities (METS ≥ 6.0) Mean - 2.24 2.49 2.92 3.01 95th Percentile - 2.98 3.51 4.18 4.39
For children at school, MET activity levels equivalent to sitting at a desk during instruction and outside at play can be used as guidance for determining 1-hour breathing rates. As shown in Table 3.26 below, sitting was assigned a MET of 1.5, while play outdoors, recess and physical education had mean MET values in the range

Technical Support Document for Exposure Assessment and Stochastic Analysis, FINAL, August, 2012
3-7
of 4.5 to 5.0 (U.S. EPA, 2009). Thus, 1-hour breathing rates based on sedentary/passive or light activities to represent activities within the class room and moderate intensity activities to represent activities during recess and some physical education classes, are recommended.
U. S. EPA (2009) also determined ventilation rates for high intensity activities with MET values > 6.0. The distributions generated by U.S. EPA for hrs/day spent at MET values ≥6.0 for infants (age 0<2 yrs) suggests that this level of activity is unlikely for this age group. However, there is a subgroup of children in the older child age groups that exercise at this level for at least one hr/day, although this level of activity may not happen all in one hour’s time. OEHHA recommends using 1-hr high intensity ventilatory rates for after-school sports and training that require high energy output such as track, football, tennis etc. This MET category may also be used for demanding sports during physical education classes.
3.3 Estimation of Daily Breathing Rates
3.3.1 Inhalation Dose and Cancer Risk
The approach to estimating cancer risk from long-term inhalation exposure to carcinogens requires calculating a range of potential doses and multiplying by cancer potency factors in units of inverse dose to obtain a range of cancer risks. This range reflects variability in exposure rather than in the dose-response. In equation 3-1, the daily breathing rate (L/kg BW-day) is the variate which is varied for each age group.
The general algorithm for estimating dose via the inhalation route is as follows:
DOSEair = Cair × [BR/BW] × A × EF × (1 x 10⁻⁶) (Eq. 3-1)
where: DOSEair = dose by inhalation (mg/kg BW-day) Cair = concentration in air (µg/m3) [BR/BW] = daily breathing rate normalized to body weight (L/kg BW-day) A = inhalation absorption factor, if applicable (default = 1) EF = exposure frequency (days/365 days) 1 x 10-6 = conversion factors (µg to mg, L to m3)
The inhalation absorption factor (A) is a unitless factor that is only used if the cancer potency factor itself includes a correction for absorption across the lung. It is inappropriate to adjust a dose for absorption if the cancer potency factor is based on applied rather than absorbed dose. The exposure frequency (EF) is set at 350 days per year (i.e., per 365 days) to allow for a two week period away from home each year.(US EPA, (1991). Another factor may come into consideration in the inhalation dose equation, the fraction of time at home (FAH). See Chapter 11 for more details. For cancer risk, the risk is calculated for each age group using the appropriate age sensitivity factors (ASFs) and the chemical-specific cancer potency factor (CPF), expressed in units of (mg/kg-day)-1.
Technical Support Document for Exposure Assessment and Stochastic Analysis, FINAL, August, 2012
3-8
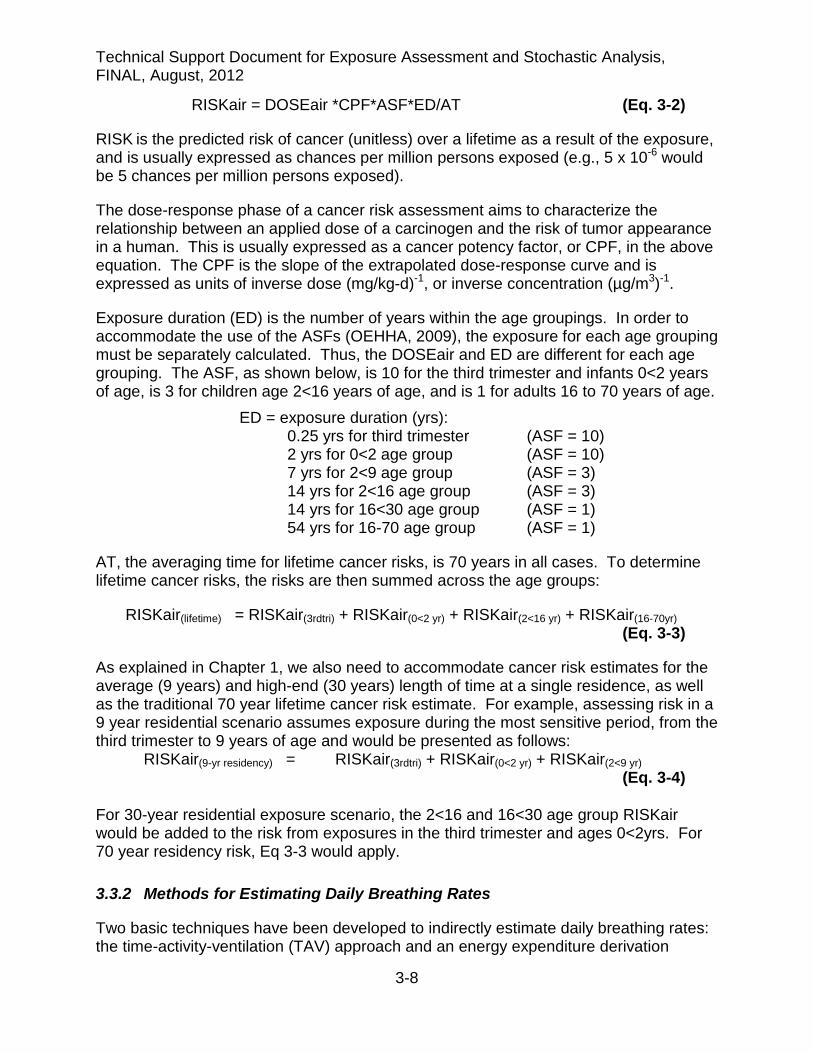
RISKair = DOSEair *CPF*ASF*ED/AT (Eq. 3-2)
RISK is the predicted risk of cancer (unitless) over a lifetime as a result of the exposure, and is usually expressed as chances per million persons exposed (e.g., 5 x 10⁻⁶ would be 5 chances per million persons exposed).
The dose-response phase of a cancer risk assessment aims to characterize the relationship between an applied dose of a carcinogen and the risk of tumor appearance in a human. This is usually expressed as a cancer potency factor, or CPF, in the above equation. The CPF is the slope of the extrapolated dose-response curve and is expressed as units of inverse dose (mg/kg-d)-1, or inverse concentration (µg/m3)-1.
Exposure duration (ED) is the number of years within the age groupings. In order to accommodate the use of the ASFs (OEHHA, 2009), the exposure for each age grouping must be separately calculated. Thus, the DOSEair and ED are different for each age grouping. The ASF, as shown below, is 10 for the third trimester and infants 0<2 years of age, is 3 for children age 2<16 years of age, and is 1 for adults 16 to 70 years of age. ED = exposure duration (yrs): 0.25 yrs for third trimester (ASF = 10) 2 yrs for 0<2 age group (ASF = 10) 7 yrs for 2<9 age group (ASF = 3) 14 yrs for 2<16 age group (ASF = 3) 14 yrs for 16<30 age group (ASF = 1) 54 yrs for 16-70 age group (ASF = 1)
AT, the averaging time for lifetime cancer risks, is 70 years in all cases. To determine lifetime cancer risks, the risks are then summed across the age groups:
RISKair(lifetime) = RISKair(3rdtri) + RISKair(0<2 yr) + RISKair(2<16 yr) + RISKair(16-70yr) (Eq. 3-3)
As explained in Chapter 1, we also need to accommodate cancer risk estimates for the average (9 years) and high-end (30 years) length of time at a single residence, as well as the traditional 70 year lifetime cancer risk estimate. For example, assessing risk in a 9 year residential scenario assumes exposure during the most sensitive period, from the third trimester to 9 years of age and would be presented as follows:
RISKair(9-yr residency) = RISKair(3rdtri) + RISKair(0<2 yr) + RISKair(2<9 yr) (Eq. 3-4)
For 30-year residential exposure scenario, the 2<16 and 16<30 age group RISKair would be added to the risk from exposures in the third trimester and ages 0<2yrs. For 70 year residency risk, Eq 3-3 would apply.
3.3.2 Methods for Estimating Daily Breathing Rates
Two basic techniques have been developed to indirectly estimate daily breathing rates: the time-activity-ventilation (TAV) approach and an energy expenditure derivation

Technical Support Document for Exposure Assessment and Stochastic Analysis, FINAL, August, 2012
3-9
method. Ideally, daily breathing rates would be directly measured. However, the equipment for direct measurement is bulky and obtrusive and thus impractical for measuring breathing rates over an entire 24-hour period, especially on children performing their typical activities. Thus, ventilation measurements are typically taken for shorter time periods under specific conditions (e.g., running or walking on a treadmill).
The TAV approach relies on estimates or measurements of ventilation rates at varying physical activity levels, and estimates of time spent each day at those activity levels. An average daily breathing rate is generated by summing the products of ventilation rate (L/min) and time spent (min/day) at each activity level.
The second approach derives breathing rates based on daily energy expenditure and was first proposed by Layton (1993). Layton reasoned that breathing rate is primarily controlled by the amount of oxygen needed to metabolically convert food into energy the body can use. Because the volume of oxygen required to produce one kcal of energy and the ratio of the volume of oxygen consumed to the volume of air inhaled per unit time are both constant values, the amount of energy a person expends is directly proportional to the volume of air the person breathes. Layton (1993) developed an equation that models this relationship and that can be used to derive breathing rates from energy expenditure data:
VE = H × VQ × EE (Eq. 3-5) where:
VE = the volume of air breathed per day (L/day), H = the volume of oxygen consumed to produce 1 kcal of energy (L/kcal), VQ = the ratio of the volume of air to the volume of oxygen breathed per unit
time and is referred to as the breathing equivalent (unitless) EE = energy (kcal) expended per day
Layton calculated an H value of 0.21 L/kcal for noninfant children. Arcus-Arth and Blaisdell (2007) calculated essentially the same H value of 0.22 L/kcal from data of non -breastfed infants based on food surveys. For VQ, Layton calculated a value of 27 from adult data. Children have different respiratory minute ventilation rates, as well as other respiratory parameter values, relative to adults. Therefore, children’s VQ values can be different from those of adults. Arcus-Arth and Blaisdell (2007) calculated VQ values for children from which daily breathing rates can be derived (Table 3.5).

Technical Support Document for Exposure Assessment and Stochastic Analysis, FINAL, August, 2012
3-10
Table 3.5. Mean VQ Values Calculated for Children Weighted
mean VQ Recommended
VQ Infants 0-11 mo. nda 33.5 Boys & girls 1-3 yrs nda 33.5 Boys & girls 4-8 yrs 33.5 33.5 Boys 9-18 yrs 30.6 30.6 Girls 9-18 yrs 31.5 31.5
a Insufficient or no data
Three variations of estimating EE have been used based on conversion of metabolic energy to derive a breathing rate: (1) from the caloric content of daily food intake, (2) as the product of basal metabolic rate (BMR) and ratios of average daily energy expenditure to BMR, and (3) as time-weighted averages of energy expenditure (expressed as multiples of BMR) across different levels of physical activity during the course of a day. Published reports applying these variations in metabolic energy conversion to arrive at breathing rates using Layton’s equation are summarized below.
In addition to using energy intake data with Layton’s method to derive breathing rates, an approach called the doubly labeled water (DLW) technique has also been used to derive total energy expenditure and is summarized below. The DLW data have been shown to be quite accurate, but the approach has only been applied to specific sub-populations.
3.4 Available Daily Breathing Rate Estimates
There are a number of sources of information on daily breathing rates for various age groups and other subpopulations that have been derived via the methods described above. Some sources have compiled breathing rates from other studies.
3.4.1 Traditional Breathing Rate Estimation
The book Reference Man (Snyder et al., 1975), a report by the International Commission on Radiological Protection (ICRP), presents breathing rates based on about 10 limited studies. Using an assumption of 8 hour (hr) resting activity and 16 hr light activity and the breathing rates (see Table 3.6), ICRP recommended daily breathing rates of 23 m3/day for adult males, 21 m3/day for adult females, and 15 m3/day for a 10 year old child. In addition, assuming 10 hr resting and 14 hr light activity each day, ICRP recommends a daily breathing rate of 3.8 m3/day for a 1 year old. Finally, assuming 23 hr resting and 1 hr light activity, ICRP recommends a daily breathing rate of 0.8 m3/day for a newborn. The breathing rates estimated by the ICRP used sources that had a small sample size and were limited in scope. Table 3.6 is the minute volume data upon which the daily breathing rates were based.

Technical Support Document for Exposure Assessment and Stochastic Analysis, FINAL, August, 2012
3-11
Table 3.6. Minute Volumes from ICRP’S Reference Man a Resting
L/min (m3/hr) Light Activity L/min (m3/hr)
Adult male 7.5 (0.45) 20 (1.2) Adult female 6.0 (0.36) 19 (1.14) Child, 10 yr 4.8 (0.29) 13 (0.78) Child, 1 yr 1.5 (0.09) 4.2 (0.25) Newborn 0.5 (0.03) 1.5 (0.09)
a Data compiled from available studies measuring minute volume at various activities by age/sex categories
This report provided the approach used in traditional risk assessment, in that a single estimate of daily breathing was employed, often 20 m3/day for a 70-kg person.
3.4.2 Daily Breathing Rate Estimates Based on Time-Activity-Ventilation (TAV) Data
Marty et al. (2002) 3.4.2.1
Marty et al. (2002) derived California-specific distributions of daily breathing rates using estimates and measurements of ventilation rates at varying physical activity levels, and estimates of time spent each day at those activity levels. Two activity pattern studies were conducted in which activities of a randomly sampled population of 1762 adults and 1200 children were recorded retrospectively for the previous 24 hours via telephone interview (Phillips et al., 1991; Wiley et al., 1991a; Wiley et al., 1991b; Jenkins et al., 1992). Measured breathing rates in people performing various laboratory and field protocols were conducted by Adams et al. (1993). The subjects in this study were 160 healthy individuals of both sexes, ranging in age from 6 to 77 years. An additional forty 6 to 12 year olds and twelve 3 to 5 year olds were recruited for specific protocols.
For adults, each activity was assigned to a resting, light, moderate, moderately heavy, or heavy activity category to reflect the ventilation rate that could reasonably be associated with that activity. For children there were only resting, light, moderate, and heavy activity categories. The ventilation rates were classified into similar levels (e.g., the lying down protocol was considered the resting category of ventilation rate). The measured ventilation for each individual in the lab and field protocols was divided by that person’s body weight. For each individual, the time spent at each activity level was summed over the day. The mean ventilation rate for each category (resting, etc.) was then multiplied by the summed number of minutes per day in that category to derive the daily breathing rate for each category. The breathing rates were then summed over categories to give a total daily breathing rate. The moments and percentiles for the raw derived breathing rates as well as for the breathing rates fit to a gamma distribution are presented in Tables 3.7 and 3.8 for the combined group of adolescents and adults (i.e., >12 years age) and for children (<12 years age). OEHHA staff also derived distributions of breathing rates for the equivalent of a 63-kg adult and
Technical Support Document for Exposure Assessment and Stochastic Analysis, FINAL, August, 2012
3-12
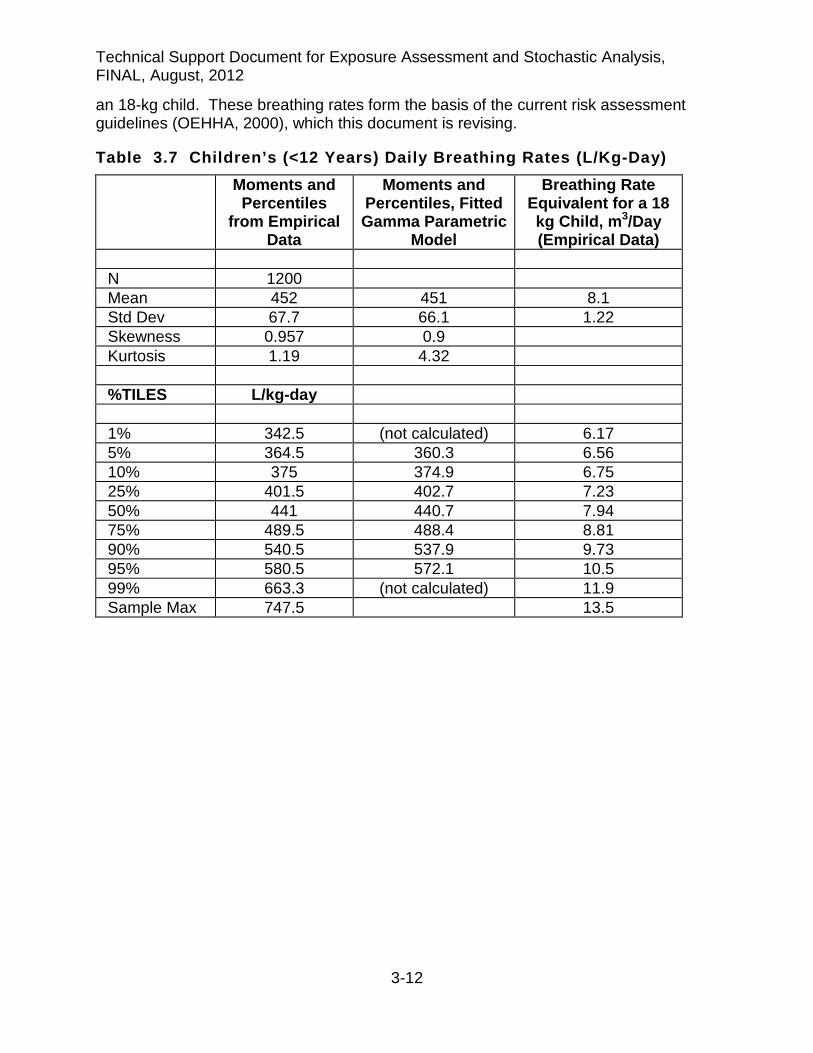
an 18-kg child. These breathing rates form the basis of the current risk assessment guidelines (OEHHA, 2000), which this document is revising.
Table 3.7 Children’s (<12 Years) Daily Breathing Rates (L/Kg-Day) Moments and
Percentiles from Empirical
Data
Moments and Percentiles, Fitted Gamma Parametric
Model
Breathing Rate Equivalent for a 18 kg Child, m3/Day (Empirical Data)
N 1200 Mean 452 451 8.1 Std Dev 67.7 66.1 1.22 Skewness 0.957 0.9 Kurtosis 1.19 4.32 %TILES L/kg-day 1% 342.5 (not calculated) 6.17 5% 364.5 360.3 6.56 10% 375 374.9 6.75 25% 401.5 402.7 7.23 50% 441 440.7 7.94 75% 489.5 488.4 8.81 90% 540.5 537.9 9.73 95% 580.5 572.1 10.5 99% 663.3 (not calculated) 11.9 Sample Max 747.5 13.5
Technical Support Document for Exposure Assessment and Stochastic Analysis, FINAL, August, 2012
3-13
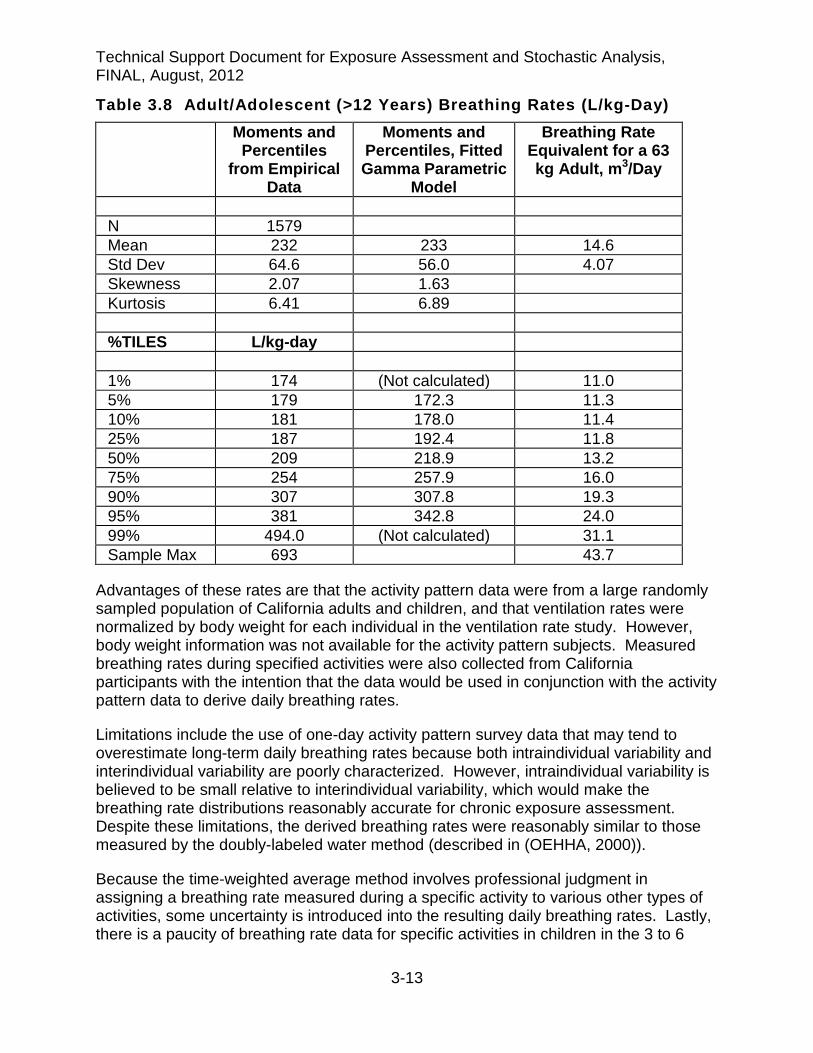
Table 3.8 Adult/Adolescent (>12 Years) Breathing Rates (L/kg-Day) Moments and
Percentiles from Empirical
Data
Moments and Percentiles, Fitted Gamma Parametric
Model
Breathing Rate Equivalent for a 63 kg Adult, m3/Day
N 1579 Mean 232 233 14.6 Std Dev 64.6 56.0 4.07 Skewness 2.07 1.63 Kurtosis 6.41 6.89 %TILES L/kg-day 1% 174 (Not calculated) 11.0 5% 179 172.3 11.3 10% 181 178.0 11.4 25% 187 192.4 11.8 50% 209 218.9 13.2 75% 254 257.9 16.0 90% 307 307.8 19.3 95% 381 342.8 24.0 99% 494.0 (Not calculated) 31.1 Sample Max 693 43.7
Advantages of these rates are that the activity pattern data were from a large randomly sampled population of California adults and children, and that ventilation rates were normalized by body weight for each individual in the ventilation rate study. However, body weight information was not available for the activity pattern subjects. Measured breathing rates during specified activities were also collected from California participants with the intention that the data would be used in conjunction with the activity pattern data to derive daily breathing rates.
Limitations include the use of one-day activity pattern survey data that may tend to overestimate long-term daily breathing rates because both intraindividual variability and interindividual variability are poorly characterized. However, intraindividual variability is believed to be small relative to interindividual variability, which would make the breathing rate distributions reasonably accurate for chronic exposure assessment. Despite these limitations, the derived breathing rates were reasonably similar to those measured by the doubly-labeled water method (described in (OEHHA, 2000)).
Because the time-weighted average method involves professional judgment in assigning a breathing rate measured during a specific activity to various other types of activities, some uncertainty is introduced into the resulting daily breathing rates. Lastly, there is a paucity of breathing rate data for specific activities in children in the 3 to 6

Technical Support Document for Exposure Assessment and Stochastic Analysis, FINAL, August, 2012
3-14
year age range, and no data for children and infants younger than 3 years old. Thus, only a broad age range (i.e., < 12 years old) could be used for estimating daily breathing rates in children. Daily breathing rates cannot be reliably estimated from this study for children and infants over narrow age ranges, such as the critical 0<2 year age group.
Allan et al. (2008) 3.4.2.2
Allan et al. (2008) also estimated breathing rates for specified age groups by the TAV approach, but employed a greater number of time-activity data sets than that used by Marty et al. (2002). This study updated TAV inhalation rate distributions from a previous report by Allan and Richardson (1998) by incorporating supplemental minute volume and time-activity data, and by correlating minute volume with metabolic equivalents (METs) for performing the physical activities at the time of measurement. Published time-activity and minute volume data used by Marty et al. (2002) were also used by the authors to develop the distributions (Wiley et al., 1991a; Wiley et al., 1991b; Adams, 1993), but also a number of other reports primarily conducted in the USA and Canada.
Their TAV approach calculated mean expected breathing rates for five different activity levels (i.e., level 1 – resting; level 2 – very light activity; level 3 – light activity; level 4 – light to moderate activity, level 5 – moderate to heavy activity). For infants, only three levels of activity were defined (i.e., sleeping or napping, awake but not crying, and crying).
Probability density functions describing 24-hour inhalation rates were generated using Monte Carlo simulation and can be described with lognormal distributions. Table 3.9 presents the estimated breathing rates in m3/day for males and females (combined) by age groupings commonly used in Canada for risk assessment purposes. In their report, Allan et al. (2008) also provided breathing rates for males and females separately. However, breathing rate distributions adjusted for body weight (m3/day-kg) were not included in the report.
Table 3.9. Allan et al. (2008) TAV-Derived Daily Breathing Rates (m3/Day) for Males And Females Combined Age Category
Males and Females Combined (m3/day) Mean + SD 50%-ilea 90%-ilea 95%-ilea
Infants (0-6 mo) 2.18 + 0.59 2.06 2.87 3.12 Toddlers (7 mo-4 yr) 8.31 + 2.19 7.88 10.82 11.72 Children (5-11 yr) 14.52 + 3.38 13.95 18.49 19.83 Teenagers (12-19 yr) 15.57 + 4.00 14.80 20.09 21.69 Adults (20-59 yr) 16.57 + 4.05 15.88 21.30 22.92 Seniors (60+ yr) 15.02 + 3.94 14.35 19.72 21.36
a Percentiles provided courtesy of Allan (e-mail communication)
Allan et al. (2008) compared the breathing rate distribution derived by the DLW method (see below, Table 3.12) to their TAV breathing rate probability density function results and found that there appeared to be longer tails in the upper bounds for all age groups except teenagers and infants for the TAV method, suggesting the TAV distribution gives

Technical Support Document for Exposure Assessment and Stochastic Analysis, FINAL, August, 2012
3-15
a better representation of the more exposed members of the population such as athletes. For teenagers, the TAV and DLW distributions show considerable overlap. But for infants, lower breathing rates were observed by the TAV approach compared with the DLW approach. The authors could not explain this discrepancy. Unlike the Marty et al. (2002) study, daily breathing rates could be estimated in infants and toddlers. However, there is still a shortage of TAV data in children in the younger age groups relative to adults.
Uncertainty was reduced by grouping activities by expected METs. However, Allen et al. (2008) noted that there is still uncertainty about actual physical exertion at an activity level because of the way some source studies grouped activities (e.g., grouping walking with running). Uncertainty was also reduced by using, wherever possible, studies that documented all activities over a multi-day period rather than studies that considered only a few hours of behavior. Nevertheless, there is some uncertainty in combining data from disparate studies and in assigning ventilation rates to activities that are not described by energy expenditure levels. In particular, interpolations and extrapolations were used to fill in minute volume data gaps and may have resulted in overestimates or underestimates. For example, minute volume data for some activity levels in toddlers and children were considered insufficient to adequately characterize their minute volumes.
3.4.3 Daily Breathing Rate Estimates Based on Energy Expenditure
As discussed above, Layton (1993) developed a mathematical equation to estimate daily breathing rates based on energy expenditure. The paper also presented examples of breathing rates that had been derived using this method.
Layton (1993) 3.4.3.1
Layton took three approaches to estimating breathing rates from energy estimates. The first approach used the U.S.D.A.’s National Food Consumption Survey (1977-78) data to estimate energy (caloric) intake. The National Food Consumption Survey used a retrospective questionnaire to record three days of food consumption by individuals in households across the nation, and across all four seasons. Layton recognized that food intake is underreported for individuals 9 years of age and older in these surveys and therefore adjusted the reported caloric intake for these ages. These data are no longer the most current population based energy intake data available. Further, the breathing rates are not normalized to body weight.
The second approach to estimating breathing rates multiplied the BMR estimated for a given age-gender group by the estimated ratio of energy intake to basal metabolic rate (EFD/BMR) for that age-gender group. The BMR can be determined as a linear function of body weight, after accounting for gender and age. An activity multiplier can then be applied which is derived from previously reported ratios of daily food intake to BMR. The advantages of this approach include linking breathing rates to BMR, which is valuable since breathing rates are considered to be determined primarily by BMR.
Technical Support Document for Exposure Assessment and Stochastic Analysis, FINAL, August, 2012
3-16
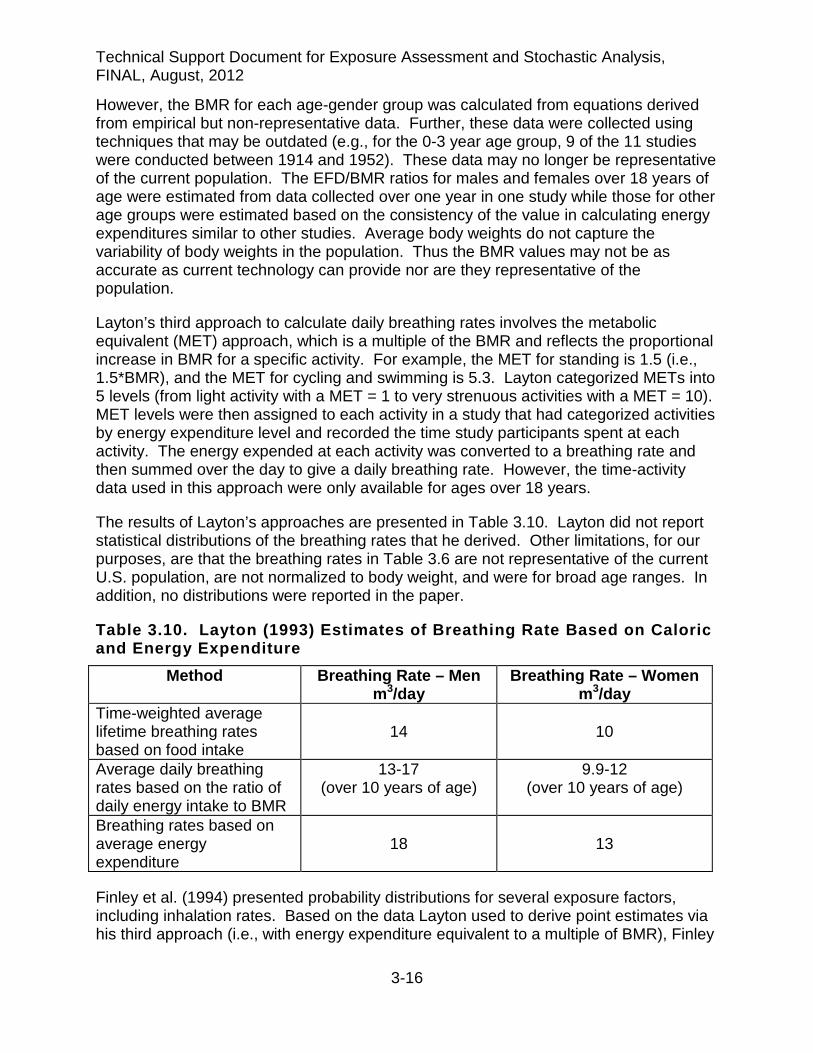
However, the BMR for each age-gender group was calculated from equations derived from empirical but non-representative data. Further, these data were collected using techniques that may be outdated (e.g., for the 0-3 year age group, 9 of the 11 studies were conducted between 1914 and 1952). These data may no longer be representative of the current population. The EFD/BMR ratios for males and females over 18 years of age were estimated from data collected over one year in one study while those for other age groups were estimated based on the consistency of the value in calculating energy expenditures similar to other studies. Average body weights do not capture the variability of body weights in the population. Thus the BMR values may not be as accurate as current technology can provide nor are they representative of the population.
Layton’s third approach to calculate daily breathing rates involves the metabolic equivalent (MET) approach, which is a multiple of the BMR and reflects the proportional increase in BMR for a specific activity. For example, the MET for standing is 1.5 (i.e., 1.5*BMR), and the MET for cycling and swimming is 5.3. Layton categorized METs into 5 levels (from light activity with a MET = 1 to very strenuous activities with a MET = 10). MET levels were then assigned to each activity in a study that had categorized activities by energy expenditure level and recorded the time study participants spent at each activity. The energy expended at each activity was converted to a breathing rate and then summed over the day to give a daily breathing rate. However, the time-activity data used in this approach were only available for ages over 18 years.
The results of Layton’s approaches are presented in Table 3.10. Layton did not report statistical distributions of the breathing rates that he derived. Other limitations, for our purposes, are that the breathing rates in Table 3.6 are not representative of the current U.S. population, are not normalized to body weight, and were for broad age ranges. In addition, no distributions were reported in the paper.
Table 3.10. Layton (1993) Estimates of Breathing Rate Based on Caloric and Energy Expenditure
Method Breathing Rate – Men m3/day
Breathing Rate – Women m3/day
Time-weighted average lifetime breathing rates based on food intake
14
10
Average daily breathing rates based on the ratio of daily energy intake to BMR
13-17 (over 10 years of age)
9.9-12 (over 10 years of age)
Breathing rates based on average energy expenditure
18
13
Finley et al. (1994) presented probability distributions for several exposure factors, including inhalation rates. Based on the data Layton used to derive point estimates via his third approach (i.e., with energy expenditure equivalent to a multiple of BMR), Finley

Technical Support Document for Exposure Assessment and Stochastic Analysis, FINAL, August, 2012
3-17
et al. (1994) expanded on Layton’s results to develop a probability distribution for breathing rate for several age groups (Table 3.11).
Table 3.11. Selected Distribution Percentiles from Finley et al. (1994) for Breathing Rates by Age Age Category (years)
Percentile (m3/day) 50th 90th 95th
<3 4.7 6.2 6.7 3 -10 8.4 10.9 11.8 10 – 18 13.1 17.7 19.3 18 – 30 14.8 19.5 21.0 30 – 60 11.8 15.4 16.7 >60 11.9 15.6 16.7
Because Finley largely used the same data as Layton to develop breathing rate distributions, the same limitations apply.
Arcus-Arth and Blaisdell (2007) 3.4.3.2
Arcus-Arth and Blaisdell (2007) derived daily breathing rates for narrow age ranges of children and characterized statistical distributions for these rates. The rates were derived using the metabolic conversion method of Layton (1993) and energy intake data (calories consumed per day) from the Continuing Survey of Food Intake of Individuals (CSFII) 1994–1996, 1998 conducted by the USDA (2000). The CSFII provided the most recent population based energy data at the time. The CSFII dataset consisted of two days of recorded food intake for each individual along with self-reported body weights. The individual data allowed for the assessment of interindividual variability. Because one-day intakes may be less typical of average daily intake, the two-day intakes were averaged to obtain a better estimate of typical intake available from these limited repeated measures. The CSFII energy intakes were weighted to represent the U.S. population. The rates were intended to be more representative of the current U.S. children’s population than prior rates that had been derived using older or non-representative data.
The premise for Layton’s equation is that breathing rate is proportional to the oxygen required for energy expenditure. While there are no energy expenditure data that are representative of the population, there are population representative energy intake data (i.e., calories consumed per day). Energy intake data can be used in Layton’s equation when energy intake equals energy expenditure. Energy intake is equal to energy expended when the individual is neither gaining nor losing body weight (i.e., all energy intake is expended). Because the percentage of daily energy intake that is needed to result in a discernible change in body weight for adults is very small, it can be assumed that for adults energy intake equals energy expended. However, in young infants, a significant portion of their daily energy intake is deposited in new tissue (e.g., adipose, bone and muscle). The deposited energy is referred to as the energy cost of deposition (ECD). Therefore, the daily energy intake needed for normal growth of infants is used

Technical Support Document for Exposure Assessment and Stochastic Analysis, FINAL, August, 2012
3-18
both for energy expenditure (EE) and ECD (i.e., energy intake = EE + ECD). If the breathing rate is to be estimated by the caloric intake approach for growing infants, the ECD must be subtracted from the total daily energy intake in order to determine an accurate breathing rate.
Accounting for the ECD is primarily important for newborn infants (Butte et al., 1990; Butte et al., 2000). For example, at ages 3 and 6 months the energy cost for growth constituted 22 and 6%, respectively, of total energy requirements. In older children the energy cost is only 2-3% of total energy requirements. By the age of 25 years in males and 19 years in females, the ECD has essentially decreased to zero and remains at that level throughout adulthood (Brochu et al., 2006a).
Because Layton’s equation requires only energy expenditure to derive the breathing rate, a small modification to Eq. 3-5 is made when deriving the infant breathing rate using the caloric intake approach:
VE = H x VQ x (TDEI - ECD) x 10-3 (Eq. 3-6) where:
TDEI = Total daily energy intake (kcal/day) ECD = Daily energy cost of deposition (kcal/day)
Arcus-Arth and Blaisdell (2007) subtracted the ECD from the TDEI to give a more accurate estimate of energy expended. The ECD for each month of age for infants up to 11 months of age was estimated from Scrimshaw et al. (1996). Although there is typically a burst of growth just prior to and during adolescence, Arcus-Arth and Blaisdell did not subtract the ECD during adolescence because investigators considered it negligible relative to total energy intake (Spady, 1981; Butte et al., 1989).
Layton (1993) reported on the bias associated with underreporting of dietary intakes by older children. He calculated a correction factor for this bias (1.2) and multiplied the daily energy intake of each child nine years of age and older by 1.2. Arcus-Arth and Blaisdell, having evaluated the literature and finding Layton’s adjustment to be reasonable, likewise multiplied daily energy intake of adolescent ages by 1.2.
Arcus-Arth and Blaisdell (2007) also evaluated the numerical values used by Layton for the VQ and H conversion factors in his metabolic equation. Their estimated value for the conversion factor H was similar to that found by Layton. However, they found data in the literature indicating that other values of VQ may be more specific to children than those used by Layton (see Table 3.5). The VQ values Arcus-Arth and Blaisdell calculated were used to derive breathing rates.
Non-normalized (L/day) and normalized (L/kg-day) breathing rates shown in Tables 3.8a-e) were derived for both children and adults from the CSFII dataset using the methodology described in Arcus-Arth and Blaisdell (2007). Briefly, the CSFII used a multistage complex sampling design to select individuals to be surveyed from the population. The CSFII recommended using a Jacknife Replication (JK) statistical

Technical Support Document for Exposure Assessment and Stochastic Analysis, FINAL, August, 2012
3-19
method (Gossett et al., 2002; Arcus-Arth and Blaisdell, 2007), which is a nonparametric technique that is preferred to analyze data from multistage complex surveys.
For each age group, the mean, standard error of the mean, percentiles (50th, 90th, and 95th) of non-normalized and normalized breathing rates, derived as described, are presented in Tables 3.12a and 3.12b, respectively. Child breathing rates are for males and females combined, except for the 9-18 yr adolescent age group breathing rates shown at the bottom of the tables.

Technical Support Document for Exposure Assessment and Stochastic Analysis, FINAL, August, 2012
3-20
TABLE 3.12a. Non-Normalized Daily Breathing Rates (L/Day) for Children and Adults Using CSFII Energy Intake and Layton’s Equation
Age Sample Size Nonweighted
Mean SEM 50%-ile 90%-ile 95%-ile SE of 95%-ile
Age (months) Infancy
0-2 182 3630 137 3299 5444 1 7104 1 643 3-5 294 4920 135 4561 6859 7720 481 6-8 261 6089 149 5666 8383 9760 856 9-11 283 7407 203 6959 10,212 11,772 ** 0-11 1020 5703 98 5323 8740 9954 553 Age (years)
Children
1 934 8770 75 8297 12,192 13,788 252 2 989 9758 100 9381 13,563 14,807 348 3 1644 10,642 97 10,277 14,586 16,032 269 4 1673 11,400 90 11,046 15,525 17,569 234 5 790 12,070 133 11,557 15,723 18,257 468 6 525 12,254 183 11,953 16,342 17,973 868 7 270 12,858 206 12,514 16,957 19,057 1269 8 253 13,045 251 12,423 17,462 19,019 1075 9 271 14,925 286 14,451 19,680 22,449 1 1345 10 234 15,373 354 15,186 20,873 22,898 1 1021 11 233 15,487 319 15,074 21,035 23,914 1 1615 12 170 17,586 541 17,112 25,070 1 29,166 1 1613 13 194 15,873 436 14,915 22,811 1 26,234 1 1106 14 193 17,871 615 15,896 25,748 1 29,447 1 4382 15 185 18,551 553 17,913 28,110 1 29,928 1 1787 16 201 18,340 536 17,370 27,555 31,012 2065 17 159 17,984 957 15,904 31,421 1 36,690 1 ** 18 135 18,591 778 17,339 28,800 1 35,243 1 4244 0<2 1954 7502 75 7193 11,502 12,860 170 2<16 7624 14,090 120 13,128 20,993 23,879 498 Adolescent Boys 9-18 983 19,267 278 17,959 28,776 32,821 1388 Adolescent Girls 9-18 992 14,268 223 13,985 21,166 23,298 607
1 Value may be less statistically reliable than other estimates due to small cell size ** Unable to calculate

Technical Support Document for Exposure Assessment and Stochastic Analysis, FINAL, August, 2012
3-21
Table 3.12b. Normalized Daily Breathing Rates (L/kg-Day) for Children and Adults Using CSFII Energy Intake and Layton’s Equation
Age Sample Size Nonweighted
Mean SEM 50%-ile 90%-ile 95%-ile SE of 95%-ile
Age (months)
Infancy
0-2 182 839 42 725 1305 1614 290 3-5 294 709 24 669 1031 1232 170 6-8 261 727 16 684 1017 1136 73 9-11 283 760 20 710 1137 1283 96 0-11 1020 751 11 694 1122 1304 36 Age (years) Children 3.4.3.31 934 752 7 716 1077 1210 33 2 989 698 9 670 986 1107 31 3 1644 680 6 648 966 1082 18 4 1673 645 5 614 904 1011 19 5 790 602 7 587 823 922 25 6 525 550 10 535 765 849 28 7 270 508 9 495 682 788 39 8 253 458 11 439 657 727 37 9 271 466 11 445 673 766 1 21 10 234 438 12 425 661 754 1 38 11 233 378 9 350 566 616 1 32 12 170 373 13 356 545 1 588 1 46 13 194 311 12 289 459 1 588 1 55 14 193 313 12 298 443 1 572 1 92 15 185 299 10 285 461 1 524 1 25 16 201 278 10 258 434 505 46 17 159 276 15 251 453 1 538 1 ** 18 135 277 10 244 410 1 451 1 42 0<2 1954 752 6 706 1094 1241 24 2<16 7624 481 3 451 764 869 6 Adolescent Boys 9-18 983 367 5 343 567 647 14 Adolescent Girls 9-18 992 315 6 288 507 580 24
1 Value may be less statistically reliable than other estimates due to small cell size ** Unable to calculate
Ideally, breathing rates and other variates used in risk assessment should be as representative as possible of the exposed population. Population representative daily energy (caloric) intake can be estimated from national food consumption surveys, such as the CSFII and the National Health and Nutrition Examination Survey (NHANES). These surveys can be analyzed to provide results that are representative of the nation
Technical Support Document for Exposure Assessment and Stochastic Analysis, FINAL, August, 2012
3-22
and of several subpopulations, including narrow age groups. The sample sizes are large with these surveys and thus provide relatively robust results, which is of particular concern for the tails of probability distributions.
Limitations for the CSFII energy intake-derived breathing rates include the underreporting of food intakes discussed above. Underestimation of energy intake leads to underestimation of breathing rates. Another limitation is that only two days of food intake data had been collected. Although collection of two consecutive days of food intake is an improvement over earlier collections of one day of food intake, the repeated measures in the survey were still too limited to reduce the impact of daily variations in food intake and would tend to overestimate the upper and lower percentiles. Typical intake is not captured by the caloric intake of two days, and breathing rate and dietary intake on any given day are not tightly coupled.
US EPA (2009) Metabolic Equivalent-Derived Daily Breathing Rate Estimates 3.4.3.4
Similar to one of the approaches Layton (1993) used to estimate the breathing rate, U.S. EPA employed a metabolic equivalent (METS) approach for estimating breathing rates. This method determines daily time-weighted averages of energy expenditure (expressed as multipliers of the basal metabolic rate) across different levels of physical activity. METs provide a scale for comparing the physical intensities of different activities. Recent energy expenditure data including the 1999-2002 NHANES and U.S EPA’s Consolidated Human Activity Database (CHAD) were used that considers variability due to age, gender, and activities. NHANES (CDC, 2000; 2002) was used as the source of body weight data, and CHAD (U.S. EPA, 2002) was the central source of information on activity patterns and METS values for individuals. The 4-year sampling weights assigned to the individuals within NHANES 1999-2002 were used to weight each individual’s data values in the calculations of these statistics.
Data were grouped into age categories and a simulated 24-hour activity pattern was generated by randomly sampling activity patterns from the set of participants with the same gender and age. Each activity was assigned a METS value based on statistical sampling of the distribution assigned by CHAD to each activity code. Using statistical software, equations for METS based on normal, lognormal, exponential, triangular and uniform distributions were generated as needed for the various activity codes. The METS values were then translated into energy expenditure (EE) by multiplying the METS by the basal metabolic rate (BMR), which was calculated as a linear function of body weight. The VO2 was calculated by multiplying EE by H, the volume of oxygen consumed per unit energy.
The inhalation rate for each activity within the 24-hour simulated activity pattern for each individual was then estimated as a function of VO2, body weight, age, and gender. Following this, the average inhalation rate was calculated for each individual for the entire 24-hour period, as well as for four separate classes of activities based on METS value (sedentary/passive [METS less than or equal to 1.5], light intensity [METS greater than 1.5 and less than or equal to 3.0], moderate intensity [METS greater than 3.0 and less than or equal to 6.0], and high intensity [METS greater than 6.0]. Data for
Technical Support Document for Exposure Assessment and Stochastic Analysis, FINAL, August, 2012
3-23
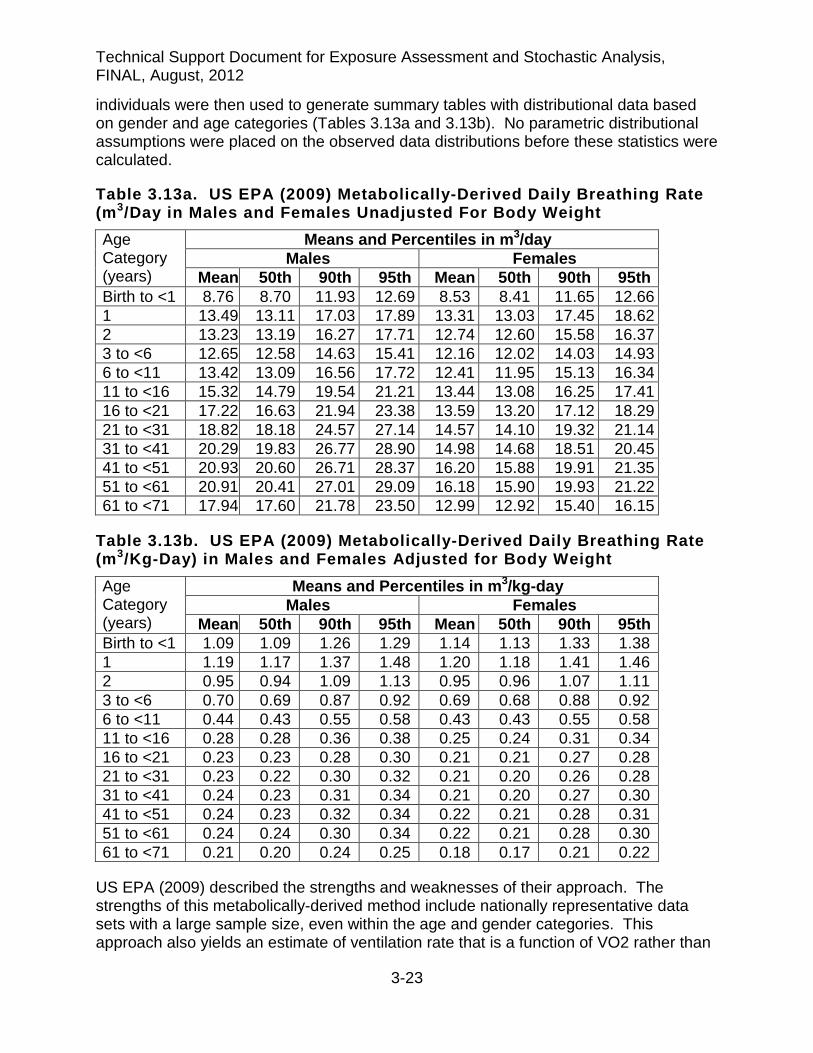
individuals were then used to generate summary tables with distributional data based on gender and age categories (Tables 3.13a and 3.13b). No parametric distributional assumptions were placed on the observed data distributions before these statistics were calculated.
Table 3.13a. US EPA (2009) Metabolically-Derived Daily Breathing Rate (m3/Day in Males and Females Unadjusted For Body Weight Age Category (years)
Means and Percentiles in m3/day Males Females
Mean 50th 90th 95th Mean 50th 90th 95th Birth to <1 8.76 8.70 11.93 12.69 8.53 8.41 11.65 12.66 1 13.49 13.11 17.03 17.89 13.31 13.03 17.45 18.62 2 13.23 13.19 16.27 17.71 12.74 12.60 15.58 16.37 3 to <6 12.65 12.58 14.63 15.41 12.16 12.02 14.03 14.93 6 to <11 13.42 13.09 16.56 17.72 12.41 11.95 15.13 16.34 11 to <16 15.32 14.79 19.54 21.21 13.44 13.08 16.25 17.41 16 to <21 17.22 16.63 21.94 23.38 13.59 13.20 17.12 18.29 21 to <31 18.82 18.18 24.57 27.14 14.57 14.10 19.32 21.14 31 to <41 20.29 19.83 26.77 28.90 14.98 14.68 18.51 20.45 41 to <51 20.93 20.60 26.71 28.37 16.20 15.88 19.91 21.35 51 to <61 20.91 20.41 27.01 29.09 16.18 15.90 19.93 21.22 61 to <71 17.94 17.60 21.78 23.50 12.99 12.92 15.40 16.15
Table 3.13b. US EPA (2009) Metabolically-Derived Daily Breathing Rate (m3/Kg-Day) in Males and Females Adjusted for Body Weight Age Category (years)
Means and Percentiles in m3/kg-day Males Females
Mean 50th 90th 95th Mean 50th 90th 95th Birth to <1 1.09 1.09 1.26 1.29 1.14 1.13 1.33 1.38 1 1.19 1.17 1.37 1.48 1.20 1.18 1.41 1.46 2 0.95 0.94 1.09 1.13 0.95 0.96 1.07 1.11 3 to <6 0.70 0.69 0.87 0.92 0.69 0.68 0.88 0.92 6 to <11 0.44 0.43 0.55 0.58 0.43 0.43 0.55 0.58 11 to <16 0.28 0.28 0.36 0.38 0.25 0.24 0.31 0.34 16 to <21 0.23 0.23 0.28 0.30 0.21 0.21 0.27 0.28 21 to <31 0.23 0.22 0.30 0.32 0.21 0.20 0.26 0.28 31 to <41 0.24 0.23 0.31 0.34 0.21 0.20 0.27 0.30 41 to <51 0.24 0.23 0.32 0.34 0.22 0.21 0.28 0.31 51 to <61 0.24 0.24 0.30 0.34 0.22 0.21 0.28 0.30 61 to <71 0.21 0.20 0.24 0.25 0.18 0.17 0.21 0.22
US EPA (2009) described the strengths and weaknesses of their approach. The strengths of this metabolically-derived method include nationally representative data sets with a large sample size, even within the age and gender categories. This approach also yields an estimate of ventilation rate that is a function of VO2 rather than

Technical Support Document for Exposure Assessment and Stochastic Analysis, FINAL, August, 2012
3-24
an indirect measure of oxygen consumption such as VQ as other researchers have used.
Another strength is that the breathing rates included a BMR component which had been derived from NHANES body weights and to which NHANES sampling weights were linked. The BMR component of the breathing rates was representative of the population because of the sampling weights. That is, the degree of association between body weight and breathing rate was incorporated into the distribution of breathing rate distributions.
However, the degree of association between breathing rate and other characteristics (e.g., race, geographic region) was not incorporated into the distributions (US EPA, 2009). These non-body weight characteristics can be highly associated with variability in activity patterns. Although BMR may contribute the greatest percent to the quantitative breathing rate value, the variability in breathing rates is most likely driven by differing levels of physical activity by different persons. Because the activity data was collected over a 24-hour period, day-to-day variability is not well characterized (US EPA, 2009; US EPA, 2011). The outcome is that the simulated 24-hour activity pattern assigned to an NHANES participant is likely to contain a greater variety of different types of activities than one person may typically experience in a day.
Furthermore, because the simulated activity profiles did not consider possible limits on the “maximum possible METS value” that would account for previous activities, ventilation rates may be overestimated (US EPA, 2009). This happens, in part, because the MET approach does not take into consideration correlations that may exist between body weight and activity patterns. For example, high physical activity levels can be associated with individuals of high body weight, leading to unrealistically high inhalation rates at the upper percentiles levels (US EPA 2011). The result is that the central tendency of the MET breathing rates may be fairly representative of the population, but the breathing rates may not appropriately capture the variability within the population. This limitation was probably most evident in children <3 years of age where the data used to calculate BMR values may be less representative of the current population (US EPA, 2009).
3.4.4 Daily Breathing Rate Estimates from Doubly Labeled Water Measurements
In another method used to quantify human energy expenditure, published doubly-labeled water (DLW) energy expenditure data can be used in conjunction with Layton’s equation to convert metabolic energy to daily inhalation rates (Brochu et al., 2006a; 2006b; Stifelman, 2007). In the DLW method, isotopically labeled water containing 2H20 (i.e., heavy water) and H2
180 is given orally to the study participant. The isotopes then distribute in the body and disappear from body water pools by dilution from new unlabeled water into the body, by the excretion of the labeled isotope from the body, or by the production of CO2. The difference in disappearance rates between the two isotopes represents CO2 production over an optimal period of 1–3 half-lives (7 to 21 days in most human subjects) of the labeled water. CO2 production is an indirect

Technical Support Document for Exposure Assessment and Stochastic Analysis, FINAL, August, 2012
3-25
measure of metabolic rate and can be converted into units of energy using knowledge of the chemical composition of the foods consumed.
A major advantage of the DLW method is that it provides an index of total energy expenditure over a period of 1 to 3 weeks, which is a more biologically meaningful period of time compared to the other methods, and can reduce the impact of daily variations in physical activity or food intake (IOM, 2005). In addition, the DLW method is non-invasive, requiring only that the subject drink the stable isotopes and provide at least three urine samples over the study period. Thus, measurements can be made in subjects leading their normal daily lives (i.e., free-living individuals). The DLW method is considered to be the most accurate method for determining the breathing rate of an individual (IOM, 2005).
A disadvantage is that the DLW method is expensive to undertake, and that essentially all the available studies investigated different age ranges but the subjects were not randomly selected to be representative of populations. However, measurements are available in a substantial number of men, women and children whose ages, body weights, heights and physical activities varied over wide ranges.
DLW measurements of total daily energy expenditures (TDEE) include basal metabolism, physical activity level, thermogenesis, and the synthetic cost of growth (Butte et al., 2000). The synthetic cost of growth is the energy that is expended to synthesize the molecules that will be stored. This is different from the energy deposited for growth (ECD), which is the energy intake that is deposited in the body for new tissue. The ECD is an important factor in newborn infants and is not accounted for in DLW measurements. Thus, the derivation of breathing rates using Layton’s equation does not require an adjustment to subtract out the ECD to determine TDEE, as was necessary for deriving the breathing rates of infants by the caloric intake approach (Section 3.5.3.2).
Brochu et al. (2006a,b) 3.4.4.1
Brochu et al. (2006a) calculated daily inhalation rates for 2210 individuals aged 3 weeks to 96 years using DLW energy expenditure data mainly from the IOM (2005). The IOM database is a compilation of DLW-derived energy expenditure results and other raw data from individuals collected from numerous studies. Breathing rates were estimated for different groups of individuals including healthy normal-weight males and females with normal active lifestyles (n=1252), overweight/obese individuals with normal active lifestyles (n=679), individuals from less affluent societies (n=59), underweight adults (n=34), and individuals during various extreme physical activities (n=170). Normal weight adults age 20 yrs and above were categorized as having BMIs between 18.5 and 25 kg/m2. Overweight/obese adults had BMIs above 25 kg/m2. For children and teenagers aged 4 to 19 yrs, BMIs corresponding to the 85th percentile or below were considered normal. The breathing rate data were presented as 5th, 10th, 25th, 50th, 75th, 90th, 95th, and 99th percentile values as well as mean and SEM values for the derived inhalation rates for narrow age groups ranging from 1 month to 96 years. A partial

Technical Support Document for Exposure Assessment and Stochastic Analysis, FINAL, August, 2012
3-26
listing of the breathing rate percentiles for normal weight individuals by age group are shown in Tables 3.14a and 3.14b.
Table 3.14a. Means and Percentiles of Daily Breathing Rates (in m3/Day) for Free-Living Normal-Weight Males and Females Derived from DLW Measurements by Brochu et al. (2006a) Age Category (years)
Means and Percentiles in m3/day Malesa Femalesa
N Mean 50th 90th 95th N Mean 50th 90th 95th 0.22 to <0.5 32 3.38 3.38 4.30 4.57 53 3.26 3.26 4.11 4.36 0.5 to <1 40 4.22 4.22 5.23 5.51 63 3.96 3.96 4.88 5.14 1 to <2 35 5.12 5.12 6.25 6.56 66 4.78 4.78 6.01 6.36 2 to <5 25 7.60 7.60 9.25 9.71 36 7.06 7.06 8.54 8.97 5 to <7 96 8.64 8.64 10.21 10.66 102 8.22 8.22 9.90 10.38 7 to <11 38 10.59 10.59 13.14 13.87 161 9.84 9.84 12.00 12.61 11 to <23 30 17.23 17.23 21.93 23.26 87 13.28 13.28 16.61 17.56 23 to <30 34 17.48 17.48 21.08 22.11 68 13.67 13.67 16.59 17.42 30 to <40 41 16.88 16.88 20.09 21.00 59 13.68 13.68 15.94 16.58 40 to <65 33 16.24 16.24 19.67 20.64 58 12.31 12.31 14.96 15.71 65 to <96 50 12.96 12.96 16.13 17.03 45 9.80 9.80 12.58 13.37
a Percentiles based on a normal distribution assumption for all age groups
Table 3.14b. Means and Percentiles of Daily Breathing Rates (in m3/kg-Day) for Free-Living Normal-Weight Males and Females Derived from DLW Measurements by Brochu et al. (2006a) Age Category (years)
Mean and Percentiles in m3/kg-day Malesa Femalesa
N Mean 50th 90th 95th N Mean 50th 90th 95th 0.22 to <0.5 32 0.509 0.509 0.627 0.661 53 0.504 0.504 0.623 0.657 0.5 to <1 40 0.479 0.479 0.570 0.595 63 0.463 0.463 0.545 0.568 1 to <2 35 0.480 0.480 0.556 0.578 66 0.451 0.451 0.549 0.577 2 to <5 25 0.444 0.444 0.497 0.512 36 0.441 0.441 0.532 0.559 5 to <7 96 0.415 0.415 0.475 0.492 102 0.395 0.395 0.457 0.474 7 to <11 38 0.372 0.372 0.451 0.474 161 0.352 0.352 0.431 0.453 11 to <23 30 0.300 0.300 0.360 0.377 87 0.269 0.269 0.331 0.349 23 to <30 34 0.247 0.247 0.297 0.311 68 0.233 0.233 0.287 0.302 30 to <40 41 0.237 0.237 0.281 0.293 59 0.235 0.235 0.279 0.292 40 to <65 33 0.230 0.230 0.284 0.299 58 0.211 0.211 0.257 0.270 65 to <96 50 0.188 0.188 0.228 0.239 45 0.172 0.172 0.220 0.233
a Percentiles based on a normal distribution assumption for all age groups
Comparing the largest subgroups (i.e., overweight/obese individuals vs. normal-weight individuals), Brochu et al. observed that overweight/obese individuals inhaled between 0.8 to 3.0 m3 more air per day than normal-weight individuals, but their physiological daily breathing rates are 6 to 21% lower than that of their leaner counterparts when
Technical Support Document for Exposure Assessment and Stochastic Analysis, FINAL, August, 2012
3-27
expressed in m3/kg-day. Also of interest is that the daily inhalation rates (in m3/kg-day) of newborns and normal-weight infants aged 2.6 to less than 6 months are 2.1 to 5.1 times higher than those of normal-weight and overweight/obese adults aged 18 to 96 years with normal lifestyles.
Besides the lack of randomly selected individuals representative of a population for estimating energy expenditure, much of the DLW data used to derive the breathing rate percentiles relied heavily on adults with sedentary lifestyles (Black et al., 1996). Occupations of many participants included professionals, white collar workers or other sedentary occupations, and almost no participants were in manual labor occupations that are known to result in higher breathing rates. Although a small group of athletic individuals appear to be included in the DLW database by Brochu et al. (2006a), it was suggested by Black et al. (1996) that not enough participants involved in manual labor are represented in the DLW database. This may result in breathing rate percentiles that are lower than what might be obtained from a population-based study. Nevertheless, as noted above, the DLW method provides an index of total energy expenditure over a period of 1 to 3 weeks, which is a better determinant of long-term breathing rate than other methods described that rely on 1 to 2 days of energy intake or expenditure to estimate long-term breathing rates. Thus, the DLW method is considered to be the most accurate method for determining an average daily breathing rate of a free-living individual.
Stifelman (2007) 3.4.4.2
Using energy expenditure data based on extensive DLW measurements from two sources (FAO, 2004a; 2004b; IOM, 2005), Stifelman (2007) calculated inhalation rates with Layton’s equation for long-term physical activity levels categorized as active to very active individuals. The breathing rate data are presented in Table 3.15 in one year age groupings for infants and children and in three age groupings for adults up to age 70.

Technical Support Document for Exposure Assessment and Stochastic Analysis, FINAL, August, 2012
3-28
TABLE 3.15. Equivalent Breathing Rates Based on Institute of Medicine Energy Expenditure Recommendations for Active and Very Active People Age (Years) Inhalation rate – males
active – very active (m3/day) Inhalation rate – females active – very active (m3/day)
<1 3.4 3.4 1 4.9 4.9 2 5.9 5.5 3 8.4 – 9.5 7.9 – 9.3 4 8.8 – 10.1 8.3 – 9.9 5 9.4 – 10.7 8.8 – 10.5 6 9.8 – 11.3 9.3 – 11.1 7 10.4 – 11.9 9.7 – 11.6 8 10.9 – 12.6 10.2 – 12.3 9 11.5 – 13.3 10.7 – 12.8 10 12.1 – 14.0 11.1 – 13.4 11 12.9 – 14.9 11.7 – 14.1 12 13.7 – 15.9 12.3 – 14.9 13 14.8 – 17.2 12.9 – 15.6 14 16.0 – 18.5 13.2 – 16.0 15 17.0 – 19.8 13.3 – 16.2 16 17.8 – 20.7 13.4 – 16.3 17 18.2 – 21.2 13.3 – 16.2 18 18.6 – 21.5 13.2 – 16.1 19-30 17.0 – 19.7 13.4 – 15.2 31-50 16.2 – 18.9 12.8 – 14.5 51-70 15.1 – 17.8 12.0 – 13.8
Physical activity levels (PALs) were categorized into four levels of activity by the IOM, two of which were the active and very active levels. A PAL is the ratio of total energy expended (TEE) divided by the basal metabolic rate, defined as the minimum level of energy needed to support essential physiologic functions in free-living people. Stifelman (2007) also calculated the breathing rate associated with each level, as shown in Table 3.16. It is believed unlikely that the PAL “very active” category (i.e., PAL range 1.9-2.5) would be exceeded over a duration of years. PALs exceeding the IOM and FAO ranges are generally not sustainable over long periods of time, but can be quite high for limited periods of time (Westerterp, 2001). For example, highly trained athletes during periods of high-intensity training competition, including cross-country skiers and Tour de France bicycle racers, can reach a PAL of 3.5-5.5.
The IOM and FAO PALs describe a range of 1.4-2.5 in accord with ranges of sustainable PALs described by others, including people actively engaged in non-mechanized agriculture, deployed military personnel, and long-distance runners (Stifleman, 2007; Westerterp, 2001; Westerterp, 1998; Black et a., 1996; Haggerty et al., 1994). Individuals among the general population exceeding PALs of 2-2.5 for long

Technical Support Document for Exposure Assessment and Stochastic Analysis, FINAL, August, 2012
3-29
periods of time are expected to experience negative energy balance (i.e., weight loss) mainly because an important limit to sustainable metabolic rate is the energy intake (Westerterp 1998; Westerterp, 2001).
TABLE 3.16. IOM Physical Activity Categories, Associated Breathing Rates and Equivalent Walking Distance PAL Category PAL midpoint value
(range) Breathing rate midpoint value
Equivalent walking distance
(km /day)a Sedentary 1.25 (1.0-1.39) 14.4 m3/day 0 Low active 1.5 (1.4-1.59) 15.7 m3/day 3.5 Active 1.75 (1.6-1.89) 17.3 m3/day 11.7 Very active 2.2 (1.9-2.5) 19.4 m3/day 26.9 a Equivalent walking distance in addition to energy expended during normal daily life, based on a 70 kg adult walking 5-6 km per hour. Adapted from Stifelman (2007) and Brooks et al. (2004)
Based on the DLW data, Stifelman’s analysis indicates that human energy expenditure occurs within a fairly narrow range of activity levels (PAL in the range of 1.4-2.5), and that for breathing rates estimated by the DLW method, a breathing rate of 19.4 m3/day (equivalent to a PAL of 2.2) is near the maximum energy expenditure that can be sustained for long periods of time in adults. This finding supports the idea that the traditional 20 m3/day is an upper end breathing rate (Snyder et al. (1975).
The narrow range in breathing rates was found to be consistent with the daily energy expenditure estimated from the adult breathing rate distribution in Marty et al. (2002) where the range is slightly over 2-fold between the 5th and 95th percentile in Table 3.7. A roughly 2-fold range in between the 5th and 95th percentiles is also exhibited in the MET-derived breathing rates by US EPA (2009).
Limits of Sustainable Breathing Rates Derived from PALs 3.4.4.3
As noted above, DLW studies have shown that a PAL of approximately 2 to 2.5 in the general population of adults is the limit of sustainable energy expenditure for long periods of time (Westerterp, 2001; IOM, 2005; Stifelman, 2007). The PAL of novice athletes training for endurance runs and soldiers during field training falls within this range (Westerterp, 1998; 2001). The PAL has been found to be twice the upper limit (PALs = 3.5 to 5.5) in professional endurance athletes in the most demanding sports (cross-country skiing and cycling) during training and competition. The PALs of these professional athletes are in the right tail of the breathing rate distribution of the general population (Westerterp, 2001). However, the high PALs are not expected to be sustained at these high levels when averaged over years.
Knowing the average basal energy expenditure (BEE) for adults and the upper range of daily energy expenditure, the upper limit of long-term daily breathing rates for the general population can be estimated from Layton’s equation (eq. 3.1). Marty et al. (2002) observed that the 95th percentile breathing rate should be found within this PAL range of 2 to 2.5. Thus, it might be reasonable to compare the 95th percentile adult

Technical Support Document for Exposure Assessment and Stochastic Analysis, FINAL, August, 2012
3-30
breathing rate calculated by other methods to the breathing rates derived from an upper limit PAL range of 2 to 2.5.
Table 3.17 show the expected breathing rates of adults in a PAL range of 2.0 to 2.5. The mean BEE in kcal/day for the adult age groups is obtained from Brooks et al. (2004). Mean weights for the adult age groups were also obtained from this reference in order to convert breathing rates in L/day to L/kg-day. The results from the DLW-derived energy expenditure data suggest that for normal weight adults (i.e., adults with BMIs within the healthy range of 18.5 to 25), the upper limit of breathing rates for males and females combined would be 16,629 to 20,787 L/day, or 256 to 320 L/kg-day.
Table 3.17. Description of the Normative Adult DLW Data from Brooks et al. (2004) for Persons with a Healthy BMI, and the Resulting Calculations of Breathing Rate Within the Sustainable PAL Range of 2.0 to 2.5 Age
years n Mean
BEE kcal/d
TEE limitsa
kcal/d Breathing rate L/d
Mean weight kg
Breathing rate L/kg-d
Males 19-30 48 1769 3538 - 4423 20,060 - 25,078 71.0 283 - 353 31-50 59 1675 3350 - 4188 18,995 - 23,746 71.4 266 - 333 51-70 24 1524 3048 - 3810 17,282 - 21,603 70.0 247 - 309 19-70b - - - 18,582 - 23,229 - 263 - 328 Females 19-30 82 1361 2722 - 3403 15,434 - 19,295 59.3 260 - 325 31-50 61 1322 2644 - 3305 14,991 - 18,739 58.6 256 - 320 51-70 71 1226 2452 - 3065 13,903 - 17,379 59.1 235 - 294 19-70b - - - 14,675 - 18,344 - 249 - 311 Males/ femalesc
19-70
-
-
-
16,629 - 20,787
-
256 - 320
a Sustainable PAL range (2.0 to 2.5) multiplied by mean BEE equals the daily total energy expenditure (TEE) that can be sustained over long periods of time. b 19-70 yr breathing rates calculated as a weighted average from the three smaller age groupings c Average breathing rates of males and females combined, assuming each gender represents 50% of the population.
Although the PAL limits were estimated for adults, it might also be useful to estimate high-end sustainable breathing rates for adolescents using the same assumption that a PAL of 2 to 2.5 represents the limit of sustainable energy expenditure over a long-term period. Some of the highest daily breathing rates in L/day were calculated for adolescents from the CSFII caloric intake data (Arcus-Arth and Blaisdell, 2007).
For deriving adolescent breathing rates from the mean BEE in Brooks et al. (2004) for 14-18 year olds, an upper limit of sustainable energy expenditure would be in the range of 3458-4323 kcal/d for males, and 2722-3403 kcal/d for females. Using Layton’s equation to derive the breathing rates from these daily energy expenditures, sustainable upper limit breathing rates of 22,221-27,780 L/day for adolescent males, and 18,006-22,511 L/day for adolescent females were calculated. After normalizing for weight using the mean weights for the 14-18 year age groups in Brooks et al. (2004),

Technical Support Document for Exposure Assessment and Stochastic Analysis, FINAL, August, 2012
3-31
upper range daily breathing rates of 378-472 L/kg-day for males and 332-513 L/kg-day for females were calculated.
3.4.5 Compilations of Breathing Rate Data
In the US EPA (2011) Exposure Factors Handbook, ranges of measured breathing rate values were compiled for infants, children and adults by age and sex. Table 3.18 presents the recommended breathing rate values for males and females combined for specific age groups up to age ≥81 yrs based on the average of the inhalation rate data from four recent key studies: Brochu et al. (2006a); U.S. EPA, (2009); Arcus-Arth and Blaisdell, (2007); and Stifelman (2007). The Table represents the unweighted means and 95th percentiles for each age group from the key studies. U.S. EPA noted that there is a high degree of uncertainty associated with the upper percentiles, including the 95th percentile shown in Table 3.18, thus they should be used with caution. The upper percentiles represent unusually high inhalation rates for long-term exposures, but were included in the handbook to provide exposure assessors a sense of the possible range of inhalation rates for children.
Table 3.18. US EPA (2011) Recommended Long-Term Exposure (More than 30 Days) Breathing Rate Values for Infants and Children (Males and Females Combined) Averaged From Four Key Studies Age Group Mean
m3/day
Sources Used for Means
95th Percentile
m3/day
Sources Used for 95th-ile
Birth to <1 month 3.6 a 7.1 a 1 to <3 months 3.5 a,b 5.8 a,b 3 to <6 months 4.1 a,b 6.1 a,b 6 to <12 months Birth to <1 year
5.4 5.4
a,b a,b,c,d
8.0 9.2
a,b a,b,c
1 to <2 years 8.0 a,b,c,d, 12.8 a,b,c 2 to <3 years 8.9 a,b,c,d 13.7 a,b,c 3 to <6 years 10.1 a,b,c,d 13.8 a,b,c 6 to <11 years 12.0 a,b,c,d 16.6 a,b,c 11 to <16 years 15.2 a,b,c,d 21.9 a,b,c 16 to <21 years 16.3 a,b,c,d 24.6 a,b,c 21 to <31 years 15.7 b,c,d 21.3 b,c 31 to <41 years 16.0 b,c,d 21.4 b,c 41 to <51 years 16.0 b,c,d 21.2 b,c 51 to <61 years 15.7 b,c,d 21.3 b,c 61 to <71 years 15.7 b,c,d 18.1 b,c 71 to <81 years 14.2 b,c 16.6 b,c ≥91 years 12.2 b,c 15.7 b,c
a Arcus-Arth and Blaisdell, 2007; b Brochu et al. 2006a; c U.S. EPA, (2009) d Stifelman 2007

Technical Support Document for Exposure Assessment and Stochastic Analysis, FINAL, August, 2012
3-32
3.5 OEHHA-Derived Breathing Rate Distributions for the Required Age Groupings Using Existing Data.
The summarized published reports provide breathing rate distributions by month/year of age or in specific age groups, but seldom in age groups applicable to OEHHA’s age groupings for cancer risk assessment. However, individual data were obtainable from the CSFII food intake study and the DLW database in the IOM (2005) report, from which breathing rate distributions could be derived in the specific age groups of third trimester, 0<2, 2<9, 2<16, 16<30, and 16-70 years. In addition, the U.S. EPA’s breathing rate distributions based on the MET approach, shown in Tables 3.13a and 3.13b, can be merged to obtain the necessary age group breathing rates.
3.5.1 OEHHA-derived breathing rates based on CSFII energy intake data
In Tables 3.19a-e, non-normalized (L/day) and normalized (L/kg-day) breathing rates for the specific OEHHA age groups were derived for both children and adults from the CSFII dataset using the Jacknife Replication statistical method (Arcus-Arth and Blaisdell, 2007). Breathing rates for pregnant women, for determination of third trimester breathing rates, are presented in Section 3.5.4.
In addition, each age group was also fit to a lognormal distribution using Crystal Ball® (Oracle Corp., Redwood Shores, CA, 2009). Crystal Ball® was also used to determine the best parametric model fit for the distribution of breathing rates for each age group. The Anderson-Darling test was chosen over other goodness-of-fit tests available in Crystal Ball® because this test specifically gives greater weight to the tails than to the center of the distribution. OEHHA is interested in the tails since the right tail represents the high-end (e.g., 95th percentile) breathing rates.

Technical Support Document for Exposure Assessment and Stochastic Analysis, FINAL, August, 2012
3-33
Tables 3.19a-e. Breathing Rate Distributions by Age Group (Males and Females Combined) Derived from CSFII Food Intake Data Using Jacknife Methodology and Parameter Estimates of Log-Normally and Best Fit Distributions
Table 3.19a. Breathing Rate Distributions for the 0<2 Year Age Group Jacknife Approach Lognormal
Parametric Model Best Fit Parametric
Model Max
Extreme Lognormal
N (sample) 1954 1954 - - - - Skewness naa na 0.74 0.77 1.47 0.77 Kurtosis na na 3.96 4.34 7.81 4.34 %-ile or mean L/kg-day L/day L/kg-day L/day L/kg-day L/day Sample Min 43 79 - - - - Mean (SE)b 752 (9) 7502 (91) 752 (1) 7568 (13) 752 (1) 7568 (13) 50%-ile (SE) 706 (7) 7193 (91) 720 7282 706 7282 75%-ile (SE) 870 (11) 9128 (91) 909 9201 871 9201 90%-ile (SE) 1094 (19) 11,502 (120) 1107 11,523 1094 11,523 95%-ile (SE) 1241 (24) 12,860 (170) 1241 12,895 1241 12,895 Sample Max 2584 24,411 - - - -
a Not applicable b SE = Standard error
Table 3.19b. Breathing Rate Distributions For the 2<9 Year Age Group Jacknife Approach Lognormal
Parametric Model Best Fit Parametric
Model Log-
normal Lognormal
N (sample) 6144 6144 - - - - Skewness naa na 0.95 0.86 0.95 0.86 Kurtosis na na 4.63 4.96 4.63 4.96 %-ile or mean L/kg-day L/day L/kg-day L/day L/kg-day L/day Sample Min 144 2661 - - - - Mean (SE) b 595 (4) 11,684 (82) 595 (1) 11,680 (16) 595 (1) 11,680 (16) 50%-ile (SE) 567 (5) 11,303 (70) 567 11,303 567 11,303 75%-ile (SE) 702 (5) 13,611 (110) 702 13,606 702 13,606 90%-ile (SE) 857 (7) 16,010 (170) 857 16,012 857 16,012 95%-ile (SE) 975 (9) 17,760 (229) 975 17,758 975 17,758 Sample Max 1713 31,739 - - - -
a Not applicable b SE = Standard error

Technical Support Document for Exposure Assessment and Stochastic Analysis, FINAL, August, 2012
3-34
Table 3.19c. Breathing Rate Distributions for the 2<16 Year Age Group Jacknife Approach Lognormal
Parametric Model Best Fit Parametric
Model Gamma Max
Extreme N (sample) 7624 7624 - - - - Skewness naa na 0.74 0.75 0.91 1.46 Kurtosis na na 3.97 4.02 4.38 7.26 %-ile or mean L/kg-day L/day L/kg-day L/day L/kg-day L/day Sample Min 57 2661 - - - - Mean (SE) b 481 (5) 14,090 (135) 481 (1) 14,094 (24) 481 (1) 14,095 (24) 50%-ile (SE) 450 (5) 13,128 (110) 456 13,465 451 13,131 75%-ile (SE) 603 (4) 16,644 (189) 606 17,239 603 16,655 90%-ile (SE) 764 (6) 20,993 (361) 763 21,214 763 20,993 95%-ile (SE) 869 (6) 23,879 (498) 868 23,870 868 23,886 Sample Max 1713 53,295 - - - -
a Not applicable b SE = Standard error
Table 3.19d. Breathing Rate Distributions for the 16<30 Year Age Group
Jacknife Approach Lognormal Parametric Model
Best Fit Parametric Model
Max Extreme
Lognormal
N (sample) 2155 2155 - - - - Skewness naa na 0.69 1.90 1.69 1.90 Kurtosis na na 3.75 11.15 8.94 11.15
%-ile or mean L/kg-day L/day L/kg-day L/day L/kg-day L/day Sample Min 23 1029 - - - - Mean (SE) b 197 (3) 13,759 (204) 200 (<1) 13,899 (31) 200 (<1) 13,899 (31) 50%-ile (SE) 180 (3) 12,473 (125) 190 12,494 182 12,494 75%-ile (SE) 238 (4) 16,975 (245) 259 17,192 242 17,192 90%-ile (SE) 320 (4) 21,749 (305) 331 22,136 323 22,136 95%-ile (SE) 373 (11) 26,014 (634) 378 26,481 377 26,481 Sample Max 976 75,392 - - - -
a Not applicable b SE = Standard error

Technical Support Document for Exposure Assessment and Stochastic Analysis, FINAL, August, 2012
3-35
Table 3.19e. Breathing Rate Distributions for the 16-70 Year Age Group Jacknife Approach Lognormal
Parametric Model Best Fit Parametric
Model Max
Extreme Lognormal
N (sample) 8512 8512 - - - - Skewness naa na 0.67 2.05 1.87 2.05 Kurtosis na na 3.74 12.35 10.67 12.35
%-ile or mean L/kg-day L/day L/kg-day L/day L/kg-day L/day Sample Min 13 740 - - - - Mean (SE) b 165 (2) 12,078 (134) 165 (<1) 12,074 (26) 165 (<1) 12,074 (26) 50%-ile (SE) 152 (1) 10,951 (86) 157 10,951 152 10,951 75%-ile (SE) 200 (1) 14,687 (141) 212 14,685 200 14,685 90%-ile (SE) 257 (3) 18,838 (173) 269 18,834 257 18,834 95%-ile (SE) 307 (4) 21,812 (371) 307 21,831 307 21,831 Sample Max 975 75,392 - -
a Not applicable b SE = Standard error
3.5.2 OEHHA-derived breathing rates based on the IOM DLW Database
The Institute of Medicine (IOM) 2005 dietary reference report includes an extensive database that is a compilation of DLW-derived energy expenditure results and other raw data for individuals collected from numerous studies. An advantage of this dataset over the U.S. EPA MET approach and the TAV approaches is that individual data on energy expenditure are matched with the weight and age of the individuals. The disadvantage is that the data are not necessarily representative of a random sample of a population.
When breathing rates were calculated from the energy expenditure data, it became apparent that there were some extreme individual breathing rates that did not appear physically possible. Using the results from the PAL limits (Section 3.4.4.3), breathing rates with a PAL greater than 2.5 were removed. Additionally, some breathing rates were below the expected BMR for an individual. Based on evidence that energy expenditure during sleep is 5 to 10% lower than the BMR, derived breathing rates that were 10% or more below the expected BMR were also removed (Brooks et al., 2004). However, relatively few individuals were removed due to an extreme breathing rate; <1 to 6% of the values were removed from any one age group.
Rather than assume a normal distribution for the age groupings as Brochu et al. (2006a) had done, OEHHA arranged the data to be more representative of a population by weighting the energy expenditure data by age and gender. The modeled populations were weighted towards an equal number of persons per year of age and the assumption was used that males and females in a population are at a ratio of 50:50. In addition, the IOM database separated individuals by weight, or more specifically, by body mass index

Technical Support Document for Exposure Assessment and Stochastic Analysis, FINAL, August, 2012
3-36
(BMI). Children 3 to 18 years of age are considered at risk of overweight when their BMI is greater than the 85th percentile, and overweight when their BMI is greater than the 95th percentile (Kuczmarski et al., 2000). Thus, the IOM (2005) placed overweight/obese children in a separate dataset. For the modeled populations, an 85:15 weighting for normal:overweight children in the 2<9 and 2<16 age groups was used. Adults (>19 years of age) were placed in the overweight/obese dataset if they had BMIs of 25 kg/m2 and higher by the IOM. The results from USDA’s 1994-96 Diet and Health Knowledge Survey (Tippett and Clevelend, 2001) found that 54.6% of the U.S. population have a BMI of 25 kg/m2 or greater (n=5530). Thus, for the adult age groups (16<30 and 16-70 yrs), 45:55 weighting for normal:overweight adults was used to model the populations.
For infants, the source of the raw data in the IOM (2005) database was from Butte et al. (2000), a DLW study conducted at the Children’s Nutrition Research Center in Houston, TX. Butte et al. (2000) monitored energy expenditure in 76 healthy infants by the DLW method up to six times during the study, at 3, 6, 9, 12, 18, and 24 months of age, generating a total of 351 measurements that fell within the OEHHA-specified 0<2 year age group. Thus, many of the infants were tested more than once during the study period. Following each administration of DLW by mouth, urine samples were collected over 10 days and analyzed for the hydrogen and oxygen isotopes to calculate energy expenditure.
The percentage of breast-fed infants at ages 3, 6, 9, 12, 18, and 24 months were 100%, 80%, 58%, 38%, 15%, and 5%, respectively in the Butte et al. (2000) study. The racial distribution by maternal lineage was 55 white, 7 African American, 11 Hispanic, and 3 Asian infants. The NCHS growth reference (Hamill et al., 1979) was used to evaluate the adequacy of growth in these infants. The growth performance of these infants was comparable with that of other breast-fed and formula-fed infant populations in whom socioeconomic and environmental constraints would not be expected to limit growth. Relative to the NCHS reference and compared with other breast-fed and formula-fed study populations, the growth of the children was considered satisfactory by the researchers.
Although the study did not choose subjects representative of any particular population, the range of activities that individuals of this age engage in is not as variable as the range of activities engaged in by older children and adults. In addition, even though many of the infants were tested more than once during the study period, repeated measures on the same individuals can reduce the amount of intraindividual variability in the distribution of measurements because a better estimate of typical energy expenditure is captured. Considering the limitations, the study results were judged by OEHHA to be similar enough to a randomly sampled population to calculate distributional statistics for breathing rate.
An additional observation from Butte et al. (2000) was that total energy expenditure measurements differed by age and by feeding group, but not by sex, when adjusted for weight. As expected, PAL increased significantly with age from 1.2 at 3 months to 1.4 at 24 months.

Technical Support Document for Exposure Assessment and Stochastic Analysis, FINAL, August, 2012
3-37
Breathing rates determined by the DLW method for women in their third trimester of pregnancy are presented separately in Section 3.5.4.
To obtain the daily breathing rate distributions for all age groups shown in Table 3.20a-e, OEHHA fit the data to a lognormal distribution using Crystal Ball® and sampled 250,000 times using Latin-Hypercube. The lognormal distribution is commonly used in stochastic risk assessment and has been found to be a reasonable parametric model for a variety of exposure parameters, including breathing rate. Latin-Hypercube analysis in Crystal Ball® was also used to determine the best parametric model fit for the distribution of breathing rates. The Anderson-Darling statistic was used for the goodness-of-fit test because it gives greater weight to the tails than to the center of the distribution.
Tables 3.20a-e. Breathing Rate Distributions by Age Group (Males and Females Combined) Derived from IOM (2005) DLW Database Using Parameter Estimates of Lognormal and Best Fit Distributions
Table 3.20a. 0<2 Year Age Group Breathing Rate Distribution Moments and
Percentiles, Empirical Data
Moments and Percentiles, Lognormal
Parametric Model
Moments and Percentiles,
Best Fit Parametric Model
N 281 281 Skewness -0.044 0.28 -0.001 0.44 -0.044 0.28 Kurtosis 2.10 2.59 3.00 3.35 2.10 2.59 L/kg-day L/day L/kg-day L/day L/kg-day L/day Beta Beta Sample Min 357 2228 - - - - Mean (SE) 567 5031 567 5031 567 5031 50%-ile 562 4967 567 4925 568 4943 80%-ile 657 6323 644 6232 655 6325 90%-ile 689 6889 685 6981 691 7042 95%-ile 713 7595 718 7638 714 7607 Sample Max 752 9210 - - - -

Technical Support Document for Exposure Assessment and Stochastic Analysis, FINAL, August, 2012
3-38
Table 3.20b. 2<9 Year Age Group Breathing Rate Distribution Moments and
Percentiles, Empirical Data
Moments and Percentiles, Lognormal
Parametric Model
Moments and Percentiles, Best
Fit Parametric Model
N 810 810 Skewness 0.0759 0.4676 0.0796 0.4763 0.0796 0.0290 Kurtosis 2.93 3.62 3.00 3.40 3.00 3.50 L/kg-day L/day L/kg-day L/day L/kg-day L/day Log-
normal Student’s
T Sample Min 240 5085 - - - - Mean (SE) 482 9708 482 9708 482 9711 50%-ile 479 9637 481 9521 481 9708 80%-ile 551 11,478 555 11,650 555 11,641 90%-ile 597 12,629 595 12,880 595 12,704 95%-ile 631 13,626 628 13,962 628 13,632 Sample Max 703 21,152 - - - -
Table 3.20c. 2<16 Year Age Group Breathing Rate Distribution Moments and
Percentiles, Empirical Data
Moments and Percentiles, Lognormal
Parametric Model
Moments and Percentiles, Best
Fit Parametric Model
N 1227 1237 Skewness 0.2729 0.8705 0.4613 1.12 0.2729 1.14 Kurtosis 2.45 3.70 3.38 5.32 2.45 5.43 L/kg-day L/day L/kg-day L/day L/kg-day L/day Beta Max Ext. Sample Min 168 5328 - - - - Mean (SE) 423 12,695 423 12,700 423 12,695 50%-ile 411 11,829 414 12,000 416 11,988 80%-ile 529 16,184 517 15,833 527 15,788 90%-ile 580 18,944 576 18,328 583 18,303 95%-ile 623 20,630 628 20,694 626 20,716 Sample Max 737 27,803 - - - -

Technical Support Document for Exposure Assessment and Stochastic Analysis, FINAL, August, 2012
3-39
Table 3.20d. 16<30 Year Age Group Breathing Rate Distribution Moments and
Percentiles, Empirical Data
Moments and Percentiles, Lognormal
Parametric Model
Moments and Percentiles, Best
Fit Parametric Model
N 245 245 Skewness 0.3471 0.4786 0.4008 0.6962 0.4008 0.6962 Kurtosis 3.03 3.11 3.28 3.88 3.28 3.88 L/kg-day L/day L/kg-day L/day L/kg-day L/day Log-
normal Log-
normal Sample Min 135 7246 - - - - Mean (SE) 222 16,458 222 16,464 222 16,464 50%-ile 220 16,148 219 16,053 219 16,053 80%-ile 256 19,468 259 19,395 259 19,395 90%-ile 282 21,954 282 21,410 282 21,410 95%-ile 308 23,295 302 23,231 302 23,231 Sample Max 387 26,670 - - - -
Table 3.20e. 16-70 Year Age Group Breathing Rate Distribution Moments and
Percentiles, Empirical Data
Moments and Percentiles, Lognormal
Parametric Model
Moments and Percentiles, Best
Fit Parametric Model
N 842 846 Skewness 0.4264 0.6323 0.4506 0.7346 0.4506 0.7346 Kurtosis 3.18 3.32 3.36 3.98 3.36 3.98 L/kg-day L/day L/kg-day L/day L/kg-day L/day Log-
normal Log-
normal Sample Min 95 7235 - - - - Mean (SE) 206 15,713 206 15,715 206 15,715 50%-ile 204 15,313 203 15,282 203 15,282 80%-ile 241 18,773 243 18,664 243 18,664 90%-ile 268 20,612 266 20,687 266 20,687 95%-ile 286 22,889 286 22,541 286 22,541 Sample Max 387 29,136 - - - -

Technical Support Document for Exposure Assessment and Stochastic Analysis, FINAL, August, 2012
3-40
3.5.3 OEHHA Age Group Breathing Rate Distributions Derived From U.S. EPA (2009) MET Approach
In Tables 3.21a-e, non-normalized (L/day) and normalized (L/kg-day) breathing rates for the specific OEHHA age groups were derived for both children and adults from the data included in the U.S. EPA (2009) report and presented above. Values for males and females were combined by taking weighted averages for each age range provided, assuming that the numbers of males and females in the population are equal. Ages were combined by the same means to create the age ranges of toxicological interest to the “Hot Spots” program.
The breathing rates used in preparation of the U.S. EPA report were derived by selecting an activity pattern set from a compilation of daily activity pattern sets (CHAD) and assigning them to a person in NHANES of the same sex and age group, although the age groups are fairly narrow for the very young (i.e., 3-month or 1-year intervals), the older age groups consist of broad age categories (i.e., 3 to 5 year intervals). These broad age groups include periods, for example 3 to <6 years, when activity can vary greatly by year of age. In addition, NHANES calculates a “sampling weight” for each participant, which represents the number of individuals in the population with the same set of these characteristics. When an individual in CHAD is matched to an individual in NHANES only on sex and age group, the set of characteristics that belonged to the CHAD individual are ignored, which could result in significantly different weighting. Thus the derived breathing rates cannot be considered representative of the population.
For these reasons and other limitations of the EPA data, as stated in Section 3.3.3.3, OEHHA chose to fit a selected set of parametric distributions to the percentile data given by U.S. EPA, rather than attempting to use the raw data to determine the best fit parametric model. A gamma distribution was fit to each age group using Crystal Ball®, which is usually one of the better fitting distributions for the right-skewed distributions typical of intake variability. The gamma distribution is a three parameter distribution with fewer shape constraints than two parameter distributions such as a lognormal distribution.
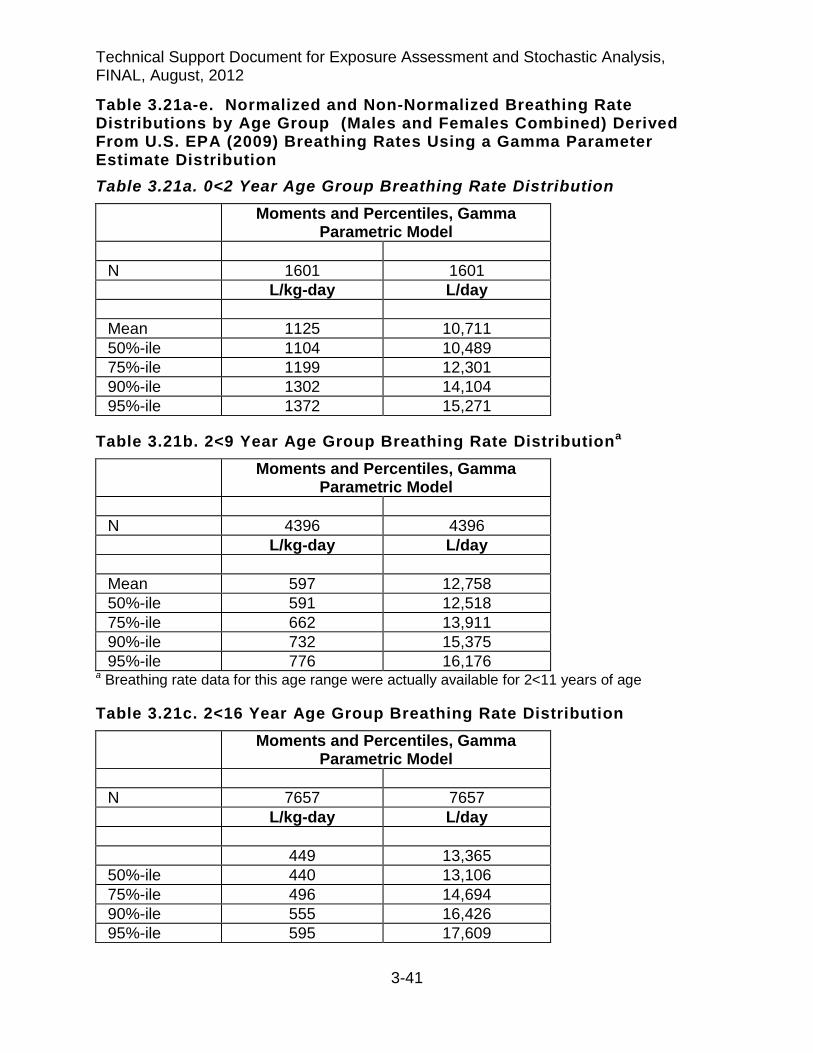
Technical Support Document for Exposure Assessment and Stochastic Analysis, FINAL, August, 2012
3-41
Table 3.21a-e. Normalized and Non-Normalized Breathing Rate Distributions by Age Group (Males and Females Combined) Derived From U.S. EPA (2009) Breathing Rates Using a Gamma Parameter Estimate Distribution Table 3.21a. 0<2 Year Age Group Breathing Rate Distribution
Moments and Percentiles, Gamma Parametric Model
N 1601 1601 L/kg-day L/day Mean 1125 10,711 50%-ile 1104 10,489 75%-ile 1199 12,301 90%-ile 1302 14,104 95%-ile 1372 15,271
Table 3.21b. 2<9 Year Age Group Breathing Rate Distributiona Moments and Percentiles, Gamma
Parametric Model N 4396 4396 L/kg-day L/day Mean 597 12,758 50%-ile 591 12,518 75%-ile 662 13,911 90%-ile 732 15,375 95%-ile 776 16,176
a Breathing rate data for this age range were actually available for 2<11 years of age
Table 3.21c. 2<16 Year Age Group Breathing Rate Distribution Moments and Percentiles, Gamma
Parametric Model N 7657 7657 L/kg-day L/day 449 13,365 50%-ile 440 13,106 75%-ile 496 14,694 90%-ile 555 16,426 95%-ile 595 17,609

Technical Support Document for Exposure Assessment and Stochastic Analysis, FINAL, August, 2012
3-42
Table 3.21d. 16<30 Year Age Group Breathing Rate Distributiona Moments and Percentiles, Gamma
Parametric Model N 6111 6111 L/kg-day L/day Mean 221 16,005 50%-ile 215 15,469 75%-ile 244 17,984 90%-ile 275 20,699 95%-ile 296 22,535
a Breathing rate data for this age range were actually available for 16<31 years of age
Table 3.21e. 16-70a Year Age Group Breathing Rate Distribution Moments and Percentiles, Gamma
Parametric Model N 16,651 16,651 L/kg-day L/day Mean 219 16,937 50%-ile 214 16,515 75%-ile 245 18,924 90%-ile 278 21,443 95%-ile 299 23,128
a Breathing rate data for this age range were given as 16<71 years of age
A limitation in calculating these breathing rates is that equal weighting by year of age was assumed when merging the U.S. EPA breathing rates into larger age groups used by OEHHA. However, this may not be a significant factor for the smaller age groups (i.e., 3rd trimester, 0<2, 2<9, 2<16, 16<30 yr old age groups), but could affect the breathing rate estimate for the 16-70 year olds. This is because a random sample of the population would find proportionally fewer adults in the 61 to 70 year age range, for example, compared to 21 to 30 year age range.
Another limitation is that merging the U.S. EPA age groups into the OEHHA age groupings does not yield the precise age range for 2<9 and 16 to <30 year olds. The actual age range in the US EPA data used to get the 16 to <30 year olds is 16 to <31, which we do not consider a significant deviation. However, the actual age range in the US EPA data used to get the 2 to <9 year olds is 2 to <11 years. The addition of 9 and 10 year olds would slightly reduce the normalized breathing rate in L/kg-day because younger children (i.e., 2<9 year olds) have higher normalized breathing rates than older children (i.e., 9-10 year olds). Alternatively, addition of 9 and 10 year olds to the 2<9 year age group would slightly increase the absolute breathing rate in L/day due to
Technical Support Document for Exposure Assessment and Stochastic Analysis, FINAL, August, 2012
3-43
higher volumes of air breathed per day by 9 and 10 year olds compared to younger children.
3.5.4 OEHHA-Derived Third Trimester Breathing Rates
For third trimester exposure, OEHHA calculated breathing rates using the assumption that the dose to the fetus during the third trimester was the same as that to the mother. Both the CSFII and DLW data sets included data from pregnant women that could be used to calculate breathing rates (Table 3.22). The DLW data included a code for trimester of pregnancy, while the CSFII data did not. Thus, breathing rates by the CSFII method was estimated using data for women in all stages of pregnancy with no means for separation by stage of pregnancy. OEHHA believes this would not underestimate the third trimester breathing rates, since the CSFII breathing rate data tend to overestimate the breathing rate in the upper (e.g., 95th percentile) and lower percentiles for the reasons cited in Section 3.4.3.2. Since breathing rate increases over the course of pregnancy, we felt that we could successfully combine these data with the DLW data and produce a reasonable set of point estimates for the third trimester.
In order to create a set of breathing rate data suitable for use in a stochastic risk assessment for third trimester pregnant women, we selected 1,000 observations from each set of data, normalized and non-normalized, using a Monte Carlo simulation in Crystal Ball®. Because the data sets from the two sources were similar in size, a relatively small set of simulated data was sufficient. We combined these data to create two sets of pooled data (see Section 3.2 above). We then fit a parametric distribution to each of the pooled samples, using Crystal Ball® and the Anderson-Darling goodness-of-fit test.

Technical Support Document for Exposure Assessment and Stochastic Analysis, FINAL, August, 2012
3-44
Table 3.22. Normalized and Non-Normalized Breathing Rate Distributions for Women in Their Third Trimester of Pregnancy: OEHHA-Derived Values from Doubly-Labeled Water (DLW) and Continuing Survey of Food Intake of Individuals (CSFII) Databases
DLW L/kg BW-day
CSFII L/kg BW-day
DLW L/day
CSFII L/day
Distribution Lognormal Gamma Lognormal Gamma Minimum 150 78 10,316 4,025 Maximum 348 491 23,932 29,041 Mean 220 232 15,610 14,830 Median 210 216 15,196 14,311 Std Dev 46 92 3,118 5,326 Skewness 1.19 0.5575 0.7744 0.4393 Kurtosis 4.04 2.57 3.57 3.02 Percentiles 1% 150 84 10,316 4,025 5% 161 104 10,809 7,714 10% 174 127 11,846 8,201 25% 192 155 13,750 11,010 50% 210 216 15,196 14,311 75% 241 302 17,343 18,153 80% 246 323 17,832 19,114 90% 280 363 18,552 21,799 95% 322 392 22,763 24,349 99% 348 490 23,932 28,848
3.5.5 Summary of Long-Term Daily Breathing Rate Distributions
Table 3.23 presents a summary of the long-term daily mean and high end (i.e., 95th percentile) breathing rates derived by OEHHA from different sets of energy expenditure data. The breathing rate distributions for women in their third trimester of pregnancy are presented separately in Table 3.22 above. The MET- (non-normalized only), CSFII- and DLW-derived breathing rates in Table 3.22 are based on the best fit parametric models for each age group, although little variation in the breathing rate was observed between models within each breathing rate method. Also included are data from TAV studies that estimated breathing rates in age groupings reasonably similar to that used by OEHHA.
As noted in Table 3.23, some of the age groupings for the MET-derived breathing rates, and all age groups in the TAV-derived breathing rates do not precisely reflect the age ranges used in the “Hot Spots” program. This was primarily due to methodological differences in data collection which did not allow individual breathing rates matched with the age of the individual. However, the differences in the age ranges were small

Technical Support Document for Exposure Assessment and Stochastic Analysis, FINAL, August, 2012
3-45
enough in many cases to allow a rough comparison among the various breathing rate estimation methods, so they were included in the table.
TABLE 3.23. Summary of Breathing Rate by Study and Age Group 0<2 yrs
L/kg-day 2<9 yrs
L/kg-day 2<16 yrs L/kg-day
16<30 yrs L/kg-day
16-70 yrs L/kg-day
mean 95th mean 95th mean 95th mean 95th mean 95th METa 1125 1372 597b 776b 449 595 221 c 296 c 219 299 CSFII d 752 1241 595 975 481 868 200 377 165 307 DLW e 567 713 482 628 423 626 222 302 206 286 TAV f Marty et al. Allan et al.
- -
- -
- -
- -
452 g -
580.5 g -
- -
- -
232 h 201 e
381 h 280 e
0<2 yrs L/day
2<9 yrs L/day
2<16 yrs L/day
16<30 yrs L/day
16-70 yrs L/day
mean 95th mean 95th mean 95th mean 95th mean 95th METa 10,711 15,271 12,758 16,176 13,365 17,609 16,005 22,535 16,937 23,128 CSFII d 7568 12,895 11,680 17,758 14,095 23,886 13,899 26,481 12,074 21,831 DLW e 5031 7595 9711 13,632 12,695 20,716 16,464 23,231 15,715 22,541 TAV f Marty et al. Allan et al.
- -
- -
- -
- -
8,100 g
-
10,500 g
-
- -
- -
14,600 h 16,160 i
24,000 h 22,480 i
a U.S. EPA metabolic equivalent (MET) approach breathing rate point estimates shown were derived using the best fit parametric model from Tables 3.20a-e. b All MET-derived breathing rates for the 2<9 yr age group actually represent 2<11 yr olds. c All MET-derived breathing rates for the 16<30 yr age group actually represent 16<31 yr olds. d CSFII food intake-derived breathing rate point estimates shown were derived using the best fit parametric model as presented in Tables 3.18a-e. e Doubly-labeled water-derived (DLW) breathing rate point estimates shown were derived using the best fit parametric model as shown in Tables 3.19a-e. f Time-activity-ventilation (TAV) breathing rate point estimates are from Table 3.3 (Marty et al. 2002) and Table 3.5 (Allan et al., 2008). g The breathing rate point estimates from Table 3.3 actually represent an age range of about 3 to <12 yrs old. The non-normalized breathing rate point estimates in L/day is the equivalent for an 18 kg child. h The breathing rate point estimates from Table 3.4 actually represent an age range of 12 to 70 years old. Non-normalized breathing rate point estimates in L/day are the equivalent for a 63 kg adult. i Breathing rate point estimates were derived from Table 3.5 and represent an age range of 12 to 60+ years. The point estimates were calculated assuming equal weighting for each age group (12-19 yrs, 20-59 yrs, 60+ yrs) and combined. Breathing rates in Table 3.5 were available only in L/day, so the non-normalized point estimates were both divided by the mean body weight for the 16-70 age group (80.3 kg) to generate breathing rates in L/kg-day.
The DLW energy expenditure data likely result in daily breathing rates that are slightly lower in some cases than what would be expected in a random population sample, particularly for adults (Black et al., 1996). On the other hand, U.S. EPA (2008) observed that the upper percentile breathing rates for the MET and CSFII approaches are unusually high for long-term daily exposures. Based on the limits of sustainable daily breathing rates for adolescents and adults discussed in Section 3.4.4.3, the 95th percentile breathing rates in Table 3.22 appear to be above sustainable limits for some age groups. For example, the CSFII-generated upper percentile breathing rates are
Technical Support Document for Exposure Assessment and Stochastic Analysis, FINAL, August, 2012
3-46
highest in the age groups containing older adolescents. The 16<30 year age group upper percentile breathing rate from the CSFII study is 377 L/kg-d. This breathing rate is above the sustainable breathing rate (based on PAL) of 283-353 L/kg-d for males 19-30 years of age shown in Table 3.16 (but is not above the sustainable breathing rates for the subgroup of males and females 14-18 yrs of age with a breathing rate of 332-513 L/kg-d).
A limitation of the estimated PALs for daily breathing rates determined in Tables 3.15 and 3.17 is that the participants used in the study may not reflect a random sample of the population. Nevertheless, the observed PAL of novice athletes training for endurance runs and soldiers during field training falls within this range of 2.0-2.5 (Westerterp, 1998; 2001). Thus, the breathing rates based on physical activity limits should be accurate for the general population, with the exception of professional endurance athletes in the most demanding sports (cross-country skiing and cycling) during training and competition.
With the advantages and disadvantages of the breathing rate datasets described in Section 3.2, OEHHA recommends using a daily breathing rate point estimates based on a mean of the DLW and CSFII approaches. The main benefit is the use of individual data from these two datasets, including individual body weights, which can be combined into one distribution. In order to create a set of breathing rate data suitable for use in a stochastic risk assessment of long-term daily average exposures, OEHHA combined data for each age range within the two sources of breathing rate data, CSFII and DLW. We selected an equal number of observations from each source for the five age ranges, normalized and non-normalized, using a Monte Carlo simulation in Crystal Ball® to create pooled data for each group. We then fit a parametric distribution to each of the pooled samples, using Crystal Ball® and the Anderson-Darling goodness-of-fit test.
For infants 0<2 yrs of age, OEHHA used the DLW data by Butte et al. (2000) for combining with CSFII study 0<2 yr data. This longitudinal study followed a group of about 40 infants collecting urine every 3 months after DLW administration from age 3 months to two years of age. The sample size was not considered large enough to use this data exclusively for determining the 0<2 yr breathing rates, so was combined with CSFII data of infants in the same age range.
3.6 8-Hour Breathing Rates
Specialized exposure scenarios for estimating cancer risk to offsite workers, neighborhood residents, and school children may involve evaluating exposure in the 8-12 hour range. Therefore, 8-hour breathing rates were estimated for exposed individuals engaged in activities that bracket the range of breathing rates including minimal inhalation exposure such as reading a book and desk work, and high breathing rates such as farm work or yard work, that can be reasonably sustained for an 8-hour period.

Technical Support Document for Exposure Assessment and Stochastic Analysis, FINAL, August, 2012
3-47
As part of the development of average daily breathing rates, U.S. EPA (2009) used existing data on minute ventilation rates (in ml/min or ml/kg-min) for a range of activities and assigned MET values depending on the intensity level of activity:
• Sedentary/Passive Activities: Activities with MET values no higher than 1.5 • Light Intensity Activities: Activities with MET values exceeding 1.5 to <3.0 • Moderate Intensity Activities: Activities with MET values exceeding 3.0 to <6.0 • High Intensity Activities: Activities with MET values exceeding 6.0
An additional ventilation rate distribution was developed for sleeping/napping only, although the sedentary/passive activity category (MET values ≤1.5) also includes sleeping and napping. Table 3.23 shows selected MET values for various workplace activities and activities in the home or neighborhood that were used to calculate daily breathing rates by U.S. EPA (2009).

Technical Support Document for Exposure Assessment and Stochastic Analysis, FINAL, August, 2012
3-48
Table 3.23. METS Distributions for Workplace and Home Activities Activity Description Mean Median SD Min Max
Workplace Activities Administrative office work 1.7 1.7 0.3 1.4 2.7 Sales work 2.9 2.7 1.0 1.2 5.6 Professional 2.9 2.7 1.0 1.2 5.6 Precision/production/craft/repair 3.3 3.3 0.4 2.5 4.5 Technicians 3.3 3.3 0.4 2.5 4.5 Private household work 3.6 3.5 0.8 2.5 6.0 Service 5.2 5.3 1.4 1.6 8.4 Machinists 5.3 5.3 0.7 4.0 6.5 Farming activities 7.5 7.0 3.0 3.6 17.0 Work breaks 1.8 1.8 0.4 1.0 2.5
Household/Neighborhood Activities Sleep or nap 0.9 0.9 0.1 0.8 1.1 Watch TV 1.0 1.0 - 1.0 1.0 General reading 1.3 1.3 0.2 1.0 1.6 Eat 1.8 1.8 0.1 1.5 2.0 Do homework 1.8 1.8 - 1.8 1.8 General personal needs and care 2.0 2.0 0.6 1.0 3.0 Indoor chores 3.4 3.0 1.4 2.0 5.0 Care of plants 3.5 3.5 0.9 2.0 5.0 Clean house 4.1 3.5 1.9 2.2 5.0 Home repairs 4.7 4.5 0.7 4.0 6.0 General household chores 4.7 4.6 1.3 1.5 8.0 Outdoor chores 5.0 5.0 1.0 2.0 7.0 Walk/bike/jog (not in transit) age 20 5.8 5.5 1.8 1.8 11.3 Walk/bike/jog (not in transit) age 30 5.7 5.7 1.2 2.1 9.3 Walk/bike/jog (not in transit) age 40 4.7 4.7 1.8 2.3 7.1
MET values and hr/day spent at these various activities were used by U.S. EPA (2009) to calculate selected minute ventilation rates shown in Table 3.24a-b.

Technical Support Document for Exposure Assessment and Stochastic Analysis, FINAL, August, 2012
3-49
Table 3.24a. Descriptive Statistics for Minute Ventilation Rates (L/min-kg) While Performing Activities Within the Specified Activity Category (US EPA, 2009) Age Category (years)
Males Females
Mean 50th 90th 95th Mean 50th 90th 95th Sedentary & Passive Activitiesa (METS ≤ 1.5) Birth to <1 0.40 0.39 0.47 0.50 0.40 0.40 0.48 0.52 1 0.41 0.40 0.49 0.52 0.43 0.42 0.51 0.54 2 0.34 0.34 0.41 0.45 0.36 0.35 0.42 0.44 3 to <6 0.25 0.25 0.33 0.35 0.25 0.25 0.33 0.36 6 to <11 0.16 0.16 0.21 0.22 0.16 0.16 0.21 0.23 11 to <16 0.10 0.10 0.13 0.14 0.10 0.09 0.12 0.13 16 to <21 0.08 0.08 0.09 0.10 0.07 0.07 0.10 0.10 21 to <31 0.06 0.06 0.08 0.08 0.06 0.06 0.07 0.08 31 to <41 0.07 0.07 0.08 0.09 0.06 0.06 0.08 0.08 41 to <51 0.07 0.07 0.09 0.09 0.06 0.06 0.08 0.09 51 to <61 0.07 0.07 0.09 0.09 0.07 0.07 0.08 0.09 61 to <71 0.08 0.08 0.09 0.09 0.07 0.07 0.08 0.08 Light Intensity Activities (1.5 < METS ≤ 3.0) Birth to <1 0.99 0.97 1.17 1.20 0.98 0.96 1.18 1.23 1 1.02 1.01 1.22 1.30 1.05 1.04 1.25 1.27 2 0.84 0.83 1.00 1.03 0.90 0.89 1.04 1.10 3 to <6 0.63 0.63 0.79 0.87 0.62 0.60 0.78 0.83 6 to <11 0.38 0.38 0.49 0.53 0.38 0.38 0.50 0.54 11 to <16 0.25 0.24 0.31 0.33 0.23 0.22 0.28 0.31 16 to <21 0.18 0.18 0.22 0.23 0.17 0.17 0.21 0.22 21 to <31 0.16 0.15 0.19 0.21 0.15 0.15 0.18 0.19 31 to <41 0.16 0.16 0.20 0.21 0.15 0.15 0.19 0.20 41 to <51 0.17 0.16 0.20 0.21 0.16 0.16 0.20 0.22 51 to <61 0.17 0.16 0.20 0.22 0.16 0.16 0.20 0.21 61 to <71 0.16 0.16 0.19 0.20 0.15 0.14 0.17 0.18 Moderate Intensity Activities (3.0 < METS ≤ 6.0) Birth to <1 1.80 1.78 2.18 2.28 1.87 1.85 2.25 2.40 1 1.88 1.82 2.33 2.53 1.90 1.87 2.24 2.37 2 1.55 1.54 1.84 2.02 1.60 1.58 1.92 2.02 3 to <6 1.17 1.12 1.56 1.68 1.14 1.11 1.45 1.56 6 to <11 0.74 0.71 0.96 1.04 0.72 0.71 0.94 1.01 11 to <16 0.49 0.47 0.64 0.68 0.44 0.43 0.55 0.61 16 to <21 0.39 0.38 0.49 0.52 0.36 0.35 0.46 0.49 21 to <31 0.36 0.34 0.47 0.51 0.33 0.32 0.42 0.45 31 to <41 0.36 0.34 0.47 0.52 0.32 0.30 0.41 0.46 41 to <51 0.37 0.35 0.47 0.52 0.33 0.32 0.44 0.49 51 to <61 0.38 0.37 0.48 0.55 0.34 0.33 0.44 0.49 61 to <71 0.34 0.34 0.40 0.42 0.29 0.28 0.35 0.37
a Sedentary and passive activities includes sleeping and napping

Technical Support Document for Exposure Assessment and Stochastic Analysis, FINAL, August, 2012
3-50
Table 3.24b. Descriptive Statistics for Minute Ventilation Rates (L/min) While Performing Activities Within the Specified Activity Category (US EPA, 2009) Age Category (years)
Males Females
Mean 50th 90th 95th Mean 50th 90th 95th Sedentary & Passive Activitiesa (METS ≤ 1.5) Birth to <1 3.18 3.80 4.40 4.88 3.00 2.97 4.11 4.44 1 4.62 5.03 5.95 6.44 4.71 4.73 5.95 6.63 2 4.79 5.35 6.05 6.71 4.73 4.67 5.75 6.22 3 to <6 4.58 5.03 5.58 5.82 4.40 4.34 5.29 5.73 6 to <11 4.87 5.40 6.03 6.58 4.64 4.51 5.88 6.28 11 to <16 5.64 6.26 7.20 7.87 5.21 5.09 6.53 7.06 16 to <21 5.76 6.43 7.15 7.76 4.76 4.69 6.05 6.60 21 to <31 5.11 5.64 6.42 6.98 4.19 4.00 5.38 6.02 31 to <41 5.57 6.17 6.99 7.43 4.33 4.24 5.33 5.79 41 to <51 6.11 6.65 7.46 7.77 4.75 4.65 5.74 6.26 51 to <61 6.27 6.89 7.60 8.14 4.96 4.87 6.06 6.44 61 to <71 6.54 7.12 7.87 8.22 4.89 4.81 5.86 6.29 Light Intensity Activities (1.5 < METS ≤ 3.0) Birth to <1 7.94 7.95 10.76 11.90 7.32 7.19 9.82 10.80 1 11.56 11.42 14.39 15.76 11.62 11.20 15.17 15.80 2 11.67 11.37 14.66 15.31 11.99 11.69 15.63 16.34 3 to <6 11.36 11.12 13.40 14.00 10.92 10.69 12.85 13.81 6 to <11 11.64 11.26 14.60 15.60 11.07 10.79 13.47 14.67 11 to <16 13.22 12.84 16.42 18.65 12.02 11.76 14.66 15.82 16 to <21 13.41 12.95 16.95 18.00 11.08 10.76 13.80 14.92 21 to <31 12.97 12.42 16.46 17.74 10.55 10.24 13.40 14.26 31 to <41 13.64 13.33 16.46 18.10 11.07 10.94 13.11 13.87 41 to <51 14.38 14.11 17.39 18.25 11.78 11.61 13.85 14.54 51 to <61 14.56 14.35 17.96 19.37 12.02 11.79 14.23 14.87 61 to <71 14.12 13.87 16.91 17.97 10.82 10.64 12.62 13.21 Moderate Intensity Activities (3.0 < METS ≤ 6.0) Birth to <1 14.49 14.35 20.08 22.50 13.98 13.53 19.41 22.30 1 21.35 20.62 26.94 28.90 20.98 20.14 27.09 29.25 2 21.54 20.82 26.87 29.68 21.34 21.45 27.61 28.76 3 to <6 21.03 20.55 25.60 27.06 20.01 19.76 23.83 25.89 6 to <11 22.28 21.64 27.59 29.50 21.00 20.39 26.06 28.08 11 to <16 26.40 25.41 33.77 36.93 23.55 23.04 28.42 31.41 16 to <21 29.02 27.97 38.15 42.14 23.22 22.39 30.28 31.98 21 to <31 29.19 27.92 38.79 43.11 22.93 21.94 30.02 32.84 31 to <41 30.30 29.09 39.60 43.48 22.70 21.95 28.94 31.10 41 to <51 31.58 30.44 40.28 44.97 24.49 23.94 30.79 33.58 51 to <61 32.71 31.40 41.66 45.77 25.24 24.30 31.87 35.02 61 to <71 29.76 29.22 36.93 39.98 21.42 20.86 25.72 27.32
a Sedentary and passive activities includes sleeping and napping
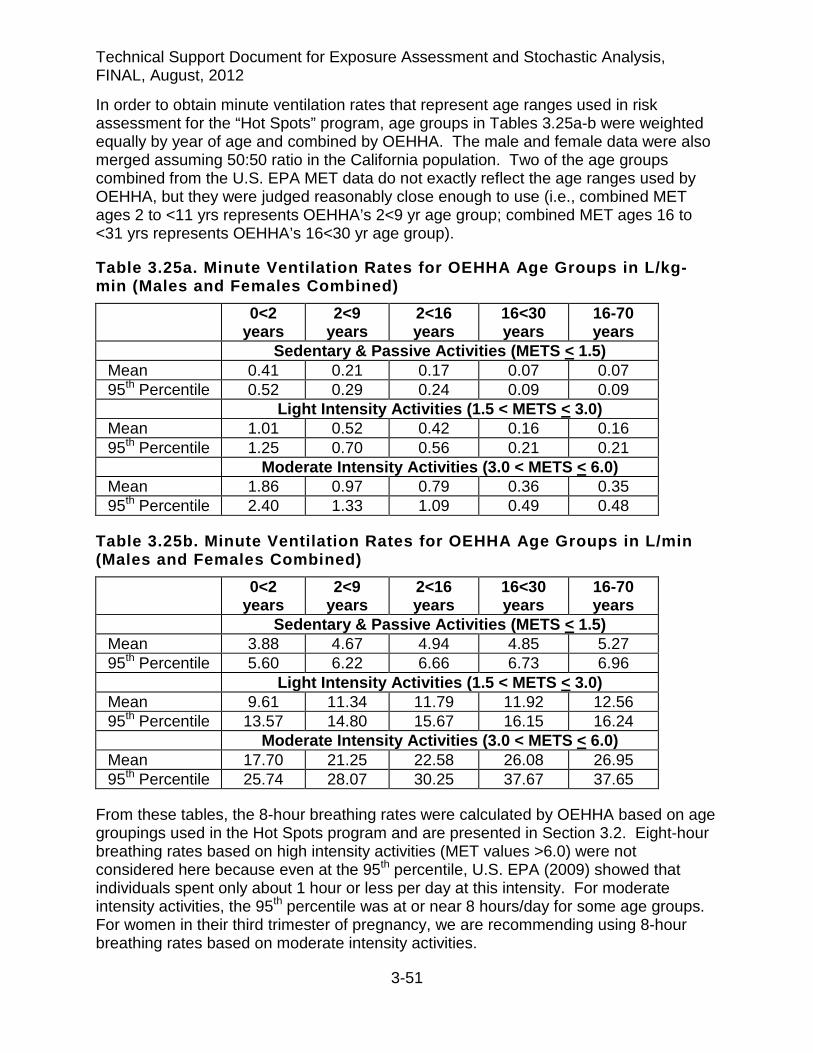
Technical Support Document for Exposure Assessment and Stochastic Analysis, FINAL, August, 2012
3-51
In order to obtain minute ventilation rates that represent age ranges used in risk assessment for the “Hot Spots” program, age groups in Tables 3.25a-b were weighted equally by year of age and combined by OEHHA. The male and female data were also merged assuming 50:50 ratio in the California population. Two of the age groups combined from the U.S. EPA MET data do not exactly reflect the age ranges used by OEHHA, but they were judged reasonably close enough to use (i.e., combined MET ages 2 to <11 yrs represents OEHHA’s 2<9 yr age group; combined MET ages 16 to <31 yrs represents OEHHA’s 16<30 yr age group).
Table 3.25a. Minute Ventilation Rates for OEHHA Age Groups in L/kg-min (Males and Females Combined)
0<2 years
2<9 years
2<16 years
16<30 years
16-70 years
Sedentary & Passive Activities (METS < 1.5) Mean 0.41 0.21 0.17 0.07 0.07 95th Percentile 0.52 0.29 0.24 0.09 0.09 Light Intensity Activities (1.5 < METS < 3.0) Mean 1.01 0.52 0.42 0.16 0.16 95th Percentile 1.25 0.70 0.56 0.21 0.21 Moderate Intensity Activities (3.0 < METS < 6.0) Mean 1.86 0.97 0.79 0.36 0.35 95th Percentile 2.40 1.33 1.09 0.49 0.48
Table 3.25b. Minute Ventilation Rates for OEHHA Age Groups in L/min (Males and Females Combined)
0<2 years
2<9 years
2<16 years
16<30 years
16-70 years
Sedentary & Passive Activities (METS < 1.5) Mean 3.88 4.67 4.94 4.85 5.27 95th Percentile 5.60 6.22 6.66 6.73 6.96 Light Intensity Activities (1.5 < METS < 3.0) Mean 9.61 11.34 11.79 11.92 12.56 95th Percentile 13.57 14.80 15.67 16.15 16.24 Moderate Intensity Activities (3.0 < METS < 6.0) Mean 17.70 21.25 22.58 26.08 26.95 95th Percentile 25.74 28.07 30.25 37.67 37.65
From these tables, the 8-hour breathing rates were calculated by OEHHA based on age groupings used in the Hot Spots program and are presented in Section 3.2. Eight-hour breathing rates based on high intensity activities (MET values >6.0) were not considered here because even at the 95th percentile, U.S. EPA (2009) showed that individuals spent only about 1 hour or less per day at this intensity. For moderate intensity activities, the 95th percentile was at or near 8 hours/day for some age groups. For women in their third trimester of pregnancy, we are recommending using 8-hour breathing rates based on moderate intensity activities.

Technical Support Document for Exposure Assessment and Stochastic Analysis, FINAL, August, 2012
3-52
3.7 Short-term (1-Hour) Ventilation Rates
SB-352 mandates school districts to conduct a risk assessment for school sites located within 100 meters of a freeway or busy roadway, and also mandates that the AB-2588 risk assessment guidance be used in the risk assessment. Assessing cancer risks due to exposure at a school site requires less than 24 hour breathing rates. OEHHA recommends breathing rates derived from the USEPA (2009) age-specific ventilation rates for these purposes.
The U.S. EPA ventilation rates were developed for various levels of activity and can be used to estimate inhalation cancer risk from short-term maximal emissions from facilities. Breathing rates for children at school can range from sedentary in the classroom to active on the playground or sports field. OEHHA assumes that in some cases, a day care facility will be present on the school site where children may be as young as 0<2 years of age. The age ranges that U.S. EPA (2009) presents are useful for estimating the impact of early-in-life exposure for school-age children. Classroom instructors (i.e., adults) are also considered under SB-352. If the soil ingestion or dermal pathways need to be assessed, OEHHA recommends the exposure variates presented elsewhere in this document. The public health protective approach is to assume that all daily dermal and soil ingestion exposure occurs at school.
As discussed in Section 3.6 above, U.S. EPA (2009) used existing data of ventilation rates (in ml/min or ml/kg-min) from a range of activities and assigned MET values depending on the intensity level of activity. Table 3.26 shows MET values various school-related activities collected from the CHAD database (U.S. EPA, 2009).
Table 3.26. METS Distributions for School-Related Activities Activity Description Mean Median SD Min Max Passive sitting 1.5 1.5 0.2 1.2 1.8 Use of computers 1.6 1.6 0.2 1.2 2.0 Do homework 1.8 1.8 - 1.8 1.8 Use library 2.3 2.3 0.4 1.5 3.0 Attending day-care 2.3 2.3 0.4 1.5 3.0 Attending K-12 schools 2.1 2.1 0.4 1.4 2.8 Play indoors 2.8 2.8 0.1 2.5 3.0 Play outdoors 4.5 4.5 0.3 4.0 5.0 Recess and physical education 5.0 5.0 1.7 2.0 8.0
For OEHHA’s purposes, the minute ventilation rates of males and females from Tables 3.24a-b were combined assuming a 50:50 proportional population distribution, and some age groups were combined assuming equal number of individuals in the population per year of age (Table 3.27a-b). For the SB-352, the child age groups were 0<2 years (infants), 2<6 years (preschool, kindergarten), 6<11 years (grade school), 11<16 (junior high and high school). From these minute ventilation rates, 1-hour ventilation rates are derived and presented in Section 3.2.
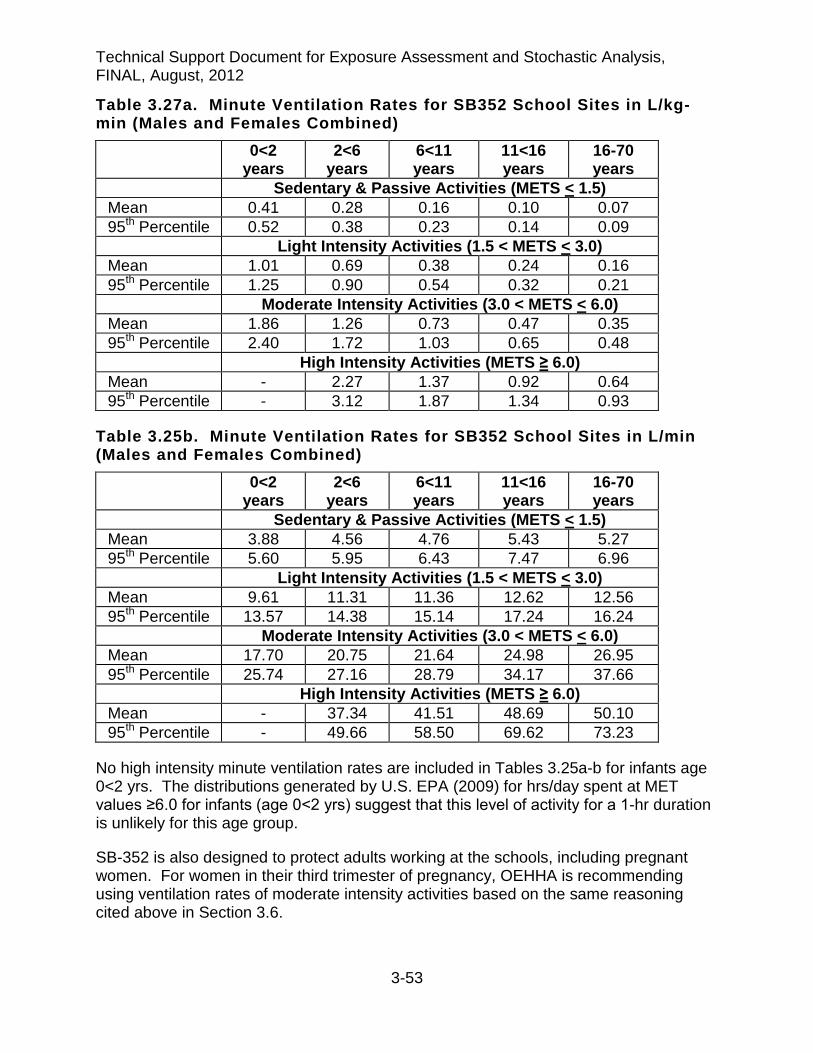
Technical Support Document for Exposure Assessment and Stochastic Analysis, FINAL, August, 2012
3-53
Table 3.27a. Minute Ventilation Rates for SB352 School Sites in L/kg-min (Males and Females Combined)
0<2 years
2<6 years
6<11 years
11<16 years
16-70 years
Sedentary & Passive Activities (METS < 1.5) Mean 0.41 0.28 0.16 0.10 0.07 95th Percentile 0.52 0.38 0.23 0.14 0.09 Light Intensity Activities (1.5 < METS < 3.0) Mean 1.01 0.69 0.38 0.24 0.16 95th Percentile 1.25 0.90 0.54 0.32 0.21 Moderate Intensity Activities (3.0 < METS < 6.0) Mean 1.86 1.26 0.73 0.47 0.35 95th Percentile 2.40 1.72 1.03 0.65 0.48 High Intensity Activities (METS ≥ 6.0) Mean - 2.27 1.37 0.92 0.64 95th Percentile - 3.12 1.87 1.34 0.93
Table 3.25b. Minute Ventilation Rates for SB352 School Sites in L/min (Males and Females Combined)
0<2 years
2<6 years
6<11 years
11<16 years
16-70 years
Sedentary & Passive Activities (METS < 1.5) Mean 3.88 4.56 4.76 5.43 5.27 95th Percentile 5.60 5.95 6.43 7.47 6.96 Light Intensity Activities (1.5 < METS < 3.0) Mean 9.61 11.31 11.36 12.62 12.56 95th Percentile 13.57 14.38 15.14 17.24 16.24 Moderate Intensity Activities (3.0 < METS < 6.0) Mean 17.70 20.75 21.64 24.98 26.95 95th Percentile 25.74 27.16 28.79 34.17 37.66 High Intensity Activities (METS ≥ 6.0) Mean - 37.34 41.51 48.69 50.10 95th Percentile - 49.66 58.50 69.62 73.23
No high intensity minute ventilation rates are included in Tables 3.25a-b for infants age 0<2 yrs. The distributions generated by U.S. EPA (2009) for hrs/day spent at MET values ≥6.0 for infants (age 0<2 yrs) suggest that this level of activity for a 1-hr duration is unlikely for this age group.
SB-352 is also designed to protect adults working at the schools, including pregnant women. For women in their third trimester of pregnancy, OEHHA is recommending using ventilation rates of moderate intensity activities based on the same reasoning cited above in Section 3.6.
Technical Support Document for Exposure Assessment and Stochastic Analysis, FINAL, August, 2012
3-54
3.8 References
Adams WC. (1993). Measurement of Breathing Rate and Volume in Routinely Performed Daily Activities. Final Report. Human Performance Laboratory, Physical Education Department, University of California, Davis. Prepared for the California Air Resources Board, Contract No. A033-205, April 1993.
Allan M and Richardson GM (1998). Probability density distributions describing 24-hour inhalation rates for use in human health risk assessments. Hum Ecol Risk Assess 4(2): 379-408.
Allan M, Richardson GM and Jones-Otazo H (2008). Probability density functions describing 24-hour inhalation rates for use in human health risk assessments: An update and comparison. Hum Ecol Risk Assess 14: 372-91.
Arcus-Arth A and Blaisdell RJ (2007). Statistical distributions of daily breathing rates for narrow age groups of infants and children. Risk Anal 27(1): 97-110.
Black AE, Coward WA, Cole TJ and Prentice AM (1996). Human energy expenditure in affluent societies: an analysis of 574 doubly-labelled water measurements. Eur J Clin Nutr 50(2): 72-92.
Brochu P, Ducre-Robitaille J-F and Brodeur J (2006a). Physiological daily inhalation rates for free-living individuals aged 1 month to 96 years, using data from doubly-labeled water measurements: A proposal for air quality criteria, standard calculations and health risk assessment. Hum Ecol Risk Assess 12: 675-701.
Brochu P, Ducre-Robitaille J-F and Brodeur J (2006b). Physiological daily inhalation rates for free-living individuals aged 2.6 months to 96 years based on doubly-labeled water measurements: Comparison with time-activity-ventilation and metabolic energy conversion estimates. Hum Ecol Risk Assess 12: 736-61.
Brooks GA, Butte NF, Rand WM, Flatt JP and Caballero B (2004). Chronicle of the Institute of Medicine physical activity recommendation: how a physical activity recommendation came to be among dietary recommendations. Am J Clin Nutr 79(5): 921S-930S.
Butte NF, Wong WW, Ferlic L, Smith EO, Klein PD and Garza C (1990). Energy expenditure and deposition of breast-fed and formula-fed infants during early infancy. Pediatr Res 28(6): 631-40.
Butte NF, Wong WW and Garza C (1989). Energy cost of growth during infancy. Proc Nutr Soc 48(2): 303-12.
Butte NF, Wong WW, Hopkinson JM, Heinz CJ, Mehta NR and Smith EO (2000). Energy requirements derived from total energy expenditure and energy deposition during the first 2 y of life. Am J Clin Nutr 72(6): 1558-69.

Technical Support Document for Exposure Assessment and Stochastic Analysis, FINAL, August, 2012
3-55
CDC. (2000). Centers for Disease Control and Prevention, National Health and Nutrition Examination Survey (NHANES) 1999-2000. U.S. Department of Health and Human Services, National Center for Health Statistics (NCHS), Hyattsville, MD. Available online at: http://www.cdc.gov/nchc/about/major/nhanes/nhanes99_00.htm.
CDC. (2002). Centers for Disease Control and Prevention, National Health and Nutrition Examination Survey (NHANES) 1999-2000. U.S. Department of Health and Human Services, National Center for Health Statistics (NCHS), Hyattsville, MD. Available online at: http://www.cdc.gov/nchc/about/major/nhanes/nhanes01-02.htm.
FAO. (2004a). Human Energy Requirements: Report of a Joint FAO/WHO/UNU Expert Consultation. United Nations, World Health Organization, Food and Agriculture Organization: Roma, Italy.pp. 107. ISBN: 9251052123; ISSN: 1813-3932. Available online at: http://www.fao.org/documents/show_cdr.asp?url_file=/docrep/007/y5686e/y5686e00.htm.
FAO. (2004b). Population energy requirements software (included in the Human energy requirements: Report of a Joint FAO/WHO/UNU Expert Consultation). Food and Agriculture Organization of the United Nations, World Health Organization: Roma, Italy. Vol. 2005. pp. 107. Available online at: http://www.fao.org/documents/show_cdr.asp?url_file=/docrep/007/y5686e/y5686e00.htm.
Finley B, Proctor D, Scott P, Harrington N, Paustenbach DJ and Price P (1994). Recommended distributions for exposure factors frequently used in health risk assessment. Risk Anal 14(4): 533-53.
Gossett JM, Simpson P, Parker JG and Simon WL (2002). How complex can complex survey analysis be with SAS? [abstract]. Proceedings, SAS Users Group International Meeting.Orlandao, April 14-17, 2002 (Cary, NC: SAS Institute Inc.) Paper 266-27.
Hamill PVV, Drizd TA, Johnson CL, Reed RB, Roche AF and Moore WM (1979). Physical growth: National Center for Health Statistics percentiles. Am J Clin Nutr 32: 607-29.
IOM (2005). Dietary Reference Intakes for Energy, Carbohydrate, Fiber, Fat, Fatty Acids, Cholesterol, Protein, and Amino Acids. Institute of Medicine, Food and Nutrition Board. National Academy Press, Washington DC. Available online at: http://books.nap.edu/openbook.php?isbn=0309085373.
Jenkins PL, Phillips TJ, Mulberg EJ and Hui SP (1992). Activity patterns of Californians: Use of and proximity to indoor pollutant sources. Atmos Environ 26A: 2141-8.
Kuczmarski RJ, Ogden CL, Grummer-Strawn LM, Flegal KM, Guo SS, Wei R, Mei Z, Curtin LR, Roche AF and Johnson CL (2000). CDC growth charts: United States. Adv Data(314): 1-27.
Technical Support Document for Exposure Assessment and Stochastic Analysis, FINAL, August, 2012
3-56
Layton DW (1993). Metabolically consistent breathing rates for use in dose assessments. Health Phys 64(1): 23-36.
Marty MA, Blaisdell RJ, Broadwin RL, Hill M, Shimer D and Jenkins M (2002). Distribution of daily breathing rates for use in California’s Air Toxics Hot Spots Program risk assessments. Hum Ecol Risk Assess 8(7): 1723-37.
NOLS (2012). Exerpt from the National Outdoor Leadership School First Aid manual. Online at: http://www.elbrus.org/eng1/high_altitude1.htm.
OEHHA (2000). Air Toxics Hot Spots Program Risk Assessment Guidelines. Part IV. Exposure Assessment and Stochastic Technical Support Document. Office of Environmental Health Hazard Assessment, California Environmental Protection Agency, Sacramento, CA. Available online at: http://www.oehha.ca.gov.
OEHHA (2009). Technical Support Document for Cancer Potency Factors:Methodologies for derivation, listing of available values, and adjustments to allow for early life stage exposures. California Environmental Protection Agency, Office of Environrmental Health Hazard Assessment. Online at:http://www.oehha.ca.gov/air/hot_spots/2009/TSDCancerPotency.pdf.
Phillips TJ, Jenkins PL and Mulberg EJ (1991). Children in California: Activity patterns and presence of pollutant sources. Proceedings of the 84th Annual Meeting and Exhibition of the Air and Waste Management Association, June 16-21, 1991.Vol 17: Vancouver, British Columbia, Canada, 91-172.5.
Scrimshaw NS, Waterlow JC and Schurch B (1996). Energy and Protein Requirements. Proceedings of an International Dietary and Energy Consultancy Group Workshop, 1994 Oct 31-Nov 4.London, UK: Stockton Press.
Snyder WS, Cook MJ and Nasset ES, et al. (1975). Report to the Task Group on Reference Man, International Commision on Radiological Protection, No 23. Pergamon Press, Oxnard, CA, USA, pp. 338-47.
Spady DW. (1981). Determination and expression of energy requirements. Joint FAO/WHO/UNU Expert Consultation on Energy and Protein Requirements: EPR Repository M2760/E; 2002. Available online at: <http://www.fao.org/docrep/meeting/004/M2760E/M2760E00.htm>.
Stifelman M (2007). Using doubly-labeled water measurements of human energy expenditure to estimate inhalation rates. Sci Total Environ 373(2-3): 585-90.
Tippett KS and Clevelend LE. (2001). Results From USDA's 1994-6 Diet and Health Knowledge Survey. U.S. Department of Agriculture, Nationwide Food Survey Report No. 96-4. Available online at: http://www.ars.usda.gov/SP2UserFiles/Place/12355000/pdf/dhks9496.PDF.

Technical Support Document for Exposure Assessment and Stochastic Analysis, FINAL, August, 2012
3-57
U.S. EPA (1991). OSWER Directive 9285.6-03 Human Health Evaluation Manual, Supplemental Guidance: "Standard Default Exposure Factors". PB91-921314.
U.S. EPA. (2002). CHAD user's guide: extracting human activity information from CHAD on the PC. Prepared by ManTech Environmental Technologies and modified March 22 2002 by Science Applications International Corporation for the National Exposure Research Laboratory, U.S. Environmental Protection Agency. Research Triangle Park, NC. Available online at: http://cfpub.epa.gov/ncea/cfm/recordisplay.cfm?deid=146583.
U.S. EPA (2008). Child-Specific Exposure Factors Handbook (Final Report). Chapter 6 - Inhalation Rates. U.S. Environmental Protection Agency, Washington, DC, EPA/600/R-06/096F, 2008. Available online at: http://cfpub.epa.gov/ncea/CFM/recordisplay.cfm?deid=199243.
U.S. EPA. (2009). Metabolically derived human ventilation rates: A revised approach based upon oxygen consumption rates. U.S. Environmental Protection Agency, National Center for Environmental Assessment, Washington, DC; EPA/600/R-06/129F.
U.S. EPA. (2011). Exposure Factors Handbook: 2011 Edition. U.S. Environmental Protection Agency. EPA/600/R-090/052F, Washington DC.
USDA. (2000). Continuing Survey of Food Intake by Individuals (CSFII) 1994-96, 1998. CD-ROM. U. S. Department of Agriculture, Agricultural Research Service.
Westerterp KR (1998). Alterations in energy balance with exercise. Am J Clin Nutr 68(4): 970S-974S.
Westerterp KR (2001). Limits to sustainable human metabolic rate. J Exp Biol 204(Pt 18): 3183-7.
Wiley JA, Robinson JP, Cheng YT, Piazza T, Stork L and Pladsen K. (1991b). Study of Children’s Activity Patterns, Final Report. Prepared for California Air Resources Board, Contract No. A733-149, September 1991.
Wiley JA, Robinson JP, Piazza T, Garrett K, Cirkensa K, Cheng YT and Martin G. (1991a). Activity Patterns of California Residents. Final Report. Survey Research Center, University of California, Berkeley. Prepared for California Air Resources Board, Contract No. A6-177-33, May 1991.