chapter 3: chemical testing
TRANSCRIPT

18
Chapter 3: Chemical Testing
Chemical Parameters Eight chemical tests are considered by the National Sanitation Foundation to be the most useful in determining stream water quality: 1. Dissolved Oxygen 2. E. coli 3. pH 4. Biochemical Oxygen Demand- 5 day (BOD-5) 5. Water Temperature Change 6. Total Phosphate 7. Nitrates 8. Turbidity
Times and Locations for Completing the Tests The table below provides estimated times for performing each of the tests and whether they must be completed on-site or off-site. If samples are taken off-site, they must be kept on ice or refrigerated until testing is complete (except BOD and turbidity). All tests should be completed the same day and as soon as possible to obtain the best results.
Chemical Test Time to Complete Location Dissolved Oxygen 5 min. On-site E. coli 24-48 hrs. to incubate On-site/Off-site pH 2 min. On-site Biochemical Oxygen Demand 5 days to incubate; 5 min. to test Off-site Water Temp. Change (1 mi.) <5 min. at each site On-site Total Phosphate 45 min. – 1 hr. On-site/Off-site Nitrates 15-20 min. On-site/Off-site Turbidity 5 min. On-site/Off-site
Water Quality Index RiverWatchers utilizes a Water Quality Index (WQI). The Water Quality Index provides a simple analysis of the results of the eight chemical tests. If you complete at least six of the eight tests, you can derive a single score that will indicate if the stream results are Excellent, Good, Medium, Bad or Very Bad for that particular monitoring session. Each of the tests is weighted according to its level of importance to the overall water quality (for this particular index). Example: Dissolved oxygen has the largest weighting factor; therefore, the results are the most important value in determining the Water Quality Index. In order to obtain a WQI Rating, you must first determine the Q-value for each test. You can think of a Q-value as a “Quality-value.” It helps interpret your results in terms of the overall health or water quality of your stream because it is a unitless value (unlike the measurement you
19
are taking which a reported in a variety of units). The higher the Q-value, the better the test results (100 is the maximum value; 0 is the minimum). After completing a chemical test, use the results to find the Q-value on a Q-chart. Each chemical has its own Q-chart. To find the Q-value: 1) Locate your test result on the bottom of the appropriate chart (x-axis); 2) Draw a vertical line up from your test result until it intersects the curved line (Q–line). From this point of intersection, draw a line across to the left hand side (y-axis); 3) Read the number on the left side of the chart closer to the intersection; this is the Q-value for that particular test result; 4) Record the Q-value in the second column on the Water Quality Index sheet. You can also check the Q-value table if your result is close to a given value.
Station Approach Many RiverWatchers groups test water in a classroom setting. It is often difficult to arrange students and tests so that maximum learning is occurring. A station approach is one way to accomplish this. The stations are grouped with related tests together. Not all RiverWatchers have the test kits necessary for all of these tests, so there is also information that can be used in general classroom discussions about water quality tests. Please feel free to modify the plans to fit your needs.
Reporting Water Quality Monitoring Data Water Quality Data can be reported in several ways: 1. Mail RiverWatchers Coordinator 5735 Kellogg Avenue Cincinnati, OH 45230 2. Fax 513-231-7761 3. Internet and Email http://riverlearning.org/program/volunteermonitoringprograms/ [email protected]
Chemical Testing Instructions Information for the Chemical Testing Instructions was modified with permission from the Hoosier Riverwatch Volunteer Stream Training Manual, which were modified with permission from the HACH Company and the Student Watershed Research Project/Saturday Academy of Oregon, and the LaMotte Company at: http://www.lamotte.com/en/support/instructions-manuals.
20
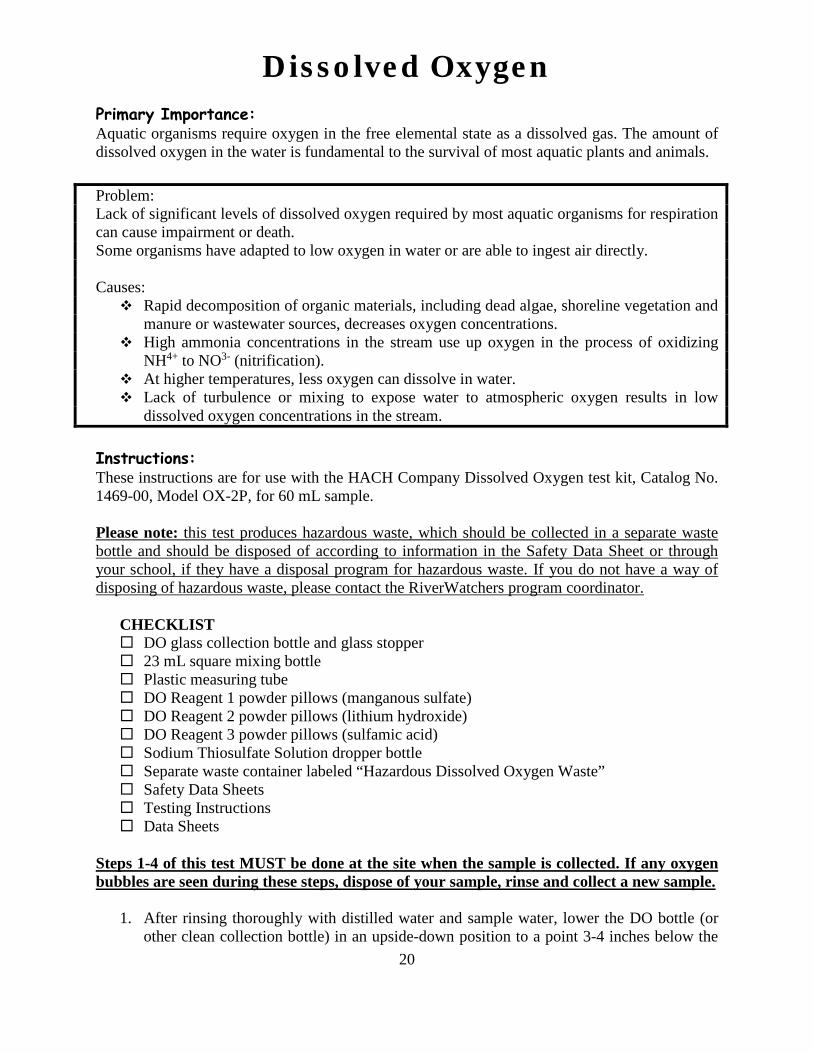
Dissolved Oxygen Primary Importance: Aquatic organisms require oxygen in the free elemental state as a dissolved gas. The amount of dissolved oxygen in the water is fundamental to the survival of most aquatic plants and animals. Problem: Lack of significant levels of dissolved oxygen required by most aquatic organisms for respiration can cause impairment or death. Some organisms have adapted to low oxygen in water or are able to ingest air directly. Causes: Rapid decomposition of organic materials, including dead algae, shoreline vegetation and
manure or wastewater sources, decreases oxygen concentrations. High ammonia concentrations in the stream use up oxygen in the process of oxidizing
NH4+ to NO3- (nitrification). At higher temperatures, less oxygen can dissolve in water. Lack of turbulence or mixing to expose water to atmospheric oxygen results in low
dissolved oxygen concentrations in the stream. Instructions: These instructions are for use with the HACH Company Dissolved Oxygen test kit, Catalog No. 1469-00, Model OX-2P, for 60 mL sample. Please note: this test produces hazardous waste, which should be collected in a separate waste bottle and should be disposed of according to information in the Safety Data Sheet or through your school, if they have a disposal program for hazardous waste. If you do not have a way of disposing of hazardous waste, please contact the RiverWatchers program coordinator. CHECKLIST DO glass collection bottle and glass stopper 23 mL square mixing bottle Plastic measuring tube DO Reagent 1 powder pillows (manganous sulfate) DO Reagent 2 powder pillows (lithium hydroxide) DO Reagent 3 powder pillows (sulfamic acid) Sodium Thiosulfate Solution dropper bottle Separate waste container labeled “Hazardous Dissolved Oxygen Waste” Safety Data Sheets Testing Instructions Data Sheets
Steps 1-4 of this test MUST be done at the site when the sample is collected. If any oxygen bubbles are seen during these steps, dispose of your sample, rinse and collect a new sample.
1. After rinsing thoroughly with distilled water and sample water, lower the DO bottle (or other clean collection bottle) in an upside-down position to a point 3-4 inches below the

21
water’s surface. Turn the bottle upright to an angle tilting upstream to reduce the risk of air bubbles. Allow water to flow into the bottle for approximately 2 minutes until the bottle is full and no air bubbles are present. While the bottle is underwater, place stopper in the top. Remove the bottle from the stream with the stopper in place. DO NOT pour off the excess water around the rim of the stopper. (Note: If pouring your sample from a collection bottle into the DO bottle, be careful not to agitate or splash the water into the bottle.)
2. Add Dissolved Oxygen 1 Reagent and Dissolved Oxygen 2 Reagent Powder Pillows to
the DO bottle (the order does not matter). Stopper the bottle, being very careful not to introduce air bubbles. (Note: Allow the excess water to spill over into a waster container.) If you get an air bubble, start over with step one. With your thumb firmly holding the stopper in place, grip the bottle and shake vigorously until the contents are evenly mixed. A flocculent (floc) precipitate will form. If oxygen is present in the sample, the precipitate will appear brownish-orange in color. A small amount of powdered reagent may remain at the bottom of the bottle. This will not affect the test results.
3. Allow the sample to stand until the floc has settled below the DO bottle’s white line. The
upper half of the sample will be clear. Shake the bottle again to remix and allow it to resettle in the same manner as above. (Note: the floc will not settle in samples with high concentrations of chloride. Allow a maximum of five minutes for the floc to settle. If no additional progress is made, proceed with the next step.)
4. Add the contents of Dissolved Oxygen 3 Reagent Powder Pillow. Carefully replace the
stopper and shake the bottle to mix. The floc will dissolve, creating a yellowish-amber color if DO is present. (Note: Small, rust colored flakes may remain, but will not affect the test results.) At this point, the oxygen is “fixed” and any oxygen bubbles formed after this step will not affect the results of the test.
5. Fill the sturdy, 5 mL measuring tube (1 cm width x 8.5 cm length—if you can stick your
little finger inside the tube, it’s the wrong one!) to its top with the prepared sample into the square mixing bottle. (Note: Do not discard the rest of the fluid in the DO bottle until you have successfully completed the rest of this test.)
6. Using the dropper located within the bottle marked Sodium Thiosulfate Standard
Solution, add this solution drop by drop to the prepared sample in the mixing bottle. Count each drop as it is added and gently swirl to mix the solution until it becomes colorless. Once the prepared sample is clear, add one more drop to ensure a complete color change, if there is no change in color, do not count the last drop. (Note: Hold the dropper vertically above the mixing bottle’s mouth when adding drops to ensure the proper volume of titrant. Do not place the dropper inside the mouth of the square bottle as you may contaminate the dropper.) Also, rinse thoroughly any surface, including your hands, that has contacted the above chemical as it may eat holes in your clothing or irritate your skin.)
7. Each drop added to bring about the color change in Step 6 equals the presence of 1.0
mg/L of dissolved oxygen. (Note: If the result of Step 6 is 3 mg/L or less, follow the Low-range instructions provided below.)

22
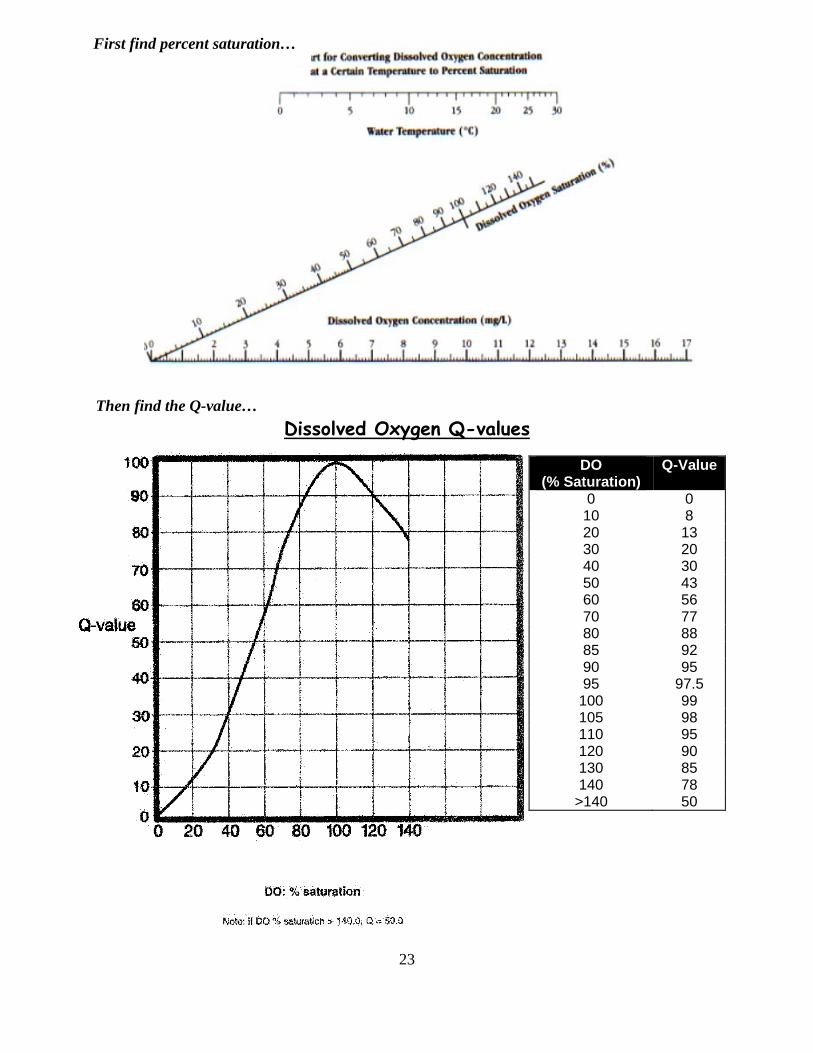
8. Use the graph on the next page to calculate percent saturation. By running a straight edge from the appropriate water temperature reading to oxygen mg/L, you will be able to determine percent saturation along the angled scale. Look at the water temperature change directions for the Celsius/Fahrenheit conversion.
9. Record DO to the nearest 1.0 mg/L and record the percent saturation.
EXAMPLE: Water temperature at site=16°C Dissolved oxygen=8 mg/L = 80% saturation (look on chart)
10. You may also use the following formula to determine percent saturation: DO mg/L (your sample) / DO mg/L needed for your sample to be 100% saturated EXAMPLE: At your sampling location, you recorded a water temperature of 19°C and a DO of 6 mg/L. Based upon the chart in your book, the DO reading (mg/L) for the water to be 100% saturated at 19°C = 9.3 mg/L. Therefore, 6 / 9.3 * 100 = 64.5%.
11. Dispose of ALL waste in a hazardous waste container. Dissolved Oxygen Low-range (0.2-4 mg/L)
1. Use the prepared sample left from Step 5 of the High-range test. Pour off the contents of the DO bottle until the level reaches the 30 mL mark on the bottle.
2. Add Sodium Thiosulfate Standard Solution one drop at a time to the DO bottle. Count
each drop as it is added and gently swirl to mix the solution until it becomes colorless. Once the prepared sample is clear, add one more drop to ensure a complete color change. If there is no change in color, do not count the drop.
3. Multiply the number of drops used by 0.2 to obtain the mg/L Dissolved Oxygen.
EXAMPLE: 15 drops x 0.2=3 mg/L DO
4. Record DO in mg/L and percent saturation.
5. Dispose of ALL waste in a hazardous waste container.
TYPICAL RANGE FOR DO = 5.4 to 14.2mg/L
23
Then find the Q-value…
Dissolved Oxygen Q-values
DO (% Saturation)
Q-Value
0 0 10 8 20 13 30 20 40 30 50 43 60 56 70 77 80 88 85 92 90 95 95 97.5
100 99 105 98 110 95 120 90 130 85 140 78
>140 50
First find percent saturation…

24
E. coli Primary Importance: Fecal coliform bacteria are found in the feces of warm-blooded animals, including humans, and are naturally present in the intestines of animals. E. coli is a type of fecal coliform bacteria that can lead to illness and indicate other pathogenic (disease-causing) bacteria in water. The presence of E. coli is an indicator of fecal contamination. Problem: A high number of E. coli colonies indicate a potential problem for humans. Fecal coliforms are bacteria found in the feces of warm-blooded animals. While fecal coliforms themselves are not particularly harmful, the presence of large amount can indicate the presence of more harmful bacteria such as those that cause typhoid, cholera, and Hepatitis A. Ingestion of the other bacteria sometimes found with E. coli could lead to gastrointestinal distress and eye, nose and throat infections. Causes: Raw sewage dumped into rivers through Combined Sewer Overflows during heavy rains. Movement of feces to stream from animal farms or from animals utilizing streams or
lakes for wading, drinking, or cooling. Instructions: The following instructions are adapted from those provided by Micrology Laboratories, Inc., for use with their patented Coliscan Easygel method. Please refer to the Color Guide identification sheets for interpretation of results. CHECKLIST Pre-treated petri dishes (only available from Micrology Laboratories) Sterile pipettes Whirl-Pak bags or other sterile container Bottle of Coliscan Easygel Permanent marker Tape Rubber gloves Ice and cooler (if plating off-site) Bleach and water-tight bag for disposal Material Safety Data Sheets Testing Instructions Data Sheets
DO NOT rinse these materials before or after use. Follow instructions below.
1. Before you begin, label the top (lid) of the petri dish with a permanent marker. Include the date, time, location and volume (mL) of sample used. Also, remove Coliscan Easygel bottle from freezer and allow to defrost.
2. Wearing gloves and using only sterile equipment, obtain a sample for testing in one of
two ways. Either collect your water sample in a sterile container (e.g. Whirl-Pak bag) and transport the water to an appropriate test site, or take a measured sample directly from the
25
source using a sterile pipette and immediately place it into the bottle of Coliscan Easygel. In either case, obtain the sample slightly below the surface of the waterway you are testing. (Note: Water samples kept longer than 1 hour prior to plating, or any Coliscan Easygel bottle that has a sample placed into it for transport longer than 10 minutes, should be kept on ice or in a refrigerator.)
3. Transfer a measured amount of water from the sample container/source into the bottle of
Coliscan Easygel. (Note: For safety purposes and easier identification, the amount of sample transferred will vary according to the suspected condition of the surface water you are testing. If you suspect a high fecal coliform count due to contamination, transfer only 1 mL of sample. Typically, however, 3-5 mL is appropriate.) Once the sample is transferred, swirl the bottle to distribute the Easygel mixture and then pour into the labeled petri dish. Being careful not to splash over the side or onto the lid, gently swirl and rock the filled dish until the mixture is evenly distributed.
4. While its contents are still in liquid form, place the dish right side up directly into a warm
level spot indoors. Solidification will occur in approximately 45 minutes.
5. Turn the petri dish upside down (to reduce condensation) and incubate at 35°C for 24 hours or at room temperature for 48 hours.
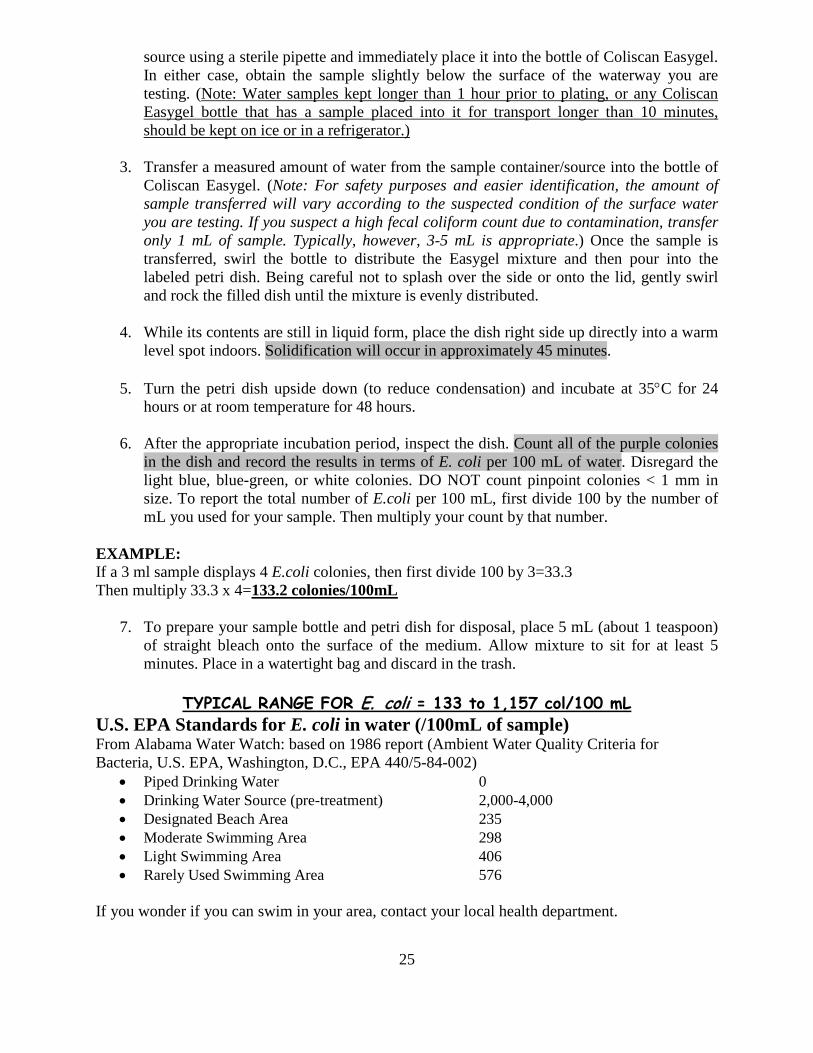
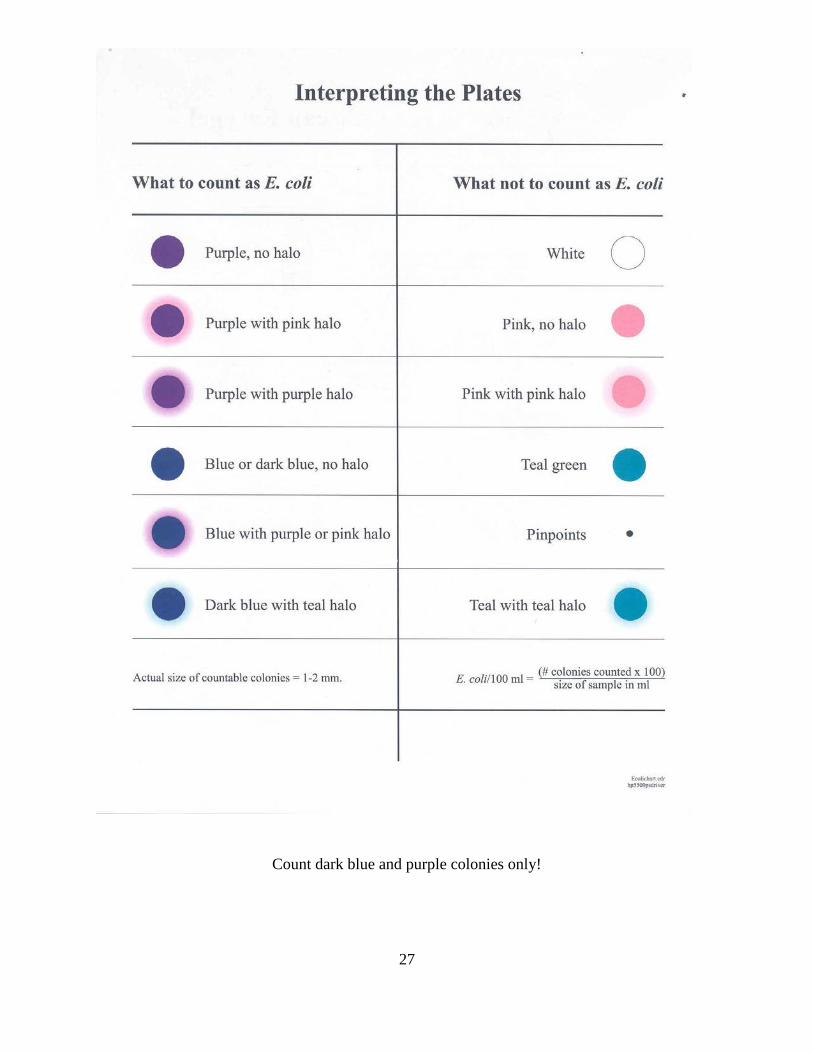
6. After the appropriate incubation period, inspect the dish. Count all of the purple colonies
in the dish and record the results in terms of E. coli per 100 mL of water. Disregard the light blue, blue-green, or white colonies. DO NOT count pinpoint colonies < 1 mm in size. To report the total number of E.coli per 100 mL, first divide 100 by the number of mL you used for your sample. Then multiply your count by that number.
EXAMPLE: If a 3 ml sample displays 4 E.coli colonies, then first divide 100 by 3=33.3 Then multiply 33.3 x 4=133.2 colonies/100mL
7. To prepare your sample bottle and petri dish for disposal, place 5 mL (about 1 teaspoon) of straight bleach onto the surface of the medium. Allow mixture to sit for at least 5 minutes. Place in a watertight bag and discard in the trash.
TYPICAL RANGE FOR E. coli = 133 to 1,157 col/100 mL
U.S. EPA Standards for E. coli in water (/100mL of sample) From Alabama Water Watch: based on 1986 report (Ambient Water Quality Criteria for Bacteria, U.S. EPA, Washington, D.C., EPA 440/5-84-002)
• Piped Drinking Water 0 • Drinking Water Source (pre-treatment) 2,000-4,000 • Designated Beach Area 235 • Moderate Swimming Area 298 • Light Swimming Area 406 • Rarely Used Swimming Area 576
If you wonder if you can swim in your area, contact your local health department.

26
27
Count dark blue and purple colonies only!
28
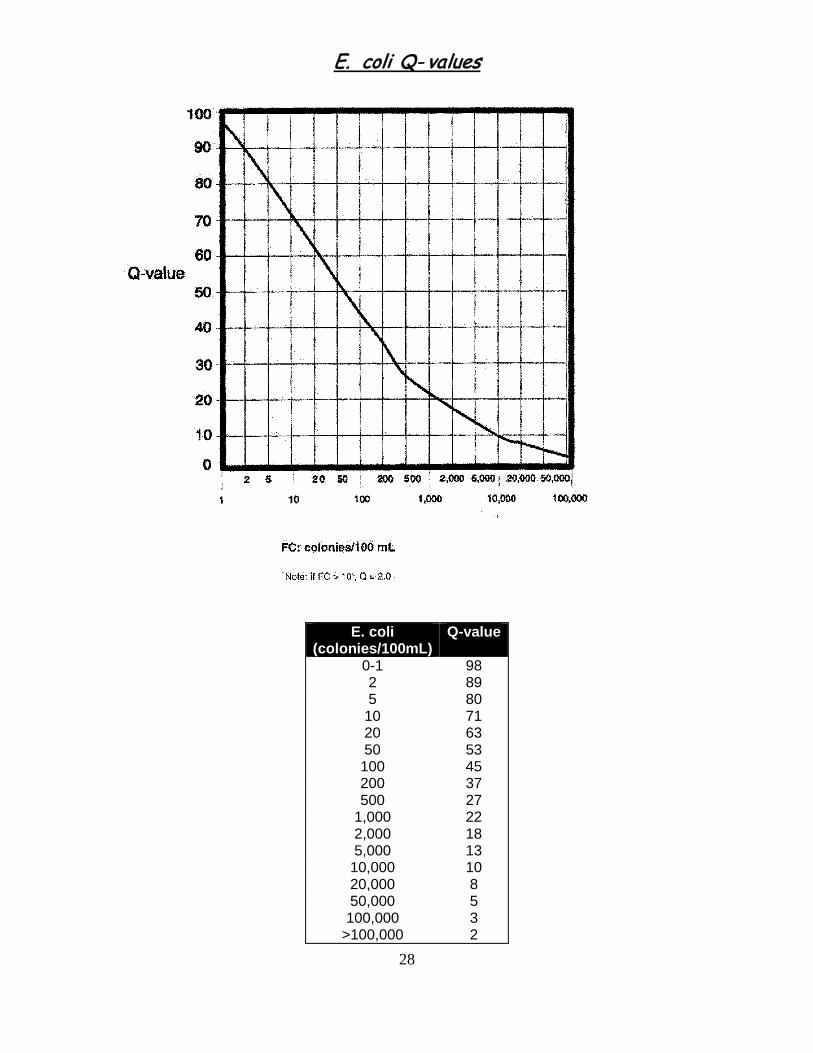
E. coli Q- values
E. coli (colonies/100mL)
Q-value
0-1 98 2 89 5 80
10 71 20 63 50 53 100 45 200 37 500 27
1,000 22 2,000 18 5,000 13
10,000 10 20,000 8 50,000 5 100,000 3
>100,000 2

29

30
pH Primary Importance: pH is a measure of hydrogen ions and hydroxide ions in water. The concentrations of these ions determine if a substance is acidic or basic. Aquatic organisms are sensitive to pH, especially during reproduction. pH also affects the toxicity of many substances in water that can potentially affect humans and aquatic life. Problem: Aquatic organisms can be very sensitive to high or low pH, particularly pH values that are less than 6 or greater than 8. The reproductive portion of the growth cycle is especially sensitive. Adult organisms may continue to live, but young will not be produced. Even small fluctuations in pH levels can adversely affect organisms. Causes: Algal blooms may raise pH. In extreme cases, the pH may be above 9. Many industrial processes result in release of acids and bases, thus raising or lowering pH.
Instructions:

31

32
TYPICAL RANGE FOR pH = 6.6 to 8.8
pH Q Values pH
(units) Q-Value
<2 0 2 2 3 4 4 8 5 24 6 55 7 90
7.2 92 7.5 93 (max) 7.7 90 8 82
8.5 67 9 47
10 19 11 7 12 2
>12 0
pH scale of Common Substances and
Aquatic Organisms

33

34
Biochemical Oxygen Demand (BOD 5-Day)
Primary Importance: The amount of oxygen consumed by bacteria in water (BOD) affects the amount of dissolved oxygen available for aquatic life. High BOD levels are associated with excessive plant growth and decay and high amounts of other organic matter in a river or stream. Problem: High levels of organic matter and some ions (ammonia in particular) can lead to rapid exhaustion of dissolved oxygen. Causes: Municipal wastewater that has not been completely treated to allow decomposition of
organic materials will use up oxygen supplies. Septic tank effluent, which is characterized by green patches of vegetation during the dry
season also uses up oxygen supplies. Cool periods can kill some algae, and the dead algae decompose rapidly.
Instructions: In addition to a black, light-free bottle, use the HACH Company DO test kit with Catalog No. 1469-00, Model OX-2P, for 60 mL sample.
CHECKLIST Black BOD bottle (or use aluminum foil around DO bottle) All materials required for DO test (see list on page 16)
1. In the same manner described in the DO testing instructions, lower a stoppered black
(light-free) bottle below the water’s surface. Once it is submerged to the appropriate depth, remove the stopper and allow water to flow into the bottle for approximately two minutes. Ensuring that no air bubbles exist, replace the stopper and remove the bottle from the water.
2. Place the biochemical oxygen demand (BOD) sample in a light-free location and allow it
to sit undisturbed for 5 days.
3. After 5 days, remove the BOD bottle and carefully transfer the water to a clean DO bottle until the sample overflows. Cap the DO bottle and do not pour off the water gathered around the rim. Avoid splashing, as oxygen could enter the sample through aeration. Retain the water remaining in the BOD bottle in case more sample water is needed.
4. Perform Steps 2 through 8 of the DO test. If results are <3 mg/L, follow Low-range DO
test instructions.
5. Determine the BOD level by subtracting the mg/L of the BOD sample from that of the original DO sample taken 5 days prior.

35
6. Dispose of waste in container marked “Hazardous DO Waste”.
EXAMPLE: 11.5 mg/L (original DO sample) – 6 mg/L (BOD5) = 5.5 mg/L NOTE: Collect water samples for the BOD-5 test and the DO test on the same day. When pouring the sample from the BOD bottle to the DO bottle, pour slowly so you don’t create bubbles, since this will alter your results.
TYPICAL RANGE FOR BOD = 0 to 6.3 mg/L
Biochemical Oxygen Demand Q-values
BOD (mg/L DO)
Q-Value
0 96 1 92 2 80
2.5 73 3 66 4 58 5 55
7.5 44 8 40 10 33
12.5 26 15 20
17.5 16 20 14
22.5 10 25 8
27.5 6 30 5
>30 2

36
Water Temperature Change Primary Importance: Temperature affects metabolic rates and reproductive function of many aquatic organisms. Temperature also affects other chemical parameters, such as the amount of dissolved oxygen in water. Dissolved oxygen levels are lower at higher temperatures.
Problem: Aquatic organisms have narrow optimal temperature ranges. In particular, oxygen gas is not as soluble in warm water as it is in cold water, so it is easier for biological processes to run out of oxygen. Causes: Loss of shading in the riparian zone can allow temperature to increase due to sunlight
hitting the water. In summer, passage through shaded sections can lead to cooling. This occurs because
soils are cooler than air during much of the summer. Release of water from ponds or other exposed standing water sources can increase
temperatures. Municipal wastewater and industrial discharges can have elevated temperatures.
Instructions: CHECKLIST Celsius thermometer (Don’t forget to convert if using Fahrenheit readings!) Testing Instructions Data Sheets
1. At the sampling site, lower the bottom half of the thermometer below the water’s surface
(the same depth at which the other tests were performed). If possible, obtain the temperature reading in an area where the water is flowing.
2. Swirling gently, hold the thermometer in the water for approximately two minutes or
until the thermometer reading stabilizes.
3. Record your reading in degrees Celsius. (Note: Use the following equation to convert Fahrenheit to Celsius.)
C= (F-32.0)/1.8 OR F=(C x 1.8) + 32
4. Choosing a portion of the stream with roughly the same degree of shade and velocity as in step 1, conduct the same test approximately 1 mile upstream as soon as possible. (Note: Use the same thermometer in order to reduce the possibility of equipment error.)
5. Calculate the difference between the upstream and downstream results. Record the
temperature change in degrees Celsius. EXAMPLE: 15°C downstream -14°C upstream= 1°C temperature change
37
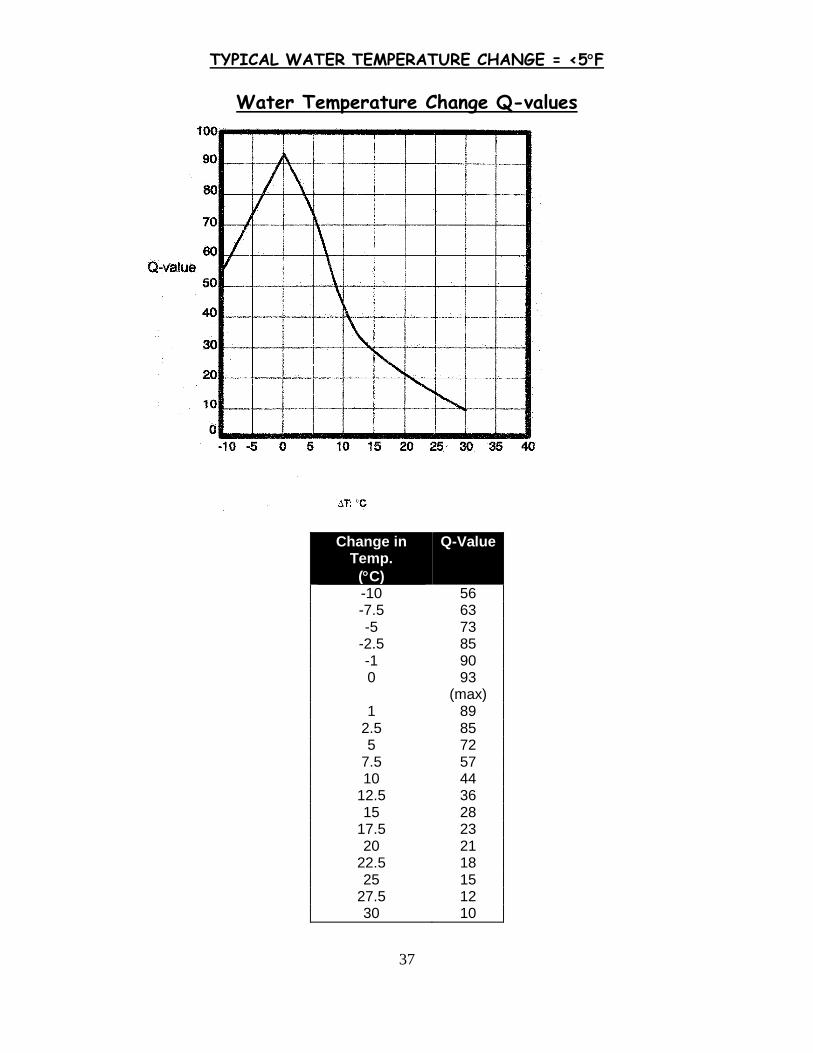
TYPICAL WATER TEMPERATURE CHANGE = <5°F
Water Temperature Change Q-values
Change in Temp.
(°C)
Q-Value
-10 56 -7.5 63 -5 73
-2.5 85 -1 90 0 93
(max) 1 89
2.5 85 5 72
7.5 57 10 44
12.5 36 15 28
17.5 23 20 21
22.5 18 25 15
27.5 12 30 10
38
Orthophosphate & Total Phosphate
Primary Importance: Phosphorus is an essential nutrient for plant and animal life. It occurs naturally in the environment in small amounts. High levels of phosphorus can lead to algal blooms and excessive nutrients in the water. Fertilizers, detergents and sediment are major sources of added phosphorus in the environment. Problem: Most fresh water, but not all, is naturally deficient in phosphorus, thus algal growth is limited. If excessive phosphorus enters the surface waters, it can support rapid algal growth rates. When the algae die, their decomposition uses up oxygen and produces odors and toxins. Causes: Phosphorus occurs naturally in geological and soil sources, and enriched groundwater can
contain high levels of phosphorus. Phosphorus can come from manure sources, such as treatment lagoons, over-fertilized
fields, and runoff from agricultural fields and turf grass. Suspended sediments are often a significant source of phosphorus. These may enter the
stream via stream bank erosion or runoff from forestry, agriculture, and urban lands. In soils that contain it, phosphorus can be removed from particles and enter solution.
Runoff from parking lots and urban lands is often excessively high in phosphorus. Inadequately treated municipal wastewater and septic tank effluent that has not fully reacted with soil are both sources of phosphorus.
General Instructions: All glassware to be used for these tests should be acid washed with a dilute hydrochloric acid solution (10:1) and triple washed with distilled water before each use. The glassware (droppers and tubes) should be dedicated for the purpose of analyzing phosphorus samples and should never be washed with detergent or soap as these often contain phosphorus.
Orthophosphate vs. Total Phosphate Orthophosphate readings include only the phosphate loose in the water, while Total Phosphate includes phosphate loose in the water in addition to phosphate connected to other molecules or substances in the water. Therefore, Orthophosphate (OP) is a component of Total Phosphate (TP), thus OP<TP. The Water Quality Index calls for the Total Phosphate reading, and should not be confused with the Orthophosphate reading. Range Tests These tests have three levels: low, medium and high range. The “range” corresponds to the relative amount of chemical in the sample. If a high phosphate reading is suspected, the high range test (dilution) should be performed. If the high range test is not performed, the color change will be too dark to determine an accurate phosphate reading.

39
To determine which level of the Total Phosphate test to perform, you should complete the Orthophosphate test first because the Total Phosphate test is time consuming and will be ruined if the appropriate range test is not chosen. Start with the Low-range test. If the reading is above 1 mg/L, there is a shortcut for the Medium-range test. If the reading is still too high, (the color is too dark to read accurately with the color wheel), complete the High-range test. By doing this, you will know which range of test to complete for the Total Phosphate test. (Note: If your reading is close to the upper range of the appropriate Orthophosphate test, you might want to consider completing the next higher range test for Total Phosphate because TP>OP.) Orthophosphate Instructions: These instructions are for use with the HACH Orthophosphate test (Catalog No. 27120-00) for 25 mL sample, which is included in the Stream Survey Kit.
CHECKLIST 23 mL square mixing bottle PhosVer 3 phosphate powder pillows Color comparator (black box) Phosphate color disk (blue-violet) Glass test tubes Mirrors (inside color comparator) for low range Distilled water Watch or stopwatch Waste container Safety Data Sheets Testing Instructions Data Sheets
For greater accuracy and safety, it is recommended that this test be performed inside a well-ventilated setting.
Orthophosphate Low-range test (0-1 mg/L) 1. Rinse and fill the square mixing bottle to the 20 mL mark with the water to be tested.
2. Open one PhosVer 3 Phosphate Powder Pillow and add its contents to the bottle. Gently
swirl to mix. Allow at least two, but not more than ten minutes for full color development. (Note: If phosphate is present, a blue-violet color will form.)
3. Place the mirrors onto the shelf in the color comparator. Place the Phosphate (blue-violet)
color disk into the comparator. (Note: The mirrors are used only during the Low-range tests.)
4. Fill one of the glass color viewing tubes to the top line with prepared sample. Place the
tube on the right side of the comparator. (Note: Keep the rest of the prepared sample in the square mixing bottle until the test is complete. If the results are greater than 1 mg/L, you can use the same sample for the 0-5 mg/L test.)

40
5. Fill the other glass tube to the top line with untreated sample water and place it on the left side of the comparator.
6. Do not place caps on the tubes. Orient the comparator with the tube tops pointing to a
window or light source. Rotate the disc until a color match is obtained. Divide the reading from the scale window by 50 to obtain the mg/L Orthophosphate.
Orthophosphate Medium-range test (0-5 mg/L) SHORTCUT: Take the sample left in the square mixing bottle from the Low-range test. Pour the sample to the 5 mL mark on the glass viewing tube and place it on the right side of the comparator. REMOVE THE MIRRORS and obtain a color match. Read the results and divide by 10 to obtain the mg/L Orthophosphate. REGULAR METHOD:
1. Follow steps 1 and 2 of the Low-range test. Do not use the mirrors in the comparator for this test.
2. Fill one of the glass tubes to the bottom line with prepared sample (approximately 5 mL).
Place the tube on the right side of the comparator.
3. Fill the other glass tube to the bottom line with untreated sample water and place it on the left side of the comparator.
4. Do not use the mirrors in the comparator. Holding the comparator up to a light source,
view the tubes through the center windows. Rotate the disc until a color match is obtained. Divide the reading from the scale window by 10 to obtain the mg/L Orthophosphate.
Orthophosphate High-range test (0-50 mg/L)
1. Rinse the square mixing bottle and dropper with demineralized or distilled water. Add 2.0 mL of the water to be tested by twice filling the dropper to the 1.0 mL mark. (This is a dilution of the sample.)
2. Add demineralized or distilled water to the 20 mL mark of the mixing bottle. Swirl to
mix. 3. Open one PhosVer 3 Phosphate Reagent Powder Pillow. Add the contents to the bottle.
Gently swirl to mix. Allow at least two minutes, but not more than 10 minutes, for color development.
4. Fill one of the glass tubes to the bottom line with prepared sample (approximately 5 mL).
Place the tube on the right side of the comparator.
5. Fill the other glass tube to the bottom line with untreated sample water and place it on the left side of the comparator.

41
6. Do not use the mirrors in the comparator. Holding the comparator up to a light source,
view the tubes through the center windows. Rotate the disc until a color match is obtained. Read the mg/L Orthophosphate directly through the scale window.
Total Phosphate Instructions: These instructions are for use with the HACH Total Phosphate (Catalog No. 2250-01, Model PO-24) for 25 mL sample, which is included in the Stream Survey Kit. Please note: this test produces hazardous waste, which should be collected in a separate waste bottle and should be disposed of according to information in the Safety Data Sheet or through your school, if they have a disposal program for hazardous waste. If you do not have a way of disposing of hazardous waste, please contact the RiverWatchers program coordinator.
CHECKLIST 23 mL square mixing bottle Potassium persulfate powder pillows PhosVer 3 phosphate powder pillows Color comparator (black box) Phosphate color disk (blue-violet) Glass test tubes Mirrors (inside color comparator) for low range Distilled water 50 mL Erlenmeyer flask (for Total Phosphate) 5.25N sulfuric acid solution (for Total Phosphate) 5.0N sodium hydroxide (for Total Phosphate) Hot plate or other heating apparatus (for Total Phosphate) Tongs or oven mitt to remove Erlenmeyer flask from heating source Watch or stopwatch Separate waste container labeled “Hazardous Phosphate Waste” Safety Data Sheets Testing Instructions Data Sheets
1. Rinse and fill the square mixing bottle to the 20 mL mark with the water to be tested.
Pour the sample into a clean 50 mL Erlenmeyer flask. 2. Open one Potassium Persulfate Powder Pillow and add its contents to the flask. Gently
swirl to mix.
3. Add 2 mL of 5.25N Sulfuric Acid Solution to the sample by twice filling the dropper to the 1 mL mark and pouring the contents into the flask. Gently swirl to mix. (Note: Rinse thoroughly any surfaces, including your skin that may have contacted the acidic solution.)
4. Set up the boiling apparatus. (Note: A hot plate or camping stove is easier and more
reliable than the fuel tablets provided with the kit.)

42
5. Boil the sample for 30 minutes, occasionally adding demineralized or distilled water to keep the liquid volume near 20 mL. Do not bring the volume above 20 mL. Do not let it boil to dryness.
6. Allow the liquid to cool.
7. Add 2 mL of 5.0N Sodium Hydroxide Solution by twice filling the dropper to the 1 mL
mark and pouring the contents into the flask.
8. Return the sample to the square mixing bottle. Add demineralized or distilled water to return its volume to 20 mL.
9. Now perform the orthophosphate test of the appropriate range (pgs. 37-38) since all of
the possible phosphate present in the sample is now in the “free” state. However, read the final result as mg/L Total Phosphate (PO4). Note: Total Phosphate should be greater than the Orthophosphate since Orthophosphate is a component of Total Phosphate. (TP>OP)
10. Dispose of ALL waste in a hazardous waste container.
TYPICAL RANGE FOR TOTAL PHOSPHATE = 0 to 0.85 mg/L
Total Phosphate Q-values
Total Phosphate (mg/L P)
Q-Value
0 99 0.05 98 0.1 97 0.2 95 0.3 90 0.4 78 0.5 60
0.78 50 1 39
1.5 30 2 26 3 21 4 16 5 12 6 10 7 8 8 7 9 6
10 5 >10 2

43

44
Nitrate Primary Importance: Nitrogen makes up about 80% of the air we breathe, and it is found in all living things. Nitrates are essential for plant growth; however high levels of nitrogen work with phosphorus to cause algal blooms and excessive nutrients in the water. Problem: In some waters, where phosphorus does not limit algal growth, nitrogen may be the limiting factor. Excessive nitrogen can support algal growth. High ammonia leads to loss of dissolved oxygen through nitrification. Nitrate, while an important indicator of external sources of nutrients, is not particularly harmful. Causes: Nitrogen can come from manure sources, such as treatment lagoons and over-fertilized
fields. In commercial inorganic fertilizers, nitrogen is used in greater quantities than any other
nutrient. Runoff from agriculture, forestry, golf courses, and lawns is high in nitrogen, especially if runoff occurs shortly after fertilizer application.
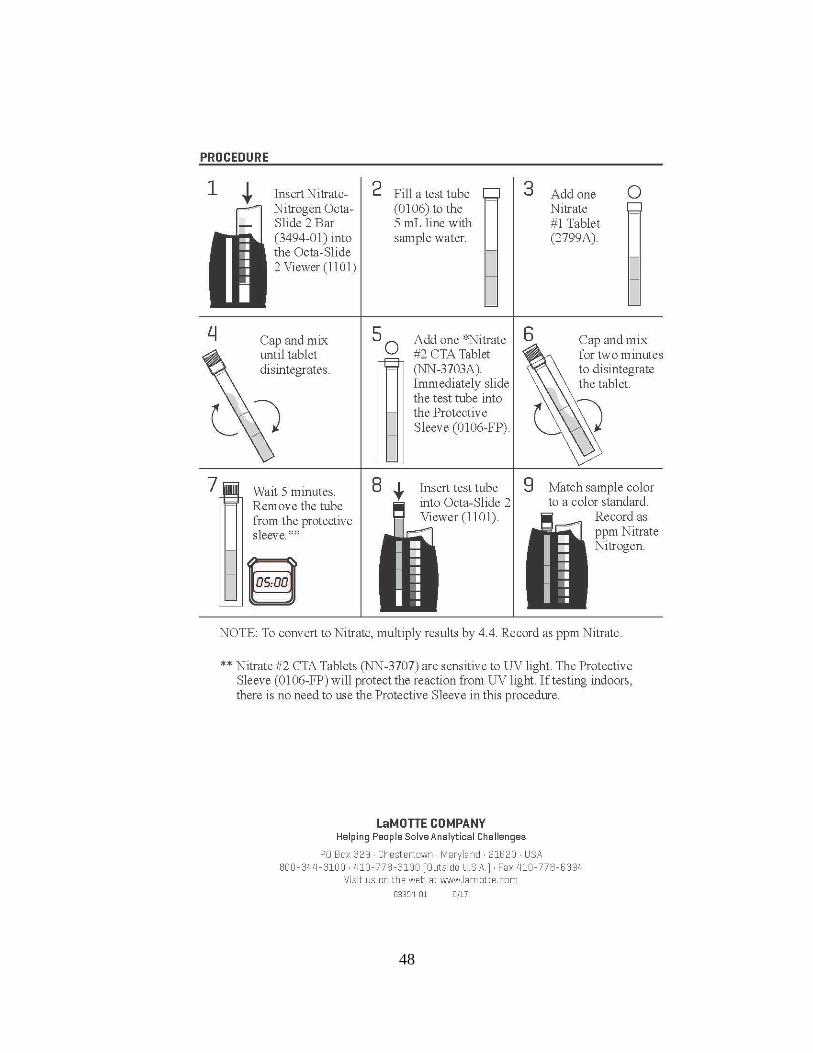
Instructions (HACH Method): These instructions are for use with the HACH Company Low-range Nitrate test kit 0-1, 0-10 mg/L as Nitrate Nitrogen Catalog No. 14161-00, Model NI-14, for 5 mL sample. Please note: this test produces hazardous waste, which should be collected in a separate waste bottle and should be disposed of according to information in the Safety Data Sheet or through your school, if they have a disposal program for hazardous waste. If you do not have a way of disposing of hazardous waste, please contact the RiverWatchers program coordinator.
CHECKLIST Plastic test tubes and stoppers NitraVer 6 Nitrate reagent powder pillows NitriVer 3 Nitrite reagent powder pillows Color comparator (black box) Nitrate color disk (pink) Distilled water Watch or stopwatch Separate waste container labeled “Hazardous Nitrate Waste” Safety Data Sheets Testing Instructions Data Sheets
Nitrate Nitrogen 0-1 mg/L
1. Rinse one plastic test tube with the sample to be tested. 2. Fill the test tube to the lowest mark (the bottom of the frosted band, approx. 5 mL) with
sample.

45
3. Add the contents of the NitraVer 6 Nitrate Reagent Powder Pillow to the sample to be
tested. Stopper the tube and shake for three minutes. Allow the sample to sit undisturbed for an additional 30 seconds.
4. Add the contents of one NitriVer3 Nitrite Reagent Powder Pillow to the sample. Stopper
the tube and shake for 30 seconds. A pink or red color will develop if nitrate is present. Allow at least 10 minutes, but not more than 20 minutes before completing steps 5-7.
5. Insert the tube of prepared sample into the right top opening of the color comparator.
6. Fill a second test tube to the lowest mark with untreated sample water and place in the
left side of the comparator.
7. Hold the comparator up to a light source and view through the opening in front. Do not use mirrors in the comparator. Rotate the pink disc to obtain a color match. (Note: Holding a piece of white paper 6-8 inches behind the comparator may help in viewing the color. Also, remove stoppers from the test tubes for the most accurate color reading.) Read the mg/L nitrate nitrogen (N) through the scale window. To obtain results needed for the Water Quality Index [mg/L nitrate (NO3)], multiply the reading on the scale by 4.4.
8. Dispose of ALL waste in a hazardous waste container.
Nitrate Nitrogen 0-10 mg/L
1. Rinse one test tube with the sample to be tested. 2. Rinse the plastic dropper with the sample. Fill the test tube to the 0.5 mL mark and add
contents of the dropper to the rinsed color viewing tube. 3. Fill the test tube containing 0.5 mL of sample to the lowest mark (the bottom of the
frosted band) with demineralized or distilled water.
4. Add the contents of the NitraVer 6 Nitrate reagent Powder Pillow to the sample to be tested. Stopper the tube and shake for three minutes. Allow the sample to sit undisturbed for an additional 30 seconds.
5. Add the contents of one NitriVer3 Nitrite Reagent Powder Pillow to the sample. Stopper
the tube and shake for 30 seconds. A pink or red color will develop if nitrate is present. Allow at least 10 minutes, but not more than 20 minutes before completing steps 6-8.
6. Insert the tube of prepared sample into the right top opening of the color comparator.
7. Fill a second test tube to the lowest mark with untreated sample water and place in the
left side of the comparator.
8. Hold the comparator up to a light source and view through the opening in front. Do not use mirrors in the comparator. Rotate the pink disc to obtain a color match. (Note: Holding a piece of white paper 6-8 inches behind the comparator may help in viewing the

46
color. Also, remove stoppers from the test tubes for the most accurate color reading.) Read the mg/L nitrate nitrogen (N) through the scale window. Multiply that reading by 10 to the mg/L nitrate nitrogen (N) present in the sample. To obtain results needed for the Water Quality Index [mg/L nitrate (NO3)], multiply the reading on the scale by 4.4.
9. Dispose of waste in container marked “Hazardous Nitrate Waste”.
FYI… Nitrates can be measured in two ways:
- as NO3-N: the amount of nitrogen in the nitrate ion (NO3-) form
- as NO3-: total nitrate ion
Our results are reported as total NO3
-. Use the following to compare…
10 mg/L nitrate-nitrogen (NO3-N) = 44.3 mg/L nitrate (NO3-)
The drinking water standard for NO3-N is 10mg/L or 44.3 mg/L nitrate (NO3-).
Unpolluted waters generally have a nitrate level below 4 mg/L.
TYPICAL RANGE FOR NITRATE = 0 to 13.86 mg/L
Nitrate Q-values
Nitrate (mg/L NO3)
Q-Value
0 98 0.25 97 0.5 96
0.75 95 1 94
1.5 92 2 90 3 85 4 70 5 65
10 51 20 37 30 24 40 17 50 7 60 5 70 4 80 3
100 1 >100 1

47
48

49
50
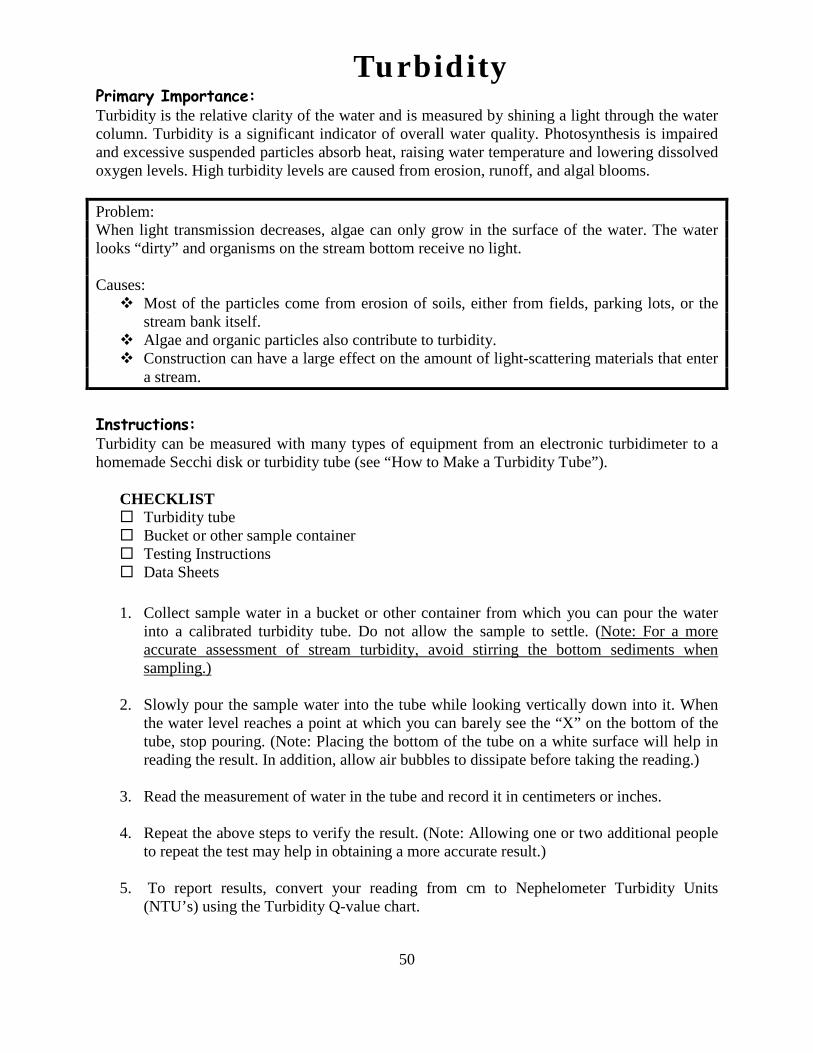
Turbidity Primary Importance: Turbidity is the relative clarity of the water and is measured by shining a light through the water column. Turbidity is a significant indicator of overall water quality. Photosynthesis is impaired and excessive suspended particles absorb heat, raising water temperature and lowering dissolved oxygen levels. High turbidity levels are caused from erosion, runoff, and algal blooms. Problem: When light transmission decreases, algae can only grow in the surface of the water. The water looks “dirty” and organisms on the stream bottom receive no light. Causes: Most of the particles come from erosion of soils, either from fields, parking lots, or the
stream bank itself. Algae and organic particles also contribute to turbidity. Construction can have a large effect on the amount of light-scattering materials that enter
a stream. Instructions: Turbidity can be measured with many types of equipment from an electronic turbidimeter to a homemade Secchi disk or turbidity tube (see “How to Make a Turbidity Tube”).
CHECKLIST Turbidity tube Bucket or other sample container Testing Instructions Data Sheets
1. Collect sample water in a bucket or other container from which you can pour the water
into a calibrated turbidity tube. Do not allow the sample to settle. (Note: For a more accurate assessment of stream turbidity, avoid stirring the bottom sediments when sampling.)
2. Slowly pour the sample water into the tube while looking vertically down into it. When
the water level reaches a point at which you can barely see the “X” on the bottom of the tube, stop pouring. (Note: Placing the bottom of the tube on a white surface will help in reading the result. In addition, allow air bubbles to dissipate before taking the reading.)
3. Read the measurement of water in the tube and record it in centimeters or inches.
4. Repeat the above steps to verify the result. (Note: Allowing one or two additional people
to repeat the test may help in obtaining a more accurate result.)
5. To report results, convert your reading from cm to Nephelometer Turbidity Units (NTU’s) using the Turbidity Q-value chart.

51
TYPICAL RANGE FOR TURBIDITY = 4.5 to 173 NTUs
Turbidity Q-values
How to Make a Turbidity Tube: For instructions on how to correctly use the turbidity tube, see the Chemical Testing Instructions. Directions:
1. Put a PVC cap or other covering on one end of a clear tube (a florescent light bulb tube cover works great). Cap should fit tightly so water will not leak out. Clear packing tape can also be used to secure the cap.
2. Cut a disk from the template provided. It should be the same size as the tube diameter. 3. Seal the disk by laminating or covering with clear packing tape to make it waterproof. 4. Adhere the disk to the cap at the bottom of the tube with clear packing tape. 5. Use a permanent marker and meter stick to make a scale on the side of the tube, beginning
with 0 cm at the disk. Number the tube in increments of 5 or 10 ending with 150 cm at the top.
Sample Disk Template
Turbidity (NTU)
Transparency (cm)
Q-Value
0 150 97 5 120 84
10 90 76 <15 (turb tube) >60 (turb tube) 70
15 60 68 20 30 62 25 27.5 57 30 25 53 35 22.5 48 40 20 45 50 15 39 60 12.5 34 70 10 28 80 7.5 25 90 5 22 100 2.5 17
>100 <2.5 5
Note: JTUs versus NTUs Jackson Turbidity Units (JTUs)
and Nephelometer Turbidity Units (NTUs) are not exactly equivalent but are approximately the same.
Ex) 40 JTU ~ 40 NTU
Sample Turbidity Tube

52
Chemical Monitoring Worksheet Site Information: School/organization name _________________________ River/stream name _____________________________ Date ________ Time ________ Water Temp ______°C Air Temp ________ °C Today’s weather: sunny partly cloudy overcast light rain heavy rain Yesterday’s weather: sunny partly cloudy overcast light rain heavy rain
Chemical Test
Units
Sample # 1
Sample # 2
Sample # 3
Average
Dissolved Oxygen mg/L % saturation
E. coli colonies/ 100 ml
pH pH units
Biochemical Oxygen Demand
mg/L
Water Temperature Change
°C
Total Phosphate mg/L
Nitrate mg/L
Turbidity NTU = JTU
Orthophosphate mg/L

53

54
How to complete the Water Quality Index Site Information: School/organization name __Ohio River Academy___ River/stream name __Local Creek_____ Date ____8/12/17____ Time ___2:30 pm_____ Water Temp _26__°C Air Temp _30_ °C Today’s weather: sunny partly cloudy overcast light rain heavy rain Yesterday’s weather: sunny partly cloudy overcast light rain heavy rain
Test Results Dissolved Oxygen _85_ % Saturation
E. coli __200 __colonies/ 100mL
pH __8.3 __ units
B.O.D. 5 __2_______ mg/L
As you complete each chemical test or average the results from the worksheet, record the values in the first column of the chemical monitoring data sheet.
H2O Temperature ___1_______ °C Change
Total Phosphate ___0.06_____mg/L
Nitrate (NO3) ___7_____mg/L
Turbidity __50______NTU’s

55
How to complete the Water Quality Index Site Information: School/organization name __Ohio River Academy___ River/stream name __Local Creek_____ Date ____8/12/17____ Time ___2:30 pm_____ Water Temp _26__°C Air Temp _30_ °C Today’s weather: sunny partly cloudy overcast light rain heavy rain Yesterday’s weather: sunny partly cloudy overcast light rain heavy rain
Test Results Q-Value Dissolved Oxygen _85_ % Saturation
92
E. coli __200 __colonies/ 100mL
37
pH __8.3 __ units
75
Find the Q-value using the graphs following the testing procedures for each parameter. Using the appropriate units, find the test result values on the bottom of the graph (x-axis). Follow this value up to the line on the graph. Where your value intersects the line, follow this point over to the left side of the graph (y-axis). This number is your Q-value. Record this value in the table.
B.O.D. 5 __2_______ mg/L
80
H2O Temperature ___1_______ °C Change
89
Total Phosphate ___0.06_____mg/L
98
Nitrate (NO3) ___7_____mg/L
60
Turbidity __50______NTU’s
39
56
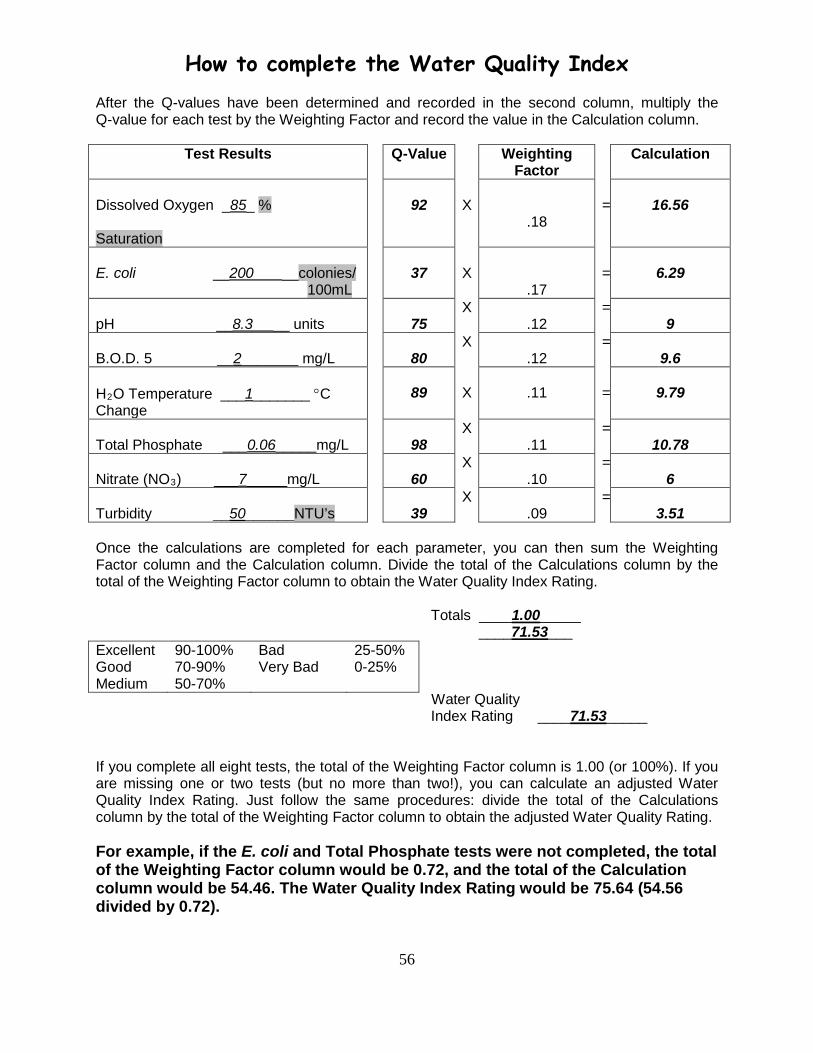
How to complete the Water Quality Index After the Q-values have been determined and recorded in the second column, multiply the Q-value for each test by the Weighting Factor and record the value in the Calculation column.
Test Results Q-Value Weighting Factor
Calculation
Dissolved Oxygen _85_ % Saturation
92
X
.18
=
16.56
E. coli __200 __colonies/ 100mL
37
X
.17
=
6.29
pH __8.3 __ units
75
X .12
= 9
B.O.D. 5 __2_______ mg/L
80
X .12
= 9.6
H2O Temperature ___1_______ °C Change
89
X
.11
=
9.79
Total Phosphate ___0.06_____mg/L
98
X .11
= 10.78
Nitrate (NO3) ___7_____mg/L
60
X .10
= 6
Turbidity __50______NTU’s
39
X .09
= 3.51
Once the calculations are completed for each parameter, you can then sum the Weighting Factor column and the Calculation column. Divide the total of the Calculations column by the total of the Weighting Factor column to obtain the Water Quality Index Rating.
Totals ____1.00_____ ____71.53___ Water Quality Index Rating ____71.53_____
If you complete all eight tests, the total of the Weighting Factor column is 1.00 (or 100%). If you are missing one or two tests (but no more than two!), you can calculate an adjusted Water Quality Index Rating. Just follow the same procedures: divide the total of the Calculations column by the total of the Weighting Factor column to obtain the adjusted Water Quality Rating. For example, if the E. coli and Total Phosphate tests were not completed, the total of the Weighting Factor column would be 0.72, and the total of the Calculation column would be 54.46. The Water Quality Index Rating would be 75.64 (54.56 divided by 0.72).
Excellent 90-100% Bad 25-50% Good 70-90% Very Bad 0-25% Medium 50-70%

57
Water Quality Index- Sample Page You may perform as many of the following tests as you wish; however, at least 6 must be completed to obtain a Total Water Quality Index value. Divide the total of the Calculation column by the total of the Weighting Factor column to obtain the Water Quality Index rating. Site Information: School/organization name __Ohio River Academy___ River/stream name __Local Creek_____ Date ____8/12/17____ Time ___2:30 pm_____ Water Temp _26__°C Air Temp _30_ °C Today’s weather: sunny partly cloudy overcast light rain heavy rain Yesterday’s weather: sunny partly cloudy overcast light rain heavy rain
Test Results Q-Value Weighting Factor
Calculation
Dissolved Oxygen _85_ % Saturation
92
X
.18
=
16.56
E. coli __200 __colonies/ 100mL
37
X
.17
=
6.29
pH __8.3 __ units
75
X .12
= 9
B.O.D. 5 __2_______ mg/L
80
X .12
= 9.6
H2O Temperature ___1_______ °C Change
89
X
.11
=
9.79
Total Phosphate ___0.06_____mg/L
98
X .11
= 10.78
Nitrate (NO3) ___7_____mg/L
60
X .10
= 6
Turbidity __50______NTU’s
39
X .09
= 3.51
Totals ______1.00________ ___71.53_____
Water Quality Index Rating ___71.53: Good______
Excellent 90-100% Bad 25-50% Good 70-90% Very Bad 0-25% Medium 50-70%
58
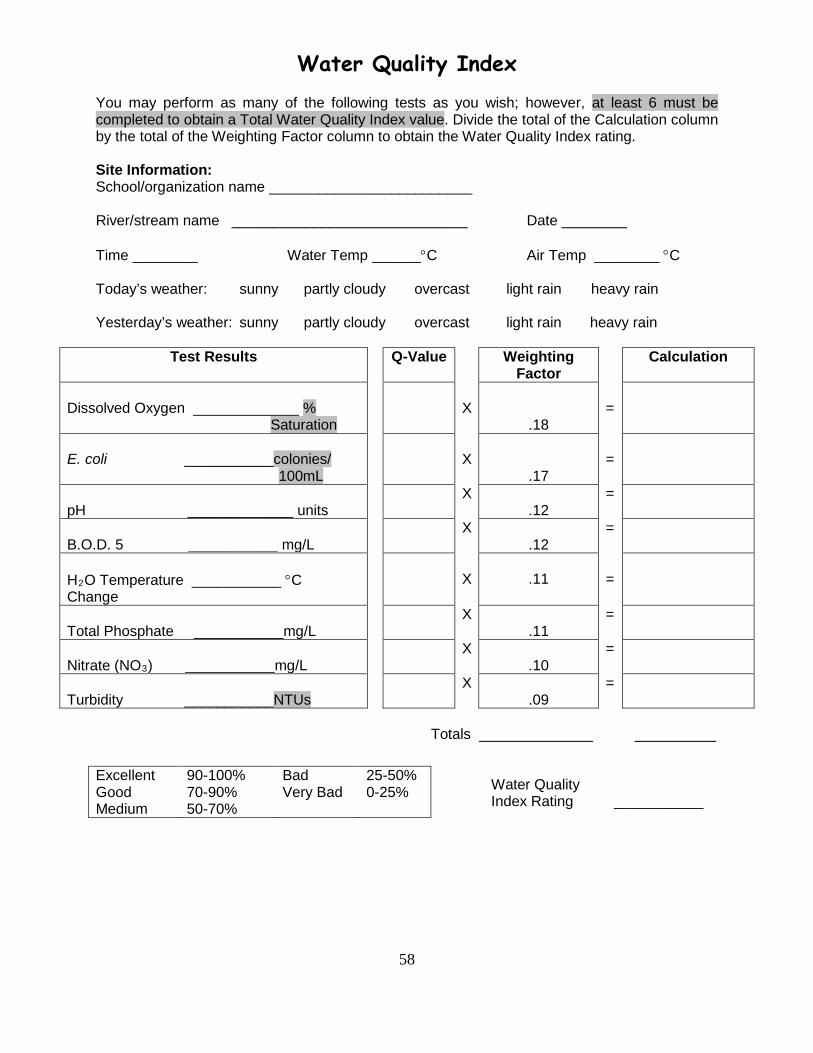
Water Quality Index You may perform as many of the following tests as you wish; however, at least 6 must be completed to obtain a Total Water Quality Index value. Divide the total of the Calculation column by the total of the Weighting Factor column to obtain the Water Quality Index rating. Site Information: School/organization name _________________________ River/stream name _____________________________ Date ________ Time ________ Water Temp ______°C Air Temp ________ °C Today’s weather: sunny partly cloudy overcast light rain heavy rain Yesterday’s weather: sunny partly cloudy overcast light rain heavy rain
Test Results Q-Value Weighting Factor
Calculation
Dissolved Oxygen _____________ % Saturation
X
.18
=
E. coli ___________colonies/ 100mL
X
.17
=
pH _____________ units
X .12
=
B.O.D. 5 ___________ mg/L
X .12
=
H2O Temperature ___________ °C Change
X
.11
=
Total Phosphate ___________mg/L
X .11
=
Nitrate (NO3) ___________mg/L
X .10
=
Turbidity ___________NTUs
X .09
=
Totals ______________ __________
Water Quality
Index Rating ___________
Excellent 90-100% Bad 25-50% Good 70-90% Very Bad 0-25% Medium 50-70%

59
Guide for Water Quality Ranges - (Ohio River) Dissolved Oxygen (% Saturation) 91 to 110 Excellent 71 to 90, >110 Good 51 to 70 Fair <50 Poor
Total Phosphate < .10 Excellent .11 to .16 Good .17 to .58 Fair .59 to 2.99 Poor >3.0 Very Poor
E. coli (colonies per 100 mL) < 50 Excellent 51 to 200 Good 201 to 1000 Fair >1000 Poor
Nitrate (NO3) (mg/L) < 1.32 Excellent 1.76 to 3.52 Good 3.96 to 8.36 Fair > 8.8 Poor
pH (pH units) 6.5 to 7.5 Excellent 6.0 to 6.4, 7.6 to 8.0 Good 5.5 to 5.9, 8.1 to 8.5 Fair <5.5, >8.6 Poor
Turbidity (JTU, NTU) 1 to 10 Excellent 10.1 to 40 Good 40.1 to 150 Fair > 150 Poor
Biochemical Oxygen Demand (mg/L) < 2 Excellent 2.0 to 4.0 Good 4.1 to 10 Fair >10 Poor
Water Temperature Change (°C) 0 to 2 Excellent 2.2 to 5 Good 5.1 to 9.9 Fair >10 Poor
Note: These numbers represent a guideline for water quality values in the Ohio River. Because a variety of factors influence water quality, including wind, rainfall, temperature, overhanging vegetation, these values will change seasonally and may not accurately represent conditions in all instances.
60
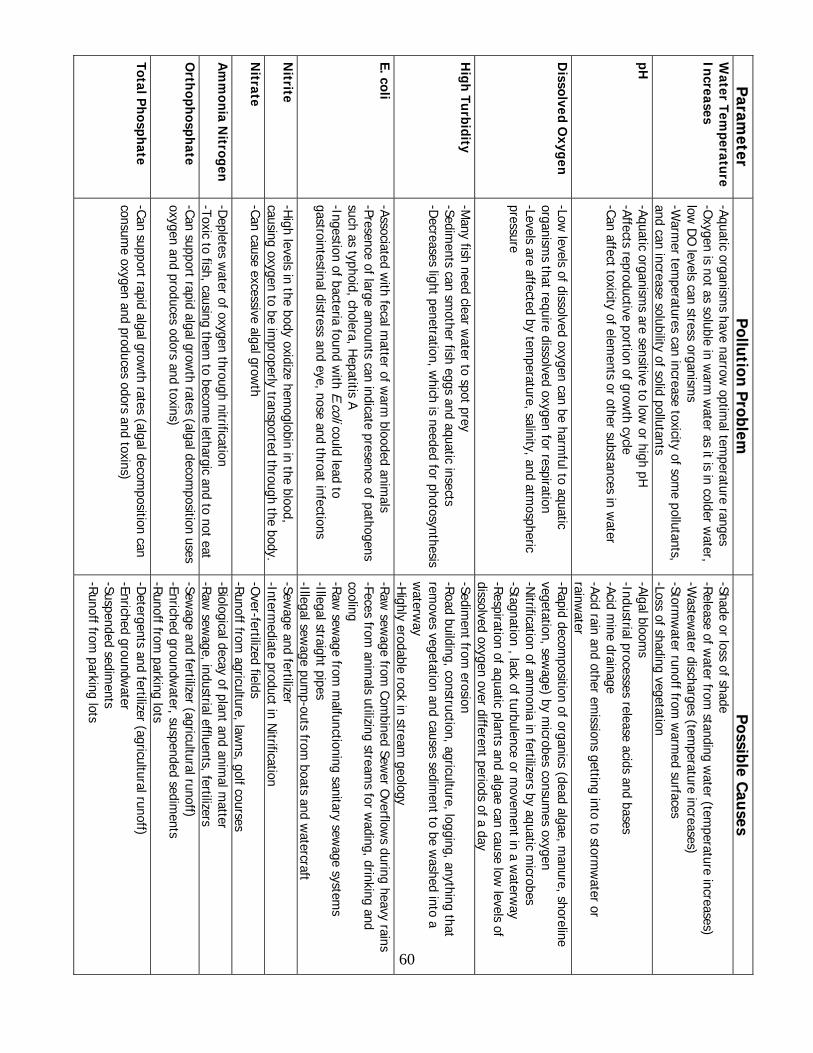
P Pa ar ra am me et te er r
P Po ol ll lu ut ti io on n P Pr ro ob bl le em m
P Po os ss si ib bl le e C Ca au us se es s
Water Tem
perature Increases
-Aquatic organisms have narrow
optimal tem
perature ranges -O
xygen is not as soluble in warm
water as it is in colder w
ater, low
DO
levels can stress organisms
-Warm
er temperatures can increase toxicity of som
e pollutants, and can increase solubility of solid pollutants
-Shade or loss of shade -Release of w
ater from standing w
ater (temperature increases)
-Wastew
ater discharges (temperature increases)
-Stormw
ater runoff from w
armed surf aces
-Loss of shading vegetation pH
-Aquatic organisms are sensitive to low
or high pH
-Affects reproductive portion of growth cycle
-Can affect toxicity of elements or other substances in w
ater
-Algal blooms
-Industrial processes release acids and bases -Acid m
ine drainage -Acid rain and other em
issions getting into to stormw
ater or rainw
ater D
issolved Oxygen
-Low
levels of dissolved oxygen can be harmful to aquatic
organisms that require dissolved oxygen for respiration
-Levels are affected by temperature, salinity, and atm
ospheric pressure
-Rapid decomposition of organics (dead algae, m
anure, shoreline vegetation, sew
age) by microbes consum
es oxygen -N
itrification of amm
onia in fertilizers by aquatic microbes
-Stagnation , lack of turbulence or movem
ent in a waterw
ay -Respiration of aquatic plants and algae can cause low
levels of dissolved oxygen over different periods of a day
High Turbidity
-M
any fish need clear water to spot prey
-Sediments can sm
other fish eggs and aquatic insects -D
ecreases light penetration, which is needed for photosynthesis
-Sediment from
erosion -Road building, construction, agriculture, logging, anything that rem
oves vegetation and causes sediment to be w
ashed into a w
aterway
-Highly erodable rock in stream
geology E. coli
-Associated with fecal m
atter of warm
blooded animals
-Presence of large amounts can indicate presence of pathogens
such as typhoid, cholera, Hepatitis A
-Ingestion of bacteria found with E.coli could lead to
gastrointestinal distress and eye, nose and throat infections
-Raw sew
age from Com
bined Sewer O
verflows during heavy rains
-Feces from anim
als utilizing streams for w
ading, drinking and cooling -Raw
sewage from
malfunctioning sanitary sew
age systems
-Illegal straight pipes -Illegal sew
age pump-outs from
boats and watercraft
Nitrite
-H
igh levels in the body oxidize hemoglobin in the blood,
causing oxygen to be improperly transported through the body .
-Sewage and fertilizer
-Intermediate product in N
itrification N
itrate
-Can cause excessive algal growth
-Over-fertilized fields
-Runoff from agriculture, law
ns, golf courses A
mm
onia Nitrogen
-Depletes w
ater of oxygen through nitrification -Toxic to fish, causing them
to become lethargic and to not eat
-Biological decay of plant and animal m
at ter -Raw
sewage, industrial effluents, fertilizers
Orthophosphate
-Can support rapid algal grow
th rates (algal decomposition uses
oxygen and produces odors and toxins) -Sew
age and fertilizer (agricultural runoff) -Enriched groundw
ater, suspended sediments
-Runoff from parking lots
Total Phosphate
-Can support rapid algal growth rates (algal decom
position can consum
e oxygen and produces odors and toxins) -D
etergents and fertilizer (agricultural runoff) -Enriched groundw
ater -Suspended sedim
ents -Runoff from
parking lots

61