chapter 3 · chapter 3. 27 3.1 introduction ... fischer weltalmanach, 1999). extrapolating present...
TRANSCRIPT
Human activities
cha
pte
r
3
27
3.1 Introduction
This chapter provides an outline of the most important human activities that need to be taken into account inassessing the present quality status of the Greater North Sea. Economic statistics are not aggregated on geographicalscales that are appropriate for this assessment report and therefore no information is presented in economic terms.
The countries bordering the Greater North Sea carry out within it major fishing activities, the extraction of sand andgravel, offshore activities related to the exploitation of oil and gas reserves including the laying of pipelines, and use itas a transport route and for dumping dredged material. The North Sea is one of the most frequently traversed seaareas of the world. Two of the world’s largest ports are situated on the North Sea coast, and the coastal zone of theGreater North Sea is used intensively for recreation.
The Greater North Sea is surrounded by densely populated, highly industrialised countries. As a consequence, thearea is affected by industrial, domestic and agricultural activities, which create inputs, via various pathways, ofnutrients, hazardous substances and radionuclides.
In order to reduce the stress on the environment, measures have been adopted to reduce emissions, dischargesand losses of hazardous substances, radioactive substances, and nutrients. Measures address point sources such asindustries (land-based and offshore) or treatment plants and diffuse sources such as agriculture. In the shippingsector, mandatory routeing measures have been imposed in order to lower the risk of accidents. A number ofmeasures have been introduced and are being further developed concerning the fisheries sector with the aim ofachieving sustainable fisheries.
The Convention on the Law of the Sea recognises three areas. The ‘territorial sea’ generally extends 12 nauticalmiles offshore and is subject to coastal state jurisdiction. The ‘exclusive economic zone’ (EEZ) extends 200 nm (350nm including the continental shelf) and in this zone the coastal state has the exclusive right of exploitation ofresources, including fisheries, and is responsible for regulating pollution from sea-bed installations, dumping, andother activities. The ‘open sea’ beyond the EEZ is not subject to national jurisdiction.
Most of the North Sea States have declared an EEZ and have EEZ legislation in place. This is in preparation in TheNetherlands, and the UK has an equivalent area of UK controlled waters. The North Sea States which are EUmembers have transferred most of their exclusive rights on fisheries to the European Commission.
Following the adoption of the Geneva Convention on the Continental Shelf (1958), the delimitations of thecontinental shelf were agreed (Figure 2.1). The Netherlands and Belgium agreed on their mutual boundaryin 1996.
The framework for the environmental protection of the North Sea has developed extensively over the past 20years. It includes the International Conferences on the Protection of the North Sea, the OSPAR Convention as thesuccessor to the former Oslo and Paris Conventions, the Bonn Agreement, the Trilateral Governmental Wadden SeaConferences and also initiatives within the International Maritime Organization (IMO) and the European Community(EC). The North Sea may also benefit from measures taken under the auspices of the Helsinki Convention on theProtection of the Marine Environment of the Baltic Sea Area and from the experience of the Barcelona Convention forthe Protection of the Mediterranean Sea against Pollution. Additionally there is co-operation in the framework ofinternational river conventions, such as for the Elbe, Rhine, Scheldt and Meuse.
Protection and conservation of ecosystems and biological diversity of the marine area is now under the newAnnex V to the OSPAR Convention, adopted in 1998.
28
3.2 Demography
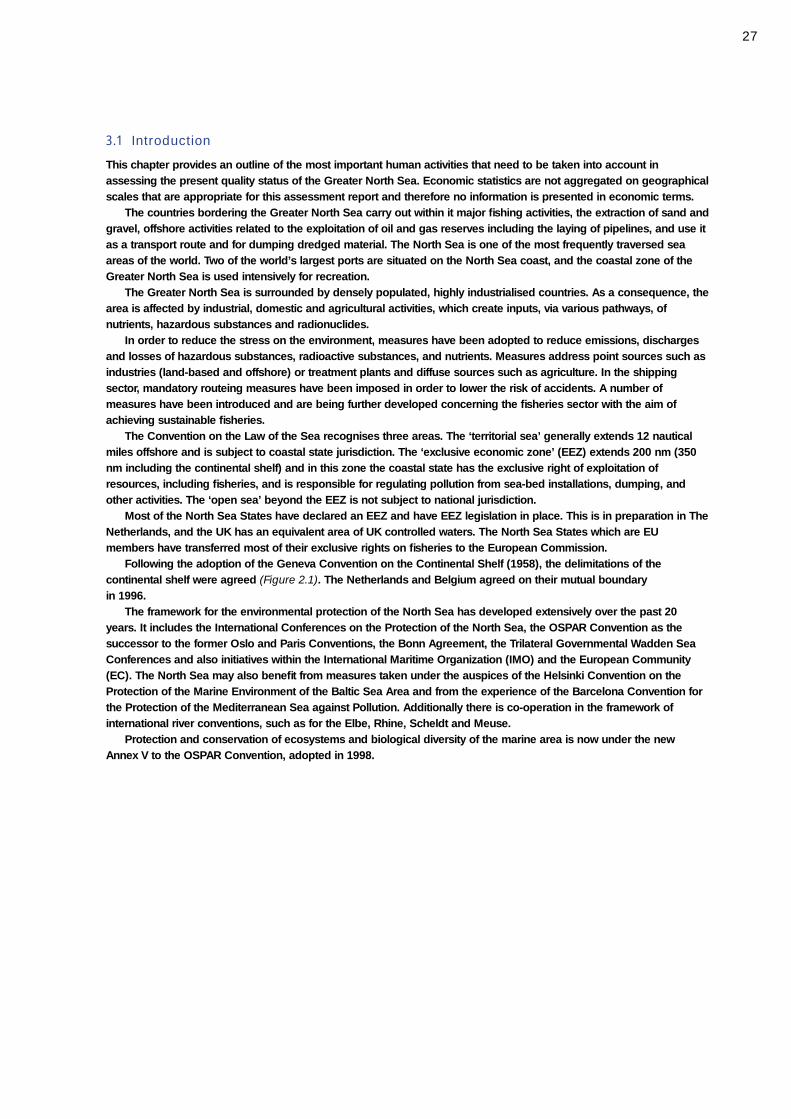
Approximately 184 million people live within thecatchment area of the Greater North Sea (Figure 3.1;Table 3.1). Since the mid-eighties, international migrationhas influenced the size of the population, and in 1995accounted for 80% of the growth of the population of theEuropean Union (EU). In 1996, about 1.5 million peoplemigrated into the catchment area (Eurostat 1997a, FischerWeltalmanach, 1999). Extrapolating present trends in birthand death rates, and migration, the EU population isprojected to reach a maximum in 2025 (Eurostat, 1997b).Considerable changes following the end of the east-westbloc division has resulted in a substantial increase intrade and road transport. The number of people in thecoastal regions of Region II varies substantially on aseasonal basis due to tourism.
3.3 Conservation
3.3.1 Ecological conservationThe Greater North Sea supports a rich coastal and marinewildlife, and has a number of important habitats (Table 3.2).Since a number of species and habitats are endangered,certain areas such as the Wadden Sea have already beengiven the status of conservation sites in order to allow forprotective measures.
Man made modifications to parts of the region havebeen accompanied by changes and losses of habitatsand disturbed ecological functions. In The Netherlandsfew tidal rivers remain, in Germany a barrier is underconstruction in the river Ems, and in Scotland, over theyears, much estuarine habitat has been lost from themajor firths and estuaries, such as those of the Forth andCromarty. Even in the Wadden Sea most estuaries havebeen modified. There are, however, new policy develop-ments that aim to restore selected estuarine habitats (e.g.Harlingvliet and Scheldt in The Netherlands).
Important instruments for protecting the marinecoastal environment are the EEC Council Directives on theconservation of wild birds (79/409/EEC) (which includesdesignation of Specially Protected Areas) and on theconservation of natural habitats and of wild fauna andflora (92/43/EEC). Within that framework a coherentecological network of habitats is to be established(NATURA 2000), but proposed areas only range to 12nautical miles off shore. Under the 1979 Bonn Convention
Region II Greater North Sea
Drainage area
>100 inhabitants/km2
Agglomeration > 5 000 000 inhabitants
Agglomeration 1000 000– 5 000 000 inhabitants
Agglomeration 500 000–1000 000 inhabitants
Switzerland
Czech andSlovakRepublics
Table 3.1 Estimated population of the catchment area of the GreaterNorth Sea and population density within the wholecountry. Source of data: Eurostat, Britannica (1999).
Country Population in the Population
Greater North Sea density
catchment area
(x 106 inhabitants) (persons/km2)
Belgium (1996) 10.1 334
Czech Republic (1996) 10.3 131
Denmark (1997) 2.2 122
France (1995) 25.3 107
Germany (1996) 72.5 229
Liechtenstein (1996) 0.16 194
Luxembourg (1996) 0.4 161
Netherlands (1996) 15.6 382
Norway (1997) 3.3 14
Sweden (1995) 2.4 22
Switzerland (1995) 5.7 172
United Kingdom (1995) 36.4 241
TOTAL 184.23
Note: All data are calculated from Eurostat data, except for Denmark,
Norway and Sweden.
Figure 3.1 Catchment area of the Greater North Sea showing themain river systems and areas of high population density.Source: from Grote Bosatlas (1988) as in North SeaTask Force (1993).
29
on the Conservation of Migratory Species of Wild Animals,the African-Eurasian Waterbird Agreement for theprotection of migrating water birds aims to protect themost important breeding, feeding, resting and overwin-tering areas in the African-European region (CWSS, 1998).
Areas that are still in a natural or near natural staterequire special protection. The Wadden Sea TrilateralConservation Area is an example, and areas outside theWadden Sea could be protected under the RamsarConvention and relevant EC Directives to the extent thatthey are applicable, or under Annex V of the OSPARConvention once it enters into force.
As a consequence of the 1988 seal virus epidemic,the Wadden Sea States gave special protection to thecommon seal (Phoca vitulina) population by implementingthe 1990 Agreement on the Conservation of Seals in theWadden Sea under the Bonn Convention. All small
cetaceans are protected by the Agreement on theConservation of Small Cetaceans in the Baltic and NorthSeas (ASCOBANS) under the Bonn Convention, althoughNorway does not subscribe to it. Protection and conserva-tion areas will be designated in Scotland (Moray Firth,bottle-nose dolphins (Tursiops truncatus)) and in theWadden Sea (near Sylt, harbour porpoises (Phocoenaphocoena)).
3.3.2 Archaeological conservationPart of the floor of the North Sea is submerged land, andin centuries past quite a number of villages in theSouthern Bight have been submerged by the sea.Archaeological remains and shipwrecks, although usuallywell preserved in anaerobic bottom sediments, aresubject to disturbance and destruction by mineral
3 Human activities
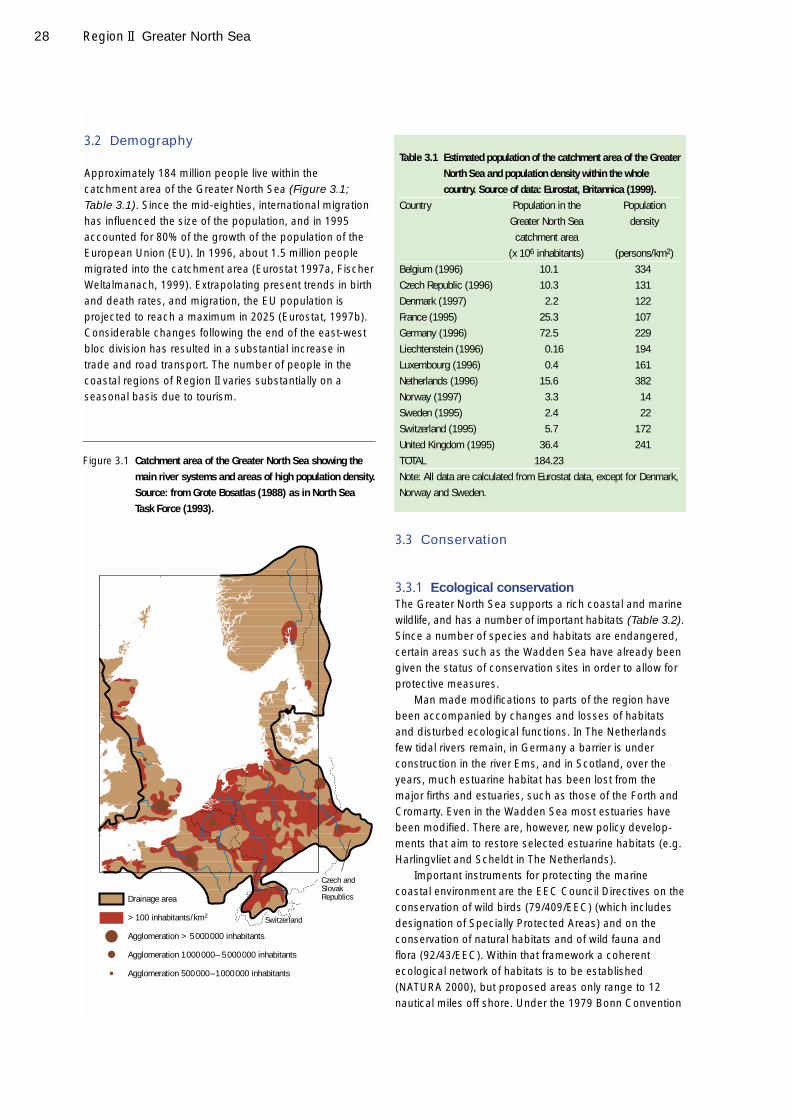
Table 3.2 Examples of important habitats, their conservation significance and international conventions.Habitat type and conservation significance Examples and Conventions (see key below)
Sea cliffs
Nesting seabirds (puffins, gannets, guillemots, razorbills, shags), Lummenfelsen, Helgoland (1), Caithness Cliffs (1,2), Foula (1),
maritime plants, and geological exposure St.Abbs (1,2), Fair Isle (1), Bempton Cliffs, Ile d’Ouessant,
Gullmarsfjord, Sept Iles–Cap Fréhel
Sand dunes
Distinctive flora and invertebrate fauna, Lower Dornoch Firth including Morrich More (2), Invernaver (2),
geomorphological systems Durness (2), Barry Links (2), North Norfolk coast, Marquenterre,
West coast of, Jutland, De Westhoek, Wadden Sea (1,2,3,5,6),
Jærstrendene, Listastrendene
Shingle banks
Distinctive flora and invertebrate fauna, Dungeness, Havergate Island and Orfordness, Culbin Sands (2),
geomorphological systems Spey Bay (2), Estuaires du Trieux et du Jaudy, Sillon de Talbert
Salt marshes
Breeding waders and seabirds (shelduck, red shank, North Norfolk coast, Minsmere and Walberswick, Wadden Sea
black-headed gulls), distinctive flora (1,2,3,5,6), Het Zwin, Stigfjord, Baie du Mont Saint-Michel
Intertidal mud flats
Major internationally important feeding areas for four million Firth of Forth (1), Moray Basin Firths and Bays (1,2,3), The Wash,
wading birds and ducks such as knot and oyster catchers, Foulness and Maplin Sands, Chichester and Langstone
fish nursery areas, harbours, common seal haul-out sites Wadden Sea (1,2,3,5,6), Baie de Somme, Kurefjord, Presterødkilen (3),
Ilene (3)
Subtidal sediments
Marine grass, eel grass, maerl, rare fish, Bluemell Sound, Shetland, Tamar, Lower Humber, Oosterschelde,
invertebrate communities Aalborg Bay, Gullmarsfjord, Øra, Kosterfjorden, Wadden Sea
(1,2,3,5,6)
Subtidal rocks
Rich invertebrate communities of boreal and lusitanian origin, St. Abbs (2), Cap Gris-Nez, Dover to Kingsdown Cliffs,
including sea fans, cup coral Brittany, Kosterfjorden
(1) Wild Birds Directive 79/409/EEC
(2) Habitats Directive 92/43/EEC
(3) Ramsar Convention
(4) World Heritage Convention
(5) Bonn Convention: Agreement on the Conservation of Seals in the Wadden Sea
(6) Bonn Convention: Agreement on the Conservation of Small Cetaceans of the Baltic and North Seas – ASCOBANS
30
extraction, navigational dredging, pipe laying, andpollution.
Special legislation for protecting marine archaeo-logical relics exists in most North Sea countries. The‘European Convention on the Protection of theArchaeological Heritage’ regulates sites of CulturalHeritage significance, both on land and in the sea.Moreover a draft Convention on the underwater culturalheritage is under discussion within the UN.
3.4 Tourism and recreation
Tourism in North Sea coastal areas and adjacent land isan important social and economic activity (Table 3.3)with developments creating intense pressure on the envi-ronment. The numbers of overnight stays and the numberof berths in marinas has increased over the last decade.Recreation can mean more pressure on the dynamicprocesses of the dunes, for example because of theconstruction of recreational housing, and thus causedisturbances of sea bird habitats. Another effect islittering of the beaches. In order to reduce disturbance, insome areas management policy aims to avoid the devel-opment of new marinas and to impose speed limits forboats. Zones where recreational activities (includingboating) are forbidden have been established in ecologi-cally sensitive areas.
Tourism has a seasonal pattern and the stress uponthe ecosystem is consequently unevenly distributed overthe year. For example, in the National Park of theWadden Sea, 75 – 90% of all overnight stays are bookedfor the period April-October. In some areas the numberof overnight stays per year amounts to more than 20million, for example in the North Sea area of Denmark 25million overnight stays were counted in 1996 (Table 3.3),which may be compared with the 2.2 million Danes livingin this area.
3.5 Fishing
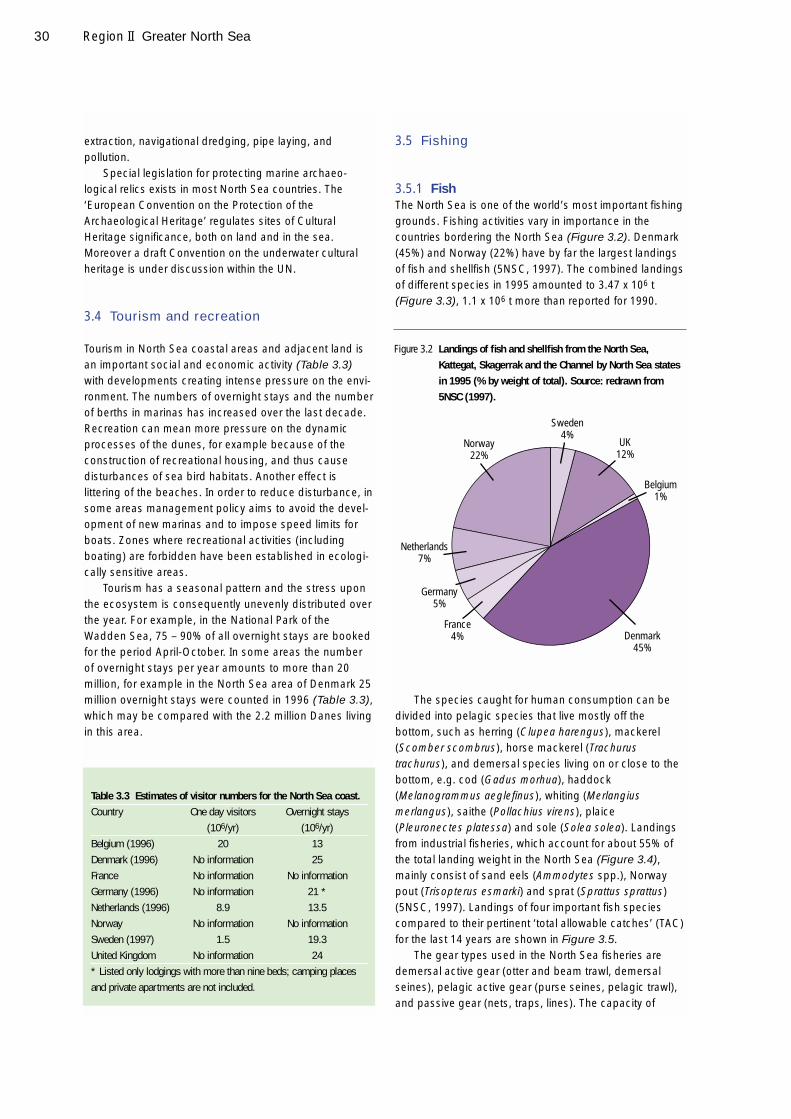
3.5.1 FishThe North Sea is one of the world’s most important fishinggrounds. Fishing activities vary in importance in thecountries bordering the North Sea (Figure 3.2). Denmark(45%) and Norway (22%) have by far the largest landingsof fish and shellfish (5NSC, 1997). The combined landingsof different species in 1995 amounted to 3.47 x 10⁶ t(Figure 3.3), 1.1 x 10⁶ t more than reported for 1990.
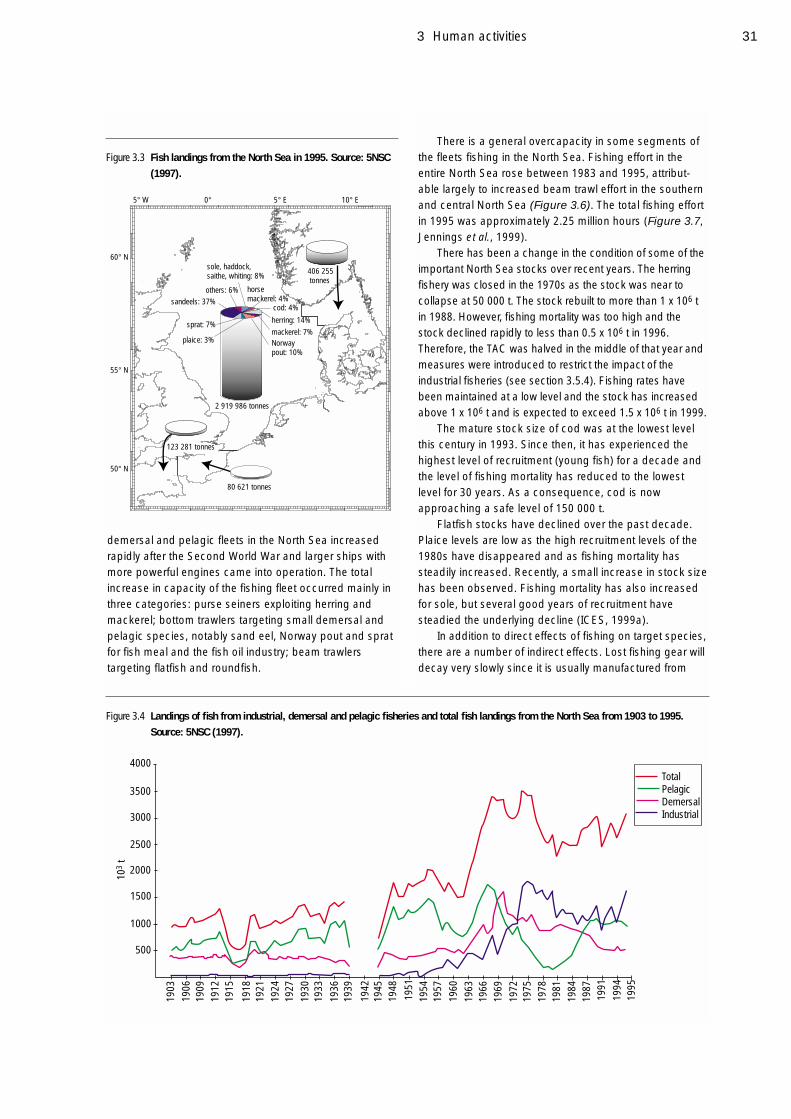
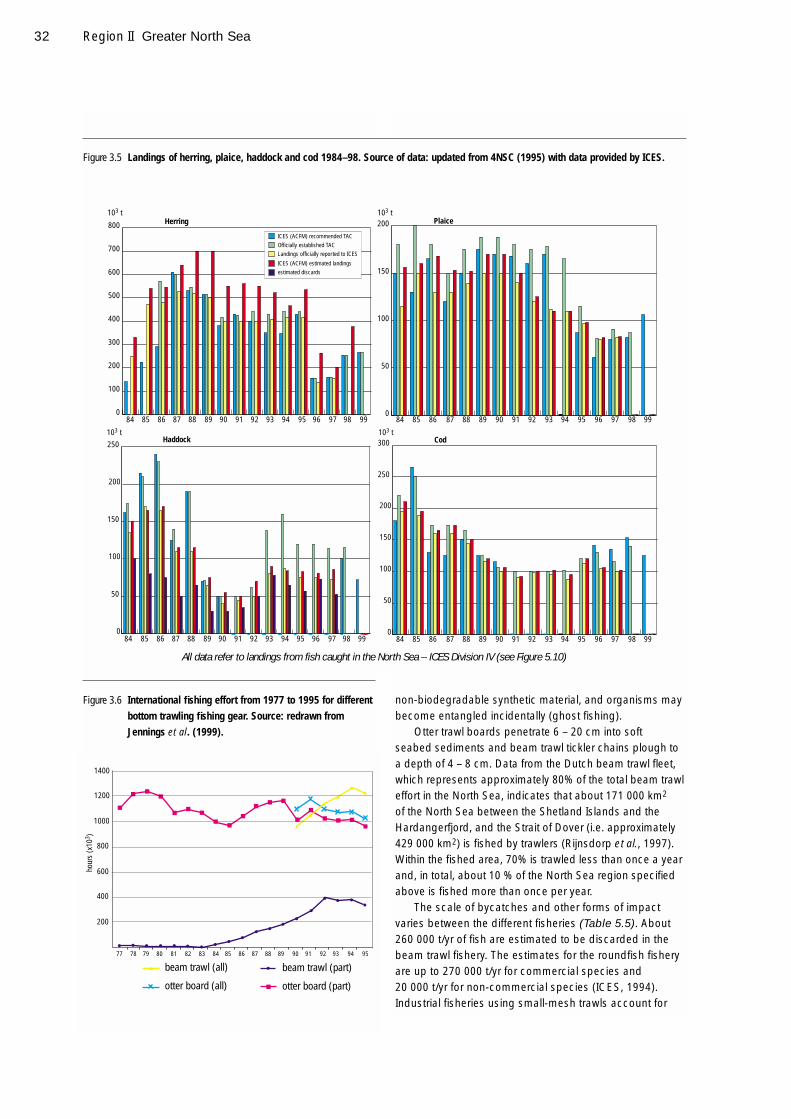
The species caught for human consumption can bedivided into pelagic species that live mostly off thebottom, such as herring (Clupea harengus), mackerel(Scomber scombrus), horse mackerel (Trachurustrachurus), and demersal species living on or close to thebottom, e.g. cod (Gadus morhua), haddock(Melanogrammus aeglefinus), whiting (Merlangiusmerlangus), saithe (Pollachius virens), plaice(Pleuronectes platessa) and sole (Solea solea). Landingsfrom industrial fisheries, which account for about 55% ofthe total landing weight in the North Sea (Figure 3.4),mainly consist of sand eels (Ammodytes spp.), Norwaypout (Trisopterus esmarki) and sprat (Sprattus sprattus)(5NSC, 1997). Landings of four important fish speciescompared to their pertinent ‘total allowable catches’ (TAC)for the last 14 years are shown in Figure 3.5.
The gear types used in the North Sea fisheries aredemersal active gear (otter and beam trawl, demersalseines), pelagic active gear (purse seines, pelagic trawl),and passive gear (nets, traps, lines). The capacity of
Region II Greater North Sea
Table 3.3 Estimates of visitor numbers for the North Sea coast.Country One day visitors Overnight stays
(106/yr) (106/yr)
Belgium (1996) 20 13
Denmark (1996) No information 25
France No information No information
Germany (1996) No information 21 *
Netherlands (1996) 8.9 13.5
Norway No information No information
Sweden (1997) 1.5 19.3
United Kingdom No information 24
* Listed only lodgings with more than nine beds; camping places
and private apartments are not included.
Sweden4%
UK12%
Belgium1%
Denmark45%
France4%
Germany5%
Netherlands7%
Norway22%
Figure 3.2 Landings of fish and shellfish from the North Sea,Kattegat, Skagerrak and the Channel by North Sea statesin 1995 (% by weight of total). Source: redrawn from5NSC (1997).
31
demersal and pelagic fleets in the North Sea increasedrapidly after the Second World War and larger ships withmore powerful engines came into operation. The totalincrease in capacity of the fishing fleet occurred mainly inthree categories: purse seiners exploiting herring andmackerel; bottom trawlers targeting small demersal andpelagic species, notably sand eel, Norway pout and spratfor fish meal and the fish oil industry; beam trawlerstargeting flatfish and roundfish.
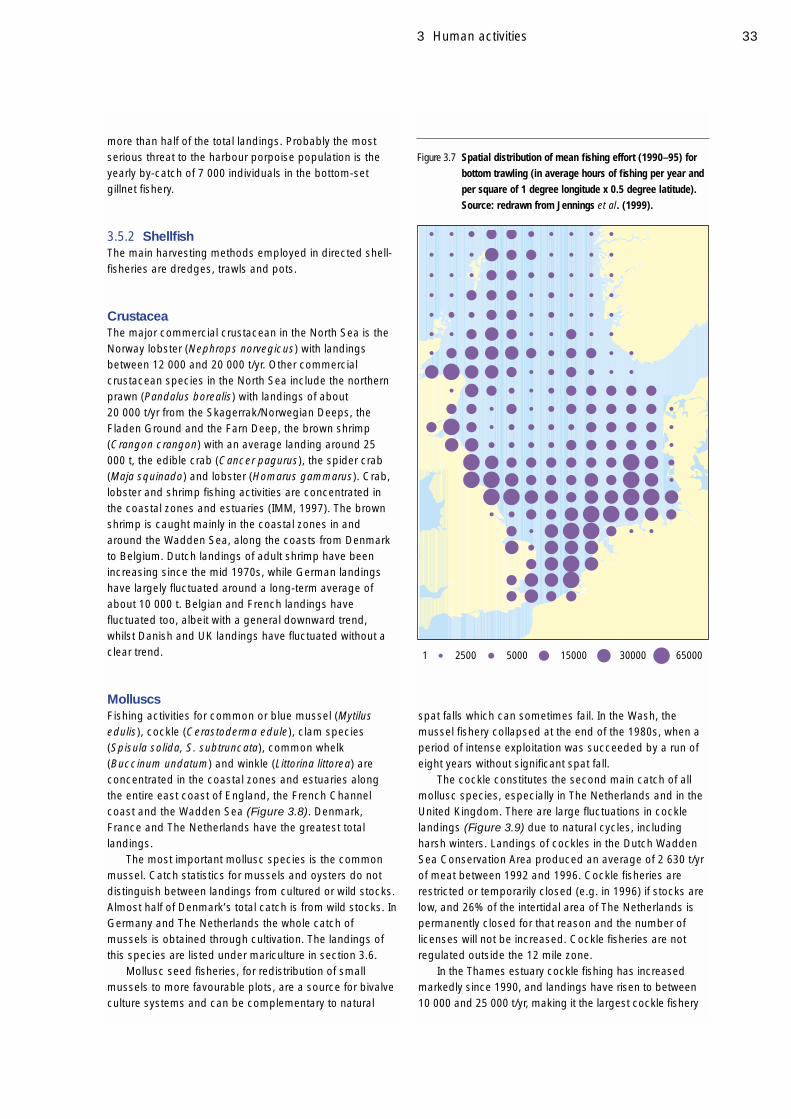
There is a general overcapacity in some segments ofthe fleets fishing in the North Sea. Fishing effort in theentire North Sea rose between 1983 and 1995, attribut-able largely to increased beam trawl effort in the southernand central North Sea (Figure 3.6). The total fishing effortin 1995 was approximately 2.25 million hours (Figure 3.7,Jennings et al., 1999).
There has been a change in the condition of some of theimportant North Sea stocks over recent years. The herringfishery was closed in the 1970s as the stock was near tocollapse at 50 000 t. The stock rebuilt to more than 1 x 10⁶ tin 1988. However, fishing mortality was too high and thestock declined rapidly to less than 0.5 x 10⁶ t in 1996.Therefore, the TAC was halved in the middle of that year andmeasures were introduced to restrict the impact of theindustrial fisheries (see section 3.5.4). Fishing rates havebeen maintained at a low level and the stock has increasedabove 1 x 10⁶ t and is expected to exceed 1.5 x 10⁶ t in 1999.
The mature stock size of cod was at the lowest levelthis century in 1993. Since then, it has experienced thehighest level of recruitment (young fish) for a decade andthe level of fishing mortality has reduced to the lowestlevel for 30 years. As a consequence, cod is nowapproaching a safe level of 150 000 t.
Flatfish stocks have declined over the past decade.Plaice levels are low as the high recruitment levels of the1980s have disappeared and as fishing mortality hassteadily increased. Recently, a small increase in stock sizehas been observed. Fishing mortality has also increasedfor sole, but several good years of recruitment havesteadied the underlying decline (ICES, 1999a).
In addition to direct effects of fishing on target species,there are a number of indirect effects. Lost fishing gear willdecay very slowly since it is usually manufactured from
3 Human activities
123 281 tonnes
80 621 tonnes
2 919 986 tonnes
406 255 tonnes
0°5° W 5° E 10° E
50° N
60° N
55° N
sole, haddock,saithe, whiting: 8%
cod: 4%
horsemackerel: 4%
herring: 14%mackerel: 7%Norway pout: 10%
plaice: 3%
sprat: 7%
sandeels: 37%others: 6%
Figure 3.3 Fish landings from the North Sea in 1995. Source: 5NSC(1997).
4000
3500
3000
2500
2000
1500
1000
500
1903
1906
1909
1912
1915
1918
1921
1924
1927
1930
1933
1936
1939
1942
1945
1948
1951
1954
1957
1960
1963
1966
1969
1972
1975
1978
1981
1984
1987
1991
103
t
1994
1995
TotalPelagicDemersalIndustrial
Figure 3.4 Landings of fish from industrial, demersal and pelagic fisheries and total fish landings from the North Sea from 1903 to 1995.Source: 5NSC (1997).
32
non-biodegradable synthetic material, and organisms maybecome entangled incidentally (ghost fishing).
Otter trawl boards penetrate 6 – 20 cm into soft seabed sediments and beam trawl tickler chains plough toa depth of 4 – 8 cm. Data from the Dutch beam trawl fleet,which represents approximately 80% of the total beam trawleffort in the North Sea, indicates that about 171 000 km2
of the North Sea between the Shetland Islands and theHardangerfjord, and the Strait of Dover (i.e. approximately429 000 km2) is fished by trawlers (Rijnsdorp et al., 1997).Within the fished area, 70% is trawled less than once a yearand, in total, about 10 % of the North Sea region specifiedabove is fished more than once per year.
The scale of bycatches and other forms of impactvaries between the different fisheries (Table 5.5). About260 000 t/yr of fish are estimated to be discarded in thebeam trawl fishery. The estimates for the roundfish fisheryare up to 270 000 t/yr for commercial species and20 000 t/yr for non-commercial species (ICES, 1994).Industrial fisheries using small-mesh trawls account for
Region II Greater North Sea
0
100
200
300
400
500
600
700
800ICES (ACFM) recommended TAC
ICES (ACFM) estimated landingsestimated discards
Officially established TACLandings officially reported to ICES
Herring
0
50
100
150
200 Plaice
All data refer to landings from fish caught in the North Sea – ICES Division IV (see Figure 5.10)
0
50
100
150
200
250Haddock
0
50
100
150
200
250
300 Cod
84 85 86 87 88 89 90 91 92 93 94 95 96 97 98 99
84 85 86 87 88 89 90 91 92 93 94 95 96 97 98 99
84 85 86 87 88 89 90 91 92 93 94 95 96 97 98 99
84 85 86 87 88 89 90 91 92 93 94 95 96 97 98 99
103 t 103 t
103 t 103 t
Figure 3.5 Landings of herring, plaice, haddock and cod 1984–98. Source of data: updated from 4NSC (1995) with data provided by ICES.
1400
1200
1000
800
600
400
200
77 78 79 80 81 82 83 84 85 86 87 88 89 90 91 92 93 94 95
beam trawl (all)
otter board (all) otter board (part)
beam trawl (part)
hour
s (x
103 )
Figure 3.6 International fishing effort from 1977 to 1995 for differentbottom trawling fishing gear. Source: redrawn fromJennings et al. (1999).
33
more than half of the total landings. Probably the mostserious threat to the harbour porpoise population is theyearly by-catch of 7 000 individuals in the bottom-setgillnet fishery.
3.5.2 ShellfishThe main harvesting methods employed in directed shell-fisheries are dredges, trawls and pots.
CrustaceaThe major commercial crustacean in the North Sea is theNorway lobster (Nephrops norvegicus) with landingsbetween 12 000 and 20 000 t/yr. Other commercialcrustacean species in the North Sea include the northernprawn (Pandalus borealis) with landings of about20 000 t/yr from the Skagerrak/Norwegian Deeps, theFladen Ground and the Farn Deep, the brown shrimp(Crangon crangon) with an average landing around 25000 t, the edible crab (Cancer pagurus), the spider crab(Maja squinado) and lobster (Homarus gammarus). Crab,lobster and shrimp fishing activities are concentrated inthe coastal zones and estuaries (IMM, 1997). The brownshrimp is caught mainly in the coastal zones in andaround the Wadden Sea, along the coasts from Denmarkto Belgium. Dutch landings of adult shrimp have beenincreasing since the mid 1970s, while German landingshave largely fluctuated around a long-term average ofabout 10 000 t. Belgian and French landings havefluctuated too, albeit with a general downward trend,whilst Danish and UK landings have fluctuated without aclear trend.
MolluscsFishing activities for common or blue mussel (Mytilusedulis), cockle (Cerastoderma edule), clam species(Spisula solida, S. subtruncata), common whelk(Buccinum undatum) and winkle (Littorina littorea) areconcentrated in the coastal zones and estuaries alongthe entire east coast of England, the French Channelcoast and the Wadden Sea (Figure 3.8). Denmark,France and The Netherlands have the greatest totallandings.
The most important mollusc species is the commonmussel. Catch statistics for mussels and oysters do notdistinguish between landings from cultured or wild stocks.Almost half of Denmark’s total catch is from wild stocks. InGermany and The Netherlands the whole catch ofmussels is obtained through cultivation. The landings ofthis species are listed under mariculture in section 3.6.
Mollusc seed fisheries, for redistribution of smallmussels to more favourable plots, are a source for bivalveculture systems and can be complementary to natural
spat falls which can sometimes fail. In the Wash, themussel fishery collapsed at the end of the 1980s, when aperiod of intense exploitation was succeeded by a run ofeight years without significant spat fall.
The cockle constitutes the second main catch of allmollusc species, especially in The Netherlands and in theUnited Kingdom. There are large fluctuations in cocklelandings (Figure 3.9) due to natural cycles, includingharsh winters. Landings of cockles in the Dutch WaddenSea Conservation Area produced an average of 2 630 t/yrof meat between 1992 and 1996. Cockle fisheries arerestricted or temporarily closed (e.g. in 1996) if stocks arelow, and 26% of the intertidal area of The Netherlands ispermanently closed for that reason and the number oflicenses will not be increased. Cockle fisheries are notregulated outside the 12 mile zone.
In the Thames estuary cockle fishing has increasedmarkedly since 1990, and landings have risen to between10 000 and 25 000 t/yr, making it the largest cockle fishery
3 Human activities
Figure 3.7 Spatial distribution of mean fishing effort (1990–95) forbottom trawling (in average hours of fishing per year andper square of 1 degree longitude x 0.5 degree latitude).Source: redrawn from Jennings et al. (1999).
25001 5000 15000 30000 65000

34
in Britain. In the Wash landings between 1970 and 1993ranged from 1 000 – 10 000 t/yr, but since then they havedeclined due to a run of poor recruitment. In 1996–7 stockswere low and landings were restricted by seasonal and bedclosures, but a modest recovery in stocks began in 1998–9.In Denmark and Germany cockle fishing is negligible.
The fisheries for Spisula sp. started in the 1990s inDenmark and The Netherlands and have increased.Extremely low temperatures in the winter of 1995/96 led tomass mortality of Spisula solida. and it is not currentlypossible to fish for Spisula sp. in the area north of theWadden Sea Islands (5NSC, 1997).
Scallops, mainly the great scallop (Pecten maximus),have been fished around Shetland and Orkney and in theMoray Firth with landings ranging up to a maximum of4 527 t in 1996. Landings from the east of Scotlandreached 1 900 t in 1995 before falling sharply to 678 t in1996. In Norway, landings of scallops reached about 7 700 t (1994–5). Scallops are also fished in the Baie deSaint-Brieuc as well in the Channel where landings arerapidly increasing.
3.5.3 SeaweedsSeaweeds, and in particular large brown algae such asthe knotted wrack (Ascophyllum nodosum) and kelp
Region II Greater North Sea
0° 5° E 10° E5° W
50° N
55° N
60° N
Cc Chequered Carpet shellC CocklesD DogwhelkHM Horse musselM MusselOy OystersP Paphia rhomboidesS Spisula sp.Sc Great ScallopQ Queen ScallopWv Warry VenusW Whelk
ScMHmC
Oy
C
M C OyM
Oy M
MOy
S
C S M Oy
MS M
S
S MS C
CS MOyCW
CWCM
WOy W
Sc
P
Oy
ScQ Sc
S Wv CcD
QW
M Sc
C
Figure 3.8 Main mollusc fishing areas in the Greater North Sea.Source: redrawn from OSPAR 1998a.
0
10000
20000
30000
40000
50000
60000
70000
1977 1979 1981 1983 1985 1987 1989 1991 1993 1995 1997 1999
The Netherlands Germany, Lower Saxony Germany, Schleswig Holstein Denmark
tonn
es w
w
Figure 3.9 Total landings of cockles (tonnes wet weight) in all regions of the Wadden Sea from 1977 to 1997. Source: De Jong et al. (1999).
35
(Laminaria hyperborea, L. digitata), are occasionallyharvested for alginate production, fertilisation and phar-maceutical use along some parts of the United Kingdomcoast, along the French coast of the Channel and alongthe Norwegian west coast. The total amount ofL. hyperborea harvested in the Norwegian part of theNorth Sea was on average 77 000 t/yr from 1995–7. InFrance in 1996, 57 000 t of kelp and 15 000 t of wrack(Fucus sp.) were harvested.
3.5.4 Fisheries managementManagement of North Sea fisheries is regulated within thewaters of EU Member States by the EU Common FisheriesPolicy, and within Norwegian waters by national policy.
The most obvious tool in fisheries management is theTAC. International TACs, and national allocations withinthe TACs are agreed annually for the main fin-fish stocksof commercial importance but also for Norway lobster andprawn. TACs are agreed by the EU and Norway on recom-mendation by ICES. Other measures include, for example,the control of mesh size and net geometry, regulation ofthe minimum landing size and the by-catch limit andclosures by season and area. Enforcement is undertakennationally through the use of, for example, vessel lists andlicences, log-book regulations and satellite monitoring.The EU Multi-annual Guidance Programme (MAGP)regulates the size of EU fleets.
Since 1998, advice, provided by the ICES AdvisoryCommittee on Fishery Management (ACFM) and the EUScientific, Technical & Economic Committee on Fisheries,strives towards consistency with a precautionaryapproach to fisheries management. In particular, ACFMhas identified limit reference levels for mature stockbiomass and fishing mortality and suggested precau-tionary reference levels. The methods are constantlybeing revised and improved in the internationallyappointed working groups.
Data quality remains a concern. The accuracy of theannual TACs depends on the estimate of stockabundance. This is dependant on the availability of goodquality catch data and information on stock abundancefrom surveys. Black fish or illegal landings can thereforeundermine the system of management by TACs. Discards(see below) which are not monitored on an annual basisby most countries also affect the accuracy of stockassessments and TACs.
Discarding is the practice of throwing fish (and othermarine organisms) back into the sea. In EU watersundersized fish, or fish over quota, have to be discarded.In contrast, in Norwegian waters no discarding of maincommercial species is permitted. Most discarded fish die.Discarding of young flatfish is high on inshore nurserygrounds, mixed roundfish discards are also high. Levelsof discarding vary, however, by species, areas, fleets and
seasons (Cotter et al., 1999). ICES summarised 1998statistics on discards in the North Sea (ICES, 1999b, seealso chapter 5).
Specific measures recently introduced include:● a revised regulation for the conservation of fishery
resources through technical measures for theprotection of juvenile marine organisms;
● an amendment to the control regulation requiring largervessels to carry satellite monitoring equipment;
● new North Sea TACs for sandeels, anglerfish (Lophiuspiscatorius), megrim (Lepidorhombus whiffiagonis), dab(Limanda limanda) and flounder (Platichthys flesus),lemon sole (Microstomus kitt) and witch(Glyptocephalus cynoglossus), skates and rays (e.g.Raja sp., Dasyatis sp.), turbot (Psetta maxima) and brill(Scophthalmus rhombus);
● the reduction of over-capacity of the EU fishing fleet bythe ‘Multi-Annual Guidance Programme’ (MAGP).
The MAGP III (1992–6) aimed to reduce the capacityof fishing fleets by reducing tonnage and engine power.The level of reduction was dependant on the speciescaught and varied from no change up to a maximum of20% in terms of 1991 fleet capacity.
In the ‘Annual Report to the Council and to theEuropean Parliament on the results of the multi-annualguidance programmes for the fishing fleets at the end of1997’, the European Commission noted that the imple-mentation of the MAGP III had been successful inrestructuring the European fleet. Between 1991 and 1996the EU fleet tonnage and engine power was reduced bymore than 10%. But it is noted that the degree to whichprogrammes have been respected varies significantlybetween Member States. Two countries had failed to meetthe objectives of MAGP III by the end of 1997, TheNetherlands and, to a lesser degree, France. Othercountries achieved greater reductions than MAGP III hadrequired. The Danish and German fleets are now morethan 20% below their target tonnage.
Although fleets have been reduced, the criticism fromIMM 1997 was that ‘the reduction has been compensatedfor by an increase in efficiency, with the result that noreduction in fishing pressure has been achieved’. Thismay have happened through an increase of fishing days.
On account of this, the European Commissionadopted MAGP IV for the period 1997 – 2001, with the aimof reducing fishing effort by 30% on stocks considered atrisk of depletion and by 20% on over-fished stocks.
In 1998, Norway introduced a decommissioningscheme for coastal fishing vessels, similar to that forpurse seiners in 1996. Regulations were aimed atprohibiting access of new trawlers to the shrimp fisheries.
Various national conservation measures have alsobeen introduced. The UK introduced nursery areas for seabass (Dicentrarchus labrax), designated ports of landing
3 Human activities
36
and restrictions to prevent fish from being discarded afterthey had been entered in a ship’s log-book and placed inthe hold. Improvements have also been made to theselectivity of Nephrops twin-rig trawls and in net geometrymore generally. In Norwegian waters no discarding ispermitted. Germany introduced a temporary closed areain 1996 to protect juvenile cod in the German Bight. ADanish action plan for reducing incidental by-catches ofharbour porpoises includes measures such as the use ofacoustic alarms, modifications to fishing equipment andregulation of certain types of fisheries.
Within EC legislation areas have been defined withlimited fishing activities for the protection of juvenile fish,e.g. the plaice box in the south-eastern North Sea, and abox for Norway pout in the central North Sea.
Legislation related to shellfish fisheries has to ensurethe proper management both of the sector and theecosystem. However, many shellfish stocks e.g. Spisulasp., are localised and are therefore managed at nationalrather than EU level. Legislation for shellfisheriescomprises TACs for Norway lobster and for northernprawn from the Skagerrak/Norwegian Deeps. RegulationEC/850/98 (EC, 1998), which came into force on1 January 2000, specifies minimum sizes, mesh sizebands and other gear restrictions. Minimum sizes aredefined for Norway lobster, edible crab, velvet crab(Liocarcinus puber), crawfish (Palinurus spp.), whelk,and scallop. Other regulations may apply to themodernisation of fishery techniques, a reduction offishing effort (either by absolute, or by selected restric-tions for certain areas or periods), a minimum landingsize, or a combination of all these.
3.6 Mariculture
Mariculture is undertaken in many of the North Sea states,but on a negligible scale in Belgium and Sweden. TheNetherlands and Germany practise commercial shellfishfarming only in the marine area. Mariculture may introduceto the environment nutrients (only 25% of the nutrients
found in fish feed are converted into biomass (UBA,1996)), organic matter, antifouling agents, biocides, anti-biotics and other pharmaceuticals and colouring agents.Farmed individuals may escape, resulting in potentialthreats to native species.
3.6.1 FishSalmon (Salmo salar) is the main product of Norwegianand Scottish mariculture (Table 3.4). In Norway, between1995 and 1996, the production of salmon increased by32% to 120 000 t. In Orkney and Shetland in 1997 salmonproduction was 27 700 t, five times higher than in 1991.
The second main product in mariculture is the rainbowtrout (Onchorhynchus mykiss). In Norway, the productionof rainbow trout decreased by 28% in 1995. In Denmark,10 land-based facilities for trout production are situatedwithin in the North Sea catchment area. In Scotland in1996 only 647 t was produced at six seawater sites, repre-senting 14% of total Scottish rainbow trout production.
Other less important species cultivated in Norway arehalibut (Hippoglossus hippoglossus), arctic char(Salvelinus alpinus), cod, turbot and eel (Anguilla anguilla).Sea trout (Salmo trutta), cod, halibut and turbot, sea bassand eels are being considered for production in the UK.
3.6.2 ShellfishFarming of mollusc species includes blue mussels,oysters (Ostrea edulis, Crassostrea gigas) and scallops(Figure 3.8; Table 3.4) (OSPAR, 1998a).
Blue mussels are cultured in Denmark in the NorthSea and in the Limfjord, in the Dutch and GermanWadden Sea, in the Eastern Scheldt, along the coast ofBrittany, in Norway, Sweden and the UK. Orkney andShetland produce small but increasing quantities ofmussels (107 t in 1997).
Oysters are cultured in the south-west of TheNetherlands, in Norway, along the coasts of Normandyand Brittany, in Germany, on a small scale in Orkney andShetland and in several estuaries on the south-east coast
Region II Greater North Sea
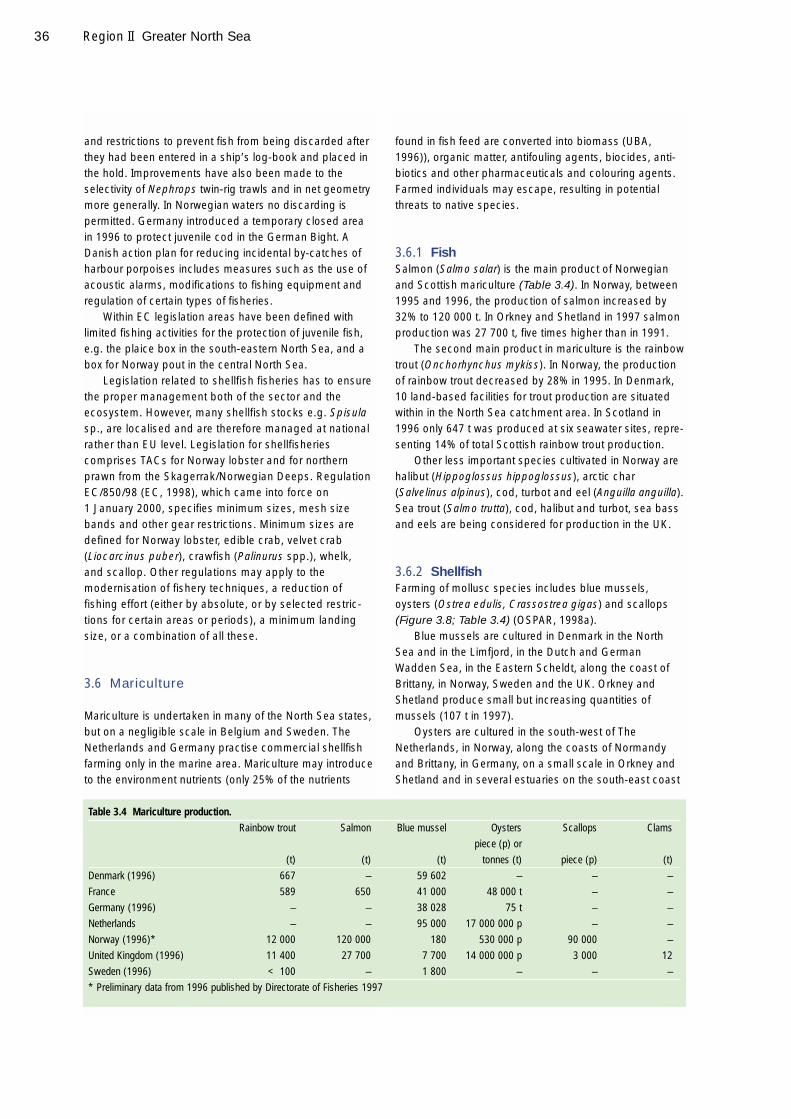
Table 3.4 Mariculture production.Rainbow trout Salmon Blue mussel Oysters Scallops Clams
piece (p) or
(t) (t) (t) tonnes (t) piece (p) (t)
Denmark (1996) 667 – 59 602 – – –
France 589 650 41 000 48 000 t – –
Germany (1996) – – 38 028 75 t – –
Netherlands – – 95 000 17 000 000 p – –
Norway (1996)* 12 000 120 000 180 530 000 p 90 000 –
United Kingdom (1996) 11 400 27 700 7 700 14 000 000 p 3 000 12
Sweden (1996) < 100 – 1 800 – – –
* Preliminary data from 1996 published by Directorate of Fisheries 1997

37
of England.Research has shown that it is technically feasible to
rear native lobsters. In the UK, attempts are now beingmade to produce young lobsters for release into the sea,for restocking purposes.
To avoid the introduction of non-native species intoDutch coastal waters a new policy on the importation ofshellfish and crustaceans was developed in 1996. By theyear 2001 the introduction of native species from popula-tions outside the North Sea area (boreal) into Dutchcoastal waters will no longer be allowed.
3.7 Coastal engineering and landreclamation
Damming of rivers, for hydroelectric power generation forexample, can cause drastic changes to the seasonaloutflow of fresh water, with negative impacts on theproductivity of coastal waters. Coastal land reclamationand dykeing change the physical environment which mayaffect spawning areas, biological diversity and wildlife.
3.7.1 Coastal defenceCoastal defence work and land reclamation is a commonactivity in the Greater North Sea, particularly around itsshallow southern and eastern margins. Settlements alongthe Wadden Sea coast and on islands are especiallyvulnerable to storm surges and sea level changes. In viewof a predicted sea level rise due to climatic change,countries revise their plans for coastal protection on a regular basis, for instance Germany does so every 10 – 15 years.
On sandy coasts, natural dunes play a major role incoastal protection. In several cases, dunes are protectedagainst erosion by hard structures. However, this may leadto destruction of the natural beach through increasedsediment deposition at some locations and enhancederosion elsewhere. The present tendency is to use soft engi-neering approaches, such as artificial beach replenishment.
In 1996, The Netherlands processed 7.7 x 10⁶ m3 ofsand for beach nourishment. With a predicted sea level riseof 60 cm in one century along the Dutch coast it isestimated that twice the present quantity of sand will beneeded. In Germany, beach replenishment is carried out onthe island of Sylt (1996: 1.03 x 10⁶ m3, 1997: 0.7 x 10⁶ m3
and 1998: 0.07 x 10⁶ m3) and at the islands of Langeoog,Norderney and Borkum. The major Danish beach nourish-ment activity is on a 110 km stretch along the west coast ofJutland (1996: 3.3 x 10⁶ m3). In the UK, on the Lincolnshirecoast, beaches are recharged with sand.
Within the UK, future policies on risks of coastalflooding and erosion have been drafted in Norfolk CountyCouncil’s ‘Norfolk to 2006’. Coastal protection schemes
have been designed to include allowances for relative sealevel rise up to 2030. These allowances, which also takeaccount of long term geological tilt, vary between 4 mmand 6 mm/yr, depending on the location. An alternativeoption for the protection of beaches is to deploy (perma-nently submerged) offshore breakwaters parallel to thecoast, as it is envisaged for example in Koksijde(Belgium).
3.7.2 Land reclamationMost land reclamation projects have been carried out over previous centuries, and major activities havebeen conducted along the Dutch and German coasts(e.g. in the Wadden Sea and Rotterdam port area). Planson the further expansion of the port of Rotterdam areathrough land reclamation are at an advanced state of development.
3.7.3 Power generationGeneration of electricity from tidal energy requires aminimum tidal amplitude of about 3 m. Due to therelatively low tidal excursion in the North Sea (Figure 2.19) opportunities for tidal power generation arevery limited. The only tidal power station in the region hasbeen operational since 1967 on the Rance estuary, nearSt Malo in Brittany, generating 240 MW (nominal).
At present, no power is generated from wave energyin the North Sea.
As wind is a cheap source of renewable energy thereare intensive efforts to find convenient sites withsufficient wind energy and low population. The economicgeneration of electricity from wind, requires an averagewind speed (at 10 m) greater than 5 – 6 m/s. Theproblems associated with wind power generatorsinclude the need for space, the unsightliness of theturbines, the direct mortality of birds caused by rotatingblades and the noise impact especially on birds. Theconstruction of wind turbines in the Wadden SeaConservation Area is prohibited by national legislation,and is only permitted outside the Conservation Area ifecological and landscape characteristics are notnegatively affected.
Plans are being developed for wind parks off shore. Legislation for offshore wind parks is under development in Belgium. In Denmark, current plans foroffshore wind power generation in Region II include twolarge scale parks, one situated off the Danish west coast and one off the island of Laesø in the Kattegat. InThe Netherlands, a plan for an off shore wind park, with100 wind turbines generating 100 MW, is underdiscussion. Offshore wind power generation is alsobeing seriously considered at a number of locations offthe English coast.
3 Human activities
38
3.8 Sand and gravel extraction
The marine aggregate extraction industry is well estab-lished and growing in a number of countries in Region II,providing up to 15% of some nation’s demands for sandand gravel (ICES, 1992). Most commercially workabledeposits of sand and gravel occur in the shallower regionsof the North Sea. In 1996, about 40 x 106 m3 were extractedfrom the sea (Table 3.5), compared to 34 x 106 m3 in 1989.The exploitation of sand and gravel often has negativeimpacts on fishing interests, the benthic flora and fauna,coastal protection and on the physical properties of theseabed. The exploitation of shallow banks close to theshore increases the potential for coastal erosion byenhancing wave activity and, therefore, careful assessmentof the potential impact is needed. Most countries reportincreasing concerns about the extraction of aggregates(ICES, 1997). The ICES Code of Practice for theCommercial Extraction of Marine Sediments provides step-by-step advice on how marine dredging should beconducted in order to minimise conflicts with other users ofthe sea and to optimise the use of marine resources.
Exploitation of calcium carbonate shell aggregate islicensed in the Dutch part of the Wadden Sea and inareas outside the tidal inlets, with annual extractions of140 000 m3 in the Wadden Sea and 60 000 m3 in theareas outside the tidal inlets (ICES, 1997). In 1996, off theFrench coast, 562 000 t of calcareous material (shellysands and Lithothamnion banks) were extracted. In 1996,deposits of calcareous algae (maerl) were exploited inthe Orkneys (4 000 m3/yr licensed).
3.9 Dredging, dumping and discharges
Dumping of waste or other matter is prohibited by theOSPAR Convention, with the exception of dredgedmaterial, waste from fish processing, inert material ofnatural origin and, until the end of 2004, vessels or aircraft.The annual OSPAR Reports on Dumping of Wastes at Seapresent an overview of the number of permits issued formost of the dredged materials concerned.
A wider range of material, including sewage sludgeand industrial waste has been disposed of in the past.The dumping of industrial wastes was phased out in 1993when the last few UK licences for disposal at sea of liquidindustrial waste and fly ash expired. Incineration of liquidindustrial waste on special incinerator vessels in the NorthSea was terminated in 1989. The dumping of waste fromthe production of titanium dioxide was terminated in 1989.Discharges from the titanium dioxide industry arepermitted under Council Directive 92/112/EEC (EC, 1992)and are mainly confined to French and UK estuarinewaters (Seine, Humber and Tees).
3.9.1 Dredged materialDredged material dumped at sea consists primarily ofmaterial removed to keep navigation channels clear orremoved in the course of coastal construction engineeringprojects. Dredged material may be used e.g. for beachnourishment, land reclamation or for salt marsh preservation.
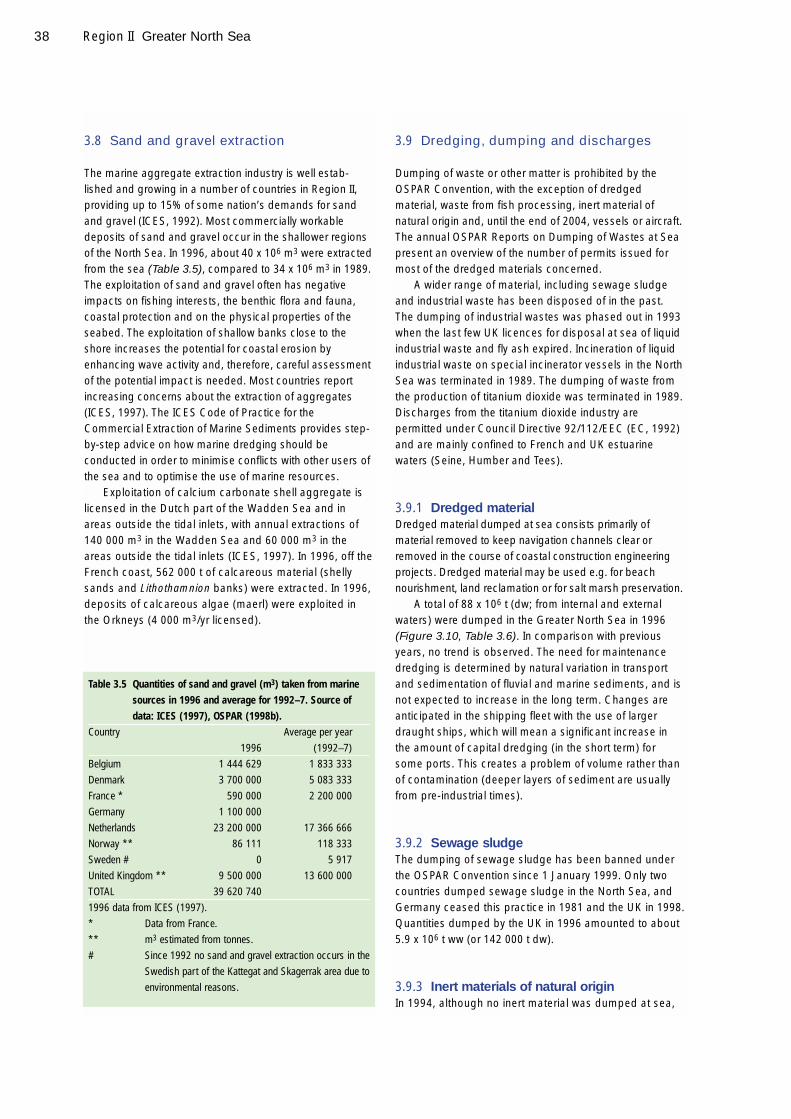
A total of 88 x 106 t (dw; from internal and externalwaters) were dumped in the Greater North Sea in 1996(Figure 3.10, Table 3.6). In comparison with previousyears, no trend is observed. The need for maintenancedredging is determined by natural variation in transportand sedimentation of fluvial and marine sediments, and isnot expected to increase in the long term. Changes areanticipated in the shipping fleet with the use of largerdraught ships, which will mean a significant increase inthe amount of capital dredging (in the short term) forsome ports. This creates a problem of volume rather thanof contamination (deeper layers of sediment are usuallyfrom pre-industrial times).
3.9.2 Sewage sludgeThe dumping of sewage sludge has been banned underthe OSPAR Convention since 1 January 1999. Only twocountries dumped sewage sludge in the North Sea, andGermany ceased this practice in 1981 and the UK in 1998.Quantities dumped by the UK in 1996 amounted to about5.9 x 106 t ww (or 142 000 t dw).
3.9.3 Inert materials of natural originIn 1994, although no inert material was dumped at sea,
Region II Greater North Sea
Table 3.5 Quantities of sand and gravel (m3) taken from marinesources in 1996 and average for 1992–7. Source ofdata: ICES (1997), OSPAR (1998b).
Country Average per year
1996 (1992–7)
Belgium 1 444 629 1 833 333
Denmark 3 700 000 5 083 333
France * 590 000 2 200 000
Germany 1 100 000
Netherlands 23 200 000 17 366 666
Norway ** 86 111 118 333
Sweden # 0 5 917
United Kingdom ** 9 500 000 13 600 000
TOTAL 39 620 740
1996 data from ICES (1997).
* Data from France.
** m3 estimated from tonnes.
# Since 1992 no sand and gravel extraction occurs in the
Swedish part of the Kattegat and Skagerrak area due to
environmental reasons.
39
300 000 t were deposited from land onto the foreshore:230 000 t by Norway and 70 000 t by the UK. Overall the disposal of such material has decreased consider-ably, as the amount for 1994 was less than 10% of thatfor 1990.
3.9.4 Ships and bulky wastes (iron scrap)In 1996, Norway dumped 6 vessels in the North Sea,mainly wooden fishing vessels, but also some ironvessels. Chemicals and loose parts were removed beforedumping. Dumping of iron/steel hulled vessels is nowforbidden, and dumping of all other ships will beforbidden after 2004.
In consideration of an initiative of the 4th InternationalConference on the Protection of the North Sea (4NSC,1995), the 1998 Ministerial Meeting of the OSPARCommission adopted Decision 98/3 on the Disposal ofDisused Offshore Installations which prohibits dumping orleaving wholly or partly in place within the marine area,disused offshore installations. Subject to assessment andconsultation under agreed procedures, derogations arepossible for the footings of steel installations weighingmore than 10 000 t and for concrete installations.
3.9.5 Discharges from offshore installationsOffshore oil and gas installations are significant sourcesof hydrocarbons. Variations in annual discharges of oilfrom offshore installations in the OSPAR Convention areaare shown in Figure 3.11 (not taking into accountsynthetic muds which fall into a different category and, forthose which degrade poorly, should be phased out by theend of 2000).
Heavy metals, PAHs and production chemicals aredischarged via produced water (Table 4.17) which is onlytreated to remove oil. These inputs have increasedsubstantially (OSPAR, 1999) which is attributed to theincreasing age of the fields. The amount of dischargedproduced water can be reduced by methods such as re-injection into the reservoir or by downhole separation,which is largely experimental at present. Operationaldischarges, comprising produced water and cuttings arediscussed in Chapter 4, as are any chemicals associatedwith those discharges. All waste from offshore installa-tions is returned to land.
OSPAR adopted on a trial basis Decision 96/3 on a Harmonised Mandatory Control System for the Use and Reduction of the Discharge of OffshoreChemicals. It aims to reduce the impact from hazardouschemicals used by the offshore industry. Lists ofcompounds that may or may not be used are compiledon the basis of (ecotoxicological) risk assessmentmodels including, for example, the ‘Chemical HazardAssessment and Risk Management Model’ (CHARM).Another decision (1997) provides a list of substances orpreparations (composed of two or more substances)which shall be subject to strong regulatory control. Sofar no substances have been identified which must notbe discharged.
When drilling bore holes during the exploration phase,use was often made of oil- and water-based muds.Contaminated cuttings were regularly dischargedoverboard. At the 4th NSC, ministers invited OSPAR toban discharges of oil contaminated cuttings by 1997. Inexceptional cases the discharge of oil contaminatedcuttings could be allowed only when essential for safety orgeological reasons, and if consistent with PARCOMDecision 92/2.
3 Human activities
sewage sludge (ceased 1998)
approximate position of dumping site for mainly dredged material
5° W 5° E 10° E0°
50° N
55° N
60° N
Figure 3.10 Dumping areas in the Greater North Sea in 1996 (1994for France). Source of data: OSPAR (1997a and 1999a).
Table 3.6 Dredged material (in tonnes dry weight) dumped in1996. Source: OSPAR (1999a) and national data(*).
Country
Belgium 29 264 498
Denmark * 1 536 000
France * 13 360 000
Germany 19 123 000
Netherlands 8 016 381
Norway 42 196
Sweden 3 308 608
United Kingdom 14 130 219
(United Kingdom dumped sewage sludge) (142 045)
Total dredged material dumped 88 780 902

40
3.9.6 LitterDespite pertinent laws and regulations, litter is still aconsiderable problem for the marine environment and thecoastal communities in Region II. Potential sources of litterare mainly related to waste generated by shipping(fishing, commercial) on the North Sea and touristic andrecreational activities (Table 3.7). The offshore industry isnot considered to be a source of waste pollution at seathanks to improvements in its waste managementpractice. Some waste may be depositied illegally andsome by accident. Litter may also be transported into thesea by winds, currents and rivers. It has been estimatedthat the North Sea has to cope with about 70 000 m3 oflitter per year, and some 6.6 million pieces (or 8 600 t)were estimated to be present in the Dutch sector alone.
Non-degradable plastics may constitute 95% of thetotal amount of litter in many areas of the OSPAR region.Litter, including drifting fishing nets and ropes, mayentangle and drown mammals and seabirds. It has alsobeen found to carry a variety of epiphytic organisms tosea areas that these organisms would not normally reach.Economically, the recreation sector is likely to be most
affected by litter. Remains of plastic nets can easily getcaught in ship’s propellers.
The North Sea (1991) and the Baltic Sea (1988) haveboth been designated as MARPOL Special Areas (AnnexV) where the dumping of garbage and litter from ships(e.g. household waste, cargo waste, wire straps, coveringmaterial, fishing equipment) is prohibited. Dumping ofwaste is also prohibited under the OSPAR Convention. Sofar, however, there is no indication of any improvementwith regard to litter.
3.10 Oil and gas industry
The offshore oil and gas industry has become a majoreconomic activity in the North Sea since the late 1960s.Between 1990–92 and 1996–98, the number of platformsincreased from 300 to 475, and oil production almostdoubled (Table 3.8; Figure 3.12). The major oil develop-ments have been in the northern parts of the North Sea inthe United Kingdom and Norwegian sectors(Figure 3.13). Gas deposits are exploited mainly in the
Region II Greater North Sea
18 000
16 000
14 000
12 000
10 000
8 000
6 000
4 000
2 000
0
1990 1991 1992 1993 1994 1995 1996 1997
United KingdomNorway
The NetherlandsDenmark
Germany
Figure 3.11 Total discharges of oil (in tonnes) from offshore installations to the OSPAR Convention area. Source: OSPAR (1999b).

41
shallower southern regions in the United Kingdom, Dutch,and Danish sectors, as well as in Norwegian waters. Thereare several gas and oil production platforms in theWadden Sea, with further exploration being subject totight controls. Discharges are described in section 3.9.5.
The total length of pipelines has increased as, forexample, pipelines connecting Norway and
France (840 km) and Belgium to UK (240 km involving thedredging of 4 x 10⁶ m3 sand) were completed in 1997. In1998, 9 670 km (estimated from 1998 sea charts) of rigidand flexible oil and gas pipelines formed a network ofarteries between offshore petroleum production sites andterminals on land. These pipes represent approximately1.7 and 2.2 x 10⁶ t of steel and concrete, respectively.Furthermore, approximately 5 100 t of tar and 62 000 t ofasphalt cover the pipe joints, and about 10 000 t ofaluminium and 6 500 t of zinc anodes are fitted as electro-chemical protection against corrosion. The lifetime ofindividual pipelines is estimated to be from 20 to 50 years(Jacobsen et al. 1998).
3.11 Shipping
3.11.1 Traffic and cargoThe North Sea contains some of the busiest shippingroutes in the world. In 1996 about 270 000 ships enteredthe main 50 ports in the North Sea and Channel area.Daily, more than 400 ships pass through and 600 shipscross (including 200 ferries) the Strait of Dover. In 1996there were 37 055 shipping movements transporting48 million tonnes of cargo between the North Sea and theBaltic via the Kiel Canal.
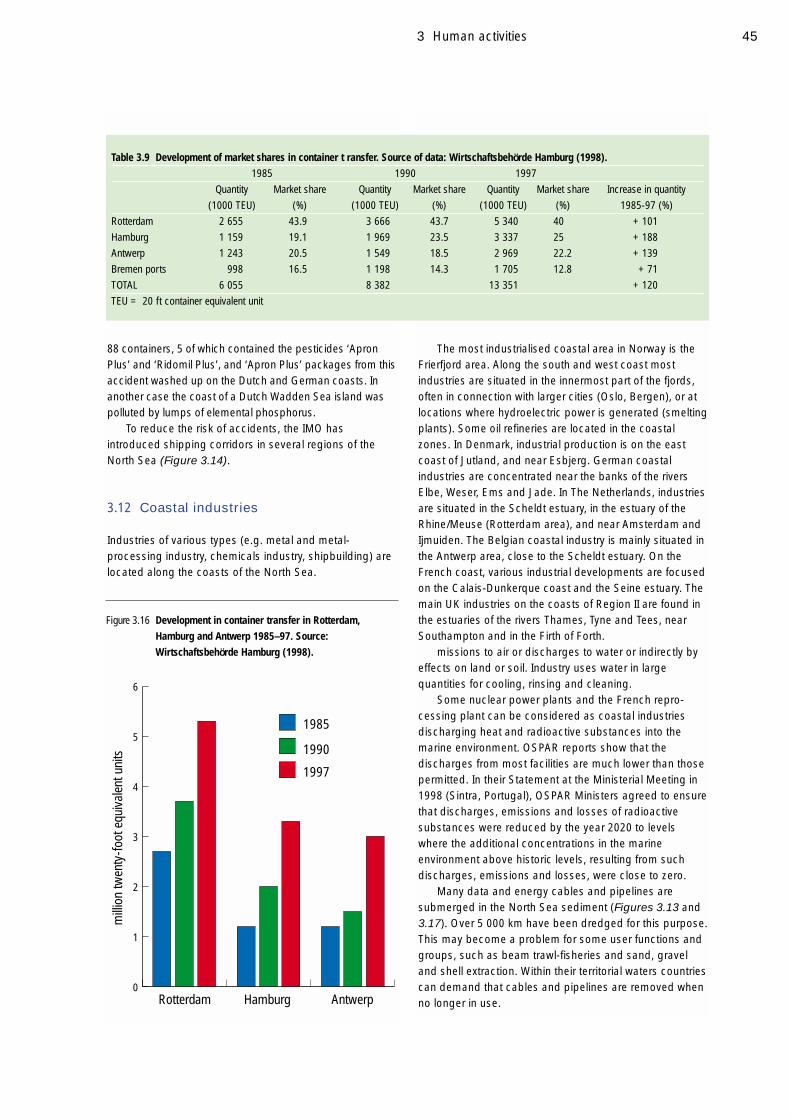
Most of Europe’s largest ports are situated on NorthSea coasts and rivers, namely Hamburg, Bremen,Amsterdam, Rotterdam, Antwerp, Le Havre, and London(Figures 3.14 and 3.15), with Rotterdam/Europoort beingthe most important. Container transfer in the main portsincreased by 120% in the last ten years (Table 3.9 andFigure 3.16). Approximately half the shipping activity inthe Greater North Sea consists of ferries and roll-on/roll-off vessels on fixed routes.
Shipping can have a negative impact on the marine
3 Human activities
0 50 100 150 200 250
Germany
Denmark
The Netherlands
Norway
UnitedKingdom
0 30 60 90 120 150 0 20 40 60 80 100
1992
1996/1998
Data for Denmark, Germany and The Netherlands are from 1996. Data for the United Kingdom are from 1997. Data for Norway are from 1998.
number ofplatforms
gasproduction
oilproduction
106 t/yr 109 m3 yr
Figure 3.12 Comparison of offshore activities in 1990–92 (North Sea Task Force, 1993) with those in 1996–98.
Table 3.7 Waste (m3) generated yearly in the North Sea region bydifferent sectors, whereof a part may end up as litter.Source: OSPAR (1997b).
Sector
Ferry traffic 290 000
Fishing vessels 100 000
Offshore installations † 90 000
Merchant shipping 60 000
Pleasure crafts 40 000
Recreation, tourism 20 000
TOTAL 600 000† Waste collection, return to land and disposal onshore is strictly
controlled in this sector. Consequently there is a low risk that waste
from offshore installations contributes to marine litter.
Table 3.8 Gas and oil production by countries bordering the NorthSea in 1996–8.
Country † Number of Gas Oil
platforms in production production
production (109 m3/y) (106 t/y)
Denmark (1996) 36 6 10
Germany (1996) 2 0.3 0.5
Netherlands (1996) 107 27.4 1.8
Norway (1998) 80 42 145
United Kingdom (1997) 250 92 128
TOTAL 475 167.7 285.3† Belgium, France and Sweden do not have gas or oil production.

42 Region II Greater North Sea
Figure 3.13 Oil and gas industry in the North Sea in 1996. Source: modified from Schöneich (1998).
10
40
4
4
Petroleum discoveryOil fieldOil pipelineOil pipeline planned or under constructionNatural gas discoveryGas fieldGas pipelineGas pipeline planned or under construction
0 100 200 km

433 Human activities
Sullom Voe
Hamburg
Bremen
Amsterdam
Rotterdam
Antwerp
DunkerqueZeebrugge
Le Havre
Southampton
London
General cargo (incl. containers)
Other bulk cargo
Coal
Ore and scrap
Oil derivatives and chemicals
Crude oil
Millions of tonnes per year
Traffic separation scheme
x
0
50
100
150
200
250
300
350
32 33
56 60
37 32
112
57
34
77
36
310
Wilhelmshaven
Figure 3.14 Shipping in the Greater North Sea, showing total cargo shipments (106 t/yr) in the main ports in 1997 and international shippingtraffic measures. Source of data: Port of Rotterdam (1999) and Department of the Environment, Transport and the Regions (UK) (1997).

44
environment due to discharges of oil and wastes, cleaningand venting tanks, air pollution, loss of cargoes containingharmful substances (50% of goods carried at sea can bedescribed as dangerous), discharges of ships’ ballastwater which may contain non-indigenous species, and theuse of anti-fouling paints containing biocides.
As from 1 August 1999, the North Sea, the Seasaround Ireland and their approaches have been estab-lished under the name North West European waters as aSpecial Area under MARPOL Annex I (oil). Within the IMO,a mechanism for a general ban on the use of organotincompounds in anti-fouling paints has been agreed. Thetarget is to prohibit their application from 2003 and torequire the removal of TBT from ships’ hulls by the year2008. Given the serious effects of TBT on snail andbivalve populations, effective implementation of thismeasure is required. Within the EC, controls on other TBTapplications have been increased with the revision ofDirective 76/769/EEC. The Marine EnvironmentalProtection Committee (MEPC) plans to develop a globallegally-binding instrument to address the harmful effectsof anti-fouling systems used on ships. Within the IMO
framework, activities are also ongoing to reduce airpollution by emissions.
3.11.2 AccidentsIn the North Sea in 1993 a serious pollution incidentoccurred when the ‘Braer’ ran aground in Shetlandreleasing 84 700 t of crude oil and 1 600 t of bunker-C oil.In the Greater North Sea, eleven accidents occurred in1994 and six accidents occurred in 1995 where pollutionof the seawater was recorded (world wide 101 in 1994and 86 in 1995) (Quell and Klimsa, 1997). In 1996, twomajor cases of fire and one of grounding were reported inthe North Sea or adjacent waters (Hooke, 1997).
In 1998, the ship ‘Pallas’, under a Bahamas flag andcarrying a shipment of timber, caught fire off the coast ofJutland and finally ran aground near the German island ofAmrum, spilling an estimated 244 m3 of heavy fuel oilcausing the death of about 16 000 overwintering birds.
Lost cargo can cause harm to the environment. In 1994,The Netherlands registered lost containers with various typesof cargo on five occasions. In one case the ‘Sherbro’ lost
Region II Greater North Sea
1989199019911992199319941995199619971998
0
50
100
150
200
250
300
350
Rotterd
am
Antwerp
Hambu
rg
Le Hav
re
Lond
on
Tees a
nd Hart
lepoo
l
Grimsb
y
Forth
Ports
Wilhelm
shav
en
Amsterda
m
Dunke
rque
Bremerh
aven
/Bremen
Southa
mpton
Zeeb
rugge
Figure 3.15 Development in shipments (106 t) in North Sea ports from 1984 to 1998.
45
88 containers, 5 of which contained the pesticides ‘ApronPlus’ and ‘Ridomil Plus’, and ‘Apron Plus’ packages from thisaccident washed up on the Dutch and German coasts. Inanother case the coast of a Dutch Wadden Sea island waspolluted by lumps of elemental phosphorus.
To reduce the risk of accidents, the IMO hasintroduced shipping corridors in several regions of theNorth Sea (Figure 3.14).
3.12 Coastal industries
Industries of various types (e.g. metal and metal-processing industry, chemicals industry, shipbuilding) arelocated along the coasts of the North Sea.
The most industrialised coastal area in Norway is theFrierfjord area. Along the south and west coast mostindustries are situated in the innermost part of the fjords,often in connection with larger cities (Oslo, Bergen), or atlocations where hydroelectric power is generated (smeltingplants). Some oil refineries are located in the coastalzones. In Denmark, industrial production is on the eastcoast of Jutland, and near Esbjerg. German coastalindustries are concentrated near the banks of the riversElbe, Weser, Ems and Jade. In The Netherlands, industriesare situated in the Scheldt estuary, in the estuary of theRhine/Meuse (Rotterdam area), and near Amsterdam andIjmuiden. The Belgian coastal industry is mainly situated inthe Antwerp area, close to the Scheldt estuary. On theFrench coast, various industrial developments are focusedon the Calais-Dunkerque coast and the Seine estuary. Themain UK industries on the coasts of Region II are found inthe estuaries of the rivers Thames, Tyne and Tees, nearSouthampton and in the Firth of Forth.
missions to air or discharges to water or indirectly byeffects on land or soil. Industry uses water in largequantities for cooling, rinsing and cleaning.
Some nuclear power plants and the French repro-cessing plant can be considered as coastal industriesdischarging heat and radioactive substances into themarine environment. OSPAR reports show that thedischarges from most facilities are much lower than thosepermitted. In their Statement at the Ministerial Meeting in1998 (Sintra, Portugal), OSPAR Ministers agreed to ensurethat discharges, emissions and losses of radioactivesubstances were reduced by the year 2020 to levelswhere the additional concentrations in the marine environment above historic levels, resulting from suchdischarges, emissions and losses, were close to zero.
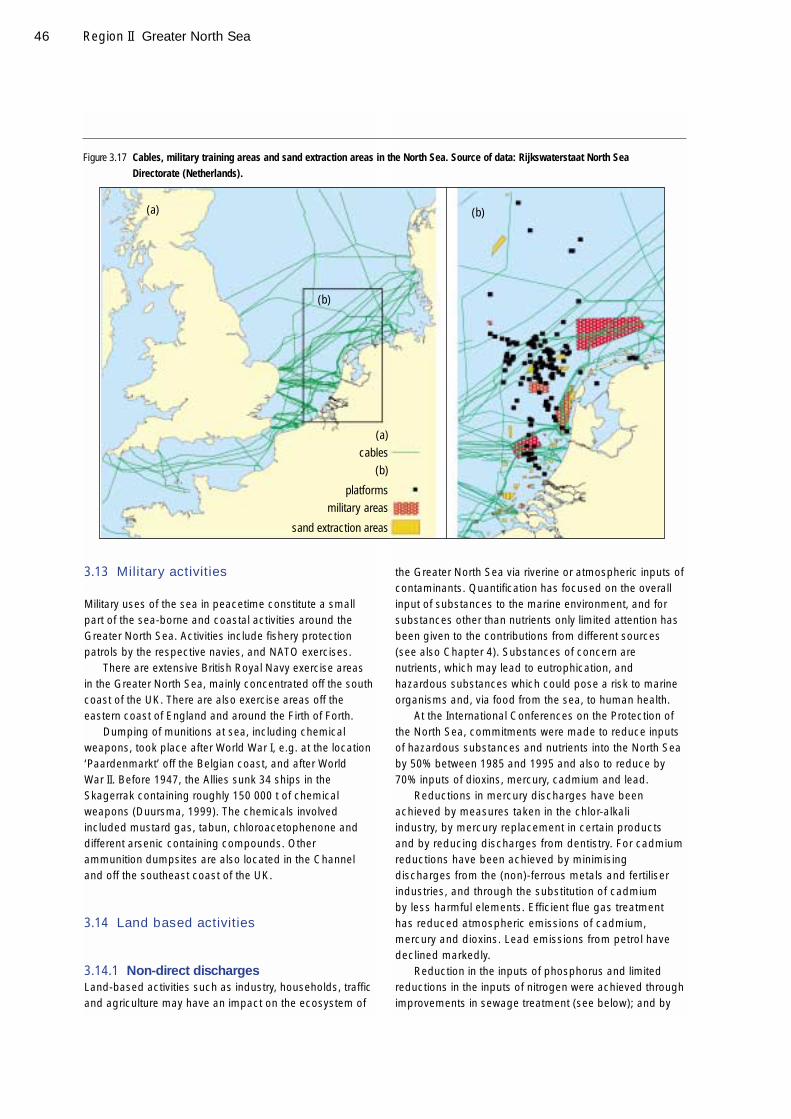
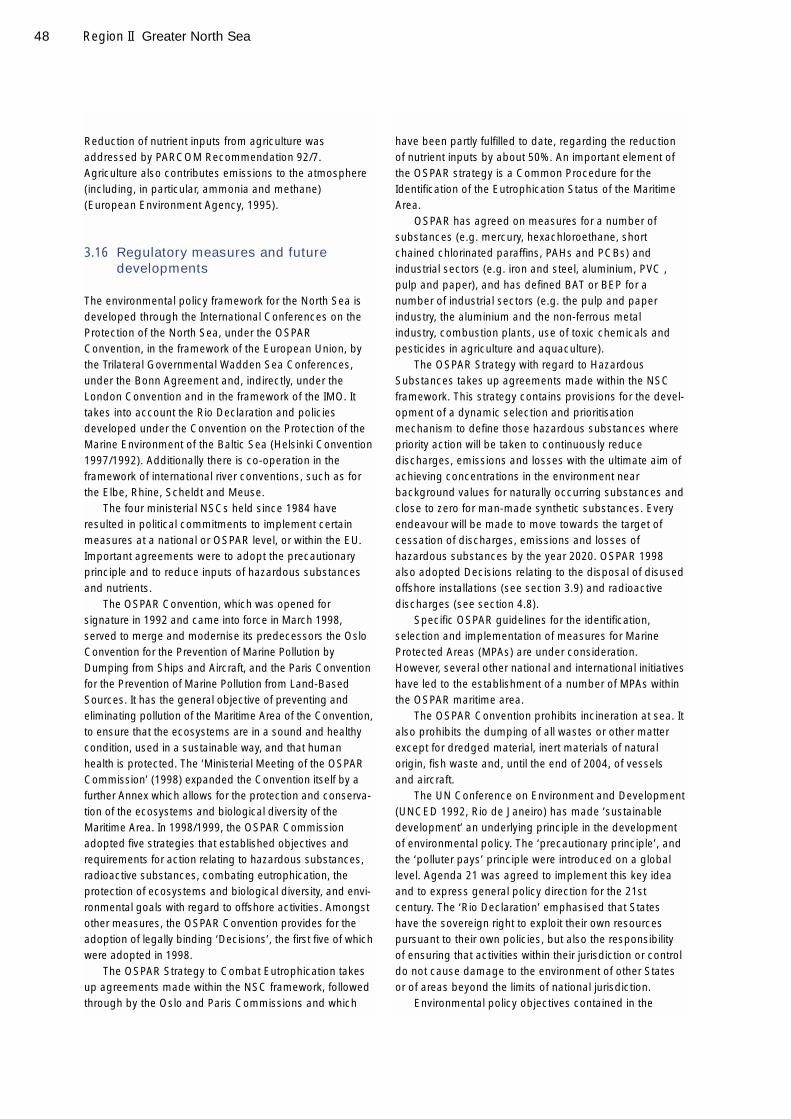
Many data and energy cables and pipelines aresubmerged in the North Sea sediment (Figures 3.13 and3.17). Over 5 000 km have been dredged for this purpose.This may become a problem for some user functions andgroups, such as beam trawl-fisheries and sand, graveland shell extraction. Within their territorial waters countriescan demand that cables and pipelines are removed whenno longer in use.
3 Human activities
Table 3.9 Development of market shares in container t ransfer. Source of data: Wirtschaftsbehörde Hamburg (1998).1985 1990 1997
Quantity Market share Quantity Market share Quantity Market share Increase in quantity
(1000 TEU) (%) (1000 TEU) (%) (1000 TEU) (%) 1985-97 (%)
Rotterdam 2 655 43.9 3 666 43.7 5 340 40 +101
Hamburg 1 159 19.1 1 969 23.5 3 337 25 +188
Antwerp 1 243 20.5 1 549 18.5 2 969 22.2 +139
Bremen ports 998 16.5 1 198 14.3 1 705 12.8 +71
TOTAL 6 055 8 382 13 351 +120
TEU = 20 ft container equivalent unit
0
1
2
3
4
5
6
milli
on tw
enty
-foot
equ
ival
ent u
nits
Rotterdam Hamburg Antwerp
1985
1990
1997
Figure 3.16 Development in container transfer in Rotterdam,Hamburg and Antwerp 1985–97. Source:Wirtschaftsbehörde Hamburg (1998).
46
3.13 Military activities
Military uses of the sea in peacetime constitute a smallpart of the sea-borne and coastal activities around theGreater North Sea. Activities include fishery protectionpatrols by the respective navies, and NATO exercises.
There are extensive British Royal Navy exercise areasin the Greater North Sea, mainly concentrated off the southcoast of the UK. There are also exercise areas off theeastern coast of England and around the Firth of Forth.
Dumping of munitions at sea, including chemicalweapons, took place after World War I, e.g. at the location‘Paardenmarkt’ off the Belgian coast, and after WorldWar II. Before 1947, the Allies sunk 34 ships in theSkagerrak containing roughly 150 000 t of chemicalweapons (Duursma, 1999). The chemicals involvedincluded mustard gas, tabun, chloroacetophenone anddifferent arsenic containing compounds. Otherammunition dumpsites are also located in the Channeland off the southeast coast of the UK.
3.14 Land based activities
3.14.1 Non-direct dischargesLand-based activities such as industry, households, trafficand agriculture may have an impact on the ecosystem of
the Greater North Sea via riverine or atmospheric inputs ofcontaminants. Quantification has focused on the overallinput of substances to the marine environment, and forsubstances other than nutrients only limited attention hasbeen given to the contributions from different sources(see also Chapter 4). Substances of concern arenutrients, which may lead to eutrophication, andhazardous substances which could pose a risk to marineorganisms and, via food from the sea, to human health.
At the International Conferences on the Protection ofthe North Sea, commitments were made to reduce inputsof hazardous substances and nutrients into the North Seaby 50% between 1985 and 1995 and also to reduce by70% inputs of dioxins, mercury, cadmium and lead.
Reductions in mercury discharges have beenachieved by measures taken in the chlor-alkali industry, by mercury replacement in certain productsand by reducing discharges from dentistry. For cadmiumreductions have been achieved by minimisingdischarges from the (non)-ferrous metals and fertiliserindustries, and through the substitution of cadmium by less harmful elements. Efficient flue gas treatmenthas reduced atmospheric emissions of cadmium,mercury and dioxins. Lead emissions from petrol havedeclined markedly.
Reduction in the inputs of phosphorus and limitedreductions in the inputs of nitrogen were achieved throughimprovements in sewage treatment (see below); and by
Region II Greater North Sea
(a)
(b)
(b)
(a)cables
(b)
platformsmilitary areas
sand extraction areas
Figure 3.17 Cables, military training areas and sand extraction areas in the North Sea. Source of data: Rijkswaterstaat North Sea Directorate (Netherlands).
47
reductions in ammonia volatilisation, in leaching of nitrate,in losses of phosphorus, and in farm waste discharges.
Little success has been reported in reducing inputsfrom diffuse sources, i.e. erosion and leaching of arableland (fertilisers), atmospheric deposition (nitrogen), run-off from roads (e.g. wear of tyres) and building materials.
Consequently, the North Sea States considered furtheraction to achieve the reduction targets by, for example,enhanced substitution of hazardous metals in variousapplications, replacement of products and by morestringent controls of industries discharging wastes.
To achieve a decline in atmospheric emissions,measures such as improvements in flue-gas cleaning atwaste incinerators and coal-fired power stations and theintroduction of best available technology for the metallur-gical industry were adopted.
3.14.2 Domestic sewageConsiderable effort has been made to collect urban andindustrial waste waters and apply appropriate levels oftreatment. Nevertheless, even where households andindustries are served by tertiary treatment systems,exceptional rainfall or tourism during the summer canreduce the efficiency of these systems. Measures relatingto the reduction of nutrient inputs were adopted by theParis Commission in 1998 and 1999 (PARCOMRecommendations 88/2 and 89/4). The EC Urban WasteWater Treatment Directive (EC, 1991) regulates therequired level of treatment of waste water (i.e. in general
biological treatment). The deadline for implementing thisDirective is 31 December 1998 to 31 December 2005,depending on the size of the population. In 1995 theportion of the population connected to seweragetreatment in different countries ranged from 80 – 98%(OSPAR, 1995).
3.15 Agriculture
Highly productive agricultural systems in Western Europefall into two broad categories. Firstly, there are areas of intensive field-crop farming, dominated by largeholdings concentrated in eastern England, northernGermany and much of The Netherlands. Secondly, thereare areas of very intensive agriculture specialising inanimal production and/or fruit and vegetable farmingfound in the coastal and southern areas of westernDenmark, parts of Germany, The Netherlands, northernBelgium, and northern Brittany. Agricultural land accountsfor more than 42% of the total land area in Europe,although the proportion varies between less than 10% and more than 70%.
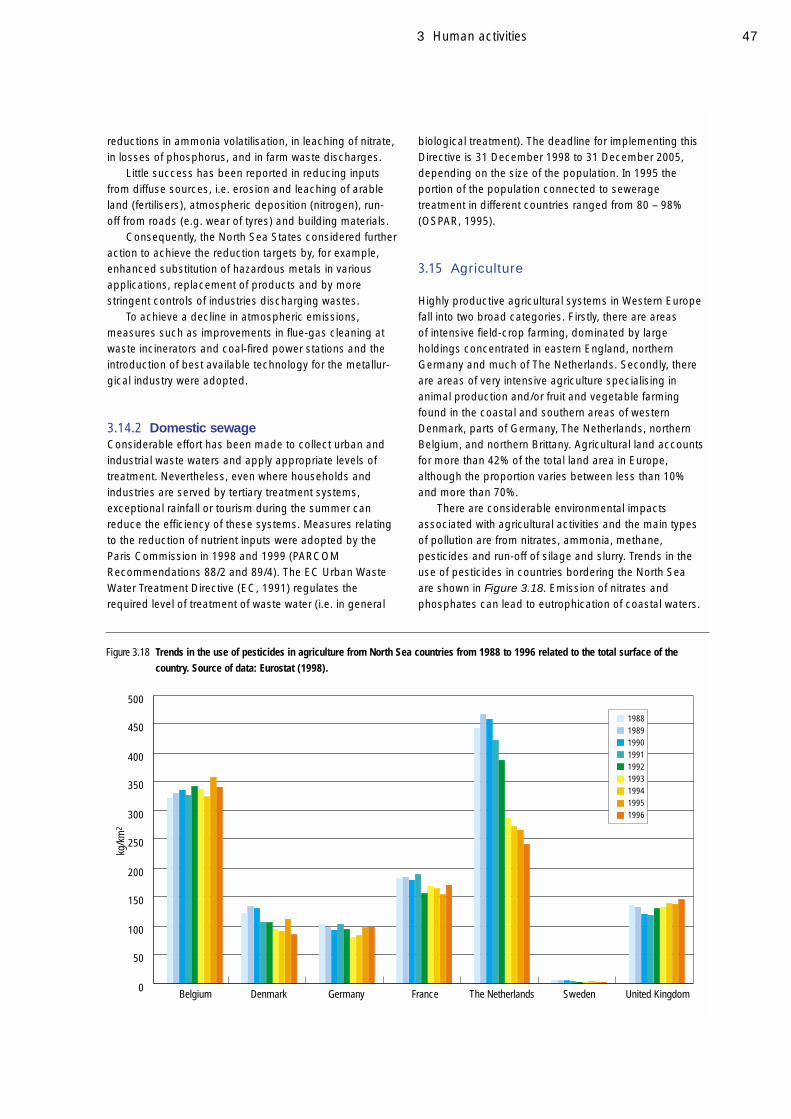
There are considerable environmental impactsassociated with agricultural activities and the main typesof pollution are from nitrates, ammonia, methane,pesticides and run-off of silage and slurry. Trends in theuse of pesticides in countries bordering the North Sea are shown in Figure 3.18. Emission of nitrates andphosphates can lead to eutrophication of coastal waters.
3 Human activities
0
100
200
300
400
500
50
150
250
350
450
United Kingdom
198819891990199119921993199419951996
Belgium Denmark Germany France The Netherlands Sweden
kg/k
m2
Figure 3.18 Trends in the use of pesticides in agriculture from North Sea countries from 1988 to 1996 related to the total surface of thecountry. Source of data: Eurostat (1998).
48
Reduction of nutrient inputs from agriculture wasaddressed by PARCOM Recommendation 92/7.Agriculture also contributes emissions to the atmosphere(including, in particular, ammonia and methane)(European Environment Agency, 1995).
3.16 Regulatory measures and futuredevelopments
The environmental policy framework for the North Sea isdeveloped through the International Conferences on theProtection of the North Sea, under the OSPARConvention, in the framework of the European Union, bythe Trilateral Governmental Wadden Sea Conferences,under the Bonn Agreement and, indirectly, under theLondon Convention and in the framework of the IMO. Ittakes into account the Rio Declaration and policiesdeveloped under the Convention on the Protection of theMarine Environment of the Baltic Sea (Helsinki Convention1997/1992). Additionally there is co-operation in theframework of international river conventions, such as forthe Elbe, Rhine, Scheldt and Meuse.
The four ministerial NSCs held since 1984 haveresulted in political commitments to implement certainmeasures at a national or OSPAR level, or within the EU.Important agreements were to adopt the precautionaryprinciple and to reduce inputs of hazardous substancesand nutrients.
The OSPAR Convention, which was opened forsignature in 1992 and came into force in March 1998,served to merge and modernise its predecessors the OsloConvention for the Prevention of Marine Pollution byDumping from Ships and Aircraft, and the Paris Conventionfor the Prevention of Marine Pollution from Land-BasedSources. It has the general objective of preventing andeliminating pollution of the Maritime Area of the Convention,to ensure that the ecosystems are in a sound and healthycondition, used in a sustainable way, and that humanhealth is protected. The ‘Ministerial Meeting of the OSPARCommission’ (1998) expanded the Convention itself by afurther Annex which allows for the protection and conserva-tion of the ecosystems and biological diversity of theMaritime Area. In 1998/1999, the OSPAR Commissionadopted five strategies that established objectives andrequirements for action relating to hazardous substances,radioactive substances, combating eutrophication, theprotection of ecosystems and biological diversity, and envi-ronmental goals with regard to offshore activities. Amongstother measures, the OSPAR Convention provides for theadoption of legally binding ‘Decisions’, the first five of whichwere adopted in 1998.
The OSPAR Strategy to Combat Eutrophication takesup agreements made within the NSC framework, followedthrough by the Oslo and Paris Commissions and which
have been partly fulfilled to date, regarding the reductionof nutrient inputs by about 50%. An important element ofthe OSPAR strategy is a Common Procedure for theIdentification of the Eutrophication Status of the MaritimeArea.
OSPAR has agreed on measures for a number ofsubstances (e.g. mercury, hexachloroethane, shortchained chlorinated paraffins, PAHs and PCBs) andindustrial sectors (e.g. iron and steel, aluminium, PVC ,pulp and paper), and has defined BAT or BEP for anumber of industrial sectors (e.g. the pulp and paperindustry, the aluminium and the non-ferrous metalindustry, combustion plants, use of toxic chemicals andpesticides in agriculture and aquaculture).
The OSPAR Strategy with regard to HazardousSubstances takes up agreements made within the NSCframework. This strategy contains provisions for the devel-opment of a dynamic selection and prioritisationmechanism to define those hazardous substances wherepriority action will be taken to continuously reducedischarges, emissions and losses with the ultimate aim ofachieving concentrations in the environment nearbackground values for naturally occurring substances andclose to zero for man-made synthetic substances. Everyendeavour will be made to move towards the target ofcessation of discharges, emissions and losses ofhazardous substances by the year 2020. OSPAR 1998also adopted Decisions relating to the disposal of disusedoffshore installations (see section 3.9) and radioactivedischarges (see section 4.8).
Specific OSPAR guidelines for the identification,selection and implementation of measures for MarineProtected Areas (MPAs) are under consideration.However, several other national and international initiativeshave led to the establishment of a number of MPAs withinthe OSPAR maritime area.
The OSPAR Convention prohibits incineration at sea. Italso prohibits the dumping of all wastes or other matterexcept for dredged material, inert materials of naturalorigin, fish waste and, until the end of 2004, of vesselsand aircraft.
The UN Conference on Environment and Development(UNCED 1992, Rio de Janeiro) has made ‘sustainabledevelopment’ an underlying principle in the developmentof environmental policy. The ‘precautionary principle’, andthe ‘polluter pays’ principle were introduced on a globallevel. Agenda 21 was agreed to implement this key ideaand to express general policy direction for the 21stcentury. The ‘Rio Declaration’ emphasised that Stateshave the sovereign right to exploit their own resourcespursuant to their own policies, but also the responsibilityof ensuring that activities within their jurisdiction or controldo not cause damage to the environment of other Statesor of areas beyond the limits of national jurisdiction.
Environmental policy objectives contained in the
Region II Greater North Sea
49
‘Amsterdam Treaty’ of the EC (1997) are based on thesame principles as in the Rio Declaration and articulatedin action programmes towards sustainability. While EUenvironmental policy does not generally address themarine environment per se, many elements of EC environ-mental legislation have a direct or indirect role inimproving the quality of the marine environment as theyaddress the various land-based activities which impact onthe marine environment. Successful implementation of thedirectives on nitrates and urban wastewater wouldsubstantively address eutrophication in the marine envi-ronment. The various directives on assessment ofsubstances integrated pollution prevention and controland on marketing and use limitations and accidenthazards should make a substantial contribution to therealisation of the objective of the OSPAR strategy withregard to hazardous substances. The EU biodiversitystrategy, and the birds and habitats directives in principlecover marine species even if so far these have not yetbeen emphasised. Agreements on total allowable catches(TACs) in the context of the common fisheries policy arethe key instrument to ensure maintenance of stocks oftarget species. Impacts on populations of non-targetspecies and on ecosystems can be addressed bytechnical measures. OSPAR and the EU are movingtowards closer co-operation, inter alia in the context of theWater Framework Directive which is currently underpreparation.
Eight governmental conferences on the protection ofthe Wadden Sea have been held since 1978 and haveresulted, inter alia, in the agreement of a trilateralmonitoring and assessment programme, common targetsfor nature conservation, and cultural and landscapevalues for this area. Conservation is dealt with in the
Trilateral Wadden Sea Cooperation and under EUdirectives on the conservation on wild birds and onhabitat, fauna and flora, by the Ramsar Convention andagreements under the Bonn Convention. Nationalregulation is important on archaeological conservation.
The IMO deals with the safety of shipping and theprotection of the marine environment against risks relatedto shipping. The MEPC deals with issues relating to theprevention and control of pollution from ships. As well asconventions relating to ship safety, IMO has agreed on the‘International Convention for the Prevention of Pollutionfrom Ships’ (MARPOL 73/78) which relates to operationaldischarges from ships.
The ‘Bonn Agreement’, which first came into force in1969, was a reaction to major oil spills and aimed toencourage North Sea states to jointly improve theircapacity for combating oil pollution. The current BonnAgreement (1983) is a commitment by North Sea statesand the EU to offer mutual assistance and co-operation incombating pollution, and to execute surveillance as an aidto detecting and combating pollution and preventingviolations of anti-pollution regulations. In recent years theemphasis has been on the co-ordination of surveillanceactivities (see Figure 4.16).
The framework for fisheries management within theNorth Sea is the Common Fisheries Policy (CFP); it will berenegotiated in 2000. In addition, stocks shared betweenNorway and the EU are managed by separateagreements. Although the ‘Intermediate MinisterialMeeting on the Integration of Fisheries and EnvironmentalIssues’ 1997 (IMM) has agreed on important guidingprinciples and strategies to ensure sustainable use ofmarine living resources, concrete measures to implementthem remain to be taken.
3 Human activities