chapter 3: aviation activity forecasts...factors affecting forecasts faa provides general guidance...
TRANSCRIPT

Grand Forks International Airport: Airport Master Plan January 2017 Chapter 3 – Aviation Activity Forecasts Page 3-1
CHAPTER 3: AVIATION ACTIVITY FORECASTS
Introduction
The Aviation Activity Forecasts chapter of the Airport Master
Plan analyzes current and future airport activity at the Grand
Forks International Airport (GFK). Forecasting provides an
airport with a general idea of the magnitude of growth, as
well as fluctuations in activity anticipated over the forecast
period. They assist the Airport in determining existing and
planned future facility needs based on airport activity level
estimates and projections. Forecasts attempt to develop a
realistic estimate of future changes.
Forecast projects are based on a “snapshot” of an existing
aviation trends and socioeconomic climate. As such,
forecasting tends to be a dynamic element of airport master planning. When conditions change
dramatically, forecasts should be reviewed and updated accordingly to reflect the changed
environment.
GFK has experienced strong growth since the last Master Plan was completed in 2008. Passenger
enplanements have increased by nearly 70 percent from 2008 to 2014. Much of the growth can be
attributed to Allegiant Airlines which began service in September 2008. Airport takeoffs and landings
(operations), much of which is attributed to University of North Dakota (UND) flight training activity,
have increased by over 43 percent during that same time period. In 2014 GFK was the 22nd busiest
airport in the United States in terms of total annual airport operations with nearly 325,000.
The forecasts developed for the Airport will be important to adequately plan, size, and sequence
development of future facilities to meet future projected growth. Development at airports, however, is
demand-based from actual numbers rather than forecasts.
To thoroughly analyze and develop a probable aviation forecast, a technical review has been
completed using several methods to help quantify the potential aviation activity over the next 20
years.
This chapter includes aviation activity forecasts for the following primary elements:
Passenger Enplanements
Passenger Aircraft Operations
Air Cargo
Other Commercial Operations
Based Aircraft
General Aviation
Military
Critical Design Aircraft
Peak Activity
UND flight training activity is classified by FAA as ‘Air Taxi’, a commercial operation. Operations are
discussed in the Other Commercial Operations and General Aviation sections of this Forecast chapter.
Allegiant Airlines MD-83 Departing GFK

Grand Forks International Airport: Airport Master Plan January 2017 Chapter 3 – Aviation Activity Forecasts Page 3-2
Forecast Rationale
Forecasting the demand for airport use is a critical step in airport development. It allows an airport to
examine its ability to satisfy the needs of the aircraft and people it serves, and to determine the
approximate timing of necessary improvements by projecting airport user activity levels.
Forecasts developed for airport master plans and/or federal grants must be approved by the Federal
Aviation Administration (FAA). It is the FAA’s policy, listed in FAA AC 150/5070-6B, Airport Master
Plans, that FAA approval of forecasts should be consistent with the Terminal Area Forecasts (TAF).
Master plan forecasts for operations and based aircraft are considered to be consistent with the TAF if
they meet the following criteria:
1. Forecasts differ by less than 10 percent in the five-year forecast and 15 percent in the 10-year
period, or
2. Forecasts do not affect the timing or scale of an airport project, or
3. Forecasts do not affect the role of the airport as defined in the current version of FAA Order
5090.3, Field Formulation of the National Plan of Integrated Airport Systems.
Forecasts that are considered to be inconsistent with the TAF require additional FAA review to confirm
the planning assumptions and appropriate methodologies are used. Approval can occur at the FAA local
(Bismarck) or regional (Chicago) level.
Furthermore, FAA Order 5090.3C states forecasts should be:
1. Realistic
2. Based on the latest available data
3. Reflect the current conditions at the airport
4. Supported by information in the study
5. Provide an adequate justification for the airport planning and development
The TAF model used for this report is from the 2015 FAA TAF published in January 2016.
Factors Affecting Forecasts
FAA provides general guidance in evaluating factors that affect aviation activity. FAA AC 150-5070-6B
states:
“Planners preparing forecasts of demand or updating existing forecasts should consider
socioeconomic data, demographics, disposable income, geographic attributes, and external
factors such as fuel costs and local attitudes towards aviation.”
For purposes of this forecast, the following defining factors have been used to develop the forecast:
1. Based on availability of data when the project began (August 2015), Federal fiscal year 2014
(October 1, 2013 through September 30, 2014) has been used as the baseline year.
2. FAA data from 2015 and 2016 has been used to validate forecast assumptions and update the
forecast baseline and enplanement forecasts.
3. The forecast period is 20 years encompassing years 2015 through 2034.
4. The most recent 2014 estimates and future projections of socioeconomic and demographic
trends have been utilized for the airport service area.
5. The core airport service area is considered the Grand Forks, ND – East Grand Forks, MN
Metropolitan Statistical Area (MSA) for this forecasting effort. The MSA includes Grand Forks
County, ND and Polk County, MN.

Grand Forks International Airport: Airport Master Plan January 2017 Chapter 3 – Aviation Activity Forecasts Page 3-3
The total GFK domestic passenger catchment area covers 81 zip codes in northeastern North Dakota
and northwestern Minnesota as identified in the latest Passenger Demand Analysis (PDA)1. The Grand
Forks-East Grand Forks MSA was used because of the availability of data. A total of 76.3 percent of the
GFK domestic catchment area population resides within the MSA, providing a representative sample of
socioeconomic and demographic trends for the entire catchment area.
The forecasts prepared for the airport assume an unconstrained scenario where facilities are available
for use to meet demand. Any constrained forecasts prepared will be noted throughout the document.
Time periods include short-term (5-year), mid-term (10-year) and long-term (20-year) resulting in
forecasts for year 2019, 2024 and 2034. Forecasts may be developed using a composite of
methodologies over the planning period.
Because aviation activity fluctuates due to unforeseen industry changes, the forecasts developed in this
section will be developed into Planning Activity Levels (PALs) in future chapters to identify activity
demand triggers for future facility improvements. By planning airport development around PALs,
phases of construction/airfield development are based on triggering events and not necessarily based
on a specific timeframe. Phases of airfield development are implemented based on activity demand
and not a period in time. Due to the variability of forecasting and changing demand, this method is
seen as a more realistic way of planning demand-driven development for an airport.
Forecasting Methods
Various methodologies are used to develop aviation forecasts. Forecasts should not be considered
predictions of the future but rather an educated projection of future activity. Some of the following
forecasting methods were applied for this analysis, including trend extensions, market share analysis,
regression analysis, socioeconomic methodologies and professional judgment.
TREND EXTENSIONS
A trend extension forecast identifies historical growth patterns and projects those patterns into the
future. Often, a trend line can be drawn through a graph of the historical data to reveal an overall
trend, which can then be extended into the immediate future to develop a forecast.
MARKET SHARE ANALYSIS
Market share analysis assumes a relationship between local and national/regional forecasts. The
market share approach to forecasting is a top-down method where activity at an airport is assumed to
be tied to growth in some external measure (typically a regional, state, or national forecast).
REGRESSION ANALYSIS
Regression analysis is a statistical technique for estimating the relationships among variables. It
identifies correlations between known independent variables (e.g., socioeconomic or demographic
estimates and projections) and dependent variables (e.g., passenger enplanements). A correlation (R-
squared) value of 95 percent and above indicates a strong correlation between the independent and
dependent variables.
PROFESSIONAL JUDGMENT
Judgmental methods are educated estimations of future events based on the industry knowledge,
experience and intuition of the forecaster. This method permits the inclusion of a broad range of
relevant information into the forecasting process, and is usually used to refine the results of the other
methods.
1 Grand Forks International Airport Passenger Demand Analysis – 2012 (December 2012, Mead & Hunt)

Grand Forks International Airport: Airport Master Plan January 2017 Chapter 3 – Aviation Activity Forecasts Page 3-4
Socioeconomic Forecasts
Socioeconomic information within the airport service area can provide insight into factors that affect
aviation activity at an airport. Commonly evaluated metrics include population, employment, income,
gross regional product and retail sales. Historic trends, current data and forecast estimates are
evaluated in this section to identify socioeconomic trends that may affect aviation activity forecasts at
GFK. Growth rates are used as a method to compare the airport service area with other regional,
statewide and national trends. Data from Woods & Poole Economic was used to collect metrics. This
data was evaluated against available local data. Population data, for example, was additionally
gathered from the Metropolitan Planning Organization (MPO).
Population
Population is a basic indicator of the number of people who may utilize the airport. The population
within the Grand Forks MSA was 98,461 in 2010. As of 2014, the population grew to 101,842 yielding a
0.67 annual growth rate according to the U.S. Census.
Table 3-1 – Population Projections
Metric 2014 2019 2024 2034 CAGR
Population
Grand Forks MSA** 101,842 105,255 109,321 118,055 0.76%
Grand Forks-EGF** 64,418 68,128 72,194 80,928 1.15%
North Dakota* 700,316 728,560 756,980 811,640 0.74%
United States* 320,976,914 337,251,000 353,870,000 386,893,000 0.94% Source: *Woods & Poole Economics (2014), **U.S. Census, Grand Forks-East Grand Forks Metropolitan Planning Organization (2011), KLJ Analysis CAGR = Compounded Annual Growth Rate
In lieu of Woods & Poole MSA data, local MPO data was used for projections. The MPO projects a
growth rate of 1.2 percent annually through the year 2040 for the cities of Grand Forks and East Grand
Forks2. Other elements equal, this alone would increase the MSA population by 0.76 percent annually
on average. This would be similar to other statewide population growth rate projections.
Employment
Grand Forks MSA has a diverse economy including government/defense, health care, retail
trade/accommodation/food service, construction and agricultural-related manufacturing industries.
The top three employers in the MSA are the UND, Altru Health System and Grand Forks Air Force Base,
each employing approximately 4,000 people. Additionally, the Grand Forks MSA has several aviation-
related employers including UND Aerospace, Cirrus Aircraft and Northrup Grumman. The Grand Skies
development near the Grand Forks Air Force Base is a business park dedicated to the growth of
Unmanned Aerial Systems (UAS) related businesses.
Target sectors for future growth, according to the Grand Forks Region Economic Development include:
Aviation and aerospace, including unmanned systems
Energy and environment
Technology-related industry, including data centers
Professional services
Value-added agricultural businesses
2 Street and Highway Plan Update, Grand Forks-East Grand Forks MPO

Grand Forks International Airport: Airport Master Plan January 2017 Chapter 3 – Aviation Activity Forecasts Page 3-5
It is forecast total employment will continue to grow in Grand Forks MSA around one percent annually.
Local projections at the MPO also confirm a growth rate of just over 1 percent annually.
Table 3-2 – Total Employment Projections
Metric 2014 2019 2024 2034 CAGR
Total Employment
Grand Forks MSA 70,803 74,629 78,539 86,582 1.01%
North Dakota 549,331 588,660 630,850 724,380 1.39%
United States 183,038,000 195,707,000 209,252,000 239,219,000 1.35% Source: Woods & Poole Economics. CAGR = Compounded Annual Growth Rate
Income
Per Capital Personal Income (PCPI) was also considered as a factor affecting aviation activity. Those
who have more disposable income may have a higher propensity to utilize the time savings of aviation,
or simply more disposable income for leisure.
PCPI within the MSA is lower than the statewide and national average. PCPI in the MSA is expected to
grow at a higher average annual rate resulting in overall PCPI approaching national averages in 20
years. North Dakota state average continues to be higher than the national average PCPI.
Table 3-3 – Per Capita Personal Income Projections
Metric 2014 2019 2024 2034 CAGR
Per Capita Personal Income (2009 Dollars)
Grand Forks MSA $39,260 $42,287 $45,985 $55,016 1.70%
North Dakota $46,067 $49,016 $52,648 $61,552 1.46%
United States $41,079 $43,763 $47,112 $55,398 1.51% Source: Woods & Poole Economics. CAGR = Compounded Annual Growth Rate.
Gross Regional Domestic Product
Gross Regional Domestic Product (GRDP) is the measure of the overall size of an economy as measured
by the market values of all final goods and services produced within a given geographic area. This
variable measures the economic vitality of a community and is considered as a factor affecting aviation
activity. Markets that have more economic output or a growing economy may have a higher need for
aviation for travel.
The GRDP output growth rate for Grand Forks MSA is slightly lower than statewide and national
averages.
Table 3-4 – Gross Regional Domestic Product Projections
Metric 2014 2019 2024 2034 CAGR
Gross Regional Domestic Product (2009 Dollars, in millions)
Grand Forks MSA $4,637 $5,106 $5,625 $6,830 1.95%
North Dakota $41,033 $45,837 $51,273 $64,397 2.28%
United States $15,356,264 $17,158,238 $19,186,357 $24,045,489 2.27% Source: Woods & Poole Economics. CAGR = Compounded Annual Growth Rate.
Retail Sales
Similar to income, increased retail sales are usually an economic indicator that people are able and
willing to spend their money. It also is an indication that disposable income is higher and people have
higher confidence in job outlook in their area.

Grand Forks International Airport: Airport Master Plan January 2017 Chapter 3 – Aviation Activity Forecasts Page 3-6
Retail sales projections for Grand Forks MSA is slower than statewide and national averages. It is
foreseen that a higher percentage of economic output will be through non-retail sales.
Table 3-5 – Retail Sales Projections
Metric 2014 2019 2024 2034 CAGR
Retail Sales (2009 Dollars; in millions)
Grand Forks MSA $1,666 $1,744 $1,825 $1,995 0.91%
North Dakota $12,116 $13,211 $14,406 $17,133 1.75%
United States $4,617,326 $5,087,776 $5,606,159 $6,806,758 1.96% Source: Woods & Poole Economics. CAGR = Compounded Annual Growth Rate
Passenger Enplanements
Passenger airline enplanements represent the number of revenue passengers boarding commercial
service aircraft that depart an airport. Enplanement figures are vital for project planning at
commercial service airports because the numbers help determine size and space requirements for the
terminal building, as well as validate the airport’s FAA classification and funding.
Passenger Demand
A Passenger Demand Analysis (PDA) was completed
for GFK in December 2012. The PDA identified travel
patterns of airline passengers within GFK’s focus
market for air service, known as the “catchment”
area. The PDA reviewed origin airport, airline
traveled and destination statistics of travelers within
the catchment area. An air service situational
analysis was also completed. Key findings from the
PDA include:
Total GFK domestic catchment area includes
81 zip codes in northeastern North Dakota
and northwestern Minnesota with a
population of 128,417 in 2012. Additional
trans-border passengers bound for U.S. leisure
destinations come from southern Manitoba, Canada including the Winnipeg area.
Total true market demand in the domestic and international catchment area is estimated to be
483,724 annual passengers or 663 passengers daily each way.
Top true market destinations not served by non-stop service from GFK include Denver (CO)
Chicago (IL), Dallas (TX), Seattle (WA), Los Angeles (CA) and Orlando (FL). The top
international destination is Cancun, Mexico.
GFK is able to capture 56 percent of total passengers who reside in the GFK catchment area.
The remaining passengers used alternative airports. A total of 20 percent used Minneapolis-St.
Paul International Airport (MSP), 19 percent from Fargo-Hector International Airport (FAR) and
5 percent to other airports.
GFK had the highest airfare in 21 of the catchment area’s top 25 markets compared to
alternative airports, and the price to fly from GFK was priced higher by $100 or more in 11
markets.
GFK Domestic Catchment Area (Mead & Hunt)

Grand Forks International Airport: Airport Master Plan January 2017 Chapter 3 – Aviation Activity Forecasts Page 3-7
Due to GFK’s proximity to Canada (80 miles south of the U.S.-Canadian border), Allegiant
Airlines captures at least half of its leisure-market traffic from trans-border travelers who
reside in Canada.
The GFK catchment area may be able to support new service. New potential leisure
destinations include Allegiant Airlines service to St. Petersburg, FL (PIE) or Fort Lauderdale-
Hollywood International Airport (FLL) in the short-term based on Canadian demand data.
Other opportunities include service to Denver International Airport (DEN) or Chicago-O’Hare
(ORD) hub airports. Longer-term destinations include Dallas-Fort Worth International Airport
(DFW), and Los Angeles International Airport (LAX) on Allegiant based on Canadian demand
data.
Since the PDA was completed, United Airlines initiated twice-daily service to Denver on 50-seat
regional jets in October 2012. Due in part to low passenger loads, the service ceased in December
2013.
Historical Data
GFK annual passenger enplanements were steady, between 85,684 and 100,651 through the 1990’s. A
dip in passenger traffic was seen in 2001 resulting from the September 11th attacks with 74,953
enplanements. From 2002 to 2007 passenger traffic held relatively steady between 82,089 and 92,202
enplanements with a low point seen in 2007 with 82,089 annual enplanements. From 1990 to 2008
Delta Air Lines (formerly Northwest Airlines) and its regional carriers provided the only scheduled
service airline serving GFK. These steady figures indicate GFK historically was a mature market.
In September 2008 Allegiant Airlines began service from GFK, providing direct flights from GFK to
leisure destinations. Service to Las Vegas (LAS) began in 2008, with service to Phoenix-Mesa (AZA) and
Orlando-Sanford (SFB) added since then. Nearly 60,000 passengers boarded Allegiant Airlines flights at
GFK in 2014. More than half of their passenger traffic is drawn from trans-border travelers in Canada.
United Airlines regional service was also introduced briefly from 2012-2013 which added 17,825
enplanements in 2013.
Additionally, the population locally has increased with the Grand Forks MSA seeing a 3.4 percent
increase from 2010 to 2015. In the last 10 years from 2003 to 2014, the local economy has grown at a
rate exceeding national averages with statewide GRDP growing at over twice the national average.
Statewide growth has been supported by oil and gas extraction in the Bakken Formation in
northwestern North Dakota.
As a result of these changes since 2007, passenger enplanements have grown dramatically with a
record high of 148,486 in 2014 according to the January 2015 FAA TAF. GFK achieved an annual growth
rate of 7.69 percent from 2007 to 2014.

Grand Forks International Airport: Airport Master Plan January 2017 Chapter 3 – Aviation Activity Forecasts Page 3-8
Figure 3-6 – GFK Historical Enplanements
Source: FAA Terminal Area Forecast (January 2016)
FAA defines commercial passenger enplanements and operations in two categories: Air Carrier and Air
Taxi/Commuter. Generally, air carrier aircraft is scheduled service in more than 60 seat aircraft and
commuter is scheduled service in 60 or fewer seat aircraft.
Regional jets of less than 60 seats such as the 50-seat CRJ-200 operated by Delta Air Lines regional
carriers are considered Air Taxi/Commuter aircraft. Total Air Taxi/Commuter enplanements have risen
with the replacement of larger aircraft with smaller regional jets since 2007.
Table 3-7 – GFK Historical Passenger Data
Year Air Carrier Commuter TOTAL Load Factor
1990 87,669 7,741 95,410 N/A3
1995 84,386 14,901 99,293 N/A
2000 53,815 36,799 90,603 N/A
2005 59,765 31,072 90,837 62.75%
2007 61,512 20,577 82,089 61.55%
2010 49,745 63,401 113,146 81.93%
2014 62,075 84,456 146,435 86.59%
1990-2014 CAGR -1.07% 10.47% 1.80% N/A
2007-2014 CAGR 0.13% 22.35% 8.61% 5.00%
Source: FAA Terminal Area Forecast (January 2016), Bureau of Transportation Statistics
Passenger load factors indicate the actual number of passengers as compared to available seats. Load
factors at GFK have increased due in part to increased passenger demand as well as a reduction in
overall available seats by the airlines to remain profitable. In 2014, Allegiant Airlines alone achieved
3 Load Factors, as indicated by the Bureau of Transportation Statistics, are only recorded back to 2002. Data prior to 2002 is not
readily available.
95,410 99,29390,603
74,953
90,837
113,146
146,531
0
20,000
40,000
60,000
80,000
100,000
120,000
140,000
160,000
Pass
enger
Enpla
nem
ents
Year
GFK Historical Enplanements
Air Carrier Commuter Total
Allegiant AirlinesBegins Service
Local Economic and Population Growth
September 11th
Attacks
Transition to Regional Jet Flying

Grand Forks International Airport: Airport Master Plan January 2017 Chapter 3 – Aviation Activity Forecasts Page 3-9
87.28 percent load factor for all flights at GFK while Delta Air Lines achieved 82.94 percent. The
national average is 82.71 percent.
Recent Trends
Data was reviewed for 2015 and 2016 to verify trends are still valid. Since the middle of 2014, the
exchange rate between United States dollars (USD) and Canadian dollars (CAD) has been increasing.
This means it is more expensive for Canadians to travel from GFK as compared to those in the United
States.
Figure 3-8 – U.S. Dollar (USD) to Canadian Dollar (CAD) Exchange Rate History
Source: Scotiabank
GFK passenger enplanements have seen decreases since 2014. Decreases in enplanements is estimated
to be a result of the USD-CAD exchange rate with fewer Canadian leisure travelers using GFK. The
following trends were noted through November 2016:
Total GFK CY 2015 enplanements were 142,639, a 2.6% decrease from CY 2014 (146,435).
CY 2016 year-to-date GFK enplanements through November were 117,209, a 10% decrease from
November 2015 (130,183) and down 13.7% from November 2014 (133,263).
CY 2016 year-to-date Allegiant Airlines enplanements at GFK through November (44,087) is
down 12.7% from 2015 (50,524) and down 17.7% from 2014 (53,567).
CY 2016 average year-to-date load factor through November is 70.6% for Delta and 77.1% for
Allegiant.
Forecasts
An updated forecast of enplaned passengers has been prepared using available data, several
methodologies and professional judgment from industry trends. The enplanement forecasts prepared
for GFK are unconstrained to represent actual demand at GFK. These forecasts supersede previous
forecasting efforts completed by GFK in 2008 and 2013.
CONSIDERATIONS
The considerations made for this master plan forecast have been developed from professional
judgment in reviewing airport, regional and national trends and projections known at the time of
forecast preparation. These include:

Grand Forks International Airport: Airport Master Plan January 2017 Chapter 3 – Aviation Activity Forecasts Page 3-10
The local Grand Forks economy is forecast to continue growth in population, employment and
income as a result of diversified industries. Although growth rate is less than statewide
projections, growth will still generally follow national projections.
The USD-CAD exchange rate is forecast to remain at an elevated level for at least the next five
years, which continue diminished demand for Canadian passengers. Although subject to many
external political and socioeconomic forces, the USD-CAD exchange rate is forecast to slowly
lower through 2018 according to Scotiabank.
Airlines will continue to be driven by profitability. Trends include high emphasis on capacity
analysis to achieve higher load factors and replacing aging aircraft with more fuel efficient
aircraft.
The 50-seat regional jet aircraft type will continue to be
phased out because it is less profitable than larger
regional aircraft on the same route with higher passenger
demand. Lower fuel prices have delayed this transition.
By 2024, it is forecast there will be a significant
reduction in usage of CRJ-200 or similar aircraft for
short-haul routes. Eventually, these aircraft will replace
by larger 65-76 seat regional jets such as the CRJ-700/-
900 aircraft or Embraer E-series jets, which could result
in reduced route frequency.
As the USD-CAD exchange rate reduces over time, Allegiant Airlines may grow service at GFK to
meet leisure travel demands for the region including southern Manitoba. Aircraft fleet mix will
transition from the MD-83 to the Airbus A319 or A320 aircraft by 2024.
New Allegiant routes have the potential to bring additional enplanements to GFK. The 2012
PDA identified new service to Fort Lauderdale (FLL) or Tampa-St. Petersburg (PIE). Growth in
Allegiant enplanements is highly dependent on the USD-CAD exchange rate. Based on the top
domestic destinations originating from GFK, in the 2012 PDA, a long-term destination could
include Los Angeles (LAX). LAX was noted as the top domestic destination from GFK in the PDA.
Delta Air Lines will continue to serve GFK via its Minneapolis-St. Paul (MSP) hub, a mature route
from GFK. The CRJ-200 aircraft is currently being replaced with CRJ-700/-900 aircraft on this
route. As of March 2016, Delta’s CRJ-900 aircraft makes two trips on average per day to GFK.
Because of relatively high load factors, total available seats and flight frequency may fluctuate
during the transition. Additional seats may be added in the future to meet growing demand. A
more complete transition to CRJ-900 is anticipated to occur by PAL 2. Please refer to Chapter
4, Facility Requirements Chapter for details on proposed improvements that react to this
change in aircraft operation.
Delta Air Lines equipment upgrades to increase capacity beyond 76 seats are not foreseen to be
utilized regularly at GFK. The aircraft type that would be used for equipment upgrades would
be the Boeing 717 (110 seats) or Airbus A319 (126-132 seats). Delta is utilizing larger aircraft to
replace 50-seat jets to maintain capacity-neutral, meaning frequency would be reduced. These
aircraft may be seen at GFK on an occasional basis, particularly for remain overnight (RON)
operations and should be evaluated for planning purposes.
CRJ-900 Regional Jet (Airliners.net)

Grand Forks International Airport: Airport Master Plan January 2017 Chapter 3 – Aviation Activity Forecasts Page 3-11
Long-term air service to another hub airport is a possibility. This includes 65-76 seat regional
jet service to Chicago-O’Hare (ORD), Denver (DEN) or Dallas-Ft. Worth (DFW). Each of these
airports are top-10 destinations from GFK. The unsuccessful launch of United Airlines service to
DEN indicates the GFK market may not yet capable of sustaining service to DEN. It should be
noted that subsidized air service from Devils Lake (90 miles west of GFK) to DEN that began in
June 2014 is seen as successful.
The launch of new air service routes is forecast to lower the leakage rate of GFK catchment
area passengers using alternative airports.
Forecasting involves assumptions and risk. If any of the demand considerations identified above
significantly change or new demand factors are introduced, then the forecasts should be reevaluated.
FORECAST METHODS
Projections of GFK enplanements beyond 2014 are developed using various forecasting methods. These
include a 20-year historical growth rate projection, GFK market share of national enplanements from
the FAA Aerospace Forecasts 2015-2035, and socioeconomic projections using state and regional
population, employment, gross regional domestic product and per capita personal income. External
data sources referenced include national FAA Aerospace Forecast 2015-2035, State Aviation System
Plan, socioeconomic forecasts from Woods & Poole and population trend data from the local MPO.
Traditional forecasting methods may be limiting as they analyze local factors that affect aviation
demand. For a market like GFK, changes in the aviation industry such as the introduction of Allegiant
Airlines significantly affect actual enplanements by capturing passengers from new markets. The
lowering of the market leakage to other airports, for example, would affect demand captured at GFK.
The USD-CAD exchange rate also plays a significant factor. Various GFK-specific air service scenarios
were analyzed accounting for potential new service using data from the PDA.
Selected forecast methods used for this effort are shown graphically in Exhibit 3-9. After analyzing the
forecast methods, traditional forecast methods such as historical trends and regression are not
recommended because of the new air service added at GFK since 2008. The air service method of
forecasting is recommended.
Air Service Scenario #1 would be a conservative growth scenario. This scenario features additional
capacity in the mid-term, and another new route in the long-term. Delta would transition its fleet to
CRJ-900 aircraft and generally provide the same number of available seats.
Air Service Scenario #3 considers a high growth scenario. The scenario includes strong growth from
Allegiant Airlines as well as new service to hub airports from United and American Airlines’ regional
affiliates. Delta would transition to the 76-seat CRJ-900 aircraft and add capacity with six daily flights,
one of which would be upgraded to a 110-seat Boeing 717.
Air Service Scenario #2, using the 2012 PDA and adjustments for 2015-2016 enplanement trends, is the
recommended forecast for passenger enplanement growth at GFK. This scenario is described below:
Air Service Scenario #2 (Medium Growth):
o Short-term: No significant changes in service levels or available seats from 2015, with
some adjustments for improving load factors. From 2014, the average growth rate is
0.15 percent annually for the short-term.
o Mid-term: Delta transitions to all 76-seat CRJ-900 aircraft for five daily flights to MSP.
Allegiant adds a new Florida destination with twice-weekly service on an Airbus A320.
Average growth rate is 2.95 percent annually for the mid-term.

Grand Forks International Airport: Airport Master Plan January 2017 Chapter 3 – Aviation Activity Forecasts Page 3-12
o Long-term: Delta continues to increase capacity with a sixth daily CRJ-900 flight to
MSP, and United adds service 10 times per week to Denver or Chicago-O’Hare in a CRJ-
700. Allegiant adds a new twice-weekly service to Los Angeles on an Airbus A319.
Average growth rate is 2.60 percent annually for the long-term.
The proposed airport enplanement forecast along with comparisons to the local and national FAA
enplanement forecast is shown in the GFK Passenger Enplanements Forecast Table located below.
Table 3-9 – GFK Passenger Enplanement Forecasts
Metric 2014 2019 2024 2034 CAGR
GFK Airport Forecast 146,531 147,612 170,763 220,787 2.07%
U.S. Domestic Enplanements (in millions)
668.3 729.5 784.9 935.3 1.69%
GFK Market Share 0.022% 0.020% 0.022% 0.024% - Source: FAA Aerospace Forecasts 2015-2035, KLJ Analysis
The preferred forecast yields an average annual growth rate of 2.07 percent for a total of 220,787
enplanements at the end of the 20-year planning period. Growth is anticipated as a result of additional
capacity to existing destinations and new service to leisure destination in the mid-term, and to a hub
airport in the long-term. This service is supported by existing true market passenger demand and GFK’s
proximity to Canada supporting service to additional leisure destinations. This scenario assumes the
USD-CAD exchange rate improves for Canadians and GFK retains a higher percentage of passengers
within the catchment area to support new air service.

Grand Forks International Airport: Airport Master Plan January 2017 Chapter 3 – Aviation Activity Forecasts Page 3-13
Exhibit 3-10 – GFK Passenger Enplanement Forecasts
Source: FAA Terminal Area Forecast (January 2016), FAA Aerospace Forecasts 2015-2035, Woods & Poole Economics, 2012 GFK Passenger Demand Analysis, 2013 GFK Forecasts of Aviation Demand, 2008 Airport Master Plan, KLJ Analysis
146,531
147,395
170,763
194,170
220,787
75,000
100,000
125,000
150,000
175,000
200,000
225,000
250,000
275,000
300,000
Pass
enger
Enpla
nem
ents
Year
GFK Passenger Enplanement Forecasts
2015 FAA TAF 2008 Master Plan 2013 Forecast Update
Historical Trend (20 Years) Constant US Enplanement Share Increasing US Enplanement Share
State Population Regression Air Service Scenario #1 Air Service Scenario #2 (Preferred)
Air Service Scenario #3 2014 ND SASP 2014 ND SASP
Air Service Scenario #2 (Preferred Forecast)

Grand Forks International Airport: Airport Master Plan January 2017 Chapter 3 – Aviation Activity Forecasts Page 3-14
Passenger Aircraft Operations
Commercial aviation consists of civil aviation that
involves operating an aircraft for hire to transport
passengers or cargo. These operations are scheduled
or unscheduled. Commercial operations forecasts
include aircraft operations and the classification of
passenger enplanements. A Passenger Operation is a
takeoff or landing of an aircraft with more than nine
seats conducting a commercial passenger carrying
operation on a scheduled or unscheduled basis.
In general, according to FAA definitions,
commercial aircraft are defined as air carrier or air
taxi/commuter. Air carrier aircraft provide scheduled passenger service in more than 60 seat aircraft.
Air taxi/commuter aircraft provide on-demand flights in 60 or fewer seats or 18,000 or fewer pounds of
cargo. These definitions apply to both passenger enplanements and commercial operations. FAA
reported a total of 101,288 Air Taxi operations, which counts other unscheduled charter aircraft and
UND flight training aircraft in the baseline year of 2014. These UND Air Taxi operations represent
itinerant aircraft operations only. Local area traffic is classified differently.
Historical Data
GFK scheduled passenger aircraft departure data from the Bureau of Transportation Statistics was
analyzed for historical operational trends. Departures in aircraft less than 40 seats are virtually nil as a
result of Delta/Northwest regional carriers phasing out the Saab 340 turboprop aircraft from service.
Departures in the 50-seat CRJ-200 regional jet are the highest category at GFK. The year 2013 was a
peak when United was providing CRJ-200 service to Denver. The use of air carrier aircraft has increased
with regular scheduled service in the 76-seat CRJ-900 regional jet (Delta Airlines), 151-199 seat aircraft
operated by Allegiant Airlines and the 215-seat Boeing 757-200 also operated by Allegiant.
Table 3-11 – Historical Passenger Aircraft Fleet Mix & Operations
Seating Capacity 2010 2011 2012 2013 2014
Air Taxi/Commuter
Less Than 40 Seats 0.2% 0.0% 0.0% 0.0% 0.0%
40-60 Seats 76.1% 83.1% 82.5% 85.7% 74.8%
Departures 1,780 2,143 2,126 2,566 1,764
Air Carrier
61-99 Seats 2.5% 6.0% 0.2% 0.3% 6.8%
100-120 Seats 3.8% 0.0% 0.0% 0.0% 0.0%
121-150 Seats 16.6% 9.7% 5.4% 0.4% 0.6%
151-199 Seats 0.6% 1.2% 11.8% 13.6% 16.5%
200+ Seats 0.0% 0.0% 0.0% 0.0% 1.3%
Departures 551 436 450 428 594
Total Departures
Departures 2,331 2,579 2,576 2,994 2,358 Source: Form 41 Traffic Data: T-100 Domestic Segment – Bureau of Transportation Statistics
During the last five years, the average number of seats per departure had been fluctuating with
changes in service. A general increase has been noted reflecting new Delta Air Lines service in CRJ-900
aircraft, Allegiant Airlines service in larger aircraft, and a general effort by airlines to fill aircraft by
changing flight frequency. The passenger load factor, the measure of the number of passenger seats as
Commercial Passenger Operations at GFK Terminal

Grand Forks International Airport: Airport Master Plan January 2017 Chapter 3 – Aviation Activity Forecasts Page 3-15
compared to the available seats, increased overall the past five years to 85.39 percent in 2014. In
2015, however, the BTS-reported load factor dropped to 80.14 percent.
Table 3-12 – Passenger Aircraft Flight Analysis
Metric 2010 2011 2012 2013 2014
Air Taxi/Commuter
Total Seats Available 88,920 107,134 106,294 128,285 88,140
Total Departures 1,780 2,143 2,126 2,566 1,764
Avg. Seats Per Departure 49.96 49.99 50.00 49.99 49.97
Avg. Passengers Per Departure 36.55 36.45 36.61 34.59 42.67
Passenger Load Factor 73.17% 72.90% 73.22% 69.20% 85.39%
Air Carrier
Total Seats Available 70,332 53,996 70,458 69,279 85,310
Total Departures 551 436 450 428 594
Avg. Seats Per Departure 127.64 123.84 156.57 161.87 143.62
Avg. Passengers Per Departure 96.77 96.39 135.88 141.46 119.97
Passenger Load Factor 75.81% 77.83% 86.78% 87.39% 83.53%
Total
Total Seats Available 159,252 161,130 176,752 197,564 173,450
Total Departures 2,331 2,579 2,576 2,994 2,358
Avg. Seats Per Departure 68.32 62.48 68.61 65.99 73.56
Avg. Passengers Per Departure 50.79 46.58 53.95 49.87 62.14
Passenger Load Factor 74.34% 74.56% 78.63% 75.58% 84.48% Source: Form 41 Traffic Data: T-100 Domestic Segment – Bureau of Transportation Statistics Note: Some numbers may not add up due to rounding
Passenger load factors have been increasing nationwide with the average domestic load factor
increasing from 80.4 to 84.4 percent in the past five years. With the growth of Allegiant Airlines with
historically high load factors, GFK’s overall passenger load factor currently is higher than the national
average at 84.5 percent. Air taxi/commuter load factors increased dramatically in 2014.
The average size of the aircraft has increased with the introduction of larger airplanes from Allegiant
Airlines and the CRJ-900 by Delta. Even with passenger growth, the increase in the average size of
aircraft has translated into a relatively steady number of commercial aircraft operations. In 2015, the
CRJ-900 operated at GFK a total of 1,102 operations as compared with 318 operations in 2014.
Also of note is a significant discrepancy in the year 2014 data between how passengers are counted
between air taxi/commuter and air carrier. FAA’s current definition of regional air taxi/commuter
flights is 60 seats or less. Air carriers would be defined as aircraft greater than 60 seats, which would
include operations in the CRJ-900 regional jet. The FAA’s figures do not match up with actual aircraft
seat size. For this analysis, the 60-seat cutoff is used for this study.
Forecasts
The commercial operations forecast for GFK will take into account both new airline service anticipated
at GFK, as well as changes in the industry aircraft fleet mix.
Over the next 10 years, regional airlines are expected to retire the CRJ-200 aircraft. This effort is
being completed due to the number of takeoff/landing cycles and relative poor fuel efficiency
compared to higher capacity regional jet aircraft. A continued period of lower fuel prices may slow this
transition. This transition has begun at Delta with two daily routes transitioning to a larger CRJ-900
aircraft at GFK. This change results in fewer aircraft operations assuming the same number of available

Grand Forks International Airport: Airport Master Plan January 2017 Chapter 3 – Aviation Activity Forecasts Page 3-16
seats. Any new route established at GFK to a hub airport in the long-term is expected to be operated in
a 65 to 76-seat regional jet.
Allegiant Airlines caters to high capacity aircraft to accommodate leisure travelers on a limited
frequency basis. This business model is expected to continue at GFK with increased service frequency
to serve existing routes to Las Vegas, Phoenix and Orlando and new routes to Florida or Los Angeles in
the long-term. Based on new aircraft orders, the overall fleet is expected to transition to Airbus
A319/A320 aircraft. The 215-passenger Boeing 757-200 may still be flown on occasion to serve periods
of higher demand through the mid-term.
Table 3-13 – Passenger Airline Fleet Mix Forecast (Operations)
Seating Capacity 2014 2019 2024 2034
Air Taxi/Commuter (<60 seats)
Less Than 40 Seats 0.0% 0.0% 0.0% 0.0%
40-60 Seats 74.8% 40.0% 14.7% 0.0%
Total Air Taxi/Commuter 74.8% 40.0% 14.7% 0.0%
Air Carrier (>60 seats)
61-99 Seats 6.8% 38.8% 56.4% 64.5%
100-120 Seats 0.0% 0.2% 0.2% 10.3%
121-150 Seats 0.6% 0.8% 1.0% 1.0%
151-199 Seats 16.5% 19.4% 27.0% 24.2%
200+ Seats 1.3% 0.7% 0.7% 0.0%
Total Air Carrier 25.2% 60.0% 85.3% 100.0% Source: Form 41 Traffic Data: T-100 Domestic Segment – Bureau of Transportation Statistics Note: Some numbers may not add up due to rounding
As a result of industry changes, the air taxi/commuter passenger commercial operations are expected
to be completely replaced by air carrier operations by the end of the planning period.
The forecast number of enplanements and fleet mix are used to develop air carrier and air
taxi/commuter passenger airline operations projections. The current passenger load factor at GFK is
84.5 percent. FAA Aerospace Forecasts project domestic revenue passenger load factors will increase
from a national average of 84.4 percent to 85.7 percent in the planning period. The 2015 GFK load
factor was 80.14 percent. Load factor downturns in 2015 are forecast to rebound slightly in the short-
term to 82 percent. GFK’s mid-term and long-term load factor is expected to grow at a similar rate to
the national average.

Grand Forks International Airport: Airport Master Plan January 2017 Chapter 3 – Aviation Activity Forecasts Page 3-17
Table 3-14 – Passenger Airline Flight Analysis Forecast
Metric 2014 2019 2024 2034 CAGR
Air Taxi/Commuter (<60 seats)
Total Enplanements 74,479 34,859 12,790 0 -100.0%
Total Departures 1,745 850 308 0 -100.0%
Total Operations 3,490 1,700 616 0 -100.0%
Average Seats Per Departure 50.0 50.0 50.0 0.0 -100.0%
Air Carrier (>60 seats)
Total Enplanements 72,052 112,753 157,973 220,787 5.76%
Total Departures 633 1,275 1,787 2,549 7.21%
Total Operations 1,267 2,551 3,575 5,097 7.21%
Average Seats Per Departure 136.2 107.8 106.5 101.9 -1.44%
Total
Total Seats (est.) 173,458 180,015 205,738 259,749 2.04%
Total Enplanements 146,531 147,612 170,763 220,787 2.07%
Passenger Load Factor 84.48% 82.00% 83.00% 85.00% 0.03%
Total Departures 2,378 2,126 2,096 2,549 0.35%
Total Operations 4,756 4,251 4,191 5,097 0.35%
Average Seats Per Departure 73.6 84.7 98.2 101.9 1.64% Source: Form 41 Traffic Data: T-100 Domestic Segment – Bureau of Transportation Statistics, FAA Terminal Area Forecast (January 2016), KLJ Analysis Note: Some numbers may not add up due to rounding
The preferred forecast yields total commercial passenger operations growing at a 0.39 percent annual
growth rate, as compared to enplanements growing at 2.07 percent annually. Air carrier enplanements
are forecast to replace all air taxi/commuter enplanements, indicating all scheduled passenger
commercial aircraft will be greater than 60 seats in size. The average size of each scheduled passenger
commercial departure will increase from 73.6 seats to 101.9 seats per departure as the 50-seat
regional jet is retired.
Air Cargo
Transporting materials and goods can be accomplished by air,
truck, rail, water or a combination of modes. Products that
are high value, light weight and time sensitive typically drive
air cargo demand. Cargo can be carried on dedicated air
freight aircraft or in the belly of commercial service aircraft.
FedEx moved its air operations from GFK to Fargo’s Hector
International Airport in November 2016. This is expected to
have a significant effect on air cargo activity at GFK,
including mainline as well as feeder aircraft that rely on
FedEx. Activity forecasts have been updated to reflect this
recent change.
Historical Activity
GFK currently serves as the regional air cargo hub for FedEx. The airport is also a regular destination
for UPS and other contract cargo carriers. FedEx shipping operations are based on the southwest
portion of the airfield. FedEx air cargo is delivered in mainline aircraft such as the Airbus A300 from
their hub in Memphis, TN. Air cargo for FedEx is transferred from mainline aircraft to ground vehicles
and feeder aircraft to deliver to regional communities. Contract carriers such as Corporate Air (FedEx),
FedEx Airbus A300 (Airliners.net)

Grand Forks International Airport: Airport Master Plan January 2017 Chapter 3 – Aviation Activity Forecasts Page 3-18
Mountain Air Cargo (FedEx), Encore Air Cargo (UPS) and Alpine Air Cargo (UPS) fly various regional
contract cargo routes through GFK. GFK does not serve as a significant air mail destination.
Demand has increased air cargo freight through GFK’s FedEx regional hub. Through contract carriers,
FedEx serves several destinations from GFK including but not limited to Minot, Williston, Bismarck,
Dickinson and Fargo in North Dakota. Other destinations include Thief River Falls, MN, Bemidji, MN and
Winnipeg, Manitoba. The busiest feeder route is to Bismarck with 10 departures from GFK per week. On
a typical busy weekday there are two daily arrivals in FedEx mainline aircraft, one in the early morning
and one in the late-afternoon. There are several daily feeder aircraft departures from GFK, most of
them concentrated in the early morning.
According to Bureau of Transportation Statistics data, total enplaned and deplaned air freight and mail
at GFK has increased 8.70 percent annually for the past five years. This total cargo reflects the growing
economy of North Dakota. Total GFK air cargo hit a low in 2009 as a result of the economic recession
which affected overall demand.
Table 3-15 – Historical Air Cargo Freight & Mail
Year Freight & Mail (lbs.)
2007 44,498,222
2009 38,449,673
2014 58,351,637
Historical CAGR 3.94% Source: Form 41 Traffic Data: T-100 Domestic Segment – Bureau of Transportation Statistics
Exhibit 3-16 – Historical Air Cargo
Source: Form 41 Traffic Data: T-100 Domestic Segment – Bureau of Transportation Statistics
Total air cargo processed at GFK has increased at an average rate of 3.94 percent annually since 2007.
Total operations from GFK have increased 2.45 percent annually over the past five years indicating
additional cargo payload per flight. Air cargo operations in air carrier aircraft have decreased by nearly
22 percent indicating larger cargo aircraft types are being flown. Since 2013, FedEx has replaced their
older Boeing 727 aircraft with a mix of newer and higher payload Boeing 757-200, Airbus A310 and
Airbus A300 aircraft into the GFK market. In 2015 the vast majority of these flights were performed in
the Airbus A300 and A310 aircraft, with only 24 annual operations in the Boeing 757-200 aircraft.
44,498,22238,449,673
58,351,637
0
10,000,000
20,000,000
30,000,000
40,000,000
50,000,000
60,000,000
70,000,000
Pounds
Year
GFK Historical Air Cargo
Enplaned Cargo & Mail Deplaned Cargo & Mail Total Cargo & Mail

Grand Forks International Airport: Airport Master Plan January 2017 Chapter 3 – Aviation Activity Forecasts Page 3-19
Table 3-17 – Air Cargo Aircraft Fleet Mix & Operations
Aircraft Type 2010 2011 2012 2013 2014 2015
Air Carrier
Airbus A300-600F 0 0 0 3 396 917
Airbus A310 0 0 0 47 236 366
Boeing 757-200 1,228 1,199 1,205 1,435 324 24
Boeing 727-200 36 35 58 24 0 0
ATR-72 Turboprop 0 0 0 2 32 23
Total Air Carrier 1,264 1,234 1,263 1,511 988 1,330
Air Taxi
ATR-42 2 3 8 5 54 408
Cessna 208 Caravan 4,474 4,068 4,509 4,721 4,822 3,170
Beechcraft 1900 592 586 611 709 1,088 1,460
Metroliner III, Other 671 782 1,590 1,114 815 N/A
Total Air Taxi 5,739 5,439 6,718 6,549 6,779 N/A
Total Cargo Operations 7,003 6,670 7,981 8,060 7,739 N/A Source: FAA Traffic Flow Management System Counts (TFMSC). 2015 data added for reference. Note: Some numbers may not add up due to rounding
Air cargo feeder aircraft operations are classified as air taxi operations. These operations are
performed in aircraft with a maximum payload capacity of 18,000 pounds or less. The majority of the
operations are conducted in Cessna 208 Grand Caravan turboprop aircraft operated for FedEx. Data
from 2015 shows a shift to the larger ATR-42 aircraft with over 400 annual operations. Feeder
operations have historically grown to support the additional cargo tonnage with little change in aircraft
fleet mix.
Forecast
According to FAA Aerospace Forecasts 2015-2035, revenue-ton miles (RTM) flown by domestic U.S. all-
cargo carriers is forecast to grow by 0.70 percent annually for the next 20 years. Several forecasting
methods were reviewed for trends. In light of FedEx leaving GFK, traditional forecast methods are not
applicable.
The GFK forecast of total processed air cargo assumes FedEx will move its operations to Fargo in the
short-term by 2017. No significant new operation is expected in the future. Remaining processed
mainline air cargo at GFK is expected to occur from on-demand operations only. Total air cargo at GFK
is expected to be a fraction of what the airport has handled historically.
The preferred forecast assumes steady growth will continue at GFK matching national RTM growth
trends of 0.70 percent average annual growth rate. The new baseline for processed mainline air cargo
is expected to be around 600,000 pounds in total derived from on-demand cargo processing.

Grand Forks International Airport: Airport Master Plan January 2017 Chapter 3 – Aviation Activity Forecasts Page 3-20
Exhibit 3-18 – GFK Air Cargo Forecast
Source: Form 41 Traffic Data: T-100 Domestic Segment – Bureau of Transportation Statistics, KLJ Analysis
Table 3-19 – Air Cargo Forecast
Metric 2014 2019 2024 2034 CAGR
Total Enplaned & Deplaned Cargo 58,351,637 598,901 620,158 660,139 -20.08% Source: KLJ Analysis
The above forecast should be used for broad planning purposes as much of the air cargo actually
processed is not tracked for feeder aircraft using available data.
Operations & Fleet Mix
Overall processed tonnage and air cargo trends correlate with
estimated flight operations and fleet mix. Operations in air
cargo aircraft are split by FAA into air carrier and air taxi
categories. In general, mainline large jet aircraft operated by
FedEx are classified as air carrier and smaller feeder
propeller-driven aircraft are classified as air taxi. Air cargo
operations are not tracked separately by FAA.
Without a regional air cargo hub, the preferred forecast for
air carrier operations assumes the fleet mix will transition to
only a few mainline FedEx or UPS aircraft to serve on-demand
air cargo needs. No operational growth is expected in the
future, therefore more cargo per flight is expected.
Much of the smaller feeder aircraft activity was needed to transport freight and mail to/from FedEx
flights. With FedEx leaving GFK, feeder air taxi cargo aircraft are expected to transition to feature only
regular feeder aircraft for UPS out of the Sioux Falls hub. These flights are expected on turboprop
aircraft such as the Fairchild Metroliner III. On-demand flights in the FedEx Cessna 208 Caravan single-
engine turboprop are also possible along with other smaller air cargo aircraft. Total air cargo feeder
operations are forecast to grow at the same share as national air cargo RTM forecasts.
58,351,637
598,901 620,158 637,620 660,139
0
10,000,000
20,000,000
30,000,000
40,000,000
50,000,000
60,000,000
70,000,000
Air
Carg
o (
Pounds)
Year
GFK Air Cargo Forecast
Historical Air Cargo Preferred Forecast
FedEx Leaves GFK
Encore Air Cargo
Fairchild Metroliner III (Airliners.net)

Grand Forks International Airport: Airport Master Plan January 2017 Chapter 3 – Aviation Activity Forecasts Page 3-21
Table 3-20 – Air Cargo Aircraft Fleet Mix & Operations Forecast
Metric 2014 2019 2024 2034 CAGR
Air Carrier (AC)
Airbus A300-600F 396 0 0 0 -100.00%
Airbus A310 236 0 0 0 -100.00%
Boeing 757-200 324 10 10 10 -15.96%
ATR-72 Turboprop 32 0 0 0 -100.00%
Total AC 988 10 10 10 -20.52%
Air Taxi (AT)
ATR-42 Turboprop 54 0 0 0 -100.00%
Turboprop 6,577 634 656 704 -10.52%
Multi-Engine Piston 87 51 53 56 -2.15%
Turbojet 135 127 131 141 0.21%
Total AT 6,799 811 840 901 -9.60%
Total
Total Cargo Operations 7,767 821 850 911 -10.16%
Total Freight & Mail 58,351,637 598,901 620,158 660,139 -20.08%
Cargo Per AC Operation 59,060 59,890 62,016 66,014 0.56% Source: KLJ Analysis Note: Some numbers may not add up due to rounding
Other Commercial Operations
Background
Other commercial forecasts involve aircraft used for
on-demand passenger and cargo operations. These
operators provide a for-profit service, typically
unscheduled charter or air taxi flights operated under
Federal Aviation Regulation (FAR) Part 135 with nine
or fewer seats. Corporations that operate their own
aircraft for in-house business flights are classified as
General Aviation. For purposes of consistency with
FAA guidance only itinerant (point-to-point) operations are evaluated.
AIR CHARTER
Numerous operators operate commercial services to and from GFK including on-demand air charter
operators. These operators are hired to transport people and goods by air. Operators are located
nationwide. An example of a commercial operator based at GFK is Valley Med Flight who provides
providing on-demand medical evacuation flights to the region.
UNIVERSITY OF NORTH DAKOTA
The John D. Odegard School for Aerospace Sciences at
UND runs an extensive flight training school from GFK.
The aviation department is known around the world. The school attracts aerospace students worldwide
for flight training. International flight training resumed at UND in 2007 for Far Eastern Air Transport
and Tokai University. As of September 2015, UND owns and operates a fleet of 96 airplanes. Much of
their fleet includes single-engine, multi-engine and helicopter used for pilot flight training. Many
students continue to complete their flight training at GFK, however in the past five years, satellite
campuses have been expanded regionally and around the country to accommodate the demand. Since
Valley Med Flight Fixed-Wing Airplanes

Grand Forks International Airport: Airport Master Plan January 2017 Chapter 3 – Aviation Activity Forecasts Page 3-22
2005, these flight training operations began to be classified as commercial air taxi operations by the
FAA.
Currently there is a shortage of pilots to fulfill aviation needs in the United States. This is projected to
continue and worsen over time. UND Aerospace is on the forefront of providing world-class flight
training to pilots combined with a four-year degree.
Historical Data
According to FAA data, from 2005 through 2015 total nationwide air taxi and commuter operations
declined by 28 percent. Much of this decline is driven by the commercial airline industry’s reduction in
flight frequency.
UND flight training activity makes up the vast majority of operations at GFK. UND flight training total
hours reached a peak in 2013 (July 1, 2013 – June 30, 2014) with 97,721 total flight hours. Much of this
growth is attributed to international students. The peak achieved in 2013 represents 88 percent growth
from a 15-year low of 51,840 flight hours seen in 2007. According to UND, total demand for flight hours
in 2014 was around 95,000 however there were not enough flight instructors to meet demand. Total
flight hours correspond well to total airport operations.
Based on the FAA and UND activity data, GFK’s estimated historical annual air taxi operations are
indicated below, excluding scheduled passenger and air cargo flights.
Table 3-21 – Other Commercial Itinerant Operations Metrics
Type 2010 2011 2012 2013 2014 CAGR
UND Flight Training Hours 96,685 90,563 87,522 97,721 89,964* -1.79%
Other Commercial Operations 84,698 88,147 91,326 96,842 91,031 1.82%
Non-UND Other Comm. Ops. 620 1,041 1,009 1,059 1,056 14.24% Source: University of North Dakota, FAA Traffic Flow Management System (TFMS), KLJ Analysis *Actual 2014 demand estimated at 95,000 hours NOTE: Excludes Scheduled Passenger and Cargo Flights. CAGR = Compounded Annual Growth Rate
Total other commercial operations, excluding large air cargo and passenger aircraft, was over 1,000 in
2014 based on FAA Traffic Flow Management System data. These flights are assumed to be itinerant in
nature. After a jump in 2011 these flights have been steady.
In 2014, there were an estimated 290,000 annual flight operations at GFK attributed to UND traffic
alone. Total UND itinerant flight operations is estimated to be around 90,000 in 2014 by removing other
known air taxi operations. This represents takeoffs and landings from outside the local area. Local
operations are estimated to be almost exclusively driven by UND flight operations. Local operations
totaled 204,073 in 2014. An estimated 98 percent of local operations are generated from UND
Aerospace.
Recently released data from 2015 shows a downturn with an estimated 86,203 annual other commercial
operations at GFK. This is a 5 percent drop from 2014 activity. The downturn is related to lack of
available flight instructors to meet actual demand. This forecast is adjusted to reflect actual 2015
data.

Grand Forks International Airport: Airport Master Plan January 2017 Chapter 3 – Aviation Activity Forecasts Page 3-23
Forecasts
The FAA issues nationwide “Aerospace Forecasts” on
an annual basis covering the next 20 years. According
to FAA Aerospace Forecasts 2015-2035, forecasts of
general aviation and air taxi hours flown is forecast
to increase an average of 1.32 percent annually
through 2035. The FAA’s activity metric correlates to
airport operations.
Much of the preferred forecast at GFK will be driven
by the UND flight training operations. According to
UND representatives, the maximum number of flight
hours before significant airports delays are seen is
100,000. After this point flights experience air traffic
control delays. Capacity constraints include the
configuration of runways and restricted airspace to
the west from the Air Force Base. Traditional student enrollment has been increasing since 2011 and is
expected to grow due to pilot shortage forecasted for years to come.
The local demand for air charter activity is difficult to predict. Specific individuals or businesses that
require on-demand air service are those that find it more effective to fly to a destination (including
GFK) rather than drive or take a commercial flight. As the local economy continues to grow, it is
generally predicted so will the demand for commercial air charter flights operating to/from GFK.
OPERATIONS
Other commercial operations forecast numbers are developed by taking the baseline calculated figure
and reviewing overall air taxi industry trends to develop a forecast. The preferred forecast method is
to use national FAA air taxi and general aviation trends from the FAA Aerospace Forecasts. This method
yields a compiled annual growth rate of 1.32 percent modeling activity in smaller aircraft similar to
those operating as an air charter.
This forecast represents a constrained scenario for UND Aerospace at GFK. Existing constraints include
airspace restrictions, total airfield capacity and the ability for UND Aerospace to staff enough Certified
Flight Instructors (CFIs) to meet training demands. Future growth in this scenario is expected to be
capped at about 100,000 total flight hours due to airspace and airport constraints.
In this constrained scenario, growth is expected at a 1.32 percent rate from 2015 to 2024 matching FAA
national activity trends. After ten years, capacity constraints will restrict growth rates by half for the
next five years (0.66 percent). After 15 years there will be no growth in UND operations at GFK.
Capacity restrictions may force UND to be selective or move students to other training sites. At this
time, significant airfield capacity improvements at GFK are not supported by UND Aerospace alone.
Table 3-22 – Other Commercial Operations Forecast
Metric 2014 2015 2019 2024 2034 CAGR
UND Itinerant 89,966* 85,238* 89,829 95,916 99,123 0.48%
Other Air Charter 1,053 1,067* 1,124 1,201 1,369 1.32%
TOTAL 91,019 86,305 90,953 97,116 100,492 0.49%
UND Local** 199,992* 187,646* 197,751 211,152 218,212 0.44% Source: University of North Dakota, KLJ Analysis *Estimated, **Counted under ‘Civil Local’ operations per FAA standards Note: Some numbers may not add up due to rounding
University of North Dakota Fleet (und.edu)

Grand Forks International Airport: Airport Master Plan January 2017 Chapter 3 – Aviation Activity Forecasts Page 3-24
With no capacity constraints, UND Aerospace operations would be forecast to grow at FAA national
growth rates of 1.32 percent from 2015 onward, or an overall 10 percent increase over the constrained
scenario in the long-term. The high commercial forecast scenario is described below.
Table 3-23 – Other Commercial Operations Forecast (High Scenario)
Metric 2014 2015 2019 2024 2034 CAGR
UND Itinerant 89,966* 85,238* 89,829 95,916 109,356 0.97%
Other Air Charter 1,053 1,067* 1,124 1,201 1,369 1.32%
TOTAL 91,031 86,305 90,953 97,116 110,725 0.98%
UND Local** 199,992* 187,646* 197,751 211,152 240,739 0.93% Source: University of North Dakota, KLJ Analysis *Estimated, **Counted under ‘Civil Local’ operations per FAA standards Note: Some numbers may not add up due to rounding
FLEET MIX
The estimated other itinerant commercial aircraft fleet mix is determined based on UND and non-UND
aircraft in this operational category. UND aircraft conducting itinerant operations are estimated to be
80 percent single-engine, 15 percent multi-engine and 5 percent helicopter. Of the non-UND other
commercial operations the estimated fleet mix is 25 percent turbojet, 23 percent are turboprop, 22
percent piston and 5 percent helicopter.
Table 3-24 – Other Commercial Itinerant Fleet Mix & Operations Forecast
Metric 2014 2019 2024 2034 CAGR
Other Commercial Itinerant
Single-Engine Piston 72,057 71,953 76,829 79,408 0.48%
Multi-Engine Piston 13,642 13,632 14,555 15,060 0.49%
Turboprop 527 562 600 684 1.32%
Turbojet 242 259 276 315 1.32%
Helicopter 4,551 4,548 4,856 5,025 0.49%
Total Operations 91,019 90,953 97,116 100,492 0.49% Source: University of North Dakota, FAA Traffic Flow Management System (TFMS), KLJ Analysis Note: Some numbers may not add up due to rounding
Based Aircraft
A based aircraft is an operational and airworthy aircraft claiming an airport as its home for a majority
of the year.
Historical Data
Per the 2015 FAA Aerospace Forecast, from 2009 to 2014 the total number of piston-driven aircraft
declined by 2.73 percent annually with turbine-driven aircraft increasing at a 0.94 percent. Deliveries
of turbojet aircraft recently had its first increase since 2008. Single engine piston deliveries had its
third consecutive year of an increase in aircraft deliveries. The FAA TAF anticipates an annual growth
rate of 0.83 percent through 2035. It can be assumed that additional aircraft deliveries yield a constant
increase in overall based aircraft in the United States.
Statewide, based aircraft in North Dakota have increased by nearly 66 percent since 1990 according to
the FAA TAF, equating to an average annual growth rate 2.14 percent.
According to the FAA’s TAF records, historical based aircraft numbers at GFK has been fluctuating over
the years. The drawback of this information from the FAA is the inability to explain why there have
Grand Forks International Airport: Airport Master Plan January 2017 Chapter 3 – Aviation Activity Forecasts Page 3-25
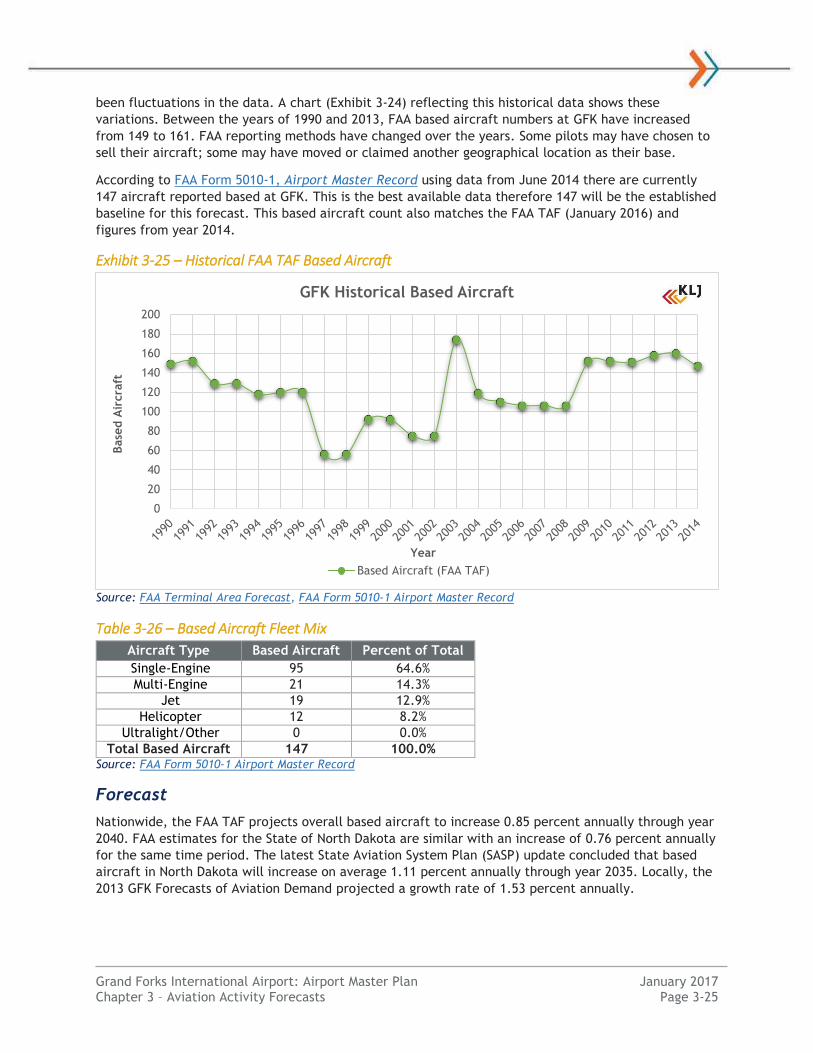
been fluctuations in the data. A chart (Exhibit 3-24) reflecting this historical data shows these
variations. Between the years of 1990 and 2013, FAA based aircraft numbers at GFK have increased
from 149 to 161. FAA reporting methods have changed over the years. Some pilots may have chosen to
sell their aircraft; some may have moved or claimed another geographical location as their base.
According to FAA Form 5010-1, Airport Master Record using data from June 2014 there are currently
147 aircraft reported based at GFK. This is the best available data therefore 147 will be the established
baseline for this forecast. This based aircraft count also matches the FAA TAF (January 2016) and
figures from year 2014.
Exhibit 3-25 – Historical FAA TAF Based Aircraft
Source: FAA Terminal Area Forecast, FAA Form 5010-1 Airport Master Record
Table 3-26 – Based Aircraft Fleet Mix
Aircraft Type Based Aircraft Percent of Total
Single-Engine 95 64.6%
Multi-Engine 21 14.3%
Jet 19 12.9%
Helicopter 12 8.2%
Ultralight/Other 0 0.0%
Total Based Aircraft 147 100.0% Source: FAA Form 5010-1 Airport Master Record
Forecast
Nationwide, the FAA TAF projects overall based aircraft to increase 0.85 percent annually through year
2040. FAA estimates for the State of North Dakota are similar with an increase of 0.76 percent annually
for the same time period. The latest State Aviation System Plan (SASP) update concluded that based
aircraft in North Dakota will increase on average 1.11 percent annually through year 2035. Locally, the
2013 GFK Forecasts of Aviation Demand projected a growth rate of 1.53 percent annually.
0
20
40
60
80
100
120
140
160
180
200
Base
d A
ircra
ft
Year
GFK Historical Based Aircraft
Based Aircraft (FAA TAF)
Grand Forks International Airport: Airport Master Plan January 2017 Chapter 3 – Aviation Activity Forecasts Page 3-26
The highest growth sectors in total aircraft types nationally are turboprop, turbojet, rotorcraft,
experimental and sport aircraft. Overall single-engine and multi-engine piston aircraft are forecast to
decline.
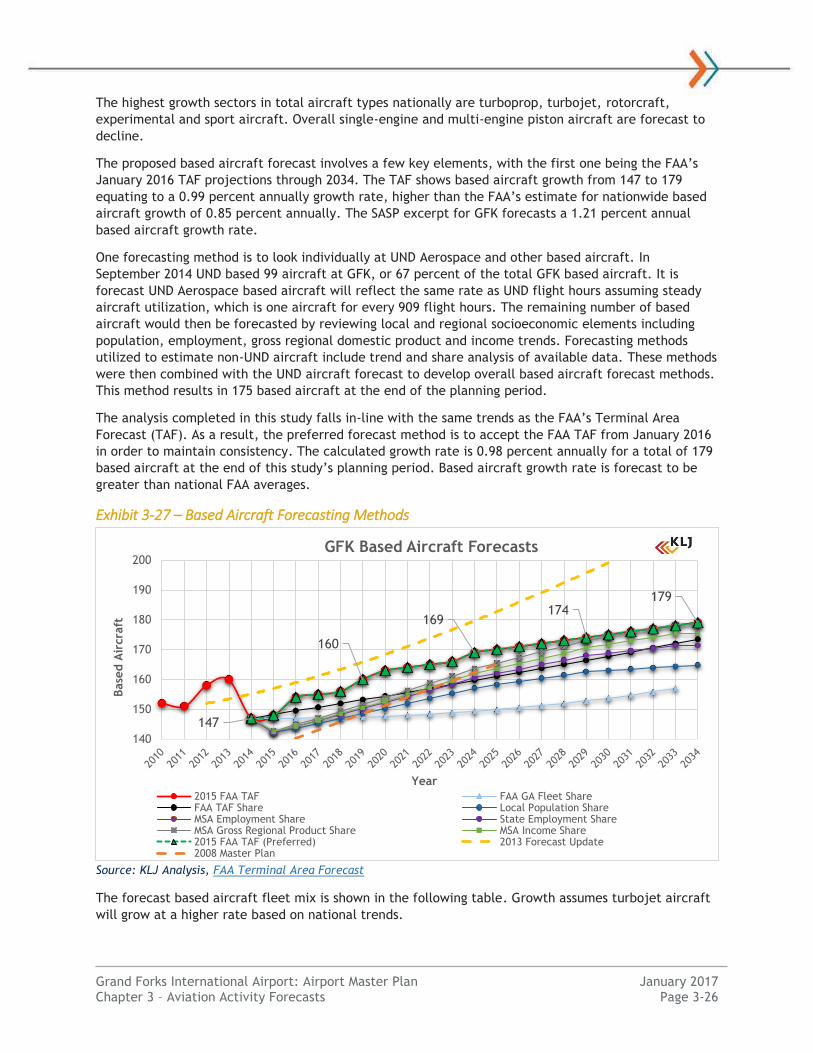
The proposed based aircraft forecast involves a few key elements, with the first one being the FAA’s
January 2016 TAF projections through 2034. The TAF shows based aircraft growth from 147 to 179
equating to a 0.99 percent annually growth rate, higher than the FAA’s estimate for nationwide based
aircraft growth of 0.85 percent annually. The SASP excerpt for GFK forecasts a 1.21 percent annual
based aircraft growth rate.
One forecasting method is to look individually at UND Aerospace and other based aircraft. In
September 2014 UND based 99 aircraft at GFK, or 67 percent of the total GFK based aircraft. It is
forecast UND Aerospace based aircraft will reflect the same rate as UND flight hours assuming steady
aircraft utilization, which is one aircraft for every 909 flight hours. The remaining number of based
aircraft would then be forecasted by reviewing local and regional socioeconomic elements including
population, employment, gross regional domestic product and income trends. Forecasting methods
utilized to estimate non-UND aircraft include trend and share analysis of available data. These methods
were then combined with the UND aircraft forecast to develop overall based aircraft forecast methods.
This method results in 175 based aircraft at the end of the planning period.
The analysis completed in this study falls in-line with the same trends as the FAA’s Terminal Area
Forecast (TAF). As a result, the preferred forecast method is to accept the FAA TAF from January 2016
in order to maintain consistency. The calculated growth rate is 0.98 percent annually for a total of 179
based aircraft at the end of this study’s planning period. Based aircraft growth rate is forecast to be
greater than national FAA averages.
Exhibit 3-27 – Based Aircraft Forecasting Methods
Source: KLJ Analysis, FAA Terminal Area Forecast
The forecast based aircraft fleet mix is shown in the following table. Growth assumes turbojet aircraft
will grow at a higher rate based on national trends.
147
160
169174
179
140
150
160
170
180
190
200
Base
d A
ircra
ft
Year
GFK Based Aircraft Forecasts
2015 FAA TAF FAA GA Fleet ShareFAA TAF Share Local Population ShareMSA Employment Share State Employment ShareMSA Gross Regional Product Share MSA Income Share2015 FAA TAF (Preferred) 2013 Forecast Update2008 Master Plan

Grand Forks International Airport: Airport Master Plan January 2017 Chapter 3 – Aviation Activity Forecasts Page 3-27
Table 3-28 – Based Aircraft Forecast
Metric 2014 2019 2024 2029 2034 CAGR
Single-Engine* 95 104 110 112 115 0.97%
Multi-Engine* 21 23 25 25 25 0.94%
Jet 19 21 23 24 26 1.64%
Helicopter 12 12 12 12 13 0.28%
Ultralight/Other 0 0 0 0 0 -
Total Based Aircraft 147 160 169 174 179 0.99% Source: KLJ Analysis. CAGR = Compounded Annual Growth Rate *Includes both piston and turboprop driven aircraft for FAA reporting purposes.
In an unconstrained UND Aerospace high forecast scenario, based aircraft would grow to keep pace
with flight training activity. This would lead to the acquisition of 21 additional aircraft. The high
forecast is identified in the following table, which uses data from 2015 activity trends as a revised
baseline.
Table 3-29 – Based Aircraft Forecast (High Scenario)
Metric 2014 2019 2024 2029 2034 CAGR
Single-Engine* 95 98 105 113 121 1.21%
Multi-Engine* 21 21 23 25 26 1.08%
Jet 19 20 22 24 26 1.60%
Helicopter 12 11 12 12 13 0.60%
Ultralight/Other 0 0 0 0 0 -
Total Based Aircraft 147 151 162 174 187 1.20%
UND Fleet 99 99 105 113 120 0.97%
Other 48 52 56 62 66 1.63% Source: KLJ Analysis. CAGR = Compounded Annual Growth Rate *Includes both piston and turboprop driven aircraft for FAA reporting purposes.
General Aviat ion
General Aviation (GA) is non-commercial aviation activity not classified in another category. At airports
with a local Air Traffic Control Tower (ATCT) like GFK, takeoffs and landings (operations) are counted
and classified. GA operations are split into two categories: Civil local and GA itinerant.
Local operations are performed by aircraft that remain in the local traffic pattern and stay within a
20−mile radius. These operations typically include practice landings, touch-and-go operations, practice
approaches and maneuvering within the local area in non-military aircraft. Local operations are usually
performed by recreational and flight training aircraft. Civil local operations at GFK are almost entirely
conducted by UND flight training aircraft.
Itinerant operations are performed by a landing aircraft arriving from outside the airport area (20
miles) or a departing aircraft that leaves the airport area. Itinerant operations are conducted in all
types of aircraft. Non-commercial GA activity is considered by FAA to be non-UND aircraft.
Historical Data
The 2015 FAA Aerospace Forecasts reported total general aviation and air taxi hours flown nationally
have decreased a total of 17.2 percent from 2007 to 2014. This is a general measure of activity. At
towered airports, total operations have decreased by 22.6 percent nationally. A total of 54.5 percent
of general aviation operations nationally is considered itinerant.

Grand Forks International Airport: Airport Master Plan January 2017 Chapter 3 – Aviation Activity Forecasts Page 3-28
GFK has seen increasing civil local activity since 2008 when international contract training began for
UND. This activity peaked in 2012 with 247,960 civil local operations. Since 2005, GA itinerant
classification reflects only non-UND activity. This number increased since a low point in 2007 by nearly
46 percent to 16,422 annual operations, equating to a 1.88 percent average annual growth rate. GA
itinerant operations peaked in 2013 with over 18,000 annually.
Exhibit 3-30 – Historical General Aviation Operations
Source: FAA Air Traffic Activity Data System (ATADS)
Forecast
GENERAL AVIATION ITINERANT
The FAA TAF (January 2016) estimates national GA itinerant operations will increase nationally by 0.35
percent annually through the 20-year planning period. The FAA Aerospace Forecasts predicts total
general aviation hours flown to increase by 1.4 percent annually for the next 20 years, mostly in
turboprop, turbojet, rotorcraft, experimental and sport aircraft types.
For GFK, the FAA TAF (January 2016) forecasts GA itinerant activity to drop to around 12,000 annual
operations in 2016 then increase back to nearly 17,000 annually in year 2034 for an average annual
growth rate of 0.14 percent. The 2014 North Dakota SASP projects a 1.21 percent annual operations
growth rate.
GA itinerant operations are non-UND traffic, thus this figure is expected to be reflective of local and
regional socioeconomic elements including population, employment, gross regional product and income
trends. A regression evaluation showed that State Population provides the highest correlation of
socioeconomic factors. Other methods utilized include trend and share analysis of available data.
Actual 2015 figures recently released show a downturn with 12,775 annual GA itinerant operations at
GFK. This forecast baseline is adjusted to reflect actual 2015 data.
85,025
69,228
84,449
103,319
13,88214,805 16,422
145,834
104,195
137,747156,158
141,570
229,739
247,960
204,073
0
50,000
100,000
150,000
200,000
250,000
300,000
Air
port
Opera
tions
Year
GFK Historical General Aviation Operations
GA Itinerant Civil Local
FAA Begins Classifying UND Flight Training as
Commercial
UND International Contract Training Begins

Grand Forks International Airport: Airport Master Plan January 2017 Chapter 3 – Aviation Activity Forecasts Page 3-29
The preferred forecast method for GA itinerant operations is the State population regression model
growth rate. This model averages 2.41 percent annual growth for the planning period beyond 2015. The
20-year average growth rate is 1.01 percent from year 2014.
Exhibit 3-31 – GA Itinerant Forecasting Methods
Source: KLJ Analysis, FAA Terminal Area Forecast (January 2016)
Table 3-32 – General Aviation Itinerant Operations Forecast
Metric 2014 2015 2019 2024 2034 CAGR
Total GA Itinerant Operations 16,442 12,775 14,053 15,832 20,094 1.01% Source: KLJ Analysis. CAGR = Compounded Annual Growth Rate
CIVIL LOCAL
Nationwide, the FAA TAF (January 2016) estimates total civil local operations will increase nationally
by 0.38 percent annually through the 20-year planning period. The FAA Aerospace Forecasts predicts
total general aviation hours flown to increase by 1.32 percent annually for the next 20 years.
For GFK, the recently updated FAA TAF forecasts GA civil local activity to drop to below 180,000 annual
operations in 2016 then increase back to nearly 225,000 annually in year 2034 for an average annual
growth rate of 0.45 percent.
The vast majority of civil local operations are from UND flight training traffic. An estimated 98 percent
of local operations are generated from UND. Other civil local traffic is limited due to the sheer volume
of airplanes operating in and around GFK. These aircraft are typically flying within the GFK rectangular
airport traffic pattern to practice takeoffs and landings. According to tower staff, approximately 90
percent are conducting “touch-and-go” operations to practice landings and remain in the airport traffic
pattern.
Actual 2015 figures recently released show an activity downturn with 191,475 annual GA local
operations at GFK. This forecast baseline is adjusted to reflect actual 2015 data.
16,422
12,775
14,053
15,832 17,836 20,094
10,000
15,000
20,000
25,000
30,000
35,000
Annual
Opera
tions
Year
GFK GA Itinerant Operations Forecasts
FAA GA Itinerant Ops Share FAA GA Intinerant Ops Share (Increasing)
FAA Tower GA Intinerant Ops Share Historical Trend
State Population Regression (Preferred) 2015 FAA TAF

Grand Forks International Airport: Airport Master Plan January 2017 Chapter 3 – Aviation Activity Forecasts Page 3-30
Civil local operations are expected to be reflective of trends from UND Aerospace activity. This was
evaluated in the commercial operations section based on national FAA air taxi and general aviation
activity trends from the FAA Aerospace Forecast. UND civil local activity represents a constrained
scenario for UND Aerospace at GFK. Growth beyond 2015 is expected at a 1.32 percent rate until 2024
matching FAA national activity trends. After 2024, capacity constraints will restrict growth rates by
half for the next five years (0.66 percent). After 15 years there will be no growth in UND operations at
GFK due to capacity constraints. Non-UND traffic would continue to grow at 1.32 percent annually.
Table 3-33 – Civil Local Operations Forecast
Metric 2014 2015 2019 2024 2034 CAGR
UND Local 199,992* 187,646* 197,751 211,152 218,212 0.44%
Other Civil Local 4,081* 3,830* 4,036 4,309 4,913 0.93%
TOTAL 204,073 191,475 201,787 215,461 223,125 0.45% Source: University of North Dakota, KLJ Analysis, CAGR = Compounded Annual Growth Rate *Estimated based on 98% of total civil local traffic Note: Some numbers may not add up due to rounding
With no capacity constraints, (High Scenario) UND Aerospace airport operations would be forecast to
grow at FAA national growth rates of 1.32 percent from 2015. Activity in 2015 was lower than 2014,
resulting in a lower net average growth rate. This calculates to 245,652 civil local operations attributed
to UND by the end of the forecast period, a 10 percent increase over the constrained forecast.
Table 3-34 – Civil Local Operations Forecast (High Scenario)
Metric 2014 2015 2019 2024 2034 CAGR
UND Local 199,992* 187,646* 197,751 211,152 240,739 0.93%
Other Civil Local 4,081* 3,830* 4,036 4,309 4,913 0.93%
TOTAL 204,073 191,475 201,787 215,461 245,652 0.93% Source: University of North Dakota, KLJ Analysis, CAGR = Compounded Annual Growth Rate *Estimated based on 98% of total civil local traffic Note: Some numbers may not add up due to rounding
Military
The vast majority of military activity for the Grand Forks area is handled by the Grand Forks Air Force
Base located to the west of GFK. There has historically been recorded local and itinerant military
operations at GFK. Military aircraft operate from GFK however it is very likely it will not be significant
enough to affect airport development or design standards. Military missions are difficult to predict,
therefore GFK military operations are forecast to remain steady and follow average figures from the
last 10 years through 2015. This assumes the same type of historical activity will occur at GFK. Military
operations are estimated to be 56.9 percent itinerant and 43.1 percent local.
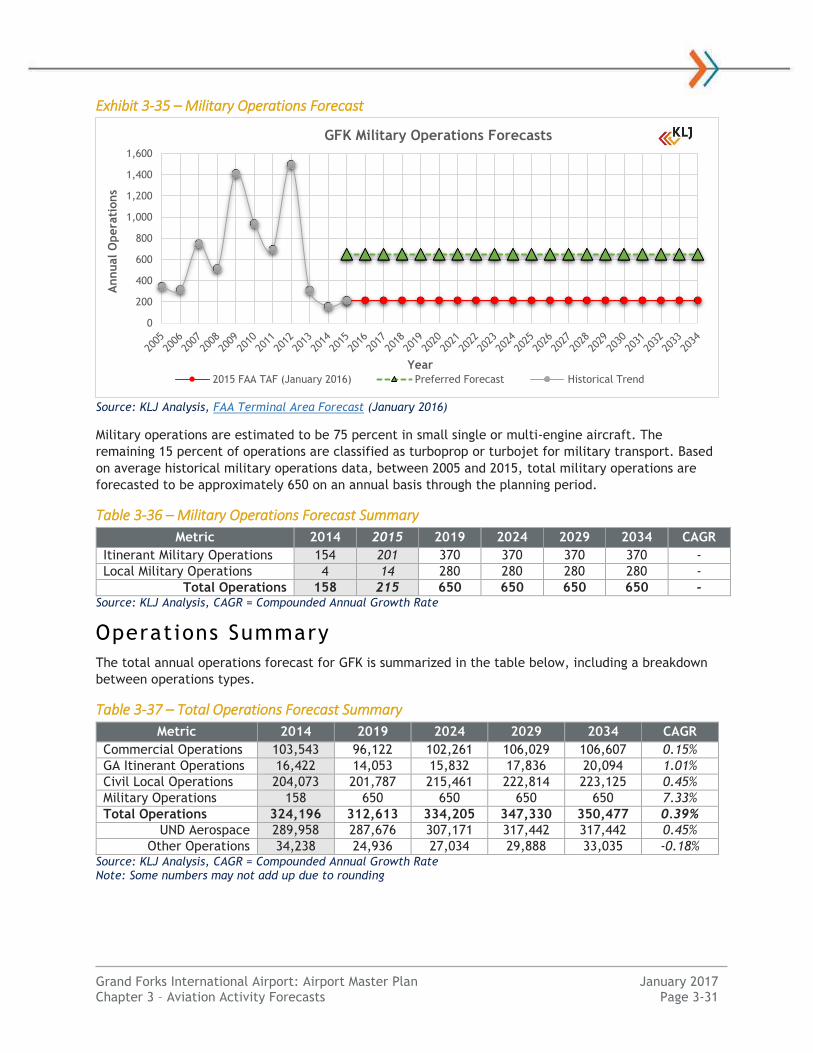
Grand Forks International Airport: Airport Master Plan January 2017 Chapter 3 – Aviation Activity Forecasts Page 3-31
Exhibit 3-35 – Military Operations Forecast
Source: KLJ Analysis, FAA Terminal Area Forecast (January 2016)
Military operations are estimated to be 75 percent in small single or multi-engine aircraft. The
remaining 15 percent of operations are classified as turboprop or turbojet for military transport. Based
on average historical military operations data, between 2005 and 2015, total military operations are
forecasted to be approximately 650 on an annual basis through the planning period.
Table 3-36 – Military Operations Forecast Summary
Metric 2014 2015 2019 2024 2029 2034 CAGR
Itinerant Military Operations 154 201 370 370 370 370 -
Local Military Operations 4 14 280 280 280 280 -
Total Operations 158 215 650 650 650 650 - Source: KLJ Analysis, CAGR = Compounded Annual Growth Rate
Operations Summary
The total annual operations forecast for GFK is summarized in the table below, including a breakdown
between operations types.
Table 3-37 – Total Operations Forecast Summary
Metric 2014 2019 2024 2029 2034 CAGR
Commercial Operations 103,543 96,122 102,261 106,029 106,607 0.15%
GA Itinerant Operations 16,422 14,053 15,832 17,836 20,094 1.01%
Civil Local Operations 204,073 201,787 215,461 222,814 223,125 0.45%
Military Operations 158 650 650 650 650 7.33%
Total Operations 324,196 312,613 334,205 347,330 350,477 0.39%
UND Aerospace 289,958 287,676 307,171 317,442 317,442 0.45%
Other Operations 34,238 24,936 27,034 29,888 33,035 -0.18% Source: KLJ Analysis, CAGR = Compounded Annual Growth Rate Note: Some numbers may not add up due to rounding
0
200
400
600
800
1,000
1,200
1,400
1,600
Annual
Opera
tions
Year
GFK Military Operations Forecasts
2015 FAA TAF (January 2016) Preferred Forecast Historical Trend

Grand Forks International Airport: Airport Master Plan January 2017 Chapter 3 – Aviation Activity Forecasts Page 3-32
Table 3-38 – Total Operations Forecast Summary (High Scenario)
Metric 2014 2019 2024 2029 2034 CAGR
Commercial Operations 103,543 96,122 102,261 109,325 116,851 0.61%
GA Itinerant Operations 16,422 14,053 15,832 17,836 20,094 1.01%
Civil Local Operations 204,073 201,787 215,461 230,062 245,652 0.93%
Military Operations 158 650 650 650 650 7.33%
Total Operations 324,196 312,613 334,205 357,874 383,248 0.84%
UND Aerospace 289,958 287,676 307,171 327,987 350,213 0.95%
Other Operations 34,238 24,936 27,034 29,888 33,035 -0.18% Source: KLJ Analysis, CAGR = Compounded Annual Growth Rate Note: Some numbers may not add up due to rounding
Critical Design Aircraft
The critical design aircraft is identified as the most demanding aircraft or family of aircraft to regularly
use the airport. A critical design aircraft type or family must operate at least 500 annual operations at
the airport to be considered “regular” use by FAA for improvements to be justified for FAA funding.
Existing
As supported by the 2015 FAA Traffic Flow Management System Counts (TFMSC) data, the overall
existing critical design aircraft is a family of airplanes with regular service to GFK. The design airplane
has an FAA Airport Reference Code (ARC) of D-IV made up of FAA Aircraft Approach Category (AAC) D
with approach speed up to 166 knots and Airplane Design Group (ADG) IV with a wingspan up to 171
feet. The design aircraft has an FAA Taxiway Design Group (TDG) classification of 5 and a maximum
takeoff weight of 370,376 pounds in the Airbus A300.
Table 3-39 – Existing Critical Design Aircraft
Aircraft Type (Operator) 2015 IFR
Operations FAA AAC
FAA ADG
FAA TDG
MTOW MLW
Boeing 737-800 (Charter) 38 D III 3 174,200 146,300
Boeing MD-83/88 (Allegiant) 502 D III 4 160,000 139,500
CRJ-200 (Delta) 2,746 D II 3 53,000 47,000
Airbus A300-600 (FedEx) 917 C IV 5 370,376 315,922
Airbus A310 (FedEx) 366 C IV 5 361,557 273,372
Boeing 757-200 (FedEx, Allegiant) 42 C IV 4 255,000 210,000
Airbus A319 (Allegiant) 162 C III 3 166,449 134,482
Airbus A320 (Allegiant) 134 C III 3 171,961 145,505
CRJ-700/900 (Delta) 1,102 C III 3 84,500 75,000
Total AAC-D 3,286
Total ADG-IV 1,325
Total TDG-5 1,283
Design MTOW 370,376 lbs.
Design MLW 315,922 lbs. Source: KLJ Analysis, FAA Traffic Flow Management System Counts (TFMSC) Data at GFK (January 2014 – December 2014). IFR = Instrument Flight Rules, AAC = Aircraft Approach Category, ADG = Airplane Design Group, TDG = Taxiway Design Group, MTOW = Maximum Takeoff Weight (pounds), MLW = Maximum Landing Weight Aircraft operations exceeding FAA regular use threshold are shown in Green

Grand Forks International Airport: Airport Master Plan January 2017 Chapter 3 – Aviation Activity Forecasts Page 3-33
Figure 3-40 – Existing Critical Design Aircraft Family
Airbus A300-600 (ARC C-IV) Airbus A310 (ARC C-IV)
Boeing MD-83 (ARC D-III) CRJ-200 (ARC D-II)
Photography Source: Airliners.net
Other aircraft types were also evaluated. There were 1,040 documented annual operations in corporate
jet aircraft at GFK in 2015 operating for general aviation or commercial purposes. The majority of
these aircraft have an FAA ARC of B-II. The Beechcraft 1900 operated by many commercial cargo
carriers is an FAA ARC B-II airplane with 1,460 documented annual operations in 2015. The ATR-42/72
air cargo turboprop, an ARC B-III airplane, had 432 operations in 2015 which is just below the FAA’s
regular-use threshold.
UND Aerospace flight training operations are in small single- and multi-engine airplanes with maximum
gross weights below 12,500 pounds.
Future
The future critical design aircraft will continue to be driven by scheduled passenger and air cargo
service at GFK. The following assumptions will affect the future design aircraft:
Delta Air Lines retiring CRJ-200 and replacing it with CRJ-700/900 aircraft.
Delta Air Lines utilizing a Boeing 717 for remain overnight (RON) flights in the long-term.
Allegiant Airlines replacing the MD-83 aircraft with Airbus A319 and A320 in the next 10 years.
FedEx ceasing the majority of mainline air cargo service in the short-term.
As shown in the table below, the future design aircraft is expected to be driven by passenger airlines
rather than air cargo aircraft. The design aircraft is expected to transition to an FAA ARC D-III, TDG-4

Grand Forks International Airport: Airport Master Plan January 2017 Chapter 3 – Aviation Activity Forecasts Page 3-34
aircraft in the short-term and to a TDG-3 aircraft in the mid-term. The long-term design aircraft is a C-
III, TDG-3 aircraft as the MD-83 and CRJ-200 aircraft are phased out of service at GFK.
Table 3-41 – Future Critical Aircraft Operations Breakdown
Representative Aircraft Design 2014 2019 2024 2029 2034
Boeing MD-83 (Allegiant) ARC D-III, TDG-4 456 416 286 0 0
CRJ-200 (Delta) ARC D-II, TDG-3 3,526 1,716 624 0 0
Airbus A300-600 (FedEx) ARC C-IV, TDG-5 396 0 0 0 0
Airbus A310 (FedEx) ARC C-IV, TDG-5 236 0 0 0 0
Boeing 757-200 (Allegiant) ARC C-IV, TDG-4 51 31 31 0 0
Boeing 757-200 (FedEx) ARC C-IV, TDG-4 324 10 10 10 10
Airbus A319/A320 (Allegiant) ARC C-III, TDG-3 326 416 858 1,196 1,248
Boeing 717-200 (Delta) ARC C-III, TDG-3 0 10 10 10 530
CRJ-700/900 (Delta) ARC C-III, TDG-3 320 1,664 2,392 3,432 3,328 Source: KLJ Analysis, CAGR = Compounded Annual Growth Rate, Aircraft operations exceeding FAA regular use threshold are shown in Green Note: Representative airplanes identified. Demand forecast assumes unrestricted airport facility
All critical aircraft operations should be monitored very closely as changes in flight schedules and
business operations may change airport use, aircraft type and operational frequency.
The design aircraft identified is the most critical family of aircraft to utilize the airport, however
particular portions of the airport may be limited to smaller design aircraft. These aircraft-specific
standards will be evaluated in Chapter 4: Facility Requirements.
Figure 3-42 – Future Critical Design Aircraft Family
Airbus A320 (ARC C-III) Airbus A319 (ARC C-III)
CRJ-900 (ARC C-III) Boeing 717 (ARC C-III)
Photography Source: Airliners.net

Grand Forks International Airport: Airport Master Plan January 2017 Chapter 3 – Aviation Activity Forecasts Page 3-35
Annual Instrument Approaches
Annual instrument approaches (AIAs) are defined as an approach to an airport conducted in actual
instrument meteorological conditions when an instrument approach is required. For purposes of this
definition, an approach is initiated when the observed visibility is less than 3 miles or the cloud ceiling
is less than the final approach fix. At GFK the Final Approach Fix for Runway 35L (RNAV) approach is at
an altitude of 2,600 feet above mean sea level, or 1,755 feet above ground level. AIA figures are no
longer tracked by Air Traffic Control but are a required element to an FAA forecast.
To determine AIAs, the number of itinerant operations are totaled from the estimates and forecasts
and compared to annual operations. The number of instrument flights are then determined. Based on
data from the FAA, 44.9 percent4 of flights are operating on an IFR itinerant flight plan at GFK. This has
increased from 35.6 percent in 2009. The number of AIA’s in the future is expected to grow as itinerant
traffic increases and more instrument-rated pilots equip aircraft to utilize approaches with new GPS
technology. Local weather conditions are then reviewed and analyzed for consideration of when
initiation of an instrument approach is required. A total of 12.58 percent5 of the hourly weather
observations are in conditions that require an instrument approach to be performed.
Table 3-43 – Annual Instrument Approach Forecast
Metric 2014 2019 2024 2029 2034 CAGR
Annual Operations 324,196 312,613 334,205 347,330 350,477 0.39%
Itinerant Operations 120,119 110,546 118,464 124,236 127,071 0.28%
% IFR Itinerant Operations 44.9% 46.40% 47.90% 49.40% 50.90% 0.63%
IFR Itinerant Operations 53,933 51,293 56,744 61,373 64,679 0.91%
IFR Approaches 26,967 25,647 28,372 30,686 32,340 0.91%
Instrument Approach Weather 12.58% 0.00%
Annual Instrument Approaches 3,392 3,226 3,569 3,860 4,068 0.91%
AIA as Percent of Itinerant 2.82% 2.92% 3.01% 3.11% 3.20% 0.63% Source: National Climatic Data Center, KLJ Analysis. CAGR = Compounded Annual Growth Rate
A large percentage of the IFR operations at GFK are conducting practice approaches in VFR conditions
for flight training purposes. These operations are not reflected in the annual instrument approach
count.
Peak Activity
Peak demand periods help quantify aviation activity during busy periods. Time periods evaluated
include the peak month, design day and design hour characteristics for airport operations. Peak periods
are defined in FAA AC 150/5060-5, Airport Capacity and Delay. Peak activity is important when
planning the size of facilities with fixed capacities.
Peak Month: The calendar month when peak operations occur
Design Day: The average day in a peak month (peak month / 30)
Busy Day: The busy day of a typical week in a peak month (Design Day + 15 percent)
Design Hour: The peak hour within the design day (1/16 of Design Day + 15 percent)
4 53,993 IFR Itinerant Operations divided by 120,119 total operations in Federal Fiscal Year 2014. 5 11,034 weather hours requiring an instrument approach divided by 87,690 total weather hours from 2005-2014.

Grand Forks International Airport: Airport Master Plan January 2017 Chapter 3 – Aviation Activity Forecasts Page 3-36
GFK is a unique airport due to the shear amount of flight training operations from UND Aerospace. Peak
activity is typically seen during Visual Flight Rules (VFR) weather conditions conductive for practice
takeoffs and landings.
Peak periods evaluated include the peak month, design day and design hour characteristics for
passenger enplanements and airport operations. The results of the peak activity forecasts will be used
to determine the airport facility requirements. The methodology developed is derived from Airports
Cooperative Research Program (ACRP) Report 25: Airport Passenger Terminal Planning and Design,
which emphasizes the use of design periods to forecast use patterns rather than individual absolute
peak periods.
Local data used includes these aviation forecasts, FAA Air Traffic Activity Data System (ATADS), as well
as GFK monthly flight schedules from November 2012 through November 2015 and data provided by the
airport.
Passenger Airlines
This analysis provides an estimate of peak passenger activity at GFK for planning purposes. Actual
airline flight scheduling is based on passenger demand and individual airline requirements making it
difficult to exactly identify specific peak hours in the future.
PEAK MONTH
The peak month of passenger airline activity was determined by reviewing the prior three years of
monthly passenger enplanement figures for the airport. This method evaluates historic patterns of
passenger activity to identify the peak month. The peak month was determined to be March 2014 with
10.57 percent of the annual enplanements for calendar year 2014, which is consistent with other
calendar years reviewed. Note that the passenger peak in March was driven by Allegiant Airlines traffic
and their use of relatively larger 177-seat Airbus A320 and 215-seat Boeing 757-200 jets on seasonal
routes to warm weather destinations.
The peak month of scheduled passenger airport operations was determined by reviewing the prior
three years of commercial monthly airport operation figures from the Bureau of Transportation T-100
Domestic Segment data. This method evaluates historic patterns of airport operations activity to
identify the peak month. The peak month was determined to again be March 2014 with 9.87 percent of
total passenger operations.
DESIGN DAY
The average peak day during the peak month is considered the design day. Design day activity is
determined by evaluating actual flight schedules rather than using a pure average or an individual daily
peak. Reviewing the average day during the peak month allows for planning for a peaking period rather
than a single event which may cause overestimating.
The daily and weekly number of seats and activity levels are derived from the weekly March 2014 flight
schedule provided by the airport. The average week activity in the peak month is 23.07 percent of
monthly operations. The average peak day available seats (Monday, Thursday, Saturday) is determined
to be 966 daily departing seats out of 5,874 weekly departing seats for 16.45 percent. This is when
Allegiant Airlines schedules two departures in 166, 177 or 215 seat aircraft.
There are currently eight (8) scheduled airline departures during the average peak day and 52 each
week. Using the March 2014 flight schedule, this consists of 15.38 percent of the overall weekly total
operations. This baseline figure matches up more realistically to current design day operations for the
peak seasonal months.

Grand Forks International Airport: Airport Master Plan January 2017 Chapter 3 – Aviation Activity Forecasts Page 3-37
Table 3-44 – Peak Month, Design Day Passenger Airline Activity Forecast
Metric 2014 2019 2024 2029 2034
Passenger Airline Enplanements
Annual 146,531 147,612 170,763 194,170 220,787
Peak Month (11.31%) 16,558 16,680 19,296 21,941 24,949
Avg. Week Peak Month 3,820 3,848 4,452 5,062 5,756
Design Day (16.45%) 628 633 732 833 947
Passenger Airline Operations
Annual 4,756 4,251 4,191 4,638 5,097
Peak Month (9.87%) 469 420 414 458 503
Avg. Week Peak Month 108 97 95 106 116
Design Day (15.38%) 17 15 15 16 18 Source: Bureau of Transportation T-100 Domestic Segment, GFK Airport Records, KLJ Analysis
DESIGN HOUR
The design hour is based on the flight schedules during a design day. Using the terminal planning
guidance from ACRP Report 25, peak hour assumes passengers arrive to the airport 60 minutes prior to
departure and remain at the airport up to 60 minutes after arrival. An average week from the peak
month March 2014 flight schedule was used to review a rolling peak in 10 minute intervals. The design
hours were chosen based actual flight schedules. An evaluation of the number of arriving and departing
seats over an average weekday (design day) is shown in the following exhibit.
To be consistent with overall peak activity measures, the March 2014 flight schedule was used as a
baseline. The schedule modified to reflect new fleet mix trends including Delta’s 2015 replacement of
the CRJ-200 with a CRJ-900 on two daily flights. This change was made more accurately reflect the
actual design hour demand.
The peak hour departing seats on Mondays and Fridays in March is concentrated in the morning
between 10:00 A.M. and 10:30 A.M. with a peak 10-minute block of 227 departing seats. Peak arriving
passengers also occurs in the morning from 10:30 A.M. to 10:50 A.M. with a peak 10-minute block of
227 arriving seats. During this period an Allegiant Airbus A-320 and a Delta CRJ-200 are arriving and
departing in a closely spaced period. The absolute peak occurs at 10:30 A.M. with 454 arriving and
departing seats. This sample day had a total of 744 arriving and departing seats.
If a situation arose where the two largest aircraft (Allegiant Boeing 757 and Delta CRJ-900) arrived and
departed within the same hour it would lead to 291 arriving and 291 departing seats for a total of 582
total seats.

Grand Forks International Airport: Airport Master Plan January 2017 Chapter 3 – Aviation Activity Forecasts Page 3-38
Exhibit 3-45 – Design Day Activity (March 2014)
Source: ACRP Report 25, GFK Airport, KLJ Analysis
The peak hour occurs at two points in the day with four (4) out of 16 daily operations within one hour
when a Delta and Allegiant flight arrive and depart within the same hour.
Design hour passenger activity determinations are identified in the following table. These figures are
especially important for terminal space planning. This will be evaluated further in the Facility
Requirements chapter.
Table 3-46 – Design Day Passenger Airline Activity Forecast
Metric 2014 2019 2024 2029 2034
Passenger Airline Passengers
Design Day Enplanements 628 633 732 833 947
Design Hour Enplanements (30.5%) 192 193 223 254 289
Design Hour Deplanements (30.5%) 192 193 223 254 289
Design Hour Passengers (28.9%) 363 366 423 481 547
Passenger Airline Operations
Design Day (15.38%) 17 15 15 16 18
Design Hour (25.0%) 4.2 3.7 3.7 4.1 4.5 Source: Bureau of Transportation T-100 Domestic Segment, GFK Airport Records, KLJ Analysis Note: Some numbers may not add up due to rounding
Airport Operations
Peaking tendencies for total airport operations reviewed the preferred GFK airport activity forecasts
along with the high forecast scenario for the long-term, driven by unconstrained UND Aerospace flight
training operations at GFK.
PEAK MONTH
The peak month of airport operations was determined by reviewing the prior three years of monthly
airport operations figures from the GFK ATCT. The peak month was determined to be July 2012 with
40,297 total operations, or 11.01 percent of the annual operations for calendar year 2012. The peak
month varied between July 2012, June 2013 and October 2014 for the three years reviewed.
0
50
100
150
200
250
300
350
400
450
500
0:00 2:00 4:00 6:00 8:00 10:00 12:00 14:00 16:00 18:00 20:00 22:00 0:00
Seats
Time
Design Day Passenger Activity
Departing Seats Arriving Seats Total Seats

Grand Forks International Airport: Airport Master Plan January 2017 Chapter 3 – Aviation Activity Forecasts Page 3-39
DESIGN HOUR
The design hour is based on the average hourly operations during a design day. To determine this
figure, average hourly operations per five-hour block were reviewed for the top 25 operational days in
the past three years. Averaging both the individual peak day and the top 25 days, average hourly
operations consisted of 8.59 percent of the total daily operations. The individual average peak hour
was 220 operations per hour (9.97 percent of daily total) during March 20, 2012.
Table 3-47 – Airport Operations Peak Forecast Metric 2014 2019 2024 2029 2034 High
Annual Operations 324,196 312,613 334,205 347,330 350,477 383,247
Peak Month (11.01%) 35,694 34,419 36,796 38,241 38,588 42,196
Design Day (4.91%) 1,753 1,690 1,807 1,878 1,895 2,072
Design Hour (8.59%) 151 145 155 161 163 178 Source: FAA Operations Network (OPSNET), KLJ Analysis, CAGR = Compounded Annual Growth Rate
Table 3-48 – Average Hourly Operations
Source: FAA Traffic Flow Management System Counts (OPSNET)

Grand Forks International Airport: Airport Master Plan January 2017 Chapter 3 – Aviation Activity Forecasts Page 3-40
Forecast Summary
Exhibit 3-49 – GFK Aviation Activity Forecast Summary
Activity Levels Average Annual Compound Growth Rates
A. Forecast Levels 2014 2019 2024 2029 2034 0-5 Years 0-10 Years 0-15 Years 0-20 Years
Passenger Enplanements
Air Carrier 72,052 112,753 157,973 194,170 220,787 9.37%
8.17% 6.83% 5.76%
Commuter 74,479 34,859 12,790 0 0 -14.09% -16.15% - -
TOTAL ENPLANEMENTS 146,531 147,612 170,763 194,170 220,787 0.15% 1.54% 1.89% 2.07%
Operations
Itinerant
Air Carrier 2,255 2,561 3,585 4,648 5,107 2.58% 4.75% 4.94% 4.17%
Commuter/Air Taxi 101,288 93,561 98,676 101,382 101,499 -1.57% -0.26% 0.01% 0.01%
Total Commercial Operations
103,543 96,122 102,261 106,029 106,607 -1.48% -0.12% 0.16% 0.15%
General Aviation 16,422 14,053 15,832 17,836 20,094 -3.07% -0.37% 0.55% 1.01%
Military 154 370 370 370 370 19.18% 9.17% 6.02% 4.48%
Total Itinerant Operations 120,119 110,546 118,464 124,236 127,071 -1.65% -0.14% 0.22% 0.28%
Local
Civil 204,073 201,787 215,461 222,814 223,125 -0.23% 0.54% 0.59% 0.45%
Military 4 280 280 280 280 133.97% 52.96% 32.76% 23.68%
Total Local Operations 204,077 202,067 215,741 223,094 223,406 -0.20% 0.56% 0.60% 0.45%
TOTAL OPERATIONS 324,196 312,613 334,205 347,330 350,477 -0.72% 0.30% 0.46% 0.39%
Annual Instrument Approaches 3,392 3,226 3,569 3,860 4,068 -1.00% 0.51% 0.87% 0.91%
Peak Hour Operations 151 145 155 161 163 -0.73% 0.30% 0.46% 0.39%
Cargo/Mail (Pounds) 58,351,637 598,901 620,158 637,620 660,139 -59.98% -36.52% -26.00% -20.08%
Based Aircraft
Single Engine 95 104 110 112 115 1.78% 1.44% 1.10% 0.97%
Multi Engine 21 23 25 25 25 1.84% 1.47% 1.17% 0.84%
Turbojet 19 21 23 24 26 2.10% 1.98% 1.76% 1.64%
Helicopter 12 12 12 12 13 0.25% -0.02% 0.18% 0.28%
Other 0 0 0 0 0 - - - -
TOTAL BASED AIRCRAFT AIRCRAIRCRAFT
147 160 169 174 179 1.71% 1.40% 1.13% 0.99%
B. Operational Factors 2014 2019 2024 2029 2034 2019 2024 2029 2034
Average Aircraft Size (seats)
Air Carrier 136.2 107.8 106.5 99.7 101.9 -4.57% -2.43% -2.06% -1.44%
Commuter 50.0 50.0 50.0 0.0 0.0 0.00% 0.00%
Average Enplaning Load Factor
Air Carrier 83.53% 82.00% 83.00% 84.00% 85.00% -0.37% -0.06% 0.04% 0.09%
Commuter 85.39% 82.00% 83.00% 84.00% 85.00% -0.81% -0.28% -0.11% -0.02%
Source: KLJ Analysis. Note: Some figures are rounded

Grand Forks International Airport: Airport Master Plan January 2017 Chapter 3 – Aviation Activity Forecasts Page 3-41
Forecast Comparison with FAA TAF
Proposed aviation activity forecasts must be reviewed and approved by FAA. A forecast is consistent
with the FAA TAF if the proposed activity is within a certain tolerance of the official TAF forecast. If
the proposed forecast is inconsistent with the TAF, then differences must be resolved for the forecast
to be adopted by the FAA. Key activity measures that are reviewed include passenger enplanements,
based aircraft and total operations. The 2015 FAA TAF issued January 2016 is used for comparison.
PASSENGER ENPLANEMENTS
The airport’s proposed forecast of enplanements is considered to be consistent with the 2015 FAA TAF
for the 10-year forecast horizon.
BASED AIRCRAFT
The airport’s proposed forecast of constrained based aircraft is considered to be consistent with the
2015 FAA TAF for the 10-year forecast horizon. The unconstrained forecast for facility planning
purposes yields 187 based aircraft, 4.4 percent greater than the 2015 FAA TAF at the end of the
planning period.
TOTAL OPERATIONS
The airport’s proposed forecast of constrained total operations is considered to be consistent with the
2015 FAA TAF for the 10-year forecast horizon. The unconstrained forecast for facility planning
purposes yields 383,248 operations, nearly 5 percent greater than the 2015 FAA TAF at the end of the
planning period.
Table 3-50 – Comparing Airport Forecast to FAA TAF
Metric Year Airport
Forecast
2015
FAA TAF
AF/TAF %
Difference
Passenger Enplanements
Base Year 2014 146,531 146,531 0.0%
Base Year + 5 Years 2019 147,612 152,472 -3.2%
Base Year + 10 Years 2024 170,763 160,559 6.4%
Base Year + 15 Years 2029 194,170 167,963 15.6%
Base Year + 20 Years 2034 220,787 175,567 25.8%
Growth Rate 2.07% 0.91%
Based Aircraft
Base Year 2014 147 147 0.0%
Base Year + 5 Years 2019 160 160 0.0%
Base Year + 10 Years 2024 169 169 0.0%
Base Year + 15 Years 2029 174 174 0.0%
Base Year + 20 Years 2034 179 179 0.0%
Growth Rate 0.99% 0.99%
Total Operations
Base Year 2014 324,196 324,196 0.0%
Base Year + 5 Years 2019 312,613 303,421 3.0%
Base Year + 10 Years 2024 334,205 323,272 3.4%
Base Year + 15 Years 2029 347,330 343,669 1.1%
Base Year + 20 Years 2034 350,477 365,390 -4.1%
Growth Rate 0.39% 0.60% Source: KLJ Analysis, FAA Terminal Area Forecast (January 2016) Green cells indicate Airport Forecast is within the FAA’s TAF tolerance

Grand Forks International Airport: Airport Master Plan January 2017 Chapter 3 – Aviation Activity Forecasts Page 3-42
Forecast Approval
The proposed aviation forecasts identified in this chapter were approved by FAA on January 3, 2017 for
use in this master planning effort.