chapter 33... · an ecosystem is a particular location on earth ... water, ph, and nutrients. ... ...
TRANSCRIPT

Chapter 310/3/12 9:26 PMeBook Page
Page 1 of 3http://ebooks.bfwpub.com/friedlandapes/sections/3_0.html?301
E
Deforestation in the mountains of Haiti has disrupted natural cycles.
Reversing the Deforestation of Haitiven before the devastating earthquake of 2010, life in Haiti washard. On the streets of the capital city, Port-au-Prince, peoplewould line up to buy charcoal to cook their meals. According to theUnited Nations, 76 percent of Haitians lived on less than $2.00 a
day. Because other forms of cooking fuel, including oil and propane, were tooexpensive, people turned to the forests, cutting trees to make charcoal from
Printed Page 57
3Ecosystem Ecology
[Notes/Highlighting]
CHAPTER
Chapter 3
10/3/12 9:27 PMeBook Page
Page 1 of 1http://ebooks.bfwpub.com/friedlandapes/sections/3_1.html?302
Previous Section | Next Section
3.1 Ecosystem ecology examines interactionsbetween the living and nonliving world
The story of deforestation in Haiti reminds us that all the components of anecosystem are interrelated. An ecosystem is a particular location on Earthdistinguished by its particular mix of interacting biotic and abioticcomponents. A forest, for example, contains many interacting bioticcomponents, such as trees, wildflowers, birds, mammals, insects, fungi, andbacteria, that are quite distinct from those in a grassland. Collectively, all theliving organisms in an ecosystem represent that ecosystem’s biodiversity.Ecosystems also have abiotic components such as sunlight, temperature,soil, water, pH, and nutrients. The abiotic components of the ecosystemdetermine which organisms can live there.
The components of a particular ecosystem are highly dependent on climate.For example, ecosystems in the dry desert of Death Valley, California, wheretemperatures may reach 50°C (120°F), are very different from those on thecontinent of Antarctica, where temperatures may drop as low as −85°C(−120°F). Similarly, water can range from being immeasurable in deserts tobeing a defining part of the ecosystem in lakes and oceans. On less extremescales, small differences in precipitation and the ability of the soil to retainwater can favor different terrestrial ecosystem types. Regions with greaterquantities of water in the soil can support trees, whereas regions with lesswater in the soil can support only grasses.
Printed Page 58
[Notes/Highlighting]

Chapter 3
10/3/12 9:27 PMeBook Page
Page 1 of 3http://ebooks.bfwpub.com/friedlandapes/sections/3_1_1.html?303
3.1.1 Ecosystem Boundaries
The biotic and abiotic components of an ecosystem provide the boundariesthat distinguish one ecosystem from another. Some ecosystems have well-defined boundaries, whereas others do not. A cave, for example, is a well-defined ecosystem (FIGURE 3.1). It contains identifiable biotic components,such as animals and microorganisms that are specifically adapted to live in acave environment, as well as distinctive abiotic components, includingtemperature, salinity, and water that flows through the cave as anunderground stream. Roosting bats fly out of the cave each night andconsume insects. When the bats return to the cave and defecate, their fecesprovide energy that passes through the relatively few animal species that livein the cave. In many caves, for example, small invertebrate animals consumethe feces and are in turn consumed by cave salamanders.
Figure 3.1 A cave ecosystem. Cave ecosystems typically have distinct boundaries and arehome to highly adapted species.
The cave ecosystem is relatively easy to study because its boundaries areclear. With the exception of the bats feeding outside the cave, the caveecosystem is easily defined as everything from the point where the streamenters the cave to the point where it exits. Likewise, many aquaticecosystems, such as lakes, ponds, and streams, are relatively easy to definebecause the ecosystem’s boundaries correspond to the boundaries betweenland and water. Knowing the boundaries of an ecosystem makes it easier toidentify the system’s biotic and abiotic components and to trace the cycling
Printed Page 58
[Notes/Highlighting]

Chapter 3
10/3/12 9:28 PMeBook Page
Page 1 of 1http://ebooks.bfwpub.com/friedlandapes/sections/3_1_2.html?304
Previous Section | Next Section
3.1.2 Ecosystem Processes
Although it is helpful to divide locations on Earth into distinct ecosystems, itis important to remember that each ecosystem interacts with surroundingecosystems through the exchange of energy and matter. Organisms, such asbats flying to and from their cave, and chemical elements, such as carbon ornitrogen dissolved in water, move across ecosystem boundaries. As a result,changes in any one ecosystem can ultimately have far-reaching effects onthe global environment.
CHECKPOINT
What is an ecosystem and what are its components?
How would you know when you left one ecosystem and enteredanother?
How are ecosystem boundaries imposed by humans sometimesdifferent from natural boundaries?
Printed Page 60
[Notes/Highlighting]

Chapter 310/3/12 9:28 PMeBook Page
Page 1 of 1http://ebooks.bfwpub.com/friedlandapes/sections/3_2.html?305
Previous Section | Next Section
3.2 Energy flows through ecosystems
To understand how ecosystems function and how to best protect and managethem, ecosystem ecologists study not only the biotic and abiotic componentsthat define an ecosystem, but also the processes that move energy andmatter within it.
Plants absorb energy directly from the Sun. That energy is then spreadthroughout an ecosystem as herbivores (animals that eat plants) feed onplants and carnivores (animals that eat other animals) feed on herbivores.Consider the Serengeti Plain in East Africa, shown in FIGURE 3.3. There aremillions of herbivores, such as zebras and wildebeests, in the Serengetiecosystem, but far fewer carnivores, such as lions (Panthera leo) andcheetahs (Acinonyx jubatus), that feed on those herbivores. In accordancewith the second law of thermodynamics, when one organism consumesanother, not all of the energy in the consumed organism is transferred to theconsumer. Some of that energy is lost as heat. Therefore, all the carnivoresin an area contain less energy than all the herbivores in the same areabecause all the energy going to the carnivores must come from the animalsthey eat. To better understand these energy relationships, let’s trace thisenergy flow in more detail.
Figure 3.3 Serengeti Plain of Africa. The Serengeti ecosystem has moreplants than herbivores, and more herbivores than carnivores.
Printed Page 60
[Notes/Highlighting]

Chapter 3
10/3/12 9:28 PMeBook Page
Page 1 of 1http://ebooks.bfwpub.com/friedlandapes/sections/3_2_1.html?306
Figure 3.4 Photosynthesis and respiration. Photosynthesis is a process by which producers use solarenergy to convert carbon dioxide and water into glucoseand oxygen. Respiration is a process by which organismsconvert glucose and oxygen into water and carbon dioxide,releasing the energy needed to live, grow, and reproduce.All organisms, including producers, perform respiration.
Previous Section | Next Section
3.2.1 Photosynthesis and Respiration
Nearly all of the energy that powers ecosystemscomes from the Sun as solar energy, which is aform of kinetic energy. Plants, algae, and otherorganisms that use the Sun’s energy to produceusable forms of energy are called producers, orautotrophs. Through the process ofphotosynthesis, producers use solar energy toconvert carbon dioxide (CO2) and water (H2O) into
glucose (C6H12O6), a form of potential energy that
can be used by a wide range of organisms. As wecan see in FIGURE 3.4, the process also producesoxygen (O2) as a waste product. That is why
plants and other producers are beneficial to ouratmosphere: they produce the oxygen we need tobreathe.
Producers use the glucose they produce byphotosynthesis to store energy and to buildstructures such as leaves, stems, and roots. Otherorganisms, such as the herbivores on theSerengeti Plain, eat the tissues of producers andgain energy from the chemical energy contained inthose tissues. They do this through cellularrespiration, a process that unlocks the chemicalenergy stored in the cells of organisms.Respiration is the opposite of photosynthesis: cellsconvert glucose and oxygen into energy, carbondioxide, and water. In essence, they runphotosynthesis backward to recover the solarenergy stored in glucose.
All organisms—including producers—carry outrespiration to fuel their own metabolism andgrowth. Thus producers both produce andconsume oxygen. When the Sun is shining and photosynthesis occurs,producers generate more oxygen via photosynthesis than they consume viarespiration, and there is a net production of oxygen. At night, producers onlyrespire, consuming oxygen without generating it. Overall, producersphotosynthesize more than they respire. The net effect is an excess ofoxygen that is released into the air and an excess of carbon that is stored inthe tissues of producers.
Printed Page 60
[Notes/Highlighting]
Chapter 3
10/3/12 9:28 PMeBook Page
Page 1 of 3http://ebooks.bfwpub.com/friedlandapes/sections/3_2_2.html?307
3.2.2 Trophic Levels, Food Chains, and Food Webs
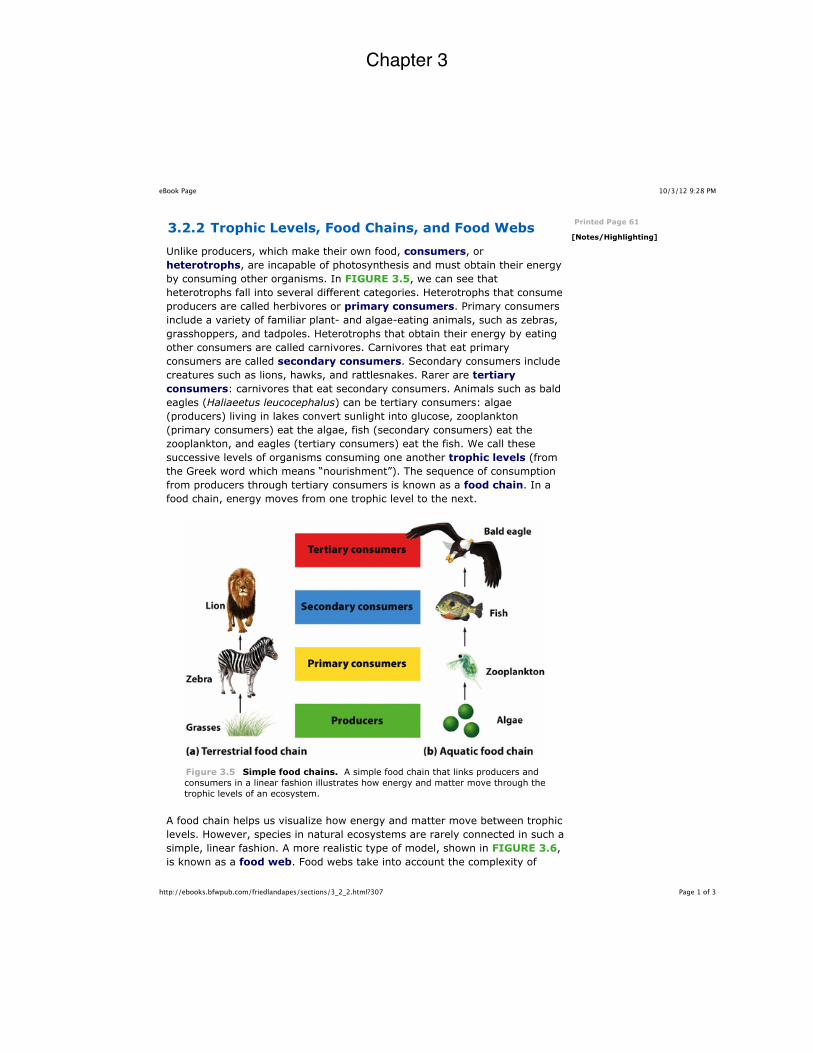
Unlike producers, which make their own food, consumers, orheterotrophs, are incapable of photosynthesis and must obtain their energyby consuming other organisms. In FIGURE 3.5, we can see thatheterotrophs fall into several different categories. Heterotrophs that consumeproducers are called herbivores or primary consumers. Primary consumersinclude a variety of familiar plant- and algae-eating animals, such as zebras,grasshoppers, and tadpoles. Heterotrophs that obtain their energy by eatingother consumers are called carnivores. Carnivores that eat primaryconsumers are called secondary consumers. Secondary consumers includecreatures such as lions, hawks, and rattlesnakes. Rarer are tertiaryconsumers: carnivores that eat secondary consumers. Animals such as baldeagles (Haliaeetus leucocephalus) can be tertiary consumers: algae(producers) living in lakes convert sunlight into glucose, zooplankton(primary consumers) eat the algae, fish (secondary consumers) eat thezooplankton, and eagles (tertiary consumers) eat the fish. We call thesesuccessive levels of organisms consuming one another trophic levels (fromthe Greek word which means “nourishment”). The sequence of consumptionfrom producers through tertiary consumers is known as a food chain. In afood chain, energy moves from one trophic level to the next.
Figure 3.5 Simple food chains. A simple food chain that links producers andconsumers in a linear fashion illustrates how energy and matter move through thetrophic levels of an ecosystem.
A food chain helps us visualize how energy and matter move between trophiclevels. However, species in natural ecosystems are rarely connected in such asimple, linear fashion. A more realistic type of model, shown in FIGURE 3.6,is known as a food web. Food webs take into account the complexity of
Printed Page 61
[Notes/Highlighting]

Chapter 3
10/3/12 9:29 PMeBook Page
Page 1 of 3http://ebooks.bfwpub.com/friedlandapes/sections/3_2_3.html?308
3.2.3 Ecosystem Productivity
The amount of energy available in an ecosystem determines how much lifethe ecosystem can support. For example, the amount of sunlight thatreaches a lake surface determines how much algae can live in the lake. Inturn, the amount of algae determines the number of zooplankton the lakecan support, and the size of the zooplankton population determines thenumber of fish the lake can support.
If we wish to understand how ecosystems function, or how to manage andprotect them, it is important to understand where the energy in anecosystem comes from and how it is transferred through food webs. To dothis, environmental scientists look at the total amount of solar energy thatthe producers in an ecosystem capture via photosynthesis over a givenamount of time. This measure is known as the gross primary productivity(GPP) of the ecosystem.
Note that the term gross, as used here, indicates the total amount of energycaptured by producers. In other words, GPP does not subtract the energy lostwhen the producers respire. The energy captured minus the energy respiredby producers is the ecosystem’s net primary productivity (NPP):
NPP = GPP − respiration by producers
You can think of GPP and NPP in terms of a paycheck. GPP is like the totalamount your employer pays you. NPP is the actual amount you take homeafter taxes are deducted.
GPP is essentially a measure of how much photosynthesis is occurring oversome amount of time. Determining GPP is a challenge for scientists becausea plant rarely photosynthesizes without simultaneously respiring. However, ifwe can determine the rate of photosynthesis and the rate of respiration, wecan use this information to calculate GPP.
We can determine the rate of photosynthesis by measuring the compoundsthat participate in the reaction. So, for example, we can measure the rate atwhich CO2 is taken up during photosynthesis and the rate at which CO2 is
produced during respiration. A common approach to measuring GPP is to firstmeasure the production of CO2 in the dark. Because no photosynthesis
occurs in the dark, this measure eliminates CO2 uptake by photosynthesis.
Next, we measure the uptake of CO2 in sunlight. This measure gives us the
net movement of CO2 when respiration and photosynthesis are both
occurring. By adding the amount of CO2 produced in the dark to the amount
of CO2 taken up in the sunlight, we can determine the gross amount of CO2
that is taken up during photosynthesis:
CO2 taken up during photosynthesis = CO2 taken up in sunlight + CO2
produced in the dark
Printed Page 63
[Notes/Highlighting]
Chapter 3
10/3/12 9:29 PMeBook Page
Page 1 of 2http://ebooks.bfwpub.com/friedlandapes/sections/3_2_4.html?309
3.2.4 Energy Transfer Efficiency and TrophicPyramids
The energy in an ecosystem can be measured in terms of biomass, which isthe total mass of all living matter in a specific area. The net primaryproductivity of an ecosystem—its NPP—establishes the rate at which biomassis produced over a given amount of time. To analyze the productivity of anecosystem, scientists calculate the biomass of all individuals accumulatedover a given amount of time.
The amount of biomass present in an ecosystem at a particular time is itsstanding crop. It is important to differentiate standing crop, whichmeasures the amount of energy in a system at a given time, fromproductivity, which measures the rate of energy production over a span oftime. For example, slow-growing forests have low productivity; the trees addonly a small amount of biomass through growth and reproduction each year.However, the standing crop of long-lived trees—the biomass of trees that hasaccumulated over hundreds of years—is quite high. In contrast, the highgrowth rates of algae living in the ocean make them extremely productive.But because primary consumers eat these algae so rapidly, the standing cropof algae at any particular time is relatively low.
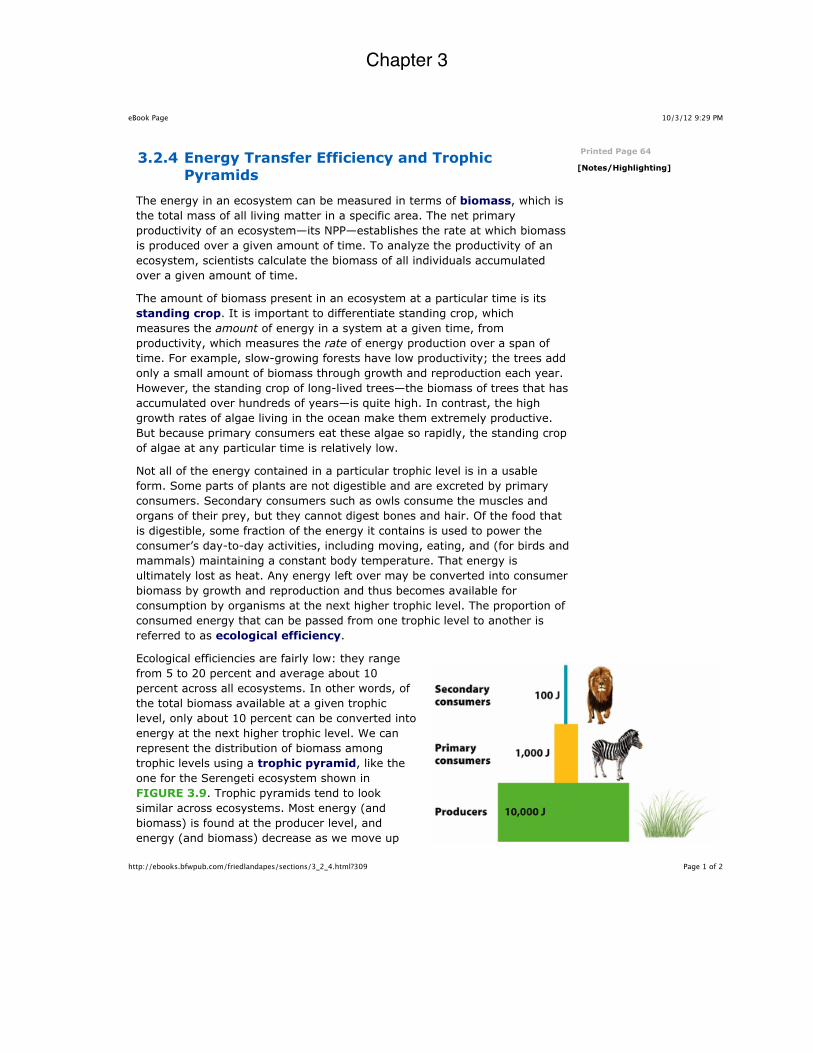
Not all of the energy contained in a particular trophic level is in a usableform. Some parts of plants are not digestible and are excreted by primaryconsumers. Secondary consumers such as owls consume the muscles andorgans of their prey, but they cannot digest bones and hair. Of the food thatis digestible, some fraction of the energy it contains is used to power theconsumer’s day-to-day activities, including moving, eating, and (for birds andmammals) maintaining a constant body temperature. That energy isultimately lost as heat. Any energy left over may be converted into consumerbiomass by growth and reproduction and thus becomes available forconsumption by organisms at the next higher trophic level. The proportion ofconsumed energy that can be passed from one trophic level to another isreferred to as ecological efficiency.
Ecological efficiencies are fairly low: they rangefrom 5 to 20 percent and average about 10percent across all ecosystems. In other words, ofthe total biomass available at a given trophiclevel, only about 10 percent can be converted intoenergy at the next higher trophic level. We canrepresent the distribution of biomass amongtrophic levels using a trophic pyramid, like theone for the Serengeti ecosystem shown inFIGURE 3.9. Trophic pyramids tend to looksimilar across ecosystems. Most energy (andbiomass) is found at the producer level, andenergy (and biomass) decrease as we move up
Printed Page 64
[Notes/Highlighting]
Chapter 3
10/3/12 9:30 PMeBook Page
Page 1 of 1http://ebooks.bfwpub.com/friedlandapes/sections/3_3.html?310
Previous Section | Next Section
3.3 Matter cycles through the biosphere
The combination of all ecosystems on Earth forms the biosphere. Thebiosphere is the region of our planet where life resides. It forms a 20 km(12-mile) thick shell around Earth between the deepest ocean bottom andthe highest mountain peak. Energy flows through the biosphere: it enters asenergy from the Sun, moves among the living and nonliving components ofecosystems, and is ultimately emitted into space by Earth and itsatmosphere. As a result, energy must be constantly replenished by the Sun.Matter, in contrast, does not enter or leave the biosphere, but cycles withinthe biosphere in a variety of forms. As we saw in Chapter 2, Earth is anopen system with respect to energy, but a closed system with respect tomatter.
The movements of matter within and between ecosystems involve biological,geological, and chemical processes. For this reason, these cycles are knownas biogeochemical cycles. To keep track of the movement of matter inbiogeochemical cycles, we refer to the components that contain the matter,including air, water, and organisms, as pools. Processes that move matterbetween pools are known as flows.
All of Earth’s living organisms are composed of chemical elements—mostlycarbon, hydrogen, nitrogen, oxygen, and phosphorus. Organisms survive byconstantly acquiring these various elements, either directly from theirenvironment or by consuming other organisms, breaking down the digestiblematerial, and rearranging the elements into usable compounds. The elementseventually leave the biotic components of the ecosystem when they areexcreted as wastes or released by decomposition. Understanding the sourcesof these elements and how they flow between the biotic and abioticcomponents of ecosystems helps us to understand how ecosystems functionand the ways in which human activities can alter these processes.
The specific chemical forms elements take determine how they cycle withinthe biosphere. In this section we will look at the elements that are the mostimportant to the productivity of photosynthetic organisms. We will begin withthe hydrologic cycle—the movement of water. Then we will explore the cyclesof carbon, nitrogen, and phosphorus. Finally, we will take a brief look at thecycles of calcium, magnesium, potassium, and sulfur.
Printed Page 65
[Notes/Highlighting]

Chapter 3
10/3/12 9:30 PMeBook Page
Page 1 of 2http://ebooks.bfwpub.com/friedlandapes/sections/3_3_1.html?311
3.3.1 The Hydrologic Cycle
Water is essential to life. It makes up over one-half of a typical mammal’sbody weight, and no organism can survive without it. Water allows essentialmolecules to move within and between cells, draws nutrients into the leavesof trees, dissolves and removes toxic materials, and performs many othercritical biological functions. On a larger scale, water is the primary agentresponsible for dissolving and transporting the chemical elements necessaryfor living organisms. The movement of water through the biosphere is knownas the hydrologic cycle.
FIGURE 3.10 shows how the hydrologic cycle works. Heat from the Suncauses water to evaporate from oceans, lakes, and soils. Solar energy alsoprovides the energy for photosynthesis, during which plants release waterfrom their leaves into the atmosphere—a process known as transpiration.The water vapor that enters the atmosphere eventually cools and formsclouds, which, in turn, produce precipitation in the form of rain, snow, andhail. Some precipitation falls back into the ocean and some falls on land.
Printed Page 66
[Notes/Highlighting]

Chapter 3
10/3/12 9:30 PMeBook Page
Page 1 of 4http://ebooks.bfwpub.com/friedlandapes/sections/3_3_2.html?312
3.3.2 The Carbon Cycle
The elements carbon (C), nitrogen (N), phosphorus (P), potassium (K),magnesium (Mg), calcium (Ca), and sulfur (S) cycle through trophic levels insimilar ways. Producers obtain these elements from the atmosphere or asions dissolved in water. Consumers then obtain these elements by eatingproducers. Finally, decomposers absorb these elements from dead producersand consumers and their waste products. Through the process ofdecomposition, they convert the elements into forms that are once againavailable to producers.
Carbon is the most important element in living organisms; it makes up about20 percent of their total body weight. Carbon is the basis of the long chainsof organic molecules that form the membranes and walls of cells, constitutethe backbones of proteins, and store energy for later use. Other than water,there are few molecules in the bodies of organisms that do not containcarbon.
FIGURE 3.11 illustrates the six processes that drive the carbon cycle:photosynthesis, respiration, exchange, sedimentation and burial, extraction,and combustion. These processes can be categorized as either fast or slow.The fast part of the cycle involves processes that are associated with livingorganisms. The slow part of the cycle involves carbon that is held in rocks, insoils, or as petroleum hydrocarbons (the materials we use as fossil fuels).Carbon may be stored in these forms for millions of years.
Printed Page 66
[Notes/Highlighting]

Chapter 3
10/3/12 9:30 PMeBook Page
Page 1 of 4http://ebooks.bfwpub.com/friedlandapes/sections/3_3_3.html?313
3.3.3 The Nitrogen Cycle
We have seen that water and carbon, both essential to life, cycle through thebiosphere in complex ways. Now we turn to some of the other elements thatplay an important part in the life of ecosystems. There are six key elements,known as macronutrients, that organisms need in relatively large amounts:nitrogen, phosphorus, potassium, calcium, magnesium, and sulfur.
Organisms need nitrogen—the most abundant element in the atmosphere—inrelatively high amounts. Because so much of it is required, nitrogen is often alimiting nutrient for producers. In other words, a lack of nitrogenconstrains the growth of the organism. Adding other nutrients, such as wateror phosphorus, will not improve plant growth in nitrogen-poor soil.
Nitrogen is used to form amino acids, the building blocks of proteins, andnucleic acids, the building blocks of DNA and RNA. In humans, nitrogenmakes up about 3 percent of total body weight. The movement of nitrogenfrom the atmosphere through many transformations within the soil, then intoplants, and then back into the atmosphere makes the nitrogen cycle one ofthe more interesting and complex biogeochemical cycles.
FIGURE 3.12 shows the complex processes of the nitrogen cycle. AlthoughEarth’s atmosphere is 78 percent nitrogen by volume, the vast majority ofthat nitrogen is in a form that most producers cannot use. Nitrogen gas (N2)
molecules consist of two N atoms tightly bound together. Only a feworganisms can convert N2 gas directly into ammonia (NH3) by a process
known as nitrogen fixation. This process is the first step in the nitrogencycle. Nitrogen-fixing organisms include cyanobacteria (also known as blue-green algae) and certain bacteria that live within the roots of legumes (plantssuch as peas, beans, and a few species of trees). These nitrogen-fixingbacteria possess specialized enzymes that can break the strong N2 bond and
add hydrogen ions to form NH3, which is readily converted into its ionic form,
ammonium (NH4+), in the soil.
Printed Page 69
[Notes/Highlighting]

Chapter 3
10/3/12 9:30 PMeBook Page
Page 1 of 3http://ebooks.bfwpub.com/friedlandapes/sections/3_3_4.html?314
3.3.4 The Phosphorus Cycle
Organisms need phosphorus for many biological processes. Phosphorus is amajor component of DNA and RNA as well as ATP, the molecule used by cellsfor energy transfer. Required by both plants and animals, phosphorus is alimiting nutrient second only to nitrogen in its importance for successfulagricultural yields. Thus phosphorus, like nitrogen, is commonly added tosoils in the form of fertilizer.
FIGURE 3.13 shows the processes of the phosphorus cycle. Because thiscycle has no gaseous component, atmospheric inputs of phosphorus—whichoccur when phosphorus is dissolved in rainwater or sea spray—are verysmall. Phosphorus is not very soluble in water, so much of it precipitates out
of solution, forming phosphate (PO43−)-laden sediments on the ocean floor.
Humans mine some of these ancient phosphate sediments for fertilizer. Thesmall amount of phosphorus dissolved in water also means that phosphorusis the primary limiting nutrient in many freshwater and marine food webs.
Printed Page 71
[Notes/Highlighting]

Chapter 3
10/3/12 9:31 PMeBook Page
Page 1 of 2http://ebooks.bfwpub.com/friedlandapes/sections/3_3_5.html?315
Previous Section | Next Section
3.3.5 Calcium, Magnesium, Potassium, and Sulfur
Calcium, magnesium, and potassium play important roles in regulatingcellular processes and in transmitting signals between cells. Like phosphorus,these macro-nutrients are derived primarily from rocks and decomposedvegetation. All three can be dissolved in water as positively charged ions:Ca2+, Mg2+, and K+. None is present in a gaseous phase, but all can bedeposited from the air in small amounts as dust.
Because of their positive charges, calcium, magnesium, and potassium ionsare attracted to the negative charges present on the surfaces of most soilparticles. Calcium and magnesium occur in high concentrations in limestoneand marble. Because Ca2+ and Mg2+ are strongly attracted to soil particles,they are abundant in many soils overlying these rock types. In contrast, K+
is only weakly attracted to soil particles and is therefore more susceptible tobeing leached away by water moving through the soil. Leaching of potassiumcan lead to potassium-deficient soils that constrain the growth of plants andanimals.
The final macronutrient, sulfur, is a component of proteins and also plays animportant role in allowing organisms to use oxygen. Most sulfur exists inrocks and is released into soils and water as these rocks weather over time.
Plants absorb sulfur through their roots in the form of sulfate ions (SO42−),
and the sulfur then cycles through the food web. The sulfur cycle also has agaseous component. Volcanic eruptions are a natural source of atmosphericsulfur in the form of sulfur dioxide (SO2). Human activities also add sulfur
dioxide to the atmosphere, especially the burning of fossil fuels and themining of metals such as copper. In the atmosphere, SO2 is converted into
sulfuric acid (H2SO4) when it mixes with water. The sulfuric acid can then be
carried back to the ground when it rains or snows. As humans add moresulfur dioxide to the atmosphere, we cause more acid precipitation, whichcan negatively affect terrestrial and aquatic ecosystems. Althoughanthropogenic deposition of sulfur remains an environmental concern, cleanair regulations in the United States have significantly lowered these depositssince 1995.
CHECKPOINT
What are the dominant elements that make up living organisms?
What role does water play in nutrient cycling?
What are the main similarities and differences among the carbon,nitrogen, and phosphorus cycles?
Printed Page 73
[Notes/Highlighting]

Chapter 3
10/3/12 9:32 PMeBook Page
Page 1 of 1http://ebooks.bfwpub.com/friedlandapes/sections/3_4.html?316
Previous Section | Next Section
3.4 Ecosystems respond to disturbance
An event caused by physical, chemical, or biological agents that results inchanges in population size or community composition is called adisturbance. Natural ecosystem disturbances include hurricanes, ice storms,tsunamis, tornadoes, volcanic eruptions, and forest fires (FIGURE 3.15).Anthropogenic ecosystem disturbances include human settlements,agriculture, air pollution, clear-cutting of forests, and the removal of entiremountaintops for coal mining. Disturbances can occur over both short andlong time scales. Ecosystem ecologists are often interested in how suchdisturbances affect the flow of energy and matter through an ecosystem.More specifically, they are interested in whether an ecosystem can resist theimpact of a disturbance and whether a disturbed ecosystem can recover itsoriginal condition.
Figure 3.15 Ecosystem disturbance. The Chandeleur Islands in Louisiana were almost completely submerged byHurricane Katrina in August 2005. (a) This photo of the islands, taken on July 17, 2001, shows vegetated sand dunes. (b)This photo, taken 2 days after the hurricane made landfall in Louisiana and Mississippi, shows massive erosion and the lossof sand dunes and much of the vegetation.
In this section we will look at how scientists study disturbance. We will thengo on to consider resistance and resilience. Finally, we will apply ourknowledge to an important theory about how systems respond todisturbances.
Printed Page 73
[Notes/Highlighting]

Chapter 3
10/3/12 9:32 PMeBook Page
Page 1 of 2http://ebooks.bfwpub.com/friedlandapes/sections/3_4_1.html?317
3.4.1 Watershed Studies
Understanding the natural rates and patterns of biogeochemical cycling in anecosystem provides a basis for determining how a disturbance has changedthe system. Because it is difficult to study biogeochemical cycles on a globalscale, most such research takes place on a smaller scale, at which scientistscan measure all of the ecosystem processes. A watershed is a common placefor scientists to conduct such studies. As shown in FIGURE 3.16, awatershed is all of the land in a given landscape that drains into a particularstream, river, lake, or wetland.
Figure 3.16 Watershed. A watershed is the area of land that drains into aparticular body of water.
One of the most thorough studies of disturbance at the watershed scale hasbeen ongoing in the Hubbard Brook ecosystem of New Hampshire since1962. For almost 50 years, investigators have monitored the hydrologicaland biogeochemical cycles of six watersheds at Hubbard Brook, ranging inarea from 12 to 43 ha (30 to 106 acres). The soil in each watershed is
Printed Page 74
[Notes/Highlighting]

Chapter 3
10/3/12 9:32 PMeBook Page
Page 1 of 2http://ebooks.bfwpub.com/friedlandapes/sections/3_4_2.html?318
3.4.2 Resistance versus Resilience
Not every ecosystem disturbance is a disaster. For example, a low-intensityfire might kill some plant species, but at the same time it might benefit fire-adapted species that can use the additional nutrients released from the deadplants. So, although the population of a particular producer species might bediminished or even eliminated, the net primary productivity of all theproducers in the ecosystem might remain the same. When this is the case,we say that the productivity of the system is resistant. The resistance of anecosystem is a measure of how much a disturbance can affect the flows ofenergy and matter. When a disturbance influences populations andcommunities, but has no effect on the overall flows of energy and matter, wesay that the ecosystem has high resistance.
When an ecosystem’s flows of energy and matter are affected by adisturbance, environmental scientists often ask how quickly and howcompletely the ecosystem can recover its original condition. The rate atwhich an ecosystem returns to its original state after a disturbance is termedresilience. A highly resilient ecosystem returns to its original state relativelyrapidly; a less resilient ecosystem does so more slowly. For example, imaginethat a severe drought has eliminated half the species in an area. In a highlyresilient ecosystem, the flows of energy and matter might return to normal inthe following year. In a less resilient ecosystem, the flows of energy andmatter might not return to their pre-drought conditions for many years.
An ecosystem’s resilience often depends on specific interactions of thebiogeochemical and hydrologic cycles. For example, in response toanthropogenic increases in global atmospheric CO2 concentrations, there has
been an increase in carbon uptake in terrestrial and aquatic ecosystems. Thecarbon cycle as a whole can thus mitigate some of the changes that wemight expect from increases in atmospheric CO2 concentrations, including
global climate change. Conversely, when a drought occurs, the soil may dryout and harden so much that when it eventually does rain, the soil cannotabsorb as much water as it did before the drought. This change in the soilleads to further drying and an intensification of the drought damage. In thiscase, the hydrologic cycle does not relieve the effects of the drought;instead, a positive feedback in the system makes the situation worse.
Many anthropogenic disturbances—for example, housing developments,clear-cutting, or draining of wetlands—are so large that they eliminate anentire ecosystem. In some cases, however, scientists can work to reversethese effects and restore much of the original function of the ecosystem(FIGURE 3.18). Growing interest in restoring damaged ecosystems has ledto the creation of a new scientific discipline called restoration ecology.Restoration ecologists are currently working on two high-profile ecosystemrestoration projects, in the Florida Everglades and in the Chesapeake Bay, torestore water flows and nutrient inputs that are closer to historic levels sothat the functions of these ecosystems can be restored.
Printed Page 75
[Notes/Highlighting]

Chapter 3
10/3/12 9:33 PMeBook Page
Page 1 of 1http://ebooks.bfwpub.com/friedlandapes/sections/3_4_3.html?319
Figure 3.19 Intermediate disturbance hypothesis. Species diversity is highest at intermediate levels ofdisturbance. Rare disturbances favor the best competitors,which outcompete other species. Frequent disturbanceseliminate most species except those that have evolved tolive under such conditions. At intermediate levels ofdisturbance, species from both extremes can persist.
Previous Section | Next Section
3.4.3 The Intermediate Disturbance Hypothesis
We have seen that not all disturbance is bad. Infact, some level of ecosystem disturbance isnatural, and may even be necessary for themaintenance of species diversity. Theintermediate disturbance hypothesis statesthat ecosystems experiencing intermediate levelsof disturbance are more diverse than those withhigh or low disturbance levels. The graph inFIGURE 3.19 illustrates this relationship betweenecosystem disturbance and species diversity.Ecosystems in which disturbances are rareexperience intense competition among species.Because of this, populations of only a few highlycompetitive species eventually dominate theecosystem. In places where disturbances arefrequent, population growth rates must be highenough to counter the effects of frequentdisturbance and prevent species extinction.Research shows that when disturbances occur atsome intermediate frequency, the populations ofmajor competitors never reach a size at whichthey can dominate an ecosystem, and populationsof other species are never driven too close to zero.As a result, we expect to see the highest diversityof species in ecosystems that experience an intermediate frequency ofdisturbance.
CHECKPOINT
Why is Hubbard Brook valuable as a study area? What does it teachus?
What is the difference between resistance and resilience in anecosystem?
What is the intermediate disturbance hypothesis?
Printed Page 76
[Notes/Highlighting]
Chapter 3
10/3/12 9:33 PMeBook Page
Page 1 of 1http://ebooks.bfwpub.com/friedlandapes/sections/3_5.html?320
Previous Section | Next Section
3.5 Ecosystems provide valuable services
Humans rely on only a small number of the millions of species on Earth forour essential needs. Why should we care about the millions of other speciesin the world? What is the value in protecting biodiversity?
The answer may lie in the type of value a species has for humans. A speciesmay have instrumental value, meaning that it has worth as an instrumentor tool that can be used to accomplish a goal. Instrumental values, whichinclude the value of items such as lumber and pharmaceutical drugs, can bethought of in terms of how much economic benefit a species bestows.Alternatively, a species may have intrinsic value, meaning that it has worthindependent of any benefit it may provide to humans. Intrinsic values includethe moral value of an animal’s life; they cannot be quantified.
Printed Page 77
[Notes/Highlighting]
Chapter 3
10/3/12 9:33 PMeBook Page
Page 1 of 5http://ebooks.bfwpub.com/friedlandapes/sections/3_5_1.html?321
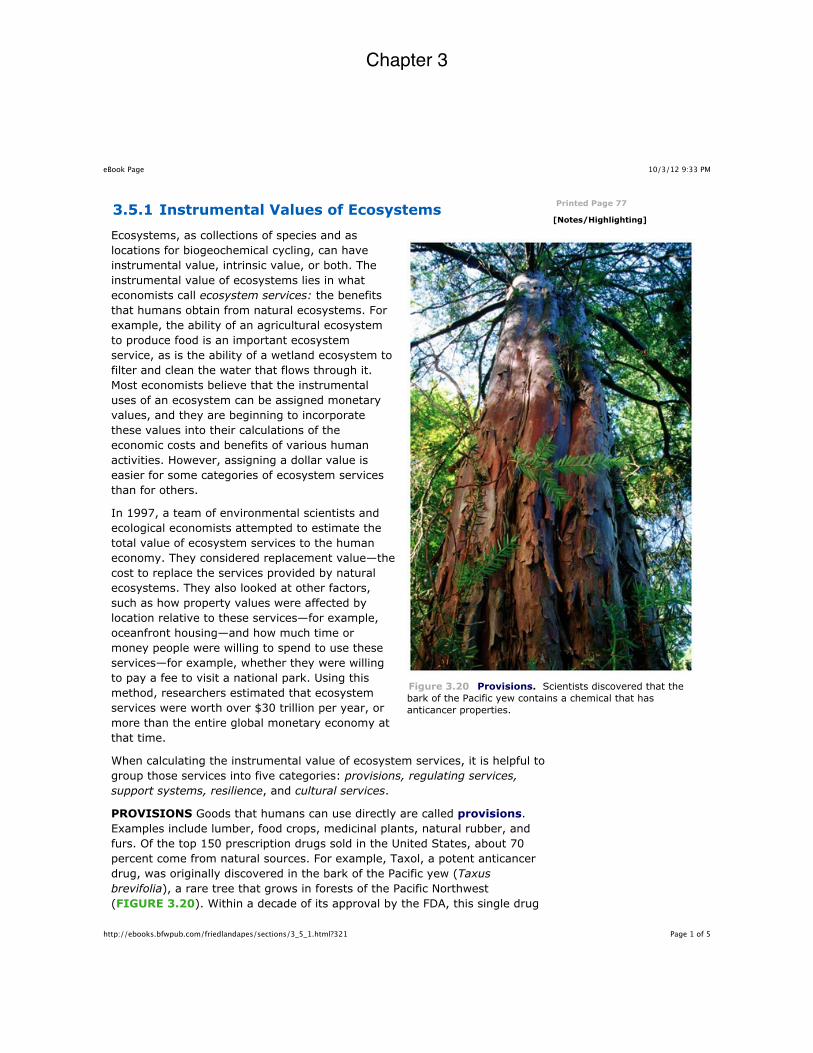
Figure 3.20 Provisions. Scientists discovered that thebark of the Pacific yew contains a chemical that hasanticancer properties.
3.5.1 Instrumental Values of Ecosystems
Ecosystems, as collections of species and aslocations for biogeochemical cycling, can haveinstrumental value, intrinsic value, or both. Theinstrumental value of ecosystems lies in whateconomists call ecosystem services: the benefitsthat humans obtain from natural ecosystems. Forexample, the ability of an agricultural ecosystemto produce food is an important ecosystemservice, as is the ability of a wetland ecosystem tofilter and clean the water that flows through it.Most economists believe that the instrumentaluses of an ecosystem can be assigned monetaryvalues, and they are beginning to incorporatethese values into their calculations of theeconomic costs and benefits of various humanactivities. However, assigning a dollar value iseasier for some categories of ecosystem servicesthan for others.
In 1997, a team of environmental scientists andecological economists attempted to estimate thetotal value of ecosystem services to the humaneconomy. They considered replacement value—thecost to replace the services provided by naturalecosystems. They also looked at other factors,such as how property values were affected bylocation relative to these services—for example,oceanfront housing—and how much time ormoney people were willing to spend to use theseservices—for example, whether they were willingto pay a fee to visit a national park. Using thismethod, researchers estimated that ecosystemservices were worth over $30 trillion per year, ormore than the entire global monetary economy atthat time.
When calculating the instrumental value of ecosystem services, it is helpful togroup those services into five categories: provisions, regulating services,support systems, resilience, and cultural services.
PROVISIONS Goods that humans can use directly are called provisions.Examples include lumber, food crops, medicinal plants, natural rubber, andfurs. Of the top 150 prescription drugs sold in the United States, about 70percent come from natural sources. For example, Taxol, a potent anticancerdrug, was originally discovered in the bark of the Pacific yew (Taxusbrevifolia), a rare tree that grows in forests of the Pacific Northwest(FIGURE 3.20). Within a decade of its approval by the FDA, this single drug
Printed Page 77
[Notes/Highlighting]

Chapter 3
10/3/12 9:33 PMeBook Page
Page 1 of 5http://ebooks.bfwpub.com/friedlandapes/sections/3_5_2.html?322
F
3.5.2 Intrinsic Values of Ecosystems
Many people believe that ecosystems not only have instrumental value, butalso have intrinsic value—that is, that they are valuable independent of anybenefit to humans. These beliefs may grow out of religious or philosophicalconvictions. People who believe that ecosystems are inherently valuable mayargue that we have a moral obligation to preserve them. They may equatethe obligation of protecting ecosystems with our responsibility toward peopleor animals who might need our help to survive. People who argue thatecosystems have intrinsic value do not necessarily deny that ecosystems alsohave instrumental value. Rather, they believe that environmental policy andthe protection of ecosystems should be driven by this intrinsic value.
CHECKPOINT
What factors go into calculating the instrumental value of anecosystem?
What are the five categories of ecosystem services?
How do the instrumental and intrinsic values of ecosystems differ?
WORKING TOWARD SUSTAINABILITY
Can We Make Golf GreensGreener?
or a game that is played outdoors on open green courses designedaround the contours of the natural landscape, golf has a surprisinglybleak environmental reputation. Golf courses are highly managedecosystems that cover over 3 million hectares (7.5 million acres)
worldwide—an area about the size of Belgium. About two-thirds of this areaconsists of closely mowed turfgrass. Closely mowed grass has short leavesthat cannot gain enough energy from photosynthesis to grow deep roots.This causes a host of problems: The grass dries out easily and has difficultyobtaining soil nutrients. As a result, the grass is susceptible to challengesfrom weeds, grubs that feed on grass roots, and fungal diseases that canweaken or kill the grass. Collectively, these are rather formidable challengesthat are faced by golf course managers worldwide.
To combat these challenges, golf courses use a disproportionate amount ofwater, fertilizer, and pesticides. Because humans expect to see green, well-manicured golf courses no matter where in the world they are located, golfcourses collectively use 9.5 billion liters (2.5 billion gallons) of water annuallyto keep their grasses green. Much of this water is used in regions wherewater is already scarce. In addition, providing the grass with sufficient
Printed Page 80
[Notes/Highlighting]

Chapter 3
10/3/12 9:34 PMeBook Page
Page 1 of 2http://ebooks.bfwpub.com/friedlandapes/sections/3_7.html?324
FREE-RESPONSE QUESTIONS
1. Nitrogen is crucial for sustaining life in both terrestrial and aquaticecosystems.
(a) Draw a fully labeled diagram of the nitrogen cycle. (4 points)
(b) Describe the following steps in the nitrogen cycle:
(i) Nitrogen fixation (1 point)
(ii) Ammonification (1 point)
(iii) Nitrification (1 point)
(iv) Denitrification (1 point)
(c) Describe one reason why nitrogen is crucial for sustaining life onEarth. (1 point)
(d) Describe one way that the nitrogen cycle can be disrupted by humanactivities. (1 point)
[Answer Field]
2. Read the following article written for a local newspaper and answer thequestions below.
Neighbors Voice Opposition to ProposedClear-Cut
A heated discussion took place last night at the monthly meeting of theFremont Zoning Board. Local landowner Julia Taylor has filed a request thather 150-acre woodland area be rezoned from residential to multi-use in orderto allow her to remove all of the timber from the site.
“This is my land, and I should be able to use it as I see fit,” explained Ms.Taylor. “In due course, all of the trees will return and everything will go backto the same as it is now. The birds and the squirrels will still be there in thefuture. I have to sell the timber because I need the extra revenue tosupplement my retirement as I am on a fixed income. I don’t see what all thefuss is about,” she commented.
A group of owners of adjacent properties see things very differently. Theirspokesperson, Ethan Jared, argued against granting a change in the currentzoning. “Ms. Taylor has allowed the community to use these woods for manyyears, and we thank her for that. But I hope that the local children will beable to hike and explore the woods with their children as I have done withmine. Removing the trees in a clear-cut will damage our community in manyways, and it could lead to contamination of the groundwater and streams and
Printed Page 84
[Notes/Highlighting]

Chapter 3