chapter 3 3.1 materials -...
TRANSCRIPT


Chapter 3 MATERIALS AND M ETH O D S
3.1 M ATERIALS AND EQUIPM EN TS
Table 3.1 Ingredients o f form ulation
Name o f Isigredieiits
Active Pharmaceutical Ingredient (API) 0610656/000039
Mycophenolic Acid (Impurity) 017623/324
Ac-di-sol T418C
Povidone K-90
MC.C PH 102
3395922400
5448C
MCC PH 102
Magnessium stearate
Starch 1500
Hydroxy Propyl Cellulose (Klucel LF)
Anhydrous lactose (DCL-21)
Sodium starch glycolate (Glycolys)
Magnesium stearate (Hyqual)
P205815360
A05682
10326638
E-0912
CO-1608
Biocon Ltd.
Biocon Ltd.
D M V , USA
Jubilant Organosys
Aqualon Hercules
Aqualon Hercules
M SU M b^dtT uSA
Colorcon, Indianapolis USA
Aqualon Hercules
D M V , USA
Rotique
S l i i i d a 'o d t J J S A
D epartm ent of Pharmaceutical Chemistry Page 52

C h a p t e r 3 MATERIALS AND METHODS
Table 3.2 Chemicals used along with flieir source
Nam e of C hem kais
Anhydrous acetate
Sodium Hydroxide__ __________
Potassium dihydrogen phosphate
Distilled Water / Milli-Q Water
Hydrochloric Acid
Acetic acid
Triethyiamine (TEA)
Orthophosphoric acid (OPA)
Sodium acetate
Acetonitrile (HPLC grade)
Methanol (HPLC grade)
Hydrogen peroxide
Source
Qualigens, Mumbai (India)
Thomas Baker, Mumbai
Qualigens, Mumbai (India)
In - house
Qualigens, Mumbai (India)
Qualigens, Mumbai (India)
Qualigens, Mumbai (India)
Qualigens, Mumbai (India)
Qualigens, Mumbai (India)
Merck, Mumbai (India)
Merck, Mumbai (India)
Ranbaxy, fine chemicals Ltd.
D epartm ent of Pharmaceutical Chemistry Page 53

Chapter 3 MATERIALS AND METHODS
Table 3.3 Equipmemts/Instmmeiits used
HPLC Systems
PDA detector
Autotitrator
Dissolution Apparatus
Dissolution Apparatus
UV-Visible Spectrophotometer
UV-Visible Spectrophotometer
Digital Moisture Analyzer
Electronic Weighing Balance
pH Meter
Magnetic Stirrer
Oven
Sieves (ASTM standard)
Sonicator
IR
IR
PSD Apparatus
Photo stability chamber
NMR
Waters 2695 , separation module
Shimazdu 2816
w i ' i i T i i i ?
Orion 940, Thermo Electron Corporation
Electrolab, TDT-08L, USP
Distek Dissolution System, 2100C, USA
Perkin Elmer, Lambda 35,USA
Mettler Toledo HB43, Switzerland,
Mettler Toledo AB204-S, Switzerland
Thermo Electron Corporation, USA
Deepali Udyog, India
Narang Scientific Works, India
Jayant Test Sieves (Jayant Scientific, India)
Bandelin, GERMANY
Nicolet Avatar 370DTGS, Thermo Electron
Corporation
WIN-IR spectrophotometer
Mastersizer 2000, Malvern Instruments
Thermolab, India
Bruker (300MHz) spectrometer
D epartm ent of Pharmaceutical Chemistry Page 54

Chapter£_^^^^ __________ __ _ MATERIALS AND METHODS
3.2 Pliysicocliemical C haracterization
3.2.1 A ppearance; [mniunosiippressant MMF is a White to off-White crystalline powder
Flow Properties of the M M F
3.2.2.a Angle of repose
Angle o f repose o f granules was determined by Funnel method, The accurately weighed
granules were taken in a funnel. The height of the funnel was adjusted in such a way that
the tip o f the funnel just touches the apex o f the heap of the granules. The granules were
allowed to flow through the funnel freely onto the surface. The diameter the powder cone
was measured and angle of repose was calculated using the following equation:
tan 0 = h/r
Where, h and r are the height and radius o f the powder cone,
3.2.2.b Bulk Density
M ethod
27.29 grams of the MMF was introduced in a 100 ml graduated cylinder. Powder level
was noted without compacting. Bulk density was calculated using the following equation
Bulk density = (M)/ Vn
Where, M = Mass o f test sample
Vo = Unsettled apparent volume
3.2.2.C T apped Density
M ethod
27.29 grams o f the MMF was introduced in a 100 ml graduated cylinder. Mechanically
the cylinder was tapped using the tapped density apparatus by raising the cylinder and
D epartm ent of Pharmaceutical Chemistry Page 55

Chapter 3 MATERIALS AND METHODS
allowing it to drop under its own weight tliat provides a fixed drop of I4±2 mm at a
normal rate of 250 drops per minute. The cylinder was tapped 500,750,1250 times
initially and measured the tapped volumes. Tapped density was calculated using the
following equation-
Tapped density = (M)/ Vf
Where, M = Mass of test sample
Vf= Final tapped volume
Because the interparticulate interaction that influence the bulking properties o f a powder
are also the interactions that interfere with powder flow, a comparison o f the bulk and
tapped densities can give a measure of the relative importance of these interactions in a
given powder. Such a comparison is often used as an index o f ability of the flow of
powder.
■r-r(s.
Fig 3.1 Apparatus For Measurement of Bulk and Tapped Density
3.2.2.d Powder Compressibility
The Compressibility Index and Hausner Ratio are measures o f the porosity of a powder to
be compressed. They measure the relative importance o f interparticuiate interactions. For
poorer flowing materials, there are frequently greater interparticuiate interactions and a
Departm ent of Pharmaceutical Chemistry Page 56

greater ditference between the bulk and tapped densities. These differences are reflected
in the Compressibility hidex and Haiisner Ratio. Tliey are calculated by the following
equation. Percentage compressibility o f the granules was determined by C arr’s
compressibility Index (Aulton, 1998).
Com pressibility Index (C a rr’s Index):-
(Tapped density - Poured density)
Cl = ---------------------------------— -------- X 100
Tapped density
H m m e r Ratio (HR):-
Chapter 3 ^ __________________________MATERIALS AND METHODS
HR =
Tapped density
Poured density
3.2.2.e Particle Size Analysis By Sieve Shaker
Tare each test sieve to the nearest 0.1 g. Place an accurately weighed quantity o f test
specimen on the top (coarsest) sieve, and replace the lid. Agitate the nest o f sieves for 5
minutes. Then carefully remove each from the nest without loss o f material. Reweigh
each sieve, and determine the weight o f material on each sieve. Determine the weight o f
material in the collecting pan in a similar manner, Reassemble the nest o f sieves, and
agitate for 5 minutes. Remove and weigh each sieve as previously described. Repeat these
steps until the endpoint criteria are met. Upon completion o f the analysis, reconcile the
D epartm ent of Pharmaceutical Chemistry Page57

weights o f material. Total losses must not exceed 5% o f the weight of the original test
specimen.
Endpoint D eterm ination~The test sieving analysis is complete when the weight on any
o f the test sieves does not change by more than 5% or 0.1 g (10% in the case o f 76-mm
sieves) o f the previous weight on that sieve. If less than 5% of the total specimen weight
is present on a given sieve, the endpoint for that sieve is increased to a weight change of
not more than 20% of the previous weight on that sieve.
If more than 50% of the total specimen weight is found on any one sieve, unless this is
indicated in the monograph, the test should be repeated, but with the addition to the sieve
nest of a more coarse sieve, intermediate between that canying the excessive weight and
the next coarsest sieve in the original nest, i.e., addition o f the ISO series sieve omitted
from the nest of sieves,
3.3 Ideiitltlcatioii of the M M F
3.3,1 By U,V. Spectral Analysis
A. Preparation of Different Buffers
L P repara tion of 0.1 N HCl (IP)
Hydrochloric acid (8.5 mi) was added to 200 ml of distilled water and volume was made
up to the 1000 ml with distilled water.
2. Preparation of 4,5 N Acetate Buffer
Anhydrous acetate (1.6g) and acetic acid (1.8ml) was added to200 ml o f distilled water
and volume was made up to the 1000 ml with distilled water.
3, Preparation of 6.8 N Phosphate Buffer
Potassium hydrogen phosphate (6,8g) and sodium hydroxide (0.89g) added to200 ml o f
distilled water and volume was made up to the 1000 ml with distilled water,
C h a p t e r 3 ^ _____ M ATERIALS AND ME^TIODS
D epartm ent of Pharmaceutical Chemistry Page 58

^ MATERIALS AND METHODS
B. A bsorbance Spectra of the M M F
L P rocedure for A bsorption S pectra of M M F in OdN H C l
The stock solution was prepared by dissolving the drug (98.4mg) in sufficient amount of
water in 1000 ml o f the volumetric flask, sonicated it for 15 minutes and thereby making
up the volume to 1000ml with water. The stock solution prepared thus was o f the strength
98.4mcg/ml. 5 ml o f the stock solution was diluted to 50 ml with water (strength o f 9.9
mcg/ml) and the absorbance spectrum was obtained using UV spectrophotometer in the
region 200-400 nm.
II. Procedure for A bsorption Spcctra of M M F in pH 4,5 A cetate B uffer
The stock solution was prepared by dissolving the drug (99.2mg) in sufficient amount of
water in 1000 ml o f the volumetric flask, sonicated it for 15 minutes and thereby making
up the volume to 1000ml with water. The stock solution prepared thus was o f the strength
99.2mcg/ml. 5 ml o f the stock solution was diluted to 50 ml with water (strength o f 9.92
mcg/ml) and the absorbance spectrum was obtained using UV spectrophotometer in the
region 200- 400 nm.
III. Procedure for A bsorption Spectra of M M F in pH 6.8 P hosphate Buffer
The stock solution was prepared by dissolving the drug (99mg) in sufficient amount o f
water in 1000 ml o f the volumetric flask, sonicated it for 15 minutes and thereby making
up the volume to 1000ml with water, The stock solution prepared thus was of the strength
99 mcg/ml. 5 ml o f the stock solution was diluted to 50 mi with water (strength o f
9.9mcg/ml) and the absorbance spectra was obtained using UV spectrophotometer.
IV. P rocedure for Absorption Spectra of MMF in DM w ater
The stock solution was prepared by dissolving the drug (99.5mg) in sufficient amount o f
water in 1000 ml o f the volumetric flask, sonicated it for 15 minutes and thereby making
D epartm ent of Pharmaceutical Chemistry Page 59

up the voh,ime to 1000ml with water. The stock solution prepared thus was o f the strength
99.5mcg/ml, 3 ml of the stock solution was diluted to 50 ml with water (strength of
5,97mcg/ml) and the absorbance spectrum was obtained using UV spectrophotometer.
C. S tan d ard Plots of the M M F
I. P rocedure for S tandard Plot of M M F in O.IN HCl
The stock solution (98.4mcg/mi) was diluted to obtain the concentrations o f 2, 4, 6, 8 and
10 mcg/ml and absorbance was taken using UV spectrophotometer and the calibration
curve was plotted as a function of absorbance v/s concentration
II. P rocedure for S tandard Plot of M M F in pH 4.5 A cetate Buffer
The stock solution (99,2mcg/ml) was diluted to obtain the concentrations o f 2 ,4 , 6, 8 and
10 mcg/ml and absorbance was taken using UV spectrophotometer and the calibration
curve was plotted as a function of absorbance v/s concentration
III. P rocedure for S tandard P lot of M M F In pH 6.8 Phosphate Buffer
The stock solution (99mcg/ml) was diluted to obtain the concentrations o f 2, 4, 6, 8 and
10 mcg/ml and absorbance was taken using UV spectrophotometer and the calibration
curve was plotted as a function o f absorbance v/s concentration.
33 .2 Infrared Spectral Analysis
Infrared spectroscopy o f the MMF was studied for identification purpose. Nicolet Avatar
370DTGS infrared spectroscope was used for this purpose.
M ethod: Approximately 2 g o f the MMF was triturated with 400 mg of finely powdered
and dried potassium bromide. These quantities are usually sufficient to give a disc 10-15
mm diameter and a spectrum of suitable intensity. The mixture was carefully grinded,
spread uniformly in a suitable die and submitted to a pressure o f about 800 M Pa (8 tcm '
). A background scan was performed sing KBr disc without the MMF and then the scan
Chapter 3 MATERIALS A W METHODS
D epartm ent of Pharmaceutical Chemistry Page 60

for KBr disc containing the MMF in the range of 4000~400cm'' was performed, Similarly
the scan o f EP reference standard was done,
3.3.3 NMM Analysis
As part o f our ongoing research program on API characterization we have been involved
in the characterization o f Mycophenolic acid and its derivative like mycophenolate
mofetil (MMF). These compounds are used as immunosuppressant drug in various organ
transplant surgeries.
M ethod
The API for study procured from Biocon ltd. Bangalore, The 'H-NMR, '-^C-NMR,
HMQC and HMBC spectra were recorded on Bruker DPX 300 MHz spectrometer using
DMSO-df, as a NMR solvent, TMS was used as internal standard and chemical shifts
reported in parts per million (ppm).
3.4 Com patibility Studies O f The M M F W ith V arious Excipients
3.4.1 Physical Com patibility Study
A physical compatibility study was designed to determine the interaction o f the drug with
various excipients. The samples i.e. drug alone, Excipients alone and homogeneous
mixture o f drug and each excipient were kept at accelerated conditions of 60°C in sealed
glass vials, and 40°C/75% RH in open glass vials (punctured to enable exposure to RH
conditions for four weeks). These samples were then periodically examined against a
control sample kept at 4°C.
Control (2-8°C) ; ~ Sealed vials
40°C, 75% RH (open) open vials
40°C, 75% RH (Close) Sealed vials
60“C (open) open vials
60°C (Close) Sealed vials
Chapter 3 MATERIALS AND METFIODS
D epartm en to f Pharmaceutical Chemistry Page 61
The ratio for physical mixture o f drug and the excipients was selected based on the
probable concentration o f the excipients in the capsule formulation.
3,5 Forniuiatioii Developm ent
From the literature and from the patent search and from the cosTipatibility studies o f the
excipients the most favorable excipients were short-listed. All the excipients chosen are
well known for their suitability and fitness of purpose. Each excipient is controlled by
pharmacopial specification and are the same or similar to those used in the reference
innovators product. The object o f the development programme was to produce a generic
capsule having pre-determined characteristics using design o f experiments. The final list
of excipients to be used with their probable functions is in Table 4.4
Excipients used in the Capsules are given below with their possible functions
Chapter 3 MATERIALS AND METHODS
D epartm en to f Pharmaceutical Chemistry Page 62

C h a p te r 3 MATERIALS AND METHODS
Table 3.4 Prototype formula for the of the M M F
3.5.1 Selection of Average W eight
Based on market product (Avg. weight o f reference product is 300mg with streggth 250
mg), we decided to keep the average weight o f our product similar as o f the reference
product that is 303 mg.
Department of Pharmaceutical Chemistry Page 63

Chapter 3 MATERIALS AND METHODS
Table 3.5 Average weight of capsules
S trength (mg)
W eight (mg)
Innovator In-house
250 300 303
3.5.2 P reparation of capsules
Capsules were prepared using wet granulation method according to the design matrix
obtained from the design expert software for three variables. All 17 batches were
prepared and analyzed for the chosen responses. Table gives the composition o f the three
variables in all the batches prepared.
D epartm ent of Pharmaceutical Chemistry Page 64

Chapter 3 MATERIALS AND METHODS
Table 3.6 Niiinerlcal value o f th ree factors iii cen tral com posite eKperinienta! design
as obtained wsieg design expert softw are 7 .13
Factor 1 Factor 2 F actor 3
Std Run A:Povidone-K90 B;M CC PH-105 Ac-di-sol
14 1 1.00 10.00 1.00
4 2 1.50 15.00 1.00
1 3 0.50 5.00 1.00
13 4 1.00 10,00 1.00
11 5 1.00 5.00_ _ _ _
5 6 0.50 — =1 10.00 0.50
7 0.50 10.00 T 5 r ~ ~ ~
17 8 1.00 10.00 1.00
T 5 ~ “ 9 1.00 10.00 1.00
6 10 1.50 10.00
2 11 1.50 5.00 1.00
12 12 1.00 15.00 1,50
16 13 1.00 10.00 1.00
9 14 1.00 5.00 0.50
3 15 0.50 15.00 1.00
8 16 1.50 10.00 1.50
10 17 1.00 15.00
D epartm ent of Pharmaceutical Chemistry Page 65
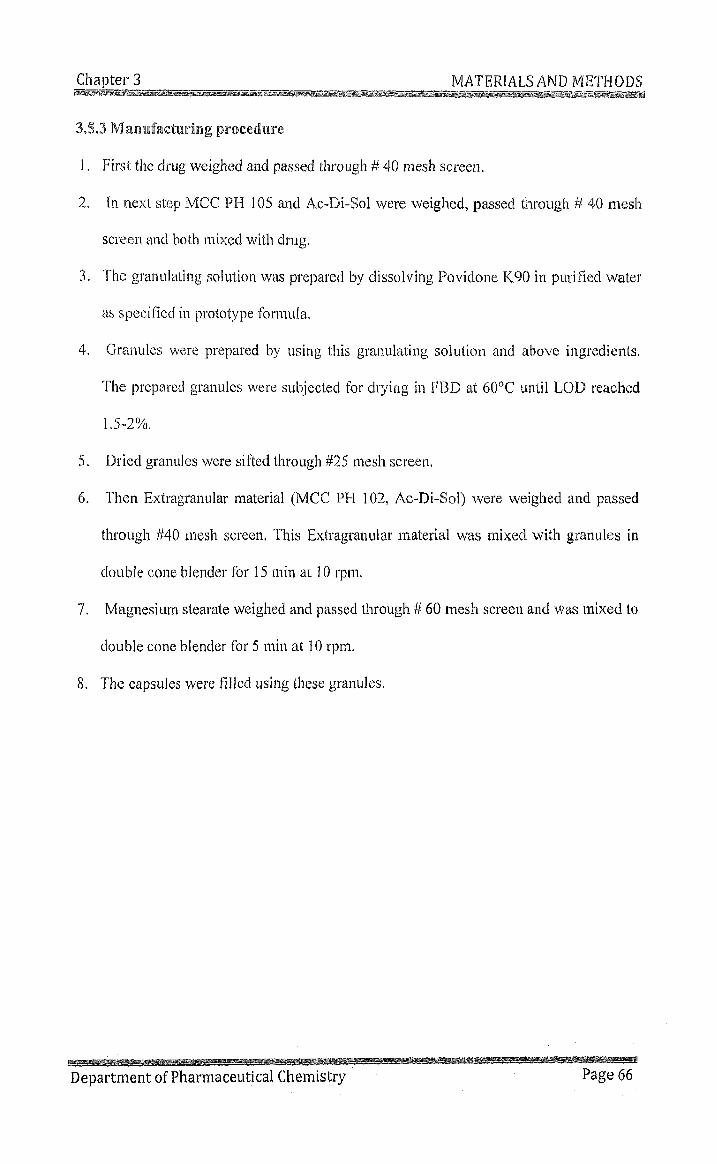
3 .53 M anufacturing procedure
1. First the drug weighed and passed through # 40 mesh screen.
2. In next step MCC PH 105 and Ac-Di-Sol were weighed, passed through # 40 mesh
screen and both mixed with drug,
3. The granulating solution was prepared liy dissolving Povidone K90 in purified water
as specified in prototype formula,
4. Granules were prepared by using this granulating solution and above ingredients,
The prepared granules were subjected for drying in FBD at 60°C until LOD reached
1,5-2%.
5. Dried granules were sifted through #25 mesh screen.
6. Then Extragranular material (MCC PH 102, Ac-Di~Sol) were weighed and passed
through #40 mesh screen, This Extragranular material was mixed with granules in
double cone blender for 15 min at 10 rpm.
7. Magnesium stearate weighed and passed through # 60 mesh screen and was mixed to
double cone blender for 5 min at 10 rpm.
8. The capsules were filled using these granules,
C h ap te rs MATERIALS^yp METHODS
D epartm ent of Pharmaceutical Chemistry Page 66

Chapter 3 MATERIALS AND METHODS
Table 3.7 Processing variables th a t were kept constant d u rin g form ulation o f ail the
batches
S. No Processing variables C onstan t
1 Amount of DM water used for binder solution
(Povidone kl9)
75 ml
2 Mixing time of the ingredients 10 min„ „ _ __ „
3 Binder solution adding time 3 min
Drying temperature of the granulation Ir 60° C
6 Loss on drying o f the blend Not more than 2
Mixhig time of granules and Extragranular
material in double cone blender
IS min
Mixing time of magnesium stearate to the blend in
double cone blender
5 min
The granules were filled in to capsules to a un it fill weight o f 303 mg.
D epartm ent pf Pharmaceutical Chemistry Page 67

C hapter 3 MATERIALS AND METHODS
Fig 3.2 FLOW CHART OF WET GRANULATION PROCESS AND CAPSULE
FILLING
Welgli the raw materials
Granulate the above blend using aqueous binder solution of Povidone 1^90,
r
:.vt
Dry the wet granules at an inlet air temperature of 60 °C until % Loss on
drying achieved NMT 2,0%.
Sift above dried granules through # 25 mesh ASTM.
Sift extragranular material ( MCC PH102+Ac-Di-Sol)Throu|;h # 40 mesh
ASTM, Add it to the above sifted granules
Department of Pharmaceutical Chemistry Page 68

Chapter 3 MATERIALS AND METHODS
Blend for 15 minutes blender
Blending'.'
Magnesium Stearate USNF (Through # 40 mesh ASTM) Add it to the above blend
and blend for 5 minutes
3.5.4 Evaluation of the capsules of the M M F
a) W eight Variation
Twenty capsules o f each formulation were weighed individually and mean weight
and percentage relative standard deviation was calculated,
Six capsules of each formulation were also examined for their thickness using
sliding Vernier caliper and the mean thickness value was calculated.
b) D isintegration Time
Six capsules of each formulation were used to determine disintegration time. Water
was used as disintegration medium and temperature was maintained at 37±2°C.
c) Dissolution profile
Dissolution was performed on capsules (n=6) using USP apparatus 2 (Paddle) 100
rpm in 900 ml of 0.1 N HCl (pH =1.2) maintained at 37± 0.5° C. 10 ml o f the
samples were withdrawn, fdtered and 0.1 nil o f the sample is diluted upto 10 ml and
analyzed spectrophotometrically at 293 nm for Mycophenolate mofetil content.
Department of Pharmaceutical Chemistry Page 69

3,5.5 Stability of In-house product
Accelerated stability studies according to the ICH guidelines
The MMF was packed in HDPE bottle and kept in stability chamber maintained at 40° C
and 75 % Relative Humidity for 90 days. Samples were withdrawn at interval o f 0, 30, 60
and 90 days. The samples were analyzed for their drug content, DT, hardness and
dissolution in 0. IN HCl in USP I at 100 rpm, (As this is the official apparatus and media
in USFDA).
3.6 Dissolution M ethod Development
3.6.1 Introduction
Drug absorption from solid dosage forms after oral administration depends on the release
of the drug substance from the drug product, the dissolution or solubilization o f the drug
under physiological conditions, and the permeability across the gastrointestinal tract.
Because o f the critical nature of the first two of these steps, in vitro dissolution may be
relevant to the prediction of in vivo performance. Based on this general consideration, in
vitro dissolution tests for immediate release solid oral dosage forms are used to;
• Assess the lot-to-lot quality of a drug product;
® Assess the stability of the drug product;
® Ensure continuing product quality and performance after certain changes, such
as changes in the formulation, the manufacturing process, the site of
manufacture, and the scale-up of the manufacturing process; and
• Develop new formulations.
In formulation development, dissolution testing can aid in the selection o f excipients, help
optimize the manufacturing process, and enable formulation of the test product to match
the release of the reference product. Dissolution testing has emerged in the
pharmaceutical field as a very important tool to characterize drug product performance.
D epartm ent of Pharmaceutical Chemistry Page 70
Chapter 3 ^ MATERIALS AND METHODS

The dissolution test is an analytical technique that has undergone significant equipment
modifications and improvements spanning the last decade. Dissolution has become an
important and widely utilized test receiving more emphasis worldwide fi'om regulatory
authorities during the last 15 years. The significance o f a dissolution test is based on the
feet that for a drug to be absorbed and available to the systemic circulation, it must
previously be dissolved. Therefore, dissolution tests are used not only for quality control
of finished products, but also to assess several stages o f formulation development, for
screening and proper assessment o f dift'erent formulations. Basically, the dissolution test
makes it possible to assess the dissolution properties of the drug itself and thereby to
select the most appropriate excipients and to optimize proportions among them to
obtaining the desired drug release behavior.
Moreover, when an ‘in vitro/in vivo’ correlation is available, dissolution can be used as a
test to reflect the bioavailability o f a product in humans and therefore to determine the
actual bioequivalence of different products containing the same drug at the same dosage.
During a preformulation study, preliminary testing conditions are commonly elaborated
taking into consideration the state o f the art for dissolution testing. Different official
apparatus are available and, for each, Compendia, e.g., USP, BP, and EP, report detailed
specifications in both general chapters and individual monographs on solid oral dosage
forms.
Chapter 3 MATERIALS AND M F £ H O ^
D epartm ent of Pharmaceutical Chemistry Page 71

Chapter 3 MATERIALS AND METHODS
0
Qmntf mmrns
Cottspffefie® wf® QaMtlltms Sm lit Scak-VPA'm fimh
Appmvsi CMngm (SUPAG)
an Hsmmimttm (iC-MJ
t
ToMmmyGmiml Mamfeemring Varlsblm‘mmamt
“C«»(ffiasss»"e nyig
»8.!f ft Oi*teh« *«s*“Cmiaatksi ?ws* ofim n»iiam m /pt40iic im t it» m
f«oa£ffmts m ahwalhUllt^
m w m oD iS $ 0 L W i& M I » * I fo r s f^ s q t iM m e s
ST U D IE S i Mtqulmmmis •»
I «Blma!ma‘*w .
ftt - Is ViVo ComMlon (IWJC)
Sm ’Offste for In WVo Biudy
Fig 3 3 A pplications of in v itro dissolution studies
3.6.2 Selection of a suitable appara tus
The preferred apparatus for a capsule dosage form (Mycophenolate Mofetil) is by
paddle type (USP-II) as mentioned in USFDA guidance for dissolution o f generic
drugs.
3.6.3 Selection o f a suitable Dissolution M edia
0.1 N HCL was selected as the dissolution media as mentioned in USFDA guidance
for dissolution o f generic drugs.
3.6.4 Placebo In terference
Placebo o f the capsule formulation was analysed by UV spectrometer to see if it has
any interference on the UV absorbance of the MMF.
D epartm ent of Pharmaceutical Chemistry Page 72

Weighed amount of the placebo was taken and dissolved in 900 ml o f O.IN HCl and
sonicated for 15 min to facilitate maximum solubility o f the placebo in the dissolution
media. 2 ml o f this solution was pipetted out into a 50 ml volumetric flask and the
volume was made upto 50 mi with O.IN HCl. Absorbance o f this dilution was taken
by LIV spectrophotmeter at 293.0 nm.
3.6.5 F ilter V alidation
The effect o f filter interference in the UV analysis was done using the following filters:
® Wattmann filter paper
® 0.45 pm PVDF Filter
® 0,45 pm PTFE Filter
• 0.45 pm Nylon Filter
The placebo solution was passed through the above filters and their UV absorbance
taken at 250.0 nm.
3.7 Dissohitlon M ethod V alidation
Dissolution method is developed in O.IN HCL by UV Spectroscopy method. There are
different parameters which are used to validate this method.
3.7,1 Specificity and selectivity
Mycophenolate mofetil solutions (22 pg m f ') were prepared in both the selected media
along with and without common excipients (microcrystalline cellulose, magnesium
stearate, talc, HPMC, iron oxide red, titanium dioxide) separately. All the solutions
(included both dissolution mediums and placebo solution) were scanned from 400 to 200
nm at a speed of 400 nm min"' and checked for change in the absorbance at respective
wavelengths and any interference by dissolution mediums or placebo. In a separate study,
dmg concentration o f 22 pg ml~‘ was prepared independently from pure drug stock
Chapter 3_________________________________________ MATERIALS AND METHODS
D ep ar tm en to f Pharmaceutical Chemistry Page 73

MATERIALS AND MRTHOD_S
solution in selected media and analyzed (« = 6). The standard deviations were determined
in both cases.
3.7.2 A ccuracy
To determine the accuracy o f the proposed methods, different levels o f drug
concentrations-lower concentration (LC), intermediate concentration (IC) and higher
concentration (HC) (in both media) were prepared Irom independent stock solutions and
analyzed {n = 9), Accuracy was assessed as the standard deviation, percentage R.S.D. at
each level; overall standard deviation and overall % R.S.D. and compiled %recovery was
determined. To provide an additional support to the accuracy of the developed assay
method, standard addition method was employed, which involved the addition o f
different concentrations o f pure drug (5, 11, and 22 \xg ml”' in HCl medium and in the
acetate buffer medium) to a known pre-analyzed formulation sample and the total
concentration was determined using the proposed methods (n-9) [18]. The %recovery of
the added pure drug was calculated as, %recovery = [(Ct ~Cs)/Ca]xlOO, where Ct is the
total drug concentration measured after standard addition; Cs, drug concentration in the
formulation sample; Ca, drug concentradon added to formulation.
3.7.3 Precision
Repeatability was determined by using different levels o f drug concentrations (same
concentration levels taken in accuracy study), prepared from independent stock solutions
and analyzed («=6). Inter-day, intra-day and inter-instrument variation were studied to
determine intermediate precision of the proposed analytical methods. Different levels of
drug concentrations in triplicates were prepared three different times in a day and studied
for intra-day variation. Same procedure was followed for three different days to study
inter-day variation (n = 18). One set o f different levels o f the concentrations was re
analyzed using Shimadzu UV-2450 UV-vis spectrophotometer connected to computer
D ep ar tm en to f Pharmaceutical Chemistry Page 74

with UV-PC software, by proposed methods to study inter-instrument variation [n = 3),
The percent relative standard deviation (% R.S.D.) o f the predicted concentrations from
the regression equation was taken as precision.
3.7.4 L inearity
To establish linearity o f the proposed methods, five separate series o f solutions of
mycophenolate mofetil (10 - 30 (ig niL’' in O.IN hydrochloric acid and in acetate buffer
medium) were prepared from the stock solutions and analyzed. Least square regression
analysis was done for the obtained data. One-way ANOVA test was performed based on
the absorbance values, observed for each pure drug concentration during the replicate
measurement o f the standard solutions.
3.7.5 Eobustiiess
Robustness o f the proposed method was determined by (a) changing pH o f the m edia by
±0.1 units and (b) stability o f the mycophenolate mofetil in both the selected media at
room temperature for 24 h. Three different concentrations (LC, IC and HC) were
prepared in both the media with different pH and mean %recovery was determined.
3.8 Assay M ethod developm ent and validation
3.8.1 Reagents and solvents
Pure MMF was obtained as gift sample from Biocon Ltd., (Bangalore, India) and certified
to contain 99.7% (w/w) on dried basis. Acetonitrile was of HPLC grade & purchased
from SDFine- Chem limited (Mumbai, India) and all other chemicals and reagents used
were o f analytical grade and were purchased from Merk Ltd. (Worli, Mumbai, India).
Milli-Q (MA, USA) water is used for the preparation o f buffer. Triethylamine buffer
solution was prepared and filtered through 0.22ja, filter (Millipore, USA). Formulation of
MMF used for the study was MMF tablets (label claim; 500 mg/tablet), capsules (label
Chapter 3 ___ _________^ ^ .......... JVIAT£RIALSAND METHODS
D epartm ent of Pharmaceutical Chemistry Page 75

claim: 250 mg/capsiiles) and PLGA MMF nanoparticles (label claim: 10.2 mg/lOOmg of
PLGA nanoparticles) procured from Jamia
Hamdard, (New Delhi, India).
3.8.2 Iiistriiinentatioii and chroniatograpliic conditions
HPLC analysis was performed with Waters (Model 2695, Waters, USA). HPLC system
equipped with PDA detector. The chromatographic separation was performed using a
Zorbax Rx-C8 (250 mm X 4.6 mm), 5 j,im (Agilent Technologies, US), The mobile phase
consisting o f a mixture o f triethylamine buffer, pH o f which adjusted to 5.3 with diluted
Orthophosphoric acid and acetonitrile in the ratio o f 40:60 (%V/V) with the flow rate of
1.0 niL min-1 was employed. The detector wavelength was set at 250 nm (PDA detector
model waters 2996). The injection volume was 10 pL while column was maintained at
45°C,
3.8.3 C alibration curve o f M ycopiienolate niofetil
A sock solution o f MMF was prepared in diluent consisted mixture o f water and
acetonitrile in the ratio o f 20:80 (%V/V) at 5 mg mL"'. With proper dilution, standard
solutions were prepared in the concentration range 100- 600 |ig mL"'. Ten microlitres
from each standard solution was injected in the column in the above mentioned
chromatographic conditions (Section 2.2). Each concentration was injected six times in
the column. The data o f peak areas plotted against corresponding concentration were
treated by linear-square regression analysis.
3.8.4 M ethod V alidation
3.8.4.1 Specificity
The specificity o f the method was ascertained by performing interference studies. Six
injections o f standard solution (for system suitability), one injection o f diluents, one
injection o f placebo (equivalent to 200 mg mycophenolate mofetil) which has been
Chapter 3 ............ ............... MATERJALS AlW M EJJODS
D epartm ent of Pharmaceutical Chemistry Page 76

prepared as sample solution preparation, one injection of sample solution and three
injections of spiked sample solution which has been spiked with known impurity (MPA)
at 0.5% level has been injected in column and analyzed. Also the peak purity o f MMF
was assessed.
3,8.4.2 Precision
3.8.4.2.1 System precision
System precision o f the system was determined by injecting six replicates o f the standard
solution (injection volume, 10 },iL) and measurement carried out o f peak areas o f the main
peak. Data was treated to calculate % RSD.
3.8.4.2.2 M ethod precision
Method precision o f method w'as determined by injecting six replicates (injection volume,
10 pL) o f the sample soludon from single batch o f capsules individually and
measurement carried out o f peak areas o f the main peak. Data was treated to calculate %
RSD.
3.5.4.2.3 In term ediate precision
Intermediate precision o f method was determined by injecting six replicates (injection
volume, 10 pL) o f the sample solution from single batch of capsules individually as per
the method by a different analyst on different instrument using different column and on a
difYerent day. Measurements carried out of peak areas of the main peak. Data was treated
to calculate % RSD.
3.5.4.3 L inearity
Linearity of the method was studied in two replicate of each level in the range of 30% -
200% o f the standard concentration. A stock solution of 5000 ppm o f MMF standard was
prepared and diluted the stock standard solution for the preparation o f solution o f
different concentrations o f MMF i.e. 120 pg mL"', 160 jag mL"', 240 f g mL"', 320 |.Lg mL‘
Chapter 3 ................. .................. MATERIALS AND METHODS
D epartm ent of Pharmaceutical Chemistry Page 77

Q i a p t e r ^ ________________ _ _ MATERIAJ.S AND M jriiO D S
400 jig m l./', 480 p,g m L '', 560 j.ig rriL/’, 640 },ig n iL '’, 720 f.ig mL"' and 800 j-ig n iL '’, In
order to assess the linearity o f the method data were plotted in the form o f linearity curve
and slope, intercept and correlation coefficient o f the curve has been calculated.
3.8.4.4 A ccuracy
Accuracy studies were carried out by applying the method to placebo samples to which
known amount of MMF corresponding to 80, 100, 120 and 200% of the MMF label claim
had been added. At each level of the amount, samples prepared in triplicate and
determination was performed. Data was treated to calculate % R.S.D. at each level and
overall,
3.8.4.5 Robustness of the m ethod
Robustness was studied in six replicate at a concentration level o f 400 ppm. In this study,
five parameters (wavelength o f detection, column oven temperature, flow rate o f mobile
phase, pH o f buffer in the mobile phase and composition o f the mobile phase) were
investigated and the effects on the results were expressed as standard deviation and %
R.S.D. The wavelength of detection was varied by +5 nm (at 245 nm and 255 nm),
column oven temperature was varied by +5°C (at 40°C and 50°C).Tlie flow rate of mobile
phase and pH of the buffer in mobile phase were varied by +10% (at 0.9 mL m iif' and 1.1
mL min"') and +0.2 (at pH 5,1 and pH 5.5), respectively. In the mobile phase, the minor
component was varied by + 2% absolute or 10 % relative, whichever is less. Data were
treated to calculate % R.S.D. in each case,
3.8.4.6 L im it of detection and lim it of quantitation
In order to estimate the limit o f detection (LOD) and limit of quantitation (LOQ), single
injection o f blank and six injections o f standard solution at concentration level o f 400 |ig
mL’' were injected in column and system suitability was determined by determining %
R.S.D. o f six injections. Several lower concentrations o f MMF were prepared and
D epartm ent of Pharmaceutical Chemistry Page 78

Einalyzed six times for determination of LOD and LOQ based on % 11, S. D. The LOD
was expressed as 10% R, S, D. whereas LOQ was expressed as 33% R, S. D, o f six
injections.
3.S.4.7 Stability of analytical solution
In order to determiiie the stability o f the analytical solution, standard solution and sample
solution to be analyzed initially and at different time intervals at 25'’C for around 24 hours
and / or standard solution and sample solution to be analyzed initially and at different
time intervals at 5“C for around 24 hours. For that six injections o f standard solution v/ere
injected in column for the determination o f system suitability and one injection o f each
standard solution as well as sample solution were injected at different time intervals for
around 24 hours.
3.8.4.S Forced degradation studies
To perform the forced degradation studies first injected six injections o f standard solution
(for system suit). Then the sample solution and placebo solution were treated separately
in each condition as followed:
(a) Two milliliters o f IN HCl was added and mixture was heated at 70°C for 30 minutes
and neutralized by addition o f IN NaOH solution and 10 mL o f diluent. (Acid induced
degradation)
(b) One milliliters o f IN NaOH was added and mixture placed at room temperature for 5
minutes. (Base induced degradation)
(c) Two milliliters o f 30% w/v H2O2 was added and mixture was heated at 70°C for 15
minutes. (Hydrogen peroxide H2O 2 induced degradation)
(d) Tablets, capsules and nanoparticles o f MMF were placed in UV chamber at 6500
LUX for 15 days. (UV induced degradation)
C h a p te r s^ ^ MATERIALS AND METHODS
D epartm ent of Pharmaceutical Chemistry Page 79

(e) Tablets, capsules and nanoparticles o f MMF were placed in oven at 105°C for 15
days. (Thermal induced degradation) In all degradation studies, 10 |.iL o f the resultant
solutions were injected in column and chromatograms were run as described in section
2.2. The peak area o f each peak has been determined and peak purity determined in each
case. Data was treated to calculate the degradation in each case.
3.5.4.9 Analysis and stability testing of form ijlations
To determine the content o f MMF in commercial capsules (label claim; 500 mg/tablet and
250 mg/tablet) and in prepared PLGA-MMF~nanoparticles (label claim; 10.2 mg/lOOmg
of PLGA nanoparticles), the twenty tablets/capsules were weighed and their mean weight
determined. Powder (tablet/capsule) and nanoparticles equivalent to 4.0 mg o f MMF were
accurately weighed and transferred into a 10 mL volumetric flask, containing 5.0 mL o f
diluent ( mixture o f water ; acetonitrile, 20;80%v/v). To ensure complete extraction o f
drug, it was sonicated for 30 min and diluted to 10 mL with diluent. The resulting
solution was centrifuged at 2000 rpm for 10 min and supernatant was analyzed for drug
content. Ten microlitres of the filtered solution was injected into the chromatographic
conditions as mentioned in section 2.2. The analysis was repeated in three replicate and
the possibilities o f excipient interference in the analysis was studied. For stability studies,
prepared tablets, capsules and PLGA-MMF-nanoparticles (in closed high density
polyethylene containers) were stored at accelerated conditions (40°C/75%RH) and drug
content was analyzed after 1, 3, and 6 months,
3.8.4.10 System suitability
System suitability in each parameter o f validation has been determined and the
acceptance criteria for the system suit were as followed;
9 Tailing factor o f MMF peak from the standard solution should not be more than
2 ,0.
C h a p te rs ^ MATERIALS AND METHODS
D epartm ent of Pharmaceutical Chemistry Page 80
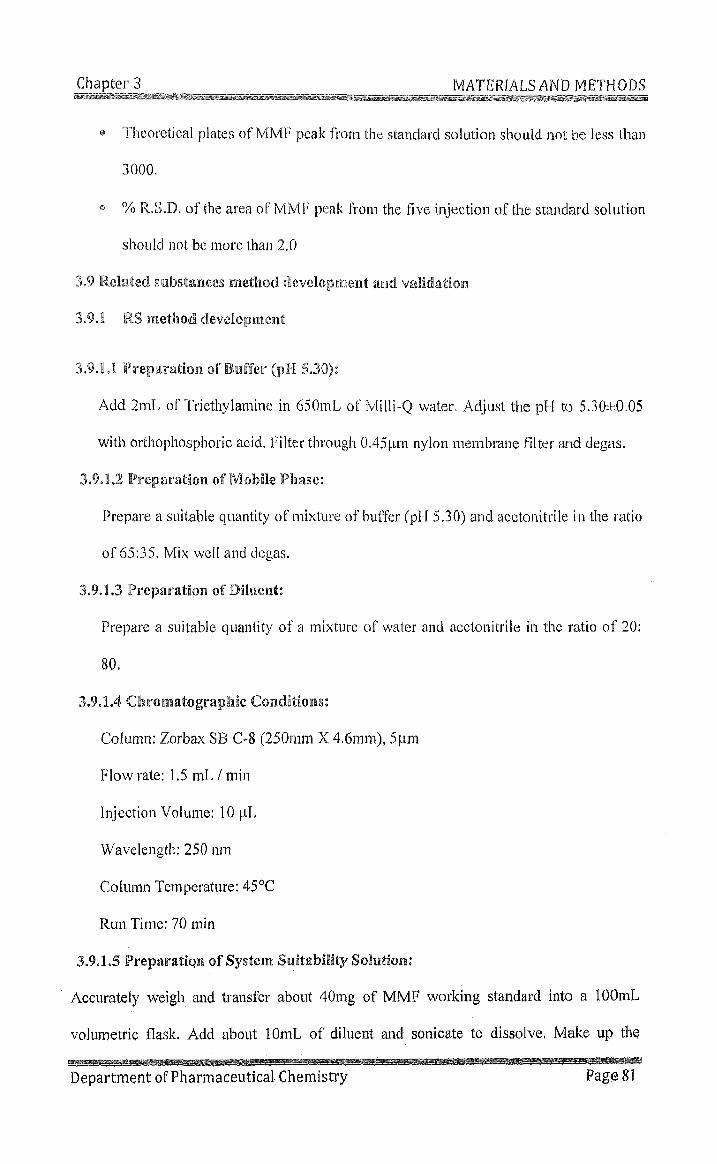
® Theoretical plates of MMF peak froiTi the standard solution should not be less than
3000.
® % R.S.D. o f the area of MMF peak from the five injection of the standard solution
should not be more than 2.0
3.9 Related siibstaiices method! developm ent and validation
3.9.1 RS nietliod developm ent
3.9.1.1 P reparation of Buffer (pH 5.30):
Add 2mL of Triethylamine in 650mL of Milli-Q water. Adjust the pH to 5.30i:0.05
with orthophosphoric acid. Filter through 0.45|.im nylon membrane filter and degas.
3.9.1.2 P reparation of M obile Phase:
Prepare a suitable quantity of mixture of buffer (pH 5.30) and acetonitrile in the ratio
o f 65:35. Mix well and degas.
3.9.1.3 Preparation of Diluent:
Prepare a suitable quantity of a mixture of water and acetonitrile in the ratio o f 20:
80.
3.9.1.4 C lirom atograpM c Conditions:
Column; Zorbax SB C-8 (250mm X 4.6mm), 5|am
Flow rate: 1.5 mL / min
Injection Volume: 10 |iL
Wavelength: 250 nm
Column Temperature: 45°C
Run Time: 70 min
3.9.1.5 Preparation of System Suitability Solution;
Accurately weigh and transfer about 40mg o f MMF working standard into a lOOmL
volumetric flask. Add about lOmL o f diluent and sonicate to dissolve. Make up the
Chapter 3 ^ ___ MATERIALS AND METHODS
D epartm ent of Pharmaceutical Chemistry Page 81

volume with diluent and mix. Dilute 5mL o f this solution to lOOmL with diluent and mix.
Filter through 0.45j,im nylon membrane filter.
3.9.1.6 P reparation of sam ple solution:
Determine the Average weight of not less than 10 capsules and crush them to a fine
powder. Accurately weigh and transfer powdered sample equivalent to about 200mg
of MMF into a lOOmL volumetric flask. Add about 60mL of diluent and sonicate for
about 30 min, with intermittent shaking. Make up the volume with diluent and mix.
Filter through 0.45(,im nylon membrane filter.
3.9.1.7 P repara tion of Placebo sotatloii:
Weigh and transfer the amount of placebo powder equivalent to 200mg of MMF into
a lOOmL volumetric flask. Add about 60mL of diluent and sonicate for 30 min. with
intermittent shaking. Make up the volume with diluent and mix. Filter through
0.45.Lim nylon membrane filter.
3.9.1.8 Evaluation of System Suitability:
Inject the standard solution into the chromatograph and record the chromatograms.
The system is suitable for analysis if and only if;
1. The tailing factor of MMF peak is not more than 2.0.
2. Column elficiency determined from MMF peak is not less than 7000 theoretical
plates.
3. The Relative standard deviation o f the area counts for six replicate in.jections o f
standard is not more than 5.0%,
Make necessary adjustments, i f needed, to meet the system suitability criteria.
3.9.1.9 Procedure:
Chapter3_ ______ MATERIALS AND_METHODS
D epartm ent of Pharmaceutical Chemistry Page 82

Chapter 3 MATERIALS AND METHODS
Inject the placebo and sample sohition into the chromatograph and record the
chromatograms. Disregard the peaks observed in the sample chromatogram, which
are observed at the same retention time in the placebo chromatogram. The retention
time o f MMF peak is about 21 min.
The relative retention time (RRT) o f Imp_Acid impurity is as follows:
Table 3.8 MRT of Im p A d d (MPA)
S. No. Name I RRT
1 MPA — i 0.27
2 MMF ] 1.00
3.9.1.10 Calculations;
The % o f Impurities can be calculated as given below:
1. Any Individual Known Impurity
(%w/w)
AT DS P A
= — - X — — X — X 100 X-----
AS DT 100 C
2. Any Individual Unknown Impurity
ATI DS P A
(%w/w) = -....... X ..........X — — X 100 X
AS DT 100 C
3. Total Impurity = (1+2)
D epartm ent of Pharmaceutical Chemistry Page 83

Where
AT = Area counts o f any individual known impurity pealc in the chromatogram o f the
sample solution.
ATI = Area counts o f any individual unknown impurity peak in the chromatogram of the
sample solution.
AS = Average area counts of ID peak in the chromatograms o f the standard solution as
obtained under system suitability.
DS = Dilution factor for standard solution.
DT = Dilution factor for sample solution.
C = Label claim of ID per tablet, in mg.
P = Percent potency of ID working standard, on as is basis.
A = Average weight of the tablet in mg.
Chapter 3 ______ _ __________________MATERIALS AND METHODS
D ep ar tm en to f Pharmaceutical Chemistry Page 84

Chapter 3 MATERIALS AND METHODS
3.9.2 RS method validation protocol and acceptance crlte iia ;-
3,9,2.1 Specificity
A. Interference Studies
Injection o f blank (diluent used in the method)
hijection o f placebo solution
Injection of sample solution
Analysis of sample spiked with known related
impurity (Imp Acid i,e MPA) at 0.5% level
A cceptance C riterion
There shall not be any peak from the
placebo solution at the RT o f MMF
and known impurity,
Peak purity o f MMF shall pass.
Peak purity o f MMF and spiked
impurity shall pass,
Sample preparation, in triplicate, and single
injection of specified degradation impurity (Imp
Acid) at sample concentration i,e.: 2000 (ig/ml
Note: If the peak saturates, the concentration shall
be adjusted, accordingly.
D epartm ent of Pharmaceutical Chemistry Page 85

Chapter 3 MATERIALS AND METHODS
B. Forced D egradation Studies
Preparation and analysis of sample and
placebo by treating with Hydrochloric acid
Preparation and analysis of sample and
placebo by treating with Sodium hydroxide
Preparation and analysis of sample and
placebo by treating with Hydrogen peroxide
Preparation and analysis of sample and
placebo by thermal degradation
Preparation and analysis of sample and
placebo by photolytic degradation
(Method Precision data can be taken as
control sample)
Note: I f at 1000 pg/nil, the peak saturates, the
concentration shall be adjusted, accordingly.
A cceptance C rite ria
Peak purity o f MMF shall pass
Note : D egradation N M T 30%
D epartm ent of Pharmaceutical Chemistry Page 86

Chapter 3 MATERIALS AND METHODS
3 3 2 2 Precision
A. System Precision
Experiineiit'
A cceptance C rite ria
Six replicate injections oi' standard solution % RSD shall not be more than 5.0
B. M ethod Precision
Experim ent A cceptance C rite ria
Preparation and analysis of one batch o f 500 % RSD should not be more than
mg / tablet strength, six times as per the 10.0 o f individual and total
method impurities
In case no known impurity is present or all
impurities are below LOQ in the sample,
method precision is to be demonstrated on the
sample spiked with Imp Acid (MPA) at 0.5%
level.
D epartm ent of Pharmaceutical Chemistry Page 87

Chapter 3 MATERIALS AND METHODS
C. Interm ediate Precision
Experiiiieiit
Preparation and analysis o f one batch (same
batch as used for Metliod precision) o f 250
mg / capsule strength, six times as per the
method by a different analyst on different
instrument using different column and on a
different day.
Individual and overall % RSD
should not be more than 10.0 of
individual and total impurities
3.9.23 L O D /L O Q
Experiment
Several lower concentration o f Imp Acid
(MPA) and MMF shall be prepared and
analyzed six times for the determination o f
LOD / LOQ based on % RSD
A cceptance C riteria
1. LOQ : % RSD should not be
more than 10
2. LOD : % RSD should not be
more than 33
D epartm ent of Pharmaceutical Chemistry Page 88

Chapter 3 MATERIALS AND METHODS
3.9.2.4 L m earity
Experim ent
Linearity o f Imp Acid (MPA) and MMF to be
performed in the range o f about LOQ - 120 %
of Specification level.
For MMF Linearity range - LOQ to 2,4 ng /
mL
For Imp Acid (specification limit - 0.50 %
w/w) Linearity range ■■ LOQ to 12 |ig / mL
Correlation coefficient should not
be less than 0.980
D epartm ent of Pharmaceutical Chemistry Page 89

Chapter 3 MATERIALS AND METHODS
3.9.2.S A ccuracy
Experim ent A cceptance C rite ria ~1
Placebo spiked with Imp Acid at LOQ level, in 1, % Recovery shall be in the
triplicate range o f 80 - 120.
Sample spiked with Imp Acid at about 50 % o f
specification level, in triplicate 2. Individual and overall % RSD
Sample spiked with Imp Acid at about 100 % o f % Recovery shall not be more
of specification level, in triplicate than 10.0
Sample spiked with Imp Acid at about 120 %
of specification level, in triplicate
(Mean o f Method Precision data can be
considered as Control)
D epartm ent of Pharmaceutical Chemistry Page 90

Chapter 3 MATERIALS AND METHODS
2321} Robiistness
A cceptance C rite ria
Standard solution to be prepared and analyzed under
each of the following variable conditions
Sample solution spiked with Imp Acid at 0.5% level
System suitability should
pass.
1. By changing the wavelength o f detection by +5 nm
(At 245 nm and 255 nm)
2. By changing the column oven temperature by +5"C
(At 40°C and 50°C)
3. By changing minor component of the mobile phase
by + 2% absolute or 10 % relative, whichever is less
4. By changing the flow rate by ±10% (At 1,35 ml/min
and 1.65 ml/min)
5. By changing the pH by +0.2 (At pH 5.1 and pH
5.5)
Note: RRT o f known impurity
shall be calculated in all the
variable conditions
D epartm ent of Pharmaceutical Chemistry Page 91

Chapter 3 MATERIALS AND METHODS
3.9.2.7 Stability of analytical solution
Sample solution spiked with Imp Acid at 0.5% level
to be analyzed initially and at different time
intervals at 25”C for around 24 hours
And/or
Sample solution spiked with Imp Acid at 0.5% level
to be analyzed initially and at different time
intervals at 5°C for around 24 hours
Acceptance C rite ria
Cumulative % RSD for each
impurity should not be more than
10.0
3,9.2.8 System Suitability
D epartm ent of Pharmaceutical Chemistry Page 92

3.10 H PTLC iiietliod for assay
3.10.1 P repara tion of C alibration S tandards and Q uality- C ontro l (Q C) Sam ples
A stock solution o f MMF was prepared by dissolving 200 mg MMF in 10 ml acetonitrile.
Working solutions containing from 1 to 12 mg m l'' were prepared by appropriate dilution
o f the stock solution with acetonitrile. Each working solution o f MMF (10 (.il) was used to
spike plasma (1 ml) to furnish calibration standards ranging from 10 to 120 f.ig m l'’. QC
sample solutions were prepared at concentrations o f 20, 60, and 100 )ug m l''. Each
solution was divided into 1.0 ml volumes which were immediately frozen at -20°C,
3.10.2 C hrom atography
Chromatography was performed on 20 cm x 10 cm aluminium plates coated with 200-pm
layers o f silica gel 60F254 (E. Merck, Germany). Samples were applied to the plates as 5
mm wide bands, 5 mm apart, by means of a Camag (Muttenz, Switzerland) Linomat V
sample applicator fitted with a 100 pL syringe, A constant rate o f application o f 150 nl s-
1 was used. Linear ascending development o f the plates to a
distance o f 80 mm was performed with triethylamine buffer (2 ml o f Triethyl amine was
added in 650 ml o f Milli-Q water. The pH o f the mixture was adjusted to 5.3 with
orthophosphoric acid. The buffer was filtered through 0.45 pm nylone membrane) and
acetonitrile, 20:80 (% v/v), as mobile phase in a 20 c m x 10 cm twin-trough glass
chamber(Camag), previously saturated with mobile phase vapor for 15 min at room
temperature (25 ± 2°C) and relative humidity 60 ± 5%. After development the dried
plates were scanned at 250 nm by means o f Camag TLC Scanner III in absorbance mode
operated by WinCATS software (Version 1.2.0). The source o f radiation was a deuterium
lamp emitting a continuous UV spectrum in the range 190-400 nm. The slit dimensions
were 5 mm x 0.45 ram and the scanning speed was 20 mm s'*.
Chapter 3 _________ MATERIALS AND METHODS
D epartm ent of Pharmaceutical Chemistry Page 93

Sample P reparation
Before analysis, plasma samples were thawed at room temperature for approximately 10
mill. Plasma calibration standards and QC samples (1 ml) were transferred to vials and
mixed with 1.0 ml acetonitrile. After vortexing for 1 min, the samples were centrifuged (5
min, >2000g). The supernatant was transferred to new tubes and the solvent was
evaporated at 37°C under a stream of nitrogen. The residues were dissolved in 100 |.i!
acetonitrile and 1 (.il o f each sample was applied to the TLC plate to furnish a final
calibration range o f 100 to 1200 ng per zone. QC samples at final concentrations o f 200,
600, and 1000 ng per zone were obtained after application. Each concentration was
applied six times to the TLC plate.
S tability Study
QC Samples
For determining the stability, QC samples were taken at three concentration level. Plasma
was spiked with MMF and then stored at 4°C or 20°C, Then stability was assessed at 0.5,
1, 2, 4, and 8 hr interval. The stability of the drug in frozen samples (~20°C) was
detemiined for a period o f two months. The degradation rate constant (kobs), half-life
(tl/2), and shelf life (t90) o f the drug in plasma sample were also determined at 4°C and
at 20°C.
Freeze-Thaw Stability
To determine freeze-thaw stability nine aliquots of each QC sample were stored at -20°C
for 24 hrs. Then the samples were left at room temperature for thawing process. Three
aliquots o f each QC sample were analyzed after extraction. The other aliquots were again
stored at -20°C for next 24 hrs. This cycle was repeated three times.
Chapter 3 _______________ MATERIALS AND METHODS
D epartm ent of Pharmaceutical Chemistry Page 94

Chapter 3 MATERIALS AND METHODS
Stock Solution Stability
The stability o f the drug in acetonitriie (stock solution) was assessed at 4°C and 20°C. At
room temperature, runtime stability o f processed samples after extraction was detennined
for QC samples. To test the stability, the samples were analyzed immediately after
preparation (control) and after a stipulated time period.
D epartm ent of Pharmaceutical Chemistry Page 95