chapter 23 powerchord: exploring ambient audio feedback...
TRANSCRIPT
297
Chapter 23Powerchord: Exploring Ambient Audio Feedback on Energy Use
Dan Lockton, Flora Bowden and Claire Matthews
© Springer International Publishing Switzerland 2017 D.V. Keyson et al. (eds.), Living Labs, DOI 10.1007/978-3-319-33527-8_23
Abstract Influencing energy use is a major research topic. However, many approaches lump ‘energy demand’ together, disconnected from everyday artefacts, the realities of household life, and people’s diverse understandings of the systems around them. There is an opportunity for research through design which addresses relationships with the invisible concept of energy through new kinds of feedback. Powerchord is an ongoing (2014—) exploration of sonifying energy use in near-real time. The prototypes developed so far monitor multiple household electrical appliances in parallel, turning readings of the instantaneous power being drawn into various kinds of sounds. Powerchord provides a form of ambient experien-tial feedback intended to fit with the soundscapes of everyday domestic life, while (perhaps) enabling a deeper understanding of the characteristics of energy use. The concept was developed from ideas suggested by householders during co- creation sessions as part of the European SusLabNWE project, funded by INTERREG IVB, as part of our wider exploration of the invisibility of energy which also led to ‘Drawing Energy’ (see Chap. 14 ‘Participatory Drawing in Ethnographic Research’).
Keywords Energy use · Sonification · Ubiquitous computing
D. Lockton (*) · F. Bowden Royal College of Art, London, UKe-mail: [email protected]
F. Bowden e-mail: [email protected]
C. Matthews Independent, London, UKe-mail: [email protected]
298 D. Lockton et al.
23.1 Background
Design for sustainable behaviour has grown significantly as a field of research in recent years (see Chap. 7 ‘Design with Intent and the field of design for sustain-able behaviour’ of this volume). It aims to reduce the ‘undesirable’ environmen-tal and social impacts of products and services, or increase the desired impacts, through design (in a broad sense) concentrating on understanding and influencing people’s interactions with technology. It is inherently multidisciplinary, drawing on knowledge, perspectives and models from a number of fields relating to human behaviour and social practices.
Mainstream ‘interventions’ largely take the form of redesign of products and services themselves, or the design of interfaces, usually digital, and usually visual, which give users information and feedback (and sometimes feedforward) on use or the impacts of their actions. The digital approach builds on significant work in HCI on persuasive technology (Fogg 2009) and on the effectiveness of behavioural feedback from other disciplinary perspectives.
Energy use is one of the major issues on which design for sustainable behav-iour has concentrated. Reducing humanity’s energy demand, and in turn car-bon dioxide (CO2) impact, through influencing public behaviour, is a significant research topic across multiple intersecting technological and social science disci-plines. Aside from design work on technology or infrastructure change, the major-ity of work on influencing energy use through behaviour change concentrates on numerical, visual feedback displays for electricity or gas use, in both domestic and commercial environments. There are numerous studies and meta-analyses looking at the effectiveness of different kinds of feedback (real-time, summary, norma-tive, and so on) in this context, and the adoption of these kinds of displays within household life. As technology develops, the opportunities afforded by networked smart meters, which enable adaptive pricing changes (as well as providing energy utilities with much more detailed usage data) are also being explored, driven by legislation.
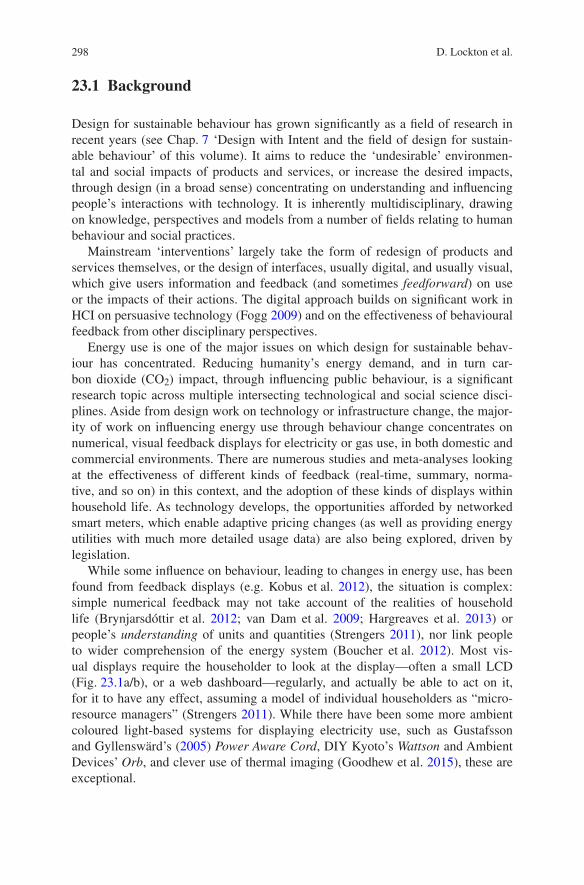
While some influence on behaviour, leading to changes in energy use, has been found from feedback displays (e.g. Kobus et al. 2012), the situation is complex: simple numerical feedback may not take account of the realities of household life (Brynjarsdóttir et al. 2012; van Dam et al. 2009; Hargreaves et al. 2013) or people’s understanding of units and quantities (Strengers 2011), nor link people to wider comprehension of the energy system (Boucher et al. 2012). Most vis-ual displays require the householder to look at the display—often a small LCD (Fig. 23.1a/b), or a web dashboard—regularly, and actually be able to act on it, for it to have any effect, assuming a model of individual householders as “micro-resource managers” (Strengers 2011). While there have been some more ambient coloured light-based systems for displaying electricity use, such as Gustafsson and Gyllenswärd’s (2005) Power Aware Cord, DIY Kyoto’s Wattson and Ambient Devices’ Orb, and clever use of thermal imaging (Goodhew et al. 2015), these are exceptional.
29923 Powerchord: Exploring Ambient Audio Feedback on Energy Use
Many approaches lump ‘energy demand’ together as a number, disconnected from everyday artefacts, the realities of household life, and people’s diverse under-standings of the systems around them. There is an opportunity for design-led research placing artefacts and the narratives of practices more centrally, because, on the most basic of levels, it is through both everyday appliances, and artefacts such as these in-home displays that people actually experience energy use. Within HCI and design research, Pierce and Paulos (2010) call for more work on mate-rialising energy, while novel approaches such as Mazé and Redström (2008) and Boucher et al. (2012) bring an artefact-driven perspective to the field.
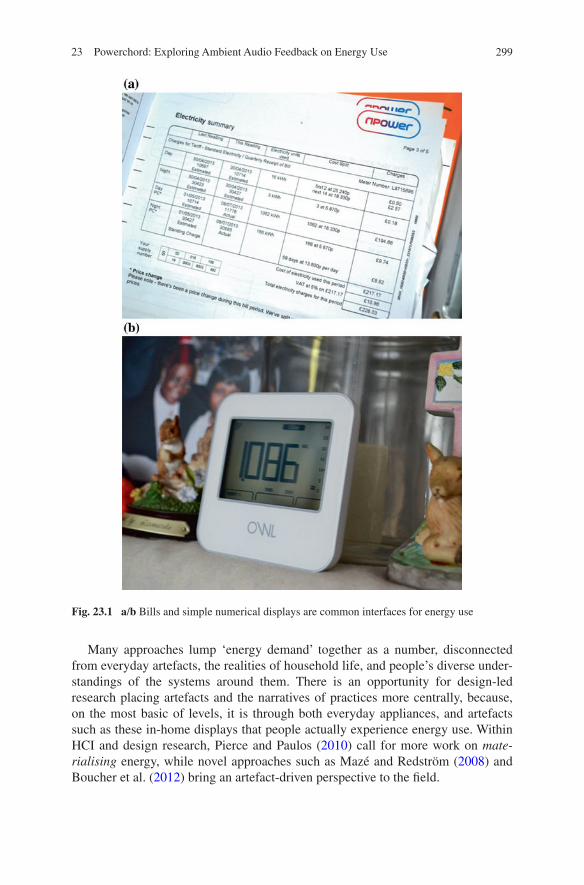
Fig. 23.1 a/b Bills and simple numerical displays are common interfaces for energy use
300 D. Lockton et al.
As part of SusLabNWE, a large multidisciplinary collaborative European Living Lab project, we have been afforded the opportunity to embed this kind of artefact-driven ‘research through design’ practice within a more established quan-titative environmental science and civil engineering approach. Our methodology employs co-creation and regular participant engagement throughout the design process.
23.2 Initial Research
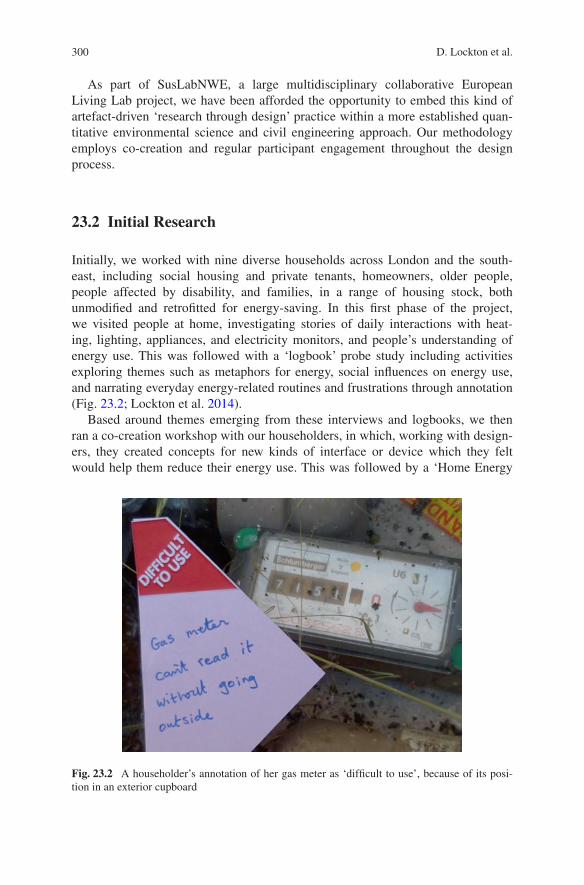
Initially, we worked with nine diverse households across London and the south-east, including social housing and private tenants, homeowners, older people, people affected by disability, and families, in a range of housing stock, both unmodified and retrofitted for energy-saving. In this first phase of the project, we visited people at home, investigating stories of daily interactions with heat-ing, lighting, appliances, and electricity monitors, and people’s understanding of energy use. This was followed with a ‘logbook’ probe study including activities exploring themes such as metaphors for energy, social influences on energy use, and narrating everyday energy-related routines and frustrations through annotation (Fig. 23.2; Lockton et al. 2014).
Based around themes emerging from these interviews and logbooks, we then ran a co-creation workshop with our householders, in which, working with design-ers, they created concepts for new kinds of interface or device which they felt would help them reduce their energy use. This was followed by a ‘Home Energy
Fig. 23.2 A householder’s annotation of her gas meter as ‘difficult to use’, because of its posi-tion in an exterior cupboard
30123 Powerchord: Exploring Ambient Audio Feedback on Energy Use
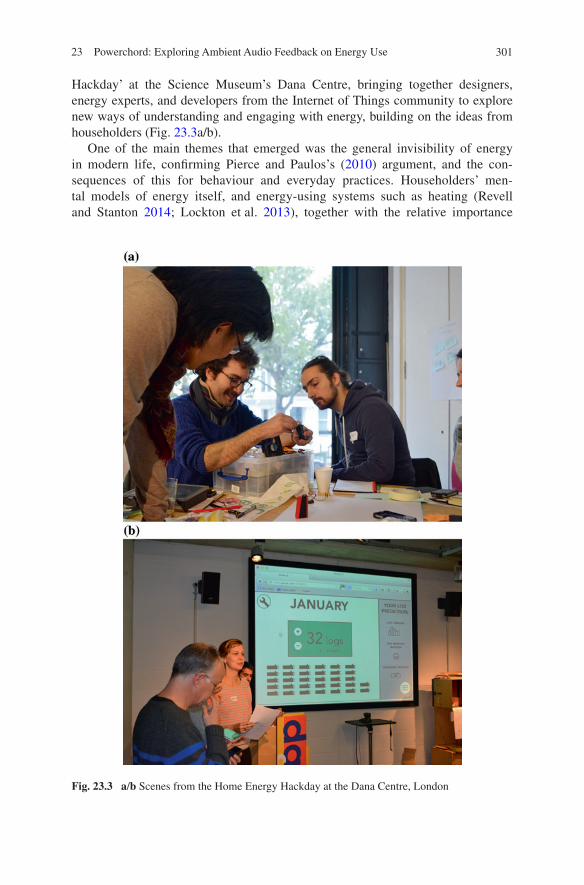
Hackday’ at the Science Museum’s Dana Centre, bringing together designers, energy experts, and developers from the Internet of Things community to explore new ways of understanding and engaging with energy, building on the ideas from householders (Fig. 23.3a/b).
One of the main themes that emerged was the general invisibility of energy in modern life, confirming Pierce and Paulos’s (2010) argument, and the con-sequences of this for behaviour and everyday practices. Householders’ men-tal models of energy itself, and energy-using systems such as heating (Revell and Stanton 2014; Lockton et al. 2013), together with the relative importance
Fig. 23.3 a/b Scenes from the Home Energy Hackday at the Dana Centre, London

302 D. Lockton et al.
of different energy-using systems in the home, were partly determined by what was most salient, such as lighting, rather than ‘hidden’ uses such as heating and cooling (this aligns with other research, e.g. Attari et al. (2010) and Kempton and Montgomery (1982)).
By people’s own admission, much of the energy ‘wasted’ at home through par-ticular behaviours, such as leaving heating on when going out, or leaving lights on elsewhere in the house, was partly due to its invisibility from the perspective of where they were at the time. People questioned how they could change how they use energy when they can’t easily see or feel it, or get a sense of the changing rate at which it is being used. We found confusion with the different characteristics of energy use by different appliances (e.g. the ‘spike’ of a kettle compared with the continuous power drawn by lighting), and units, for example between kilowatts as a measure of power and kilowatt-hours as a measure of energy. As also recounted by Bowden et al. (2015), one householder told us:
“I worked out that through gas and electricity every year, the average house gets the equivalent of a bit over three tons of coal delivered completely silently and without any mess. And go back a hundred years ago and everyone would have a really good quantita-tive understanding of how much energy they used because they had to physically shovel the stuff.”
We decided to explore this theme of energy’s invisibility through both visu-alisation beyond numbers (see Chap. 14 ‘Participatory Drawing in Ethnographic Research’ of this volume), and transitioning to another sense: sound.
23.3 Sonification
The issue of energy’s invisibility suggested opportunities for visualisation beyond numbers, but also non-visually, for example sonification (Walker and Nees 2011) of energy use.
In our co-creation workshop, one person suggested that being able to ‘listen’ to whether appliances were switched on or not, and what state they were in (e.g. listening to a washing machine will give a good idea as to where it is in its cycle), was potentially more useful for understanding, experientially, the links between practices and energy demand, than a visual display. Another householder sug-gested, in response to discussion of smart metering and demand-based pricing changes, that being able to ‘hear’ the load on the grid (for example, a pleasant background hum could become discordant as the grid’s frequency changes due to high demand, or the tick of a clock could become temporarily faster) would be less intrusive than, for example, a text message or a flashing light. There was dis-cussion around the quality of the sound, e.g. whether a lower-pitched ‘rumbling’, like thunder, would be more appropriate for greater rate of energy use (i.e. power) than a higher pitch, and whether there could be a music system that somehow ‘dis-torted’ what it played when the house’s energy use was higher than normal.

30323 Powerchord: Exploring Ambient Audio Feedback on Energy Use
There are echoes of early work in calm technology and ubiquitous computing, such as Natalie Jeremijenko’s Live Wire (Dangling String) (Weiser and Brown 1995), or Ernevi et al’s (2007) Erratic Radio, in which the ‘display’ fits with the existing daily visual landscape and soundscapes (Schafer 1977) of the environ-ment. Sonification of energy use along these lines could enable ambient compre-hension of energy use with multiple appliances, including pattern recognition and state changes (Serafin et al. 2011). Relating sound to energy use is not unknown. In explicit data sonification work, Opower’s Chicago in the Wintertime (Tinjum and Ben-Meshulam 2013) turns the city’s residential electricity use over winter 2012–13 into piece of music; less directly, Foster et al’s (2011) Power Ballads made use of aversive feedback based around UK chart music, automatically posted to the user’s Facebook wall, based on high levels of electricity use.
To explore near-real-time energy sonification, we chose CurrentCost electric-ity monitors, as supplied to many utility customers in the UK, including some of our participating households. The CurrentCost ‘ecosystem’ includes a bridge con-necting to a router and posting data to a website, and individual appliance moni-tors (IAMs) wirelessly connected to the base unit, enabling disaggregated data. CurrentCost has been used in a number of Internet of Things (IoT) academic stud-ies. The system can also monitor gas use, if a household has a compatible meter.
Building on others’ code for extracting CurrentCost data (e.g. by Colin R Williams: http://crwilliams.co.ukprojects/arduino-currentcost-lcd/), we developed Powerchord, an Arduino-based system which parses the CurrentCost’s XML out-put every 6s, extracting the IAM power figures for individual appliances, and map-ping these figures to ranges defined in code. Three IAMs are used, although the system could support up to nine. Initially we worked with a GinSing synthesizer shield for the Arduino, producing different tones (with various effects) mapped to power ranges, but, lacking experience in sound design, the results we were able to produce were aesthetically unattractive to say the least.
We decided instead to build on the idea from our co-creation work with house-holders around fitting into the existing daily soundscapes of the home—something more like the tick of a clock, or the sound of distant church bells, ‘repurposing’ them with extra energy information rather than being part of the “increasing clut-ter of beeps and bleeps” (Serafin et al. 2011) of feedback. This ‘blended sonifi-cation’ (Tünnermann et al. 2013) meant that recordings of these sounds, suitably modified, could be used; we linked the Arduino to a Robertsonics WAV Trigger, enabling polyphonic playback for multiple audio files simultaneously.
Power ranges were defined to match the typical ranges found in household appliances, from <10 W for trickle charging, to >2 kW for electric heaters. For each power range, for each appliance, the WAV Trigger plays a particular audio track, looped until the power range changes (Table 23.1). Any audio tracks can be used, including tones, sound effects or music—on a user-replaceable micro SD card. Powerchord can thus act as a platform for different kinds of ambient energy sonification research (Figs. 23.4, 23.5 and 23.6).
For the initial demonstration prototypes, aside from trying out actual power chords from 90s rock, we have primarily used birdsong (from http://xeno-canto.

304 D. Lockton et al.
org)—blackbirds, house sparrows and herring gulls—edited so that different inten-sities of song (number of birds, agitation level) map to power ranges. The fact that we hear birds calling and singing every day, and notice when they are abnormally loud or agitated, yet are usually unable to understand what the sounds ‘mean’, suggests that birdsong represents an opportunity for this ‘unused auditory band-width’ to be exploited as a channel for information. The subjective beauty of most bird vocalisation, such that even birds’ alarm calls are usually considered pleasant
Table 23.1 Mappings of power ranges to sound files—per appliance, in parallel
Power range (W) Sound files used
0–5 Nothing played
6–30 Track A (lowest intensity)
31–150 Track B
151–390 Track C
391–500 Track D
501–900 Track E
901–1700 Track F
≥1701 Track G (highest intensity)
Fig. 23.4 How the Powerchord system works
Fig. 23.5 A Powerchord prototype being tested in a kitchen environment, monitoring a micro-wave oven and an electric kettle
30523 Powerchord: Exploring Ambient Audio Feedback on Energy Use
(and very unlike the alarm sounds generated by most electronic devices), offers a different quality of experience to direct tone-mapped sonification.
Connecting people better to the wider, complex systems around them, in which their behaviour plays a part, such as energy use, suggests that ‘natural’ metaphors may be particularly relevant. One might equally imagine the sound of a river, waterfall, or the sea, or wind in the trees, as being appropriate in this context, or indeed other weather-based sound collections. We selected common garden birds whose calls and song would likely already be familiar and potentially part of householders’ daily soundscapes—blackbirds and house sparrows—and also, as a counterpoint, the distinctive calls of herring gulls, which potentially evoke seaside memories, but which are not ‘tranquil’ in the same way. In some demos, we have mapped the herring gulls to an electric kettle, since it is used intermittently rather than continuously, and the startling sound of the gulls is aligned with the sudden change in household energy use that switching on a kettle normally entails.
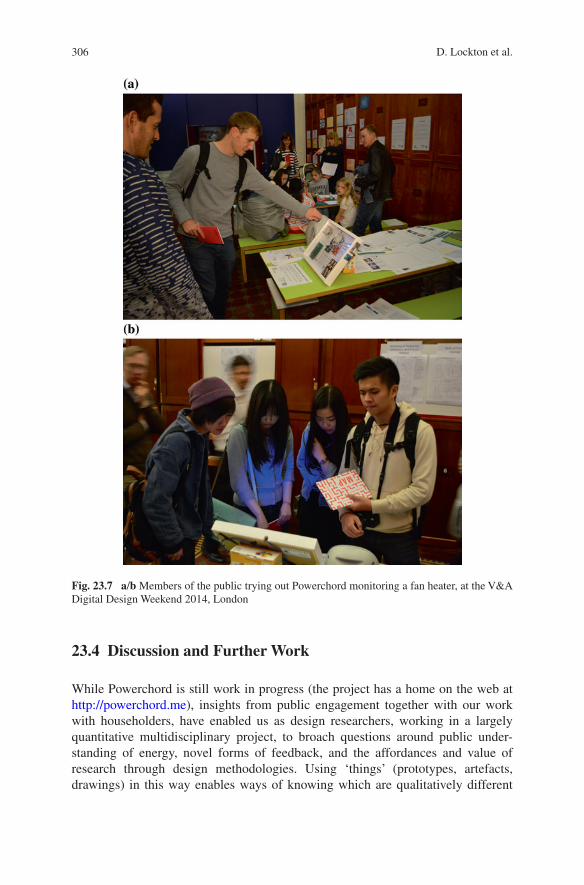
Demonstrating a Powerchord prototype alongside the Drawing Energy activity at the Victoria and Albert Museum’s ‘Digital Design Weekend’ 2014 (Fig. 23.7a/b), around 40 members of the public tried it out, switching on a fan heater at different power levels to hear the changes in birdsong. We used this activ-ity to engage people in completing quick response sheets suggesting the kinds of sounds they believed they would find useful for understanding the energy use characteristics of different appliances and activities. This has enabled us, working with sonic interaction designer Claire Matthews (http://claire-matthews.com), to create and explore the possibilities of a range of ‘sound packages’ for Powerchord, including ever-more-complex jazz and acoustic guitar schemes, a log fire pro-gressing from crackling to roaring, the sound of increasing numbers of coins being dropped, other natural sounds such as rain intensity, different animal sounds from mice to elephants, and even dog whistles so that the family dog perhaps learns to howl at high energy use, becoming the ‘household expert’ on it.
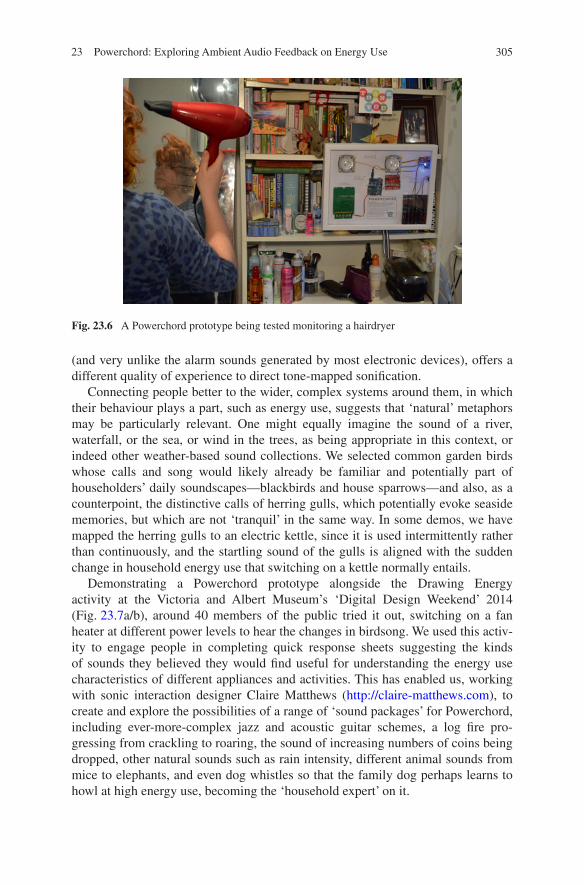
Fig. 23.6 A Powerchord prototype being tested monitoring a hairdryer
306 D. Lockton et al.
23.4 Discussion and Further Work
While Powerchord is still work in progress (the project has a home on the web at http://powerchord.me), insights from public engagement together with our work with householders, have enabled us as design researchers, working in a largely quantitative multidisciplinary project, to broach questions around public under-standing of energy, novel forms of feedback, and the affordances and value of research through design methodologies. Using ‘things’ (prototypes, artefacts, drawings) in this way enables ways of knowing which are qualitatively different
Fig. 23.7 a/b Members of the public trying out Powerchord monitoring a fan heater, at the V&A Digital Design Weekend 2014, London

30723 Powerchord: Exploring Ambient Audio Feedback on Energy Use
to those enacted in other disciplines addressing the same broad questions, in this case around design for sustainable behaviour and energy use. Artefacts enable the materiality of energy (Pierce and Paulos 2010) to be manifested, discussed, and explored practically.
In the next stage of our work with Powerchord we are aiming to explore this value further, through field studies with householders, incorporating a variety of sound schemes as outlined above. The research questions centre on how people’s understanding of the energy use characteristics of appliances change (or not) with this kind of ambient feedback, and how people make use of the system in practice. Can knowledge derived from ‘longer term use’ of such a design intervention, for instance, help inform us about people’s evolving understandings and interactions between technology, meanings and practices? How, over time, do people construct meaning (Dourish 2001; Fantini van Ditmar and Lockton 2016) for their data? There are also many specific energy-related avenues to explore, including linking sound to the load on the electricity grid (particularly where this may lead to dif-ferent pricing per unit) and applications in local or community microgrids where generation as well as consumption (and the balance between them) comes into consideration.
References
Attari, S. Z., DeKay, M. L., Davidson, C. I., & Bruine de Bruin, W. (2010). Public perceptions of energy consumption and savings. Proceedings of the National Academy of Sciences, 107(37), 16054–16059.
Boucher, A., Cameron, D., & Jarvis, N. (2012). Power to the people: Dynamic energy manage-ment through communal cooperation. In Proceedings of DIS 2012, Newcastle.
Bowden, F., Lockton, D., Gheerawo, R., & Brass, C. (2015). Drawing energy: Exploring percep-tions of the invisible. London: Royal College of Art.
Brynjarsdóttir, H., Håkansson, M., Pierce, J., Baumer, E. P. S., DiSalvo, C., & Sengers, P. (2012). Sustainably unpersuaded: How persuasion narrows our vision of sustainability. In Proceedings of CHI 2012, Austin, Texas.
Dourish, P. (2001). What we talk about when we talk about context. Personal and Ubiquitous Computing, 8(1), 19–30.
Ernevi, A., Palm, S., & Redström, J. (2007). Erratic appliances and energy awareness. Knowledge, Technology and Policy, 20(1), 71–78.
Fantini van Ditmar, D., & Lockton, D. (2016). Taking the code for a walk. Interactions, 23(1), 68–71.
Fogg, B. J. (2009). A behavior model for persuasive design, Persuasive 2009. In 4th International Conference on Persuasive Technology. New York: ACM.
Foster, D., Linehan, C., Lawson, S., & Kirman, B. (2011). Power ballads: Deploying aversive energy feedback in social media. In CHI ‘11 Extended Abstracts on Human Factors in Computing Systems. New York: ACM.
Goodhew, J., Pahl, S., Auburn, T., & Goodhew, S. (2015). Making heat visible: Promoting energy conservation behaviours through thermal imaging. Environment and Behaviour, 47(10), 1059–1088.
Gustafsson, A., & Gyllenswärd, M. (2005). The power-aware cord: Energy awareness through ambient information display. In Poster Proceedings of CHI 2005. New York: ACM.

308 D. Lockton et al.
Hargreaves, T., Nye, M., & Burgess, J. (2013). Keeping energy visible? Exploring how house-holders interact with feedback from smart energy monitors in the longer term. Energy Policy, 52, 126–134.
Kempton, W., & Montgomery, L. (1982). Folk quantification of energy. Energy Policy, 7(10), 817–827.
Kobus, C. B. A., Mugge, R., & Schoormans, J. P. L. (2012). Washing when the sun is shining! How householders interact with a household energy management system. Ergonomics, 56(3), 451–462.
Lockton, D., Harrison, D., Cain, R., Stanton, N. A., & Jennings, P. (2013). Exploring problem-framing through behavioural heuristics. International Journal of Design, 7(1), 37–53.
Lockton, D., Renström, S., Bowden, F., Rahe, U., Brass, C., & Gheerawo, R. (2014) Energy sto-rytelling through annotating everyday life. In BEHAVE 2014: 3rd European Conference on Behaviour and Energy Efficiency, 3–4 Sept 2014, Oxford.
Mazé, R., & Redström, J. (2008). Switch! Energy ecologies in everyday life. International Journal of Design, 2(3), 55–70.
Pierce, J., & Paulos, E. (2010). Materializing energy. In Proceedings of DIS Conference on Designing Interactive Systems. Arhus, Denmark. DIS ’10. New York, NY: ACM Press.
Revell, K. M. A., & Stanton, N. A. (2014). Case studies of mental models in home heat con-trol: Searching for feedback, valve, timer and switch theories. Applied Ergonomics, 45(3), 363–378.
Schafer, R. M. (1977). The soundscape: Our sonic environment and the tuning of the world. Rochester, VT: Destiny Books.
Serafin, S., Franinovic, K., Hermann, T., Lemaitre, G., Rinott, M., & Rocchesso, D. (2011). Sonic interaction design. In T. Hermann, A. Hunt, & J. G. Neuhoff (Eds.), The sonification handbook (pp. 87–110). Berlin: Logos.
Strengers, Y. (2011). Designing eco-feedback systems for everyday life. In Proceedings of CHI 2011, Vancouver.
Tinjum, A., & Ben-Meshulam, Y. (2013). This is the sound of Chicago’s energy consumption. Opower blog, 20 Nov 2013. http://blog.opower.com/2013/11/power-rock-this-is-the-sound-of- chicagos-energy-consumption/.
Tünnermann, R., Hammerschmidt, J., & Hermann, T. (2013). Blended sonification: Sonification for casual information interaction. In Proceedings of International Conference on Auditory Display (ICAD2013), Łódź, Poland.
van Dam, S., Bakker, C. A., & van Hal, J. D. M. (2009). The mediating role of home energy management systems. In Proceedings of First European Conference on Energy Efficiency and Behaviour, Maastricht.
Walker, B. N., & Nees, M. A. (2011). Theory of sonification. In T. Hermann, A. Hunt, & J. G. Neuhoff (Eds.), The sonification handbook (pp. 9–39). Berlin: Logos.
Weiser, M., & Brown, J. S. (1995). Designing calm technology. http://www.ubiq.com/hypertext/weiser/calmtech/calmtech.htm.