chapter 23 living standards measurement study...
TRANSCRIPT

Household Surveys in Developing and Transition Countries: Design, Implementation and Analysis
1
Chapter 23 Living Standards Measurement Study Surveys
May 2003
Kinnon Scott The World Bank
Wash., D.C., USA
Diane Steele The World Bank
Wash., D.C., USA
Tilahun Temesgen
The World Bank Wash., D.C., USA
Abstract
The Living Standards Measurement Study (LSMS) program arose from the need to improve statistical data at the household level required for designing, implementing and evaluating social and economic policy in developing countries. The focus of the LSMS program has been on understanding, measuring and monitoring living conditions, the interaction of government spending and programs with household behavior, ex ante and ex post assessments of policies, and the causes of observed social sector outcomes. The resulting LSMS surveys use multiple survey instruments to obtain data needed for these purposes and rely on significant quality control mechanisms to ensure high quality relevant data. Especially in recent years, the LSMS program has emphasized the process of involving data users in the design of the surveys and has worked on issues of sustainability. The present chapter provides an overview of what LSMS surveys are, the key design and implementation methods used in the surveys as well as efforts to promote analytic capacity. An assessment of the costs of the survey and the quality of the data obtained is included, as are examples of the policy uses of LSMS survey data. The chapter also discusses computations of the average sampling design effects and intra-class correlation coefficients of some household and individual level variables using selected LSMS surveys. Key Words: poverty measurement, living standards, survey methodology, design effect, intra-class correlation, quality control.
Household Surveys in Developing and Transition Countries: Design, Implementation and Analysis
2
I. Introduction
1. Public sector expenditures for social services and infrastructure represent significant amounts of resources, both in absolute and relative terms. It is not unusual for health and education spending to each account for 3-4 per cent of gross domestic product. Depending on the country this can range from several million to hundreds of millions of dollars. Major changes in economic policies concerning taxes and prices substantially alter both relative and absolute welfare levels. Yet often, due to a lack of data, policies are designed, implemented and revised with little information on their overall effectiveness in improving the lives of the country’s population. The absence of appropriate household level data forces policy makers to rely on administrative data which, while adequate for some purposes, often severely limits the ability to understand household behavior, how government policies affect households and individuals and the determinants of observed social sector outcomes. Filling in such gaps in understanding is the role of household surveys. 2. The Living Standards Measurement Study (LSMS) surveys are one instrument that governments can, and do, use to better understand the causes of observed outcomes as well as the impact of their policies. The LSMS survey goes beyond simply measuring outcomes to allowing connections to be made among the myriad factors that affect or cause these outcomes. Single-topic household surveys provide important and in-depth information on a specific topic of interest, but are inadequate for explaining why certain outcomes exist and what the range of factors are that affect them. The goal of the LSMS survey is to explore the linkages among the various assets and characteristics of the household on the one hand, and the actions of government on the other, and, thus to understand the forces affecting each sector, set of behaviors or outcomes. Deepening government’s understanding of the factors that affect living conditions serves to improve policies and programs. In turn, this can lead to a more efficient and effective use of scarce government and private resources and better living standards. 3. LSMS surveys are a collaborative effort on the part of the country governments that administer the surveys, the principal users of the data in the countries and the World Bank as well as other bilateral and multi-lateral donor organizations.1 While based on a core set of concepts, each LSMS survey is substantially customized to meet the specific needs of the individual governments at a given point in time. The principal implementing agency is usually the National Statistical Office (NSO) which takes the lead in questionnaire design, sample design, and fieldwork methodology using the techniques that the LSMS has found to be most effective. 4. This chapter provides an overview of the Living Standards Measurement Study. First a short history of the program is provided, followed by information on the key features of the LSMS survey. This is followed by a section explaining how LSMS design features have affected the quality of the data collected. The last section provides some examples of ways in which LSMS survey data have been used. 1 Inter alia, other institutions that have partnered LSMS surveys are the Inter-American Development Bank, United Nations’ agencies such as the United Nations Development Program, UNICEF, the United Nations Population Fund, and bilateral donors from Canada, Denmark, Great Britain, Japan, Norway, Sweden and the United States.

Household Surveys in Developing and Transition Countries: Design, Implementation and Analysis
3
II. Why an LSMS survey?
A. History 5. The LSMS efforts to respond to the need for quality data for policy makers started in 1980. After a five-year period of work that included reviewing existing household surveys and extensive consultation with researchers and policymakers to determine the types of data needed, as well as with survey methodologists on how best to design the actual fieldwork procedures, the first LSMS surveys were piloted in the Ivory Coast and Peru in 1985. These two first surveys were, specifically, research projects testing the full methodology to determine the usefulness and quality of the data that could be obtained.2 The success of these first two surveys has been responsible for the over 60 LSMS surveys that have been carried out in over 40 countries since 1985. (See Annex 1 for a complete list.)
III. Key features of LSMS surveys 6. The following is a summary of key features of the LSMS. The reader is referred to the 1996 LSMS Manual for more detailed information about the surveys and how to implement them.3
A. Content and instruments used
7. Up to four separate survey instruments are part of the LSMS surveys. The instruments are: (i) a household questionnaire for collecting information at the household and individual level, as well as at the level of household economic activities (agriculture and home businesses); (ii) a community4 questionnaire for collecting data on the environment in which households function with a focus on the available services, economic activities, access to markets and, lately, social capital; (iii) a price questionnaire administered in every area where households are located to allow cost of living adjustments5; and (iv) facility questionnaires administered to local service providers to obtain information on the types and quality of services available to households. Figure 1 relates the instruments used with the policy purposes of LSMS surveys and the variables needed.
2 For a more detailed account of the history of the LSMS, see Grosh and Glewwe (1995). 3 Grosh and Muñoz (1996). 4 Note that this is not a “community” in the sociological sense, but rather a mechanism to collect information about the areas where the households selected for the survey are located. 5 National Consumer Price Indices are often inadequate for this purpose as they tend to be urban and, even when rural areas are included, prices are not captured at the appropriate level of disaggregation.

Household Surveys in Developing and Transition Countries: Design, Implementation and Analysis
4
Figure 1. Relation between LSMS purposes and survey instruments Purpose Indicators Instruments
Individual and household measurement of welfare
Levels, distribution Consumption and correlates Income Household questionnaire Wealth, Savings Price questionnaire Human capital Anthropometrics Analyze policy
Who benefits from programs/public spending
Use of services Who receives services, transfers?
Impact of public spending/programs
Costs of services Impact of policies
Household questionnaire Community questionnaire
Availability of services Distance to nearest service Facility questionnaire Quality of services Types of service provided Price questionnaire Price of services Personnel, budget, other
inputs
Effect of economic policies Net transfers between sectors Identify determinants
Why observed outcomes occur Household composition, Household questionnaire What affects household behavior human capital, welfare,
services available, etc. Community questionnaire Facility questionnaire Price questionnaire
8. The contents of the survey instruments reflect the priority data needs of the country implementing the survey at a given point in time. As the overarching concern is measuring living standards, in all their varied facets, the household survey instrument, in particular, aims to collect information on the wide range of topics affecting these. Table 1 shows the content of a typical LSMS survey, this one from Viet Nam in 1997-1998.
Table 1. Content of Viet Nam 1997-1998 household questionnaire
First visit Second visit Household roster Fertility Education Agriculture, forestry and fishing Health Non-farm self-employment Labor Food expenses and production Migration Non-food and durable goods Housing and utilities Income from remittances Borrowing, lending and savings Anthropometrics
9. There is a high level of questionnaire customization for each country that has led to variations in the overall content of the survey instruments as well as the inclusion of new

Household Surveys in Developing and Transition Countries: Design, Implementation and Analysis
5
modules and topics over the years. For example, in Bosnia and Herzegovina in 2001, the health module was expanded to incorporate questions on depression in an effort to measure the incidence of this mental health ailment and identify the linkages between it and other aspects of welfare and labor market participation. In Guatemala in 2000, a module on social capital was added to collect information on the social dimensions of poverty such as participation in community/government programs and collective actions, causes of exclusion in the society, perceptions of welfare, and perceptions of, and access to, justice. In Albania, Brazil, Nepal, Jamaica, South Africa and Tajikistan, questions were added on subjective measures of poverty in an attempt to examine the relation of these to other measures.6 Table 2 shows a sample of modules that have been added in recent years. In summary, while a standard package of modules exists, each country’s LSMS survey reflects the country’s priorities, data needs or concerns at the time of the survey. A recent research project in the World Bank on “Improving the Policy Relevance of LSMS Surveys” has led to a new book outlining, by topic, the policy questions that can be addressed by LSMS data and providing guidance on questionnaire design. 7
Table 2. Examples of additional modules
Topics Countries and year Activities of daily living Kosovo (2000), Kyrgyz Republic (1993, 1996, 1997, 1998),
Jamaica (1995) Nicaragua (1993) Disability Nicaragua, (1993) Impact of Aids related mortality Tanzania-Kagera (1991-94) Literacy and/or numeracy tests Viet Nam (1997/8), Jamaica (1990), Morocco (1990/1) Mental health Bosnia and Herzegovina (2001) Privatization Bosnia and Herzegovina (2001), Kyrgyz Republic (1996, 1997) Shocks/vulnerability Bolivia (1999, 2000), Guatemala (2000), Paraguay (2000/1) Peru (1999) Social capital Guatemala (2000), Kosovo (2000), Panama (1997), Paraguay
(2000/1) Subjective measures of poverty Albania (2002), Brazil (1996), Jamaica (1997), Nepal (1996),
South Africa (1993), Tajikistan (1999) Time use Guatemala (2000), Nicaragua (1998), Jamaica (1993), Pakistan
(1991) Morocco (1990/1), Tanzania-Kagera (1991-94) 10. The questionnaire design phase is a process aimed at ensuring that relevant policy issues are identified and incorporated. In most countries a Data Users’ Group or Steering Committee is formed with members from different line ministries, donors, and academics along with the National Statistical Office (NSO). This group is responsible for identifying the data needs for specific policies to ensure that the appropriate data are collected. On average, the questionnaire design phase takes about eight months and involves as many actors as possible. This, rather lengthy, process has the additional benefit of generating demand for, and ownership of, the resulting data. This, in turn, leads to a greater use of the data in policy than would otherwise occur.
6 For more information on the social capital work in Guatemala, see World Bank (2002b). For further information on the subjective measures of poverty, see Pradhan and Ravallion (2000), Ravallion and Lokshin (2001), Ravallion and Lokshin (2002). Analysis of the Bosnia and Herzegovina data is ongoing. 7 Grosh and Glewwe, eds., (2000).

Household Surveys in Developing and Transition Countries: Design, Implementation and Analysis
6
B. Sample issues 11. Typically, LSMS surveys are national surveys using multi-stage probability samples of households.8 The overall samples are small (relative to several other surveys), usually ranging from 2,000-5,000 households. There are two main reasons to limit the sample size. First, there is a concern for quality and the need to balance sampling error with non-sampling error (see Section III, D. below for further discussion of this point). Second, the analytic focus of the LSMS surveys is on the determinants or relationships among characteristics of households and not on precise estimates of specific rates, ratios or means. For these reasons, LSMS samples are kept reasonably small and, usually, are not large enough for the survey results to be disaggregated to small geographic areas such as states, municipalities or departments. 12. Probability sampling is used in all LSMS surveys although the actual design used varies by country and situation. 9 Domains of study are identified (urban/rural, regions) and within each domain a stratified two-stage cluster design is used.10 As is the case in most household surveys, LSMS surveys use a cluster design in lieu of a simple random sample (SRS). This is done for cost considerations, even though cluster designs reduce the precision of the estimates. (See Section IV, D. below for more on sampling design effects that arise from using multi-stage sampling as well as Annex 3.) The primary sampling units (PSUs) are geographically-defined area units selected with probability proportional to size. The sample frame is typically the most recent population census in the country, but alternatives have been used when the census was unavailable or irrelevant (see Basic Information Documents for the Nicaragua 1993 LSMS, where voting registers supplemented outdated census information; and the Bosnia and Herzegovina 2001 LSMS, where extensive listing operations were needed due to the civil war, for examples). 13. Once the PSUs have been selected, an enumeration of these PSUs is carried out to ensure that an accurate and up-to-date listing of all dwellings and households is available. This listing operation is carried out as close, in time, as possible to the fieldwork for the actual survey. It is not done by the interviewers themselves to avoid any potential biases but, instead, by the cartography department of the NSO. With a complete, current list of all dwellings in the PSU, the secondary sampling units (households) are systematically selected, usually a fixed number of households within each PSU, typically 12 to 18. Data are then collected from all members of the household. While the sample design of LSMS surveys is intended to encompass national coverage, in some cases, due to civil conflict or natural disaster, specific areas may be excluded. 14. LSMS survey estimates generally require the use of sample weights. Even when the original sample design calls for a self-weighted scheme, for example as in Ghana, Nicaragua (1993) and Tajikistan, varying non-response rates create the need for differential weights to be used in the analysis of the data. In fact, most of the sample designs are not self-weighted. Often,
8 Actually, as with most household surveys, it is the dwelling which is selected and then all households found in the selected dwelling are interviewed. Note that when a panel design is used whether it is the dwelling or the household which is followed will depend on the purpose of the panel and logistical issues. 9 The Basic Information Document for each survey provides the details of the sample design for the individual survey. These can be found on the LSMS web site: http://www.worldbank.org/lsms/. 10 Three stage designs have been necessary in some countries, however.

Household Surveys in Developing and Transition Countries: Design, Implementation and Analysis
7
the design of the sample in a given country is affected by that country’s analytic considerations. For example, population subgroups that are small but of interest to the government (ethnic minorities, remote regions, those engaged in a particular economic activity or in an important government project area) may need to be over-sampled to ensure enough cases for a separate analysis of them. Again, such sample designs lead to the need for sample weights in the analysis of the data. A final point that must be kept in mind, given the sample designs used in LSMS surveys, is that statistical tests of significance carried out on the data must take into account the multi-stage nature of the design as well. (See the chapters in the volume on sample design effects for details on this issue.)
C. Fieldwork organization
15. As seen above, the goals of LSMS surveys drive the structure and content of the surveys: they also are reflected in the fieldwork methods used. The fieldwork for an LSMS survey is designed so that data are collected by mobile interview teams which incorporate data entry activities and strong supervision.11 Each household is visited at least twice with a two-week period between visits. Figure 2 shows graphically the way in which fieldwork is carried out. Fieldwork is designed so that each interview team completes the interviews in two selected communities (PSUs) per month. The teams work in the first community in the first and third weeks of the month and in the second community in the second and fourth weeks. The first half of the questionnaire is completed in the first visit, done in week 1 or 2 depending on the community. Between visits, the data from the first visit are entered and checked for errors. The second visit is used to correct errors from the first visit, to administer the second half of the survey, and to provide a fixed time period for the information collected on food expenditures.12 Data are typically collected throughout a 12-month period, in order to allow seasonal adjustments where necessary, although many countries have opted for shorter periods.
Figure 2. One month schedule of activities for each team
11 See Annex 2 for more details on the interview teams. 12 While two visits are formally scheduled, the use of direct informants for all sections of the questionnaire means that, in fact, interviewers visit each household as many times as are needed in order to interview all household members.
Sample Cluster A
TASKS 1 st half of survey carried out in Cluster A Price questionnaire administered
Sample Cluster B
TASKS 1 st half of survey carried o ut in cluster B Price questionnaire administered Date entry of Cluster A done, error list produced
TASKS Survey completed Errors corrected Data entry of Cluster B done, error list produced Community Questionnaire Administered Supervis ion re - visits
TASKS Survey completed in Cluster B Errors corrected Data entered 2 nd half of interview from Cluster A Community Questionnaire administered Supervision re - visits
Week 1
Week 2
Week 3
Week 4

Household Surveys in Developing and Transition Countries: Design, Implementation and Analysis
8
16. The supervisor is responsible for administering the community and price questionnaires in parallel with his or her team of interviewers collecting the household level data in the PSU. Facility surveys may require additional personnel to administer.
D. Quality 17. A fundamental and ongoing concern with LSMS surveys is to ensure a high quality of data obtained. The complexity of the survey makes quality control mechanisms of particular importance. As can be seen in Table 3, the quality controls take a variety of forms, from the simplest - relying on verbatim questions, explicit skip patterns, questionnaires translated into the relevant languages in a country, and closed-ended questions to minimize interviewer error - to the more complex one of concurrent data entry with immediate revisits to households to correct inconsistency errors or capture missing data. Clearly, not all of these quality controls are unique to LSMS surveys, but given the complexity of LSMS surveys, the emphasis has been on incorporating a complete package of quality controls. In addition to the above mentioned controls, and, perhaps more controversially, the LSMS program has opted for a small sample size to minimize non-sampling errors. The logic of this is that while sampling errors can be large when small sample sizes are used, such errors can at least be quantified. Non-sampling errors, by contrast, arise from many sources and their magnitude is virtually impossible to measure; it is well-known, however, that the totality of non-sampling error tends to increase as sample size increases. Thus the decision was to limit these non-sampling errors even if that restricted the level of geographic disaggregation possible with the survey data. The emphasis in LSMS surveys on exploring the relationships among aspects of living standards, as opposed to measuring with great precision specific indicators or rates, means that this is less of a hindrance than it might be in other surveys.13 Finally, recent methods to link LSMS survey data (and others) to census data that allow an imputation of poverty within the census data, serves toreduce, to some extent, the small sample size issue, at least in terms of poverty and inequality measures.14
13 A Labor Force Survey, for example, which is supposed to show very small changes in unemployment rates over time will require a much larger sample than that needed to analyze the determinants of unemployment as would be more the focus of analysis of the LSMS survey. 14 See section V below on the uses of LSMS data for more on this technique.

Household Surveys in Developing and Transition Countries: Design, Implementation and Analysis
9
Table 3. Quality controls in LSMS surveys
Area of quality control Controls Questionnaire Verbatim questions Explicit skip patterns Minimal use of open-ended questions Written translation into relevant languages* Sensitive topics placed at end Packaging: one form for all household and individual data Pilot phase Formal pilot test of questionnaire and fieldwork Direct informants Individuals and best informed Concurrent data entry Check for range, consistency errors Revisits to households to make corrections Two round format Reduces fatigue Creates bounded recall period Allows for checking of data entry and correction with
households Training Intensive training of interviewers (one month), supervisors
and data entry staff Decentralized fieldwork Mobile teams made up of supervisor, 2-3 interviewers and
data entry operator with computer and printer, and driver with car
Supervision One supervisor per 2-3 interviewers Small sample size Limit non-sampling error Data access policy Open use of data to all researchers and institutions
* In countries where some languages do not have a written form (indigenous languages in Panama for example), bilingual interviewers are used instead. This is not a perfect solution and should be avoided unless absolutely necessary.
18. Another quality control mechanism the LSMS surveys have incorporated is the use of direct informants, also called self-respondents. This has two key advantages. It reduces the burden on any given respondent and thus lessens respondent fatigue. The household questionnaire is actually a series of short (10-15 minute) individual interviews, with only the best informed respondents for consumption, agriculture and household businesses facing longer interview periods.15 The use of direct informants also improves the quality of the data obtained by ensuring that the most knowledgeable person is answering the questions.16 It is unreasonable to expect that any person in the household can give accurate and complete data on the health, education, labor, migration, credit and fertility status or activities of all other household members; it is simply too much information. In addition there may be incentives within a household to keep some information from other household members (credit, savings, earnings, and contraceptive use are all activities about which information might not be shared). Using direct informants is thus the only way to ensure accurate information on each household member. Interviewers are trained to, as far as possible, conduct the individual interviews in private. 15 Even for the ‘best informed’ respondents, the actual interview time is kept to under one hour as this is considered the maximum time that one person should be interviewed. For some specific households, however, this time limit may be exceeded and care needs to be taken to avoid informant fatigue and the resulting decrease in data quality associated with it. 16 In the case of children under the age of 10 or 12, or household members unable to communicate, proxy respondents may be used. When proxy respondents are used, the ID code of the actual respondent is noted.

Household Surveys in Developing and Transition Countries: Design, Implementation and Analysis
10
19. Training of all staff involved in each LSMS survey is a further quality control mechanism. This takes the form of ‘on-the-job’ training for the staff of the NSO as well as more formal courses as needed. For the field staff, interviewers, supervisors and data entry operators, substantial resources are invested in formal training. Typically the training for field staff is four weeks long and incorporates both theory and practical exercises. Upon completion of the training, field staff are selected based on having passed the training course. A satisfactory result is usually based on a combination of successful participation during the course and passing a formal test at the end. 20. A final method to improve data quality that is often missed is promoting open access to the micro-data resulting from the survey. Ensuring the widespread use of the data sets by a range of researchers and policy makers leads to careful checking of existing data. And, by creating a feedback loop to data producers, this serves to increase the quality of future surveys. Open data access agreements have been reached for most LSMS survey data sets and efforts are made to help governments disseminate such data. Although the World Bank does not own the LSMS survey data sets, permission has been given to the World Bank to directly disseminate over half of them (in fact, 30 per cent of all data sets can be downloaded directly from the LSMS Web site).17 Of the remaining data sets, the majority can be distributed once the government approves the individual request. Feedback from those who have requested this type of permission indicate that permission is granted in about 90 per cent of the cases.
E. Data entry 21. Concurrent data entry entails using sophisticated data entry software that checks for range errors, inter- and intra-record inconsistencies and, when possible, even checking data against external reference tables (for example, anthropometrics, crop yield data and prices). Data are entered in the field on laptop computers during the data collection phase, and data entry operators are an integral part of the mobile survey teams. Data are entered immediately after each interview is done and a list of errors, inconsistencies and missing information is produced from the data entry process. The interviewer then returns to the household to clarify, with the household members, any problems and to complete any missing information. This method avoids lengthy batch cleaning of data after the survey finishes. Such cleaning is best avoided as it tends to create internally consistent data sets but not ones that best reflect each individual’s situation; it also requires substantial time thus delaying the use of the data and, in the worst case, rendering some of it obsolete. With the advent of inexpensive, yet powerful, computers and new software developments, it is likely that some LSMS surveys will be carried out completely electronically using the Computer Assisted Personal Interview (CAPI) methods. This is an avenue that is presently being explored given its potential for decreasing the time between fieldwork and publication as well as greater data quality. 18
17 http://www.worldbank.org/lsms/ 18 The use of CAPI systems is one factor in the ability of the US Census Bureau to publish results of its monthly labor force survey (Current Population Survey) within 10 days of fieldwork. An experiment to compare the costs and benefits of CAPI to concurrent data entry for LSMS surveys is planned for Albania in 2003.

Household Surveys in Developing and Transition Countries: Design, Implementation and Analysis
11
F. Sustainability 22. At the simplest level the three greatest impediments to sustainability, to the long term implementation of LSMS surveys and the use of the resulting data in policy making, are budget constraints, staff turnover and a lack of analytic capacity. While no blueprint for ensuring sustainability exists, experience with the LSMS has provided several pointers on how to increase the likelihood of achieving sustainability. The first is the importance of involving policy makers and data users in the design and analysis phase. This essentially begins the process of creating a demand for the LSMS results and the use of the data in policy decisions. As it is these end users who benefit from the data (not the NSO per se), this is the group that has the most incentive to ensure that budget needs for future surveys are met during the budget allocation process within the government. Often, creating or identifying one or more ‘champions’ of the survey and data outside of the statistical system is key to sustainability.19 23. The second key lesson is that achieving sustainability is a long-term process. Investing in one-off surveys has little long-term impact. A more systematic effort over several years is needed to train a critical mass of staff, demonstrate the effectiveness and use of the instruments, create the linkages between producers and users and adapt the methodology to a country’s needs and skills. Additionally, investment in proper documentation of survey efforts, archiving of data and dissemination activities help to insure that institutional memory does not leave with any particular staff member. Close to 40 per cent of the countries that have done one LSMS survey have done multiple surveys. 24. Finally, building analytic capacity needs to be an explicit goal.20 This increases the use of data, thus helping to create demand for future data sets. In addition, increasing the skills of the NSO staff and, thus the NSO’s profile within government, may entice staff to stay on. 21 Finally, outside forces may also help to increase the demand for data. The Poverty Reduction Strategies being designed by countries receiving concessionary lending from the World Bank and the International Monetary Fund, and the Millennium Development Goals, all require data on the measurement and monitoring of poverty and key social indicators. The long term nature of such goals can help to foster monitoring and evaluation systems that rely heavily on household surveys such as the LSMS surveys along with administrative and project data.22 A recent evaluation of the Inter-American Development Bank-World Bank- Economic Commission for Latin America project to improve household surveys23 underlines the long term
19 Jamaica is one example of this. Demand originally came from the Prime Minister’s office and the Ministry of Planning has been involved in every stage of the survey design and use with the Statistical Office implementing the survey. The LSMS has been carried out annually since the late 1980s in Jamaica. See Grosh (1991) for more on this example. 20 A summary of lessons learned in LSMS surveys in terms of building analytic capacity can be found in Blank and Grosh (1999). 21 There is always a concern about maintaining a separation of data collectors from data analysts. Issues of credibility must be kept in mind when the barrier is relaxed. 22 The creation of the PARIS21 initiative to support the improvement of data for such purposes underlines the importance of sustainable data collection, analysis and use. 23 The IDB-WB-ECLAC project is ‘Improving Surveys of Living Conditions’, more commonly know by its Spanish acronym: MECOVI.

Household Surveys in Developing and Transition Countries: Design, Implementation and Analysis
12
nature of sustainability and raises an additional issue of transition from donor financing to local financing that must also be addressed.24
IV. Costs of undertaking an LSMS survey 25. The attention to quality has serious implications on the costs, in both time and resources of the surveys fielded. LSMS survey costs range from US$ 400,000 to US$ 1.5 million, depending on the country and the year. On a per-household basis, this is commensurate with other complex surveys such as Income and Expenditure Surveys and Demographic and Health Surveys. Costs, of course, vary on the capacity of the NSO, the state of existing statistical infrastructure, the goals of the survey, and the difficulty of movement within the country. Costs are substantially lower in cases where the implementing agency already has good infrastructure and experienced staff. Funds for each survey typically come from a variety of sources: government budgets (for the NSO or from other agencies), bilateral donations and multilateral donations and credits. In some cases, the private sector has also funded part of the survey costs.25 26. In general, the cost of an LSMS survey reflects the methods adopted, the size of the sample, and the complexity of the fieldwork. Figure 3 shows the cost components of an LSMS survey and each one’s relative weight. 26 (A simple exercise to help the reader start a budget for an LSMS survey can be found in Annex 2.)
Figure 3. Cost components of an LSMS survey, share of total
24 See Jacob Ryten (2000). 25 For example, in Peru, a limited amount of space on the questionnaire is reserved for private firms or researchers who pay to have specific questions added to the questionnaire in any given quarter. 26 This section on costs is based on Grosh and Muñoz (1996) and a presentation of Juan Muñoz at the World Bank course on Poverty and Inequality, 26-28 February 2002.

Household Surveys in Developing and Transition Countries: Design, Implementation and Analysis
13
Source: Based on Table 8.2, Grosh and Muñoz (1996).
27. The largest component of costs is for salaries. Almost three-quarters of this cost is for field staff: interviewers, supervisors, data entry operators, anthropometrists and drivers. The field staff for LSMS surveys is large (relative to the sample size) due to the high supervisor to interviewer ratios (typically 1 to 3), the size of the questionnaire and the use of direct informants which limits the number of households that can be visited per day, the inclusion of data entry in the field teams, and ensuring the mobility and integrity of the team by providing each with transport. Other salaries are for office staff: typically these are staff of the NSO although a project coordinator may be contracted from outside if needed. 28. The second largest cost component is for materials and equipment. This covers computers and vehicles (either purchase or rental), maintenance, as well as other office equipment. This is the component that varies the most widely based on existing infrastructure in the NSO or implementing agency. Also, funding sources can increase costs if vehicle purchases are prohibited: renting the needed vehicles can sometimes be significantly more expensive. 29. Technical assistance is the third major component of costs. Again, this will vary substantially depending on the existing skills and experience in the implementing agency. Countries carrying out second or third LSMS surveys obviously require much less technical assistance and equipment. Typically the types of skills most needed from technical assistance are sampling, questionnaire design, data entry customization, fieldwork organization and analytic techniques. 30. The costs of an LSMS survey are of course justified if the result truly is better quality data that are used to improve policy. While costly in absolute terms, relative to the magnitude of spending on social policy, LSMS surveys are not expensive. The following section provides evidence from recent LSMS surveys on the quality of LSMS survey data. Examples of quality are given in terms of missing data, usefulness of data for LSMS purposes, internal consistency and design effects.
Base Salaries28%
Per diems & Travel Costs
9%Materials
23%
Consultancy Fees & Travel
18%
Other11%
Contingency10%
Printing & Copying
1%
Household Surveys in Developing and Transition Countries: Design, Implementation and Analysis
14
V. How effective has the LSMS design been on quality?
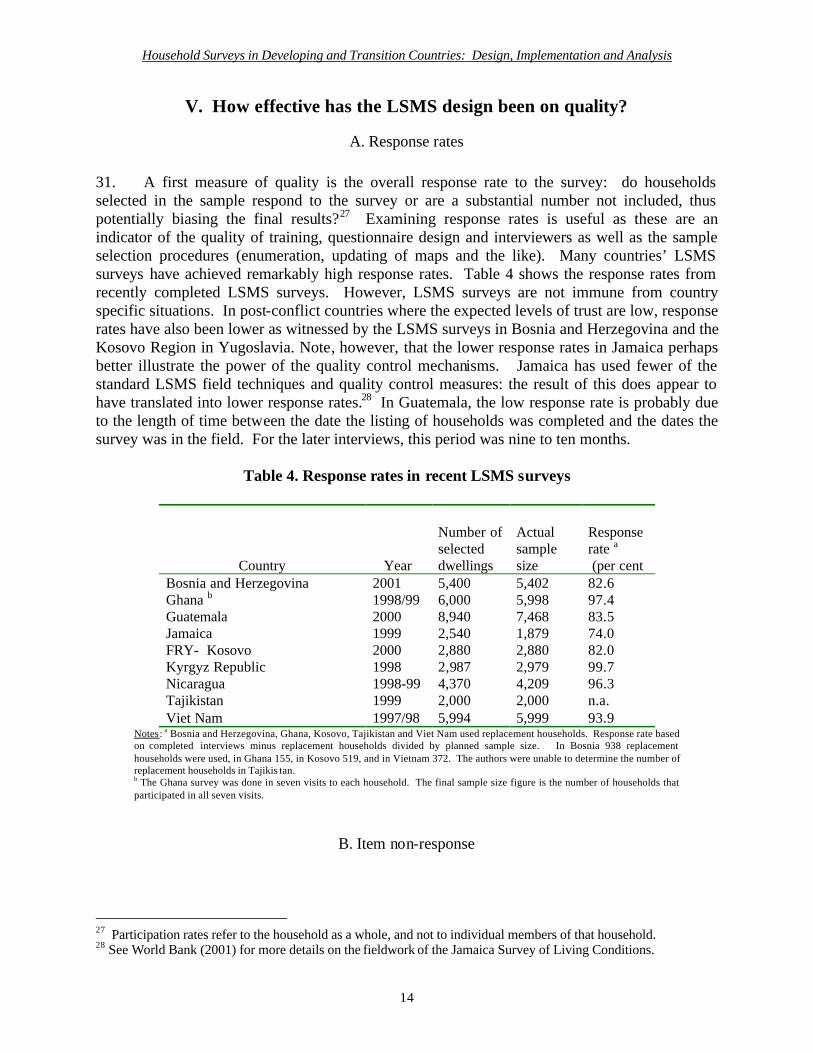
A. Response rates 31. A first measure of quality is the overall response rate to the survey: do households selected in the sample respond to the survey or are a substantial number not included, thus potentially biasing the final results?27 Examining response rates is useful as these are an indicator of the quality of training, questionnaire design and interviewers as well as the sample selection procedures (enumeration, updating of maps and the like). Many countries’ LSMS surveys have achieved remarkably high response rates. Table 4 shows the response rates from recently completed LSMS surveys. However, LSMS surveys are not immune from country specific situations. In post-conflict countries where the expected levels of trust are low, response rates have also been lower as witnessed by the LSMS surveys in Bosnia and Herzegovina and the Kosovo Region in Yugoslavia. Note, however, that the lower response rates in Jamaica perhaps better illustrate the power of the quality control mechanisms. Jamaica has used fewer of the standard LSMS field techniques and quality control measures: the result of this does appear to have translated into lower response rates.28 In Guatemala, the low response rate is probably due to the length of time between the date the listing of households was completed and the dates the survey was in the field. For the later interviews, this period was nine to ten months.
Table 4. Response rates in recent LSMS surveys
Country
Year
Number of selected dwellings
Actual sample size
Response rate a (per cent
Bosnia and Herzegovina 2001 5,400 5,402 82.6 Ghana b 1998/99 6,000 5,998 97.4 Guatemala 2000 8,940 7,468 83.5 Jamaica 1999 2,540 1,879 74.0 FRY- Kosovo 2000 2,880 2,880 82.0 Kyrgyz Republic 1998 2,987 2,979 99.7 Nicaragua 1998-99 4,370 4,209 96.3 Tajikistan 1999 2,000 2,000 n.a. Viet Nam 1997/98 5,994 5,999 93.9
Notes: a Bosnia and Herzegovina, Ghana, Kosovo, Tajikistan and Viet Nam used replacement households. Response rate based on completed interviews minus replacement households divided by planned sample size. In Bosnia 938 replacement households were used, in Ghana 155, in Kosovo 519, and in Vietnam 372. The authors were unable to determine the number of replacement households in Tajikis tan. b The Ghana survey was done in seven visits to each household. The final sample size figure is the number of households that participated in all seven visits.
B. Item non-response
27 Participation rates refer to the household as a whole, and not to individual members of that household. 28 See World Bank (2001) for more details on the fieldwork of the Jamaica Survey of Living Conditions.

Household Surveys in Developing and Transition Countries: Design, Implementation and Analysis
15
32. Calculating the percentage of item non-response is another indicator of quality. A review of this issue in the three earliest LSMS surveys showed item non-response to be fairly insignificant (less than 1 per cent of responses were missing for 10 key variables).29 It is also of interest to compare rates of item non-response in LSMS surveys to that obtained in other surveys that do not have the same quality control mechanisms. This is not always possible but one, small, comparison is given here. A 1998 review of labor force surveys in Latin America compiled information on the frequency of missing values for labor income of salaried workers, self-employed individuals and employers.30 Three of the countries cited also carried out LSMS surveys within a year of the labor force surveys. As can be seen in Table 5, in these countries, the LSMS surveys do substantially better than, or at least as well as labor force surveys, for most of the comparisons. While only a limited example, this appears to demonstrate the positive effect of the LSMS investment in quality controls.
Table 5. Frequency of missing income data in LSMS and LFS
Country Survey Per cent of missing income data for: Salaried
workers Self-employed
Employers
Per cent of direct informants
Ecuador LFS, 1997 6.3 6.7 13.2 n.a. LSMS, 1998 3.6 8.5 6.5 96.5 Nicaragua Urban LFS, 1997 1.0 1.4 5.7 n.a. LSMS, 1998 1.1 1.0 4.7 84.6 Panama LFS 1997 2.9 36.2 26.0 n.a. LSMS, 1996 1.0 3.5 8.4 98.7 Source: The information on Labor Force Surveys is from Feres (1998); from the LSMS surveys calculations by authors. Note: For Nicaragua, in the 1998 LSMS survey, the percentage of missing data does not include zeros as the interviewer instructions had interviewers coding a zero response here if the person did not receive income in cash but in-kind. In this category are subsistence farmers whose income is calculated elsewhere in the module in agricultural production.
33. Instead of just toting up the number of missing responses, perhaps a better overall test of the quality of the data is the extent to which it can be used. For LSMS surveys, that have a main goal of measuring welfare, it is most relevant to determine the extent to which the collected data are adequate for this purpose. The most commonly used money-metric measure of welfare, for its theoretical and practical advantages, is total household consumption. This is a complex measure that requires data from a range of modules in the questionnaire: both at the individual and household levels. Typically consumption data are taken from the housing module (use value of housing, utility and other housing expenditures), durable goods module (to calculate the value of the flow of services), education module (private, out-of-pocket expenditures), food consumption module (purchased, home produced and gift foods), agricultural module (for home-produced food consumed by household if not captured in the food consumption module) and from non-food expenditure modules (for items ranging from soap to household furnishings). 29 Grosh and Glewwe (1995). 30 Feres (1998). While income is not the focus of either labor force surveys or the LSMS surveys, income information is collected in similar fashions in the two types of surveys.

Household Surveys in Developing and Transition Countries: Design, Implementation and Analysis
16
34. Table 6 shows the percentage of households where such a consumption aggregate was able to be constructed. For most of the surveys, very few households had to be dropped from the analysis due to lack of data. The exception is Ghana. It is not clear what the main problem was in the case of Ghana 1998: the sample was a bit larger than others but not as dramatically so as in the Guatemala case. The fact that some food consumption data were collected via a diary (unlike the standard LSMS methodology) may have been a factor: unfortunately the documentation on this survey does not address this issue.31
Table 6. Households with complete consumption aggregates: Examples from recent LSMS surveys
Households with complete consumption aggregate
Country
Year
Final sample size (per cent)
Bosnia and Herzegovina
2001 5,402 99.9
Ghana 1998/99 5,998 87.7 Guatemala 2000 7,468 97.4 Jamaica 1999 1,879 99.8 FRY: Kosovo 2000 2,880 100.0 Kyrgyz Republic 1998 2,979 99.4 Nicaragua 1998-99 4,209 96.0 Tajikistan 1999 2,000 100.0 Viet Nam 1997/98 5,999 100.0
C. Internal consistency checks
35. Ensuring the internal consistency of the data is also crucially important. The complexity of the survey instruments makes it difficult for interviewers to monitor this during the interview process. This is the reason so many of the quality controls address consistency issues. Three examples of internal consistency checks are shown in Table 7. The first check is how well the community questionnaire was able to be linked to the household data. The second check shows the percentage of children of pre-school or school age, as identified in the roster, that have complete information on their (pre-) schooling. The third check concerns whether those identified as self-employed in the labor force module have reported details of their activities in the non-agricultural household business module.
31 Ghana Statistical Service (2000).

Household Surveys in Developing and Transition Countries: Design, Implementation and Analysis
17
Table 7. Internal consistency of the data: successful linkages between modules (per cent) Correct link between:
Country
Household survey and community
survey (1)
Roster and
education module (2)
Employment module and non-agricultural household business
module (3)
Pre-school
Primary
Bosnia and Herzegovina n.a. 99.5% 99.8% 90.4% Ghana 99.9% n.a. 96.5% 70.2% Guatemala 100% 100% 100% 93.0% Jamaica n.a. n.a. 96.4% n.a. FRY- Kosovo 100% n.a. 100% 58.6% Kyrgyz Republic 100% 86.5% 98.4% 93.1% Nicaragua n.a. 97.9% 97.5% 62.0% Tajikistan 100% n.a. 99.9% n.a. Viet Nam 100% n.a. 99.6% 98.1%
Notes: Table refers to per cent of correct linkages. Bosnia and Herzegovina, Jamaica and Tajikistan did not include community questionnaires. Jamaica, Kosovo, Tajikistan and Viet Nam did not include a special module on pre-school. Jamaica and Tajikistan did not collect information on non-agricultural household businesses. (1) Comparison of the households to the communities in which they are located. (2) Comparison of the age variable from the roster and the presence of individuals in the education module. (3) Comparison of those indicating they were self-employed in the Employment module and the presence of information in the Non-agricultural Household Business module.
36. As can be seen in the table, the first two checks show data quality to be quite high. The third check does, however, show problems. This indicates a lack of appropriate controls in the field between the two visits to the households. Only in the case of Vietnam was an explicit question included for the interviewer in the second visit to ensure that this module was completed. Clearly a similar check is needed for all surveys.
D. Sample design effects
37. A final criterion for judging LSMS surveys concerns the sample size and design. When using data from any household survey based on a complex design with multiple stages, stratification and clustering, the true variance of the estimates is calculated by taking into account these features of the sample design as well as weighting. The design effect (deff) is the ratio of the true variance of an estimate, taking into account the multi-stage sample, to the variance of the estimate that would have been obtained if a simple random sample of the same size had been used.32 Thus, a deff of 1 indicates that there has been no loss in precision in the sample estimates due to using a multi-stage design, while a deff greater than 1 shows that using the multi-stage design has lowered the efficiency of the sample and the precision of the estimates. 38. As part of the LSMS activities, a review of the design effects on key variables and indicators was carried out on some of the earlier LSMS surveys. The review, carried out by Temesgen and Morganstein (2000), highlights several key points that must be taken into account
32 See Annex 3 of this paper or other papers in this volume for additional information on sampling design issues.

Household Surveys in Developing and Transition Countries: Design, Implementation and Analysis
18
when using LSMS survey data (and data from other households surveys using multi-stage sample designs of course) and designing appropriate samples.33 The main point is that the multi-topic nature of the LSMS surveys complicates the process of designing an efficient sample. Design effects vary widely among both individual level and household level variables as can be seen in Table 8, taken from Temesgen and Morganstein’s work. In short, minimizing the deff of one variable may well lead to increasing it for other variables. Second, the tradeoff between non-sampling and sampling errors is clear. Deffs can be high in LSMS surveys. The table indicates that, to the extent that LSMS surveys are used to produce means, ratios and point estimates, it is critically important that the sample design be taken into account and care paid to the proper use of the data.
Table 8. Examples of design effects in LSMS surveys
Country Per capita consumption Access to health care Unemployment rate All Rural Urban All Rural Urban All Rural Urban Ivory Coast 1988 6.7 3.6 5.5 6.3 5.7 2.2 7.0 4.4 5.7 Ghana 1987 1.9 3.1 1.8 2.9 3.0 5.0 1.7 1.5 2.0 Ghana 1988 3.2 2.9 2.9 2.2 2.5 3.6 1.3 1.1 1.4 Pakistan 1991 1.6 1.1 2.6 5.0 4.0 5.2 4.6 4.7 2.5
Source: Temesgen and Morganstein (2000).
39. While not specific to LSMS surveys, it is interesting to note that the design effect varies not just among variables, but also geographically within a country for the same variable and for a specific variable over time. And finally, the design effects can be hugely different between countries. A careful review of intra-class correlations and design effects in previous surveys, when these exist, will help in refining the design for future LSMS surveys. And, again, the sampling design used means that care must be taken in presenting and interpreting result of LSMS and other surveys using multi-stage samples.
VI. Uses of LSMS survey data 40. Over the years LSMS survey data have been used for a wide variety of policy and research purposes. Some of these have been chronicled elsewhere34 and an extensive bibliography, albeit partial, of papers and reports written based on LSMS survey data can be found on the LSMS web site for the interested reader. That bibliography shows the scope of LSMS data for analytic purposes but the uses of the data are certainly not limited to what is found there. On-going research and questionnaire revisions and amendments mean that the range of uses is constantly changing. Instead of trying to be comprehensive about the uses of LSMS data, it is, perhaps, worth looking at one particular policy use of LSMS data, targeting of government programs to the poor for example, to demonstrate the variety of ways the data have been used and combined with other data.
33 Several of the tables from the Temesgen and Morganstein report are included in Annex 3 of this paper. 34 See Grosh (1997) for example.

Household Surveys in Developing and Transition Countries: Design, Implementation and Analysis
19
41. First, an early example from Jamaica shows how a simple analysis can provide a governme nt with clear information on the effects of targeting the poor using alternate programs. In the Jamaica case, as outlined in Grosh (1991), three major nutrition programs existed: generalized food subsidy, food stamps and school feeding programs. The LSMS survey in Jamaica made it possible to quantify the value of the benefits received by poor households for the three programs and showed that the food subsidy, unlike the other two programs, was highly regressive. This analysis was one element in the decision to eliminate subsidies and to increase resources to the other two programs. 42. A second targeting tool that can be created using LSMS survey data is for geographic targeting to poor areas. By taking advantage of census data, the LSMS survey data can be used to construct poverty maps for allocating resources and programs to poor areas.35 The method relies on the existence of an LSMS survey and census data within a few years of each other.36 The LSMS survey provides a solid welfare measure (total household consumption) but, due to the small sample size, the ability to disaggregate the resulting poverty data is limited to only urban and rural areas, and a few large regional breakdowns of the country. Clearly this does not meet all the needs of governments trying to focus resources on poor areas nor does it help, in decentralized systems, in the allocation of resources to local government. Additionally, within large regions there is often a great deal of heterogeneity in terms of poverty levels of the population that goes undetected in a small sample household survey. 43. To be able to provide poverty information at smaller levels of aggregation requires a data set with a sample size several orders of magnitude larger than an LSMS one. The largest data set in any country is, of course, the population census. But, because it covers the whole population, a census collects very limited information from each household and is, usually, only done once every ten years. Thus it is not possible to construct an adequate poverty measure from the Census. An innovative vein of work that allows survey data and census data to be linked is being tested. This technique takes advantage of the LSMS-provided welfare measure and the census-provided coverage. The method requires estimating poverty in the LSMS survey data using a vector of variables found in both the census and the survey. The parameters estimated from this are then used with the census data to predict the probability of being poor for each household and creating head count ratios for small areas using the census data. The resulting poverty maps provide a tool for government in the allocation of resources. Examples of such poverty maps can be found in Ecuador, Guatemala, Madagascar, Nicaragua, Panama and South Africa. 44. A third example of the use of LSMS survey data for improving the targeting of social programs is from an evaluation of the Emergency Social Investment Fund (FISE after its Spanish acronym) in Nicaragua. The evaluation addressed issues of targeting as well as the impact of the FISE investments in communities in the areas of water, latrines, education, health, and sewerage.
35 For more on the methodology of creating poverty maps using the welfare measure from surveys and linking to census data see: Hentschel, J., Lanjouw J., Lanjouw, P. and Poggi, J. (2000); Elbers, C., Lanjouw, J., and Lanjouw, P., (2001) and (2002); Elbers, C., Lanjouw, J.O., Lanjouw, P. and Leite, P.G. (2001) and Demombynes, G., Elbers, C., Lanjouw, J., Lanjouw, P., Mistiaen, J. and Özler, B. (2001). Further work is being done on using this technique to link two surveys together, however, estimating correct standards errors from such a linkage is impossible. 36 Other household surveys can be used as long as they provide a robust money-metric measure of welfare such as total consumption or total income.

Household Surveys in Developing and Transition Countries: Design, Implementation and Analysis
20
37 In this case, a national level LSMS survey was planned. An over-sample of households in FISE project areas was included as well as from similar communities without FISE programs. The other source of data was project and administrative records that were used to evaluate the administrative costs of the project. 45. The over-sample of households in FISE and similar non-FISE communities allowed the creation of both control and treatment groups to measure the impact of the FISE investments and the effectiveness of their targeting. In addition, the national sample from the LSMS survey was used to create a second control group (using propensity matching techniques) which increased the strength of scope of the evaluation. The effectiveness of targeting was carried out both at the community level (were FISE investments progressive in terms of the communities where projects were carried out?) and at the individual level (within communities with FISE projects, were the poorer segments of the population more or less likely to benefit from the FISE investment?). 46. The evaluation was able to show, with statistically significant results, the overall efficiency of targeting and allowed the main project types to be assessed on targeting criteria. The study showed that sewerage projects were highly regressive, while latrines and primary education projects were systematically progressive, reaching the 17 per cent of the population classified as extremely poor. The immediate result of the evaluation was the suspension of sewerage projects and a decision to focus on improving the outreach to, and investments in, extremely poor communities. The cost of this very complex evaluation of the FISE project cost represented one per cent of the investments made by the project up to the date when the evaluation was done.
VII. Conclusions 47. The results of LSMS surveys have demonstrated the value of the approach. Data have been used by governments to understand the effect of present policies, to redesign policies and to better target resources to groups and areas. The emphasis on quality has paid off in terms of lower errors and greater usefulness of the data. There are, however, tradeoffs involved with this approach. Costs are relatively high, the smaller sample size limits the level of disaggregation that can be obtained, and the up-front planning and design is time consuming. But, data can be produced rapidly once work is begun and the links with policy makers increases the use of the data. 48. Clearly, there are advantages of incorporating LSMS surveys in a country’s system of household surveys. How often such a survey is needed will depend on several factors. First, the analytic needs of the country should drive the decision to carry out one or multiple surveys over time. While many government programs can be evaluated with cross-sectional data (targeting, incidence, even impact using propensity matching score techniques), repeated cross-sections and panel data sets are needed for other types of analysis of changes over time and the impact of policies and events.
37 See, World Bank (2000) for details on the goals of the evaluation, the methods employed and the results.

Household Surveys in Developing and Transition Countries: Design, Implementation and Analysis
21
49. A second consideration, in terms of the frequency of implementing LSMS surveys is that of analytic capacity in the country. Data need to be analyzed as an input to policy makers and so that each future round of the survey is improved based on the previous round’s findings. If the data cannot be analyzed quickly, much of the investment in multiple rounds of the survey may be lost. In such a case it may make sense to leave a significant time gap (three years for example) between surveys. 50. Finally, budget and logistical issues are often as important as substantive ones in deciding how often or when to do specific surveys. Thus, the frequency with which any survey is done will be a balancing act between the importance of its results and those of other surveys. Also, it is important to remember that no one source of data is adequate for all needs. Administrative records, project management information system (MIS) data, as well as a system of household surveys are required by governments for both macro and micro-economic policy. In conjunction with an overall system of surveys in a country, LSMS surveys can provide a substantive improvement in understanding how a government’s policy and spending affects the lives of its population.
Household Surveys in Developing and Transition Countries: Design, Implementation and Analysis
22
References Blank, Lorraine and Margaret Grosh, 1999. “Using Household Surveys to Build Analytic
Capacity”, The World Bank Research Observer, Vol. 14, No. 2, August: pp 209-227. Demombynes, Gabriel, Chris Elbers, Jenny Lanjouw, Peter Lanjouw, Johan Mistiaen and Berk
Özler, 2001. 'Producing an Improved Geographic Profile of Poverty: Methodology and Evidence from Three Developing Countries'. WIDER Discussion Paper No.2002/39
Elbers, C., J. Lanjouw and P. Lanjouw, 2003. “Mico-Level Estimation of Poverty and Inequality”
in Econometrica, Vol. 71, No. 1: pp. 355-364. _____. (2002) Micro-level Estimation of Welfare. Policy Research Working Paper no. 2911, The
World Bank, Washington D.C. Elbers, C., J. Lanjouw, P. Lanjouw and P.G. Leite, 2001. “Poverty and Inequality in Brazil: New
Estimates from Combined PPV-PNAD Data”, processed. Feres, Juan Carlos, 1998. “Falta de respuesta a las preguntas sobre el ingreso: su magnitud y
efectos en las Encuestas de Hogares en América Latina” in Conference Proceedings from the 2o Taller Regional del MECOVI, Buenos Aires, November .
Ghana Statistical Service, 2000. “Ghana Living Standards Survey, Round Four (GLSS 4) 1998-
99: Data User’s Guide”, Accra. Grosh, Margaret, 1991. “ The Household Survey as a Tool for Policy Change: Lessons from the
Jamaican Survey of Living Conditions”, Living Standards Measurement Study Working Papers, No. 80, The World Bank, Washington, D.C.
_____ (1997). “The Policymaking Uses of Multi-topic Household Survey Data: A Primer”, The
World Bank Research Observer, Vol. 12, No. 2: pp. 137-60. Grosh, Margaret and Paul Glewwe, 1995. “A Guide to Living Standards Measurement Study
Surveys and Their Data Sets”, Living Standards Measurement Study Working Paper No. 120, The World Bank, Washington, D.C.
_____, eds. (2000). Designing Household Survey Questionnaires for Developing Countries:
Lessons from 15 Years of the Living Standards Measurement Study Surveys. The World Bank: Washington, D.C.
Grosh, Margaret and Juan Muñoz, 1996. “A Manual for Planning and Implementing the Living
Standards Measurement Study Survey”, Living Standards Measurement Study Working Paper 126, The World Bank, Washington D.C.

Household Surveys in Developing and Transition Countries: Design, Implementation and Analysis
23
J. Hentschel, J. Lanjouw, P. Lanjouw and J. Poggi, J., 2000. “Combining Household Data with Census Data to Construct a Disaggregated Poverty Map: A Case Study of Ecuador”, World Bank Economic Review, 14(1), January.
Kish, Leslie, 1965. Survey Sampling. New York: John Wiley and Sons, Inc. Pradhan, Menno and Martin Ravallion, 2000. “Measuring Poverty Using Qualitative Perceptions
of Consumption Adequacy,” Review of Economics and Statistics, 82: 462-471. Ravallion, Martin and Michael Lokshin, 2001. “Identifying Welfare Effects Using Subjective
Questions,” Economica, 68: 335-357. _____ (2002) “Self-Rated Economic Welfare in Russia,” European Economic Review, in press. Ryten, Jacob, 2000. "The MECOVI Program: Ideas for the Future: A mid-term evaluation,"
consultant to The Inter-American Development Bank, December . Skinner, C.J., D. Holt and T.M.F. Smith, 1989. Analysis of Complex Surveys. Chichester: John
Wiley & Sons. Temesgen, Tilahun and David Morganstein, 2000. “Measurement of Sampling Errors:
Application to selected variables in LSMS Surveys,” The World Bank, processed. The World Bank, 2000. “Nicaragua: Ex-Post Impact Evaluation of the Emergency Social
Investment Fund (FISE)”, Report No. 20400-NI, Washington, D.C. _____ (2001). “Jamaica Survey of Living Conditions (JLSC) 1988-98, Basic Information”,
Development Economics Research Group, processed. _____ (2002a). “Basic Information Document: Bosnia and Herzegovina Living Standards
Measurement Study Survey”, Development Economics Research Group, processed. _____ (2002b). “Guatemala Poverty Assessment”, Report No. 24221-GU, Washington, D.C. _____ (2002c). “The 1993 Nicaragua Living Standards Measurement Survey: Documentation”,
Development Economics Research Group, processed.

Household Surveys in Developing and Transition Countries: Design, Implementation and Analysis
24
Annex 1. List of Living Standard Measurement Study surveys
Table A.1
Country
Year Household
count Albania 1996 1,500 Albania 2002 3,600 Armenia 1996 4,920 Azerbaijan 1995 2,016 Bolivia 1999 n.a. Bolivia 2000 5,032 Bolivia 2001 n.a. Bosnia and Herzegovina
2001 5,402
Brazil 1996-97 4,940 Bulgaria 1995 2,500 Bulgaria 1997 2,317 Bulgaria 2001 2,633 Cambodia 1997 6,010 China – Hebei and Liaoning
1995 & 1997 780
Côte d'Ivoire 1985 1,588 Côte d'Ivoire 1986 1,600 Côte d'Ivoire 1987 1,600 Côte d'Ivoire 1988 1,600 Ecuador 1994 4,500 Ecuador 1995 5,500 Ecuador 1998 5,801 Ecuador 1998-99 5,824 Gambia 1992 1,400 Ghana 1987-88 3,200 Ghana 1988-89 3,200 Ghana 1991-92 4,565 Ghana 1998-99 5,998 Guatemala 2000 7,276 Guinea 1994 4,705 Guyana 1992-93 5,340 India – Uttar Pradesh and Bihar
1997-98 2,250
Jamaica 1988-2000 (annual) 2,000-7,300 Kazakhstan 1996 1,996 Federal Republic of Yugoslavia- Kosovo
2000 2,880
Kyrgyz Republic 1993 2,000 Kyrgyz Republic 1996 (Spring) n.a. Kyrgyz Republic 1996 (Fall) 1,951 Kyrgyz Republic 1997 2,962 Kyrgyz Republic 1998 2,979

Household Surveys in Developing and Transition Countries: Design, Implementation and Analysis
25
Madagascar 1993 4,504 Malawi 1990 6,000 Mauritania 1987 1,600 Mauritania 1989 1,600 Mauritania 1995 3,540 Morocco 1991 3,323 Morocco 1998 n.a. Nepal 1996 3,373 Nicaragua 1993 4,200 Nicaragua 1998-99 4,209 Nicaragua 2001 4,290 Niger 1989 1,872 Niger 1992 2,070 Niger 1995 4,383 Pakistan 1991 4,800 Panama 1997 4,945 Papua New Guinea 1996 1,396 Paraguay 1997-988 4,353 Paraguay 1999 5,101 Paraguay 2000-01 8,131 Peru 1985 5,120 Peru (Lima only) 1990 1,500 Peru 1991 2,200 Peru 1994 3,500 Russia * 1992 6,500 South Africa 1993 9,000 Tajikistan 1999 2,000 Tanzania - Kagera 1991-1994 840 Tanzania - National 1993 5,200 Tunisia 1995/96 3,800 Uganda 1992 9.929 Viet Nam 1992-93 4,800 Viet Nam 1997-98 5,999 * The 1992 Russian Longitudinal Monitoring Survey was done using World Bank financing. Subsequent surveys did not have World Bank participation. For more information see the Carolina Population Center web site: http://www.cpc.unc.edu/projects/rlms/rlms_home.html

Household Surveys in Developing and Transition Countries: Design, Implementation and Analysis
26
Annex 2. Budgeting an LSMS survey
As noted in the text, no two LSMS surveys are exactly alike, nor are any NSOs or the costs associated with salaries, transportation, equipment et al. in different countries. Thus is it impossible to provide information on how much an LSMS survey will cost in a specific place at a specific time. In the text is an example of the share of different types of costs in the total cost of a survey. The following is a small exercise designed to help one get started on budgeting. It simply provides a quick guide on how to estimate the most basic salary costs for the fieldwork. Using this guide with real costs in the country of interest, one can get a, very rough, approximation of what an LSMS survey might cost.
On average, given the complexity of the survey instrument and the use of direct informants, an interviewer can complete two half-interviews per day (refer to Figure 2 in the text on how the survey is implemented). In other words, he or she can complete one round of the survey in two households. If we assume a six-day work week (whether the ‘day off’ is taken every week or distributed in some way per month), an interviewer can complete 24 households per month.
Let us assume that a sample of 4,000 households is needed. If each interviewer can complete 24 households a month, a total of 167 interviewer months are needed to carry out interviews of 4,000 households. If the fieldwork takes place over a 12-month period, then 14 interviewers are needed. For each pair of interviewers one supervisor, one data entry person and a driver and car are needed. So the total fieldwork staff (not counting regional supervision by staff of the NSO) is:
14 interviewers 7 supervisors 7 data entry operators 7 drivers
If salaries and costs are as follows, then the salary costs of the fieldwork portion of the
survey will cost:
Item Cost per individual per month No. months Cost 14 interviewers 500 13 91,000 7 supervisors 575 13.5 54,338 7 data entry operators 525 14 51,450 7 drivers 300 13 27,300 Rough estimate of field salary costs
224,088
Note: While the fieldwork takes only 12 months, an extra month is added to cover cost of the training (where field staff are usually paid something) and/or any delays in the survey work. Data entry operators are often kept on an extra month to finalize and clean the data set if needed.
According to Figure 3 in the main body of this chapter, fieldwork staff costs represent
three-quarters of the total salary costs of the survey, which in turn represent 28 per cent of the

Household Surveys in Developing and Transition Countries: Design, Implementation and Analysis
27
survey costs. So doing the simple calculation, in this case, a rough estimate of the cost of the survey would be 1,067,086.
Clearly this number is only a very rough approximation. Details on other costs such as those for technical assistance, et al. are needed. But this simple starting exercise can be useful to begin the process of budgeting an actual survey. The reader is referred to chapter 8 of Grosh and Munoz (1996) for a detailed presentation on how to design a realistic budget for an LSMS survey.

Household Surveys in Developing and Transition Countries: Design, Implementation and Analysis
28
Annex 3. The effect of sample design on precision and efficiency in LSMS surveys38
I. Introduction
Other chapters in this volume provide detailed information on sampling issues and
particularly the effect of complex or multi-stage sampling designs on the variance of the estimates obtained. This so-called design effect is common to all surveys which do not use a simple random sample, such as the LSMS surveys. The design effect is one part of overall sampling error: the difference in an estimate obtained from a multi-stage cluster design and one that would be obtained using a simple, random sample design. In this Annex we summarize the key issues and show the actual impact of sample design on several LSMS surveys.
II. Computation of sampling errors, design effects and related components
In a simple random sample, all sampled units have an identical and independent chance of selection. Simple random sampling is almost never used for household surveys, however, for logistic and cost concerns. Instead, as in the LSMS surveys, more complex, multi-stage sample designs are used that incorporate stratification and clustering. This affects the calculation of the variance of the estimates and the efficiency of the sample itself. To compute sampling errors for sample designs that are implemented in more than one stage, it is necessary to know the variables that identify the strata, primary sampling units (PSUs) and the weighting procedures (if any) used in the design. Once these variables are identified, a number of statistical packages can be used to compute the needed measures.39
The sampling error measures reported here for selected household and individual level variables in LSMS surveys include the standard error (SE) which is computed by taking into account the complexity of the sample design, the coefficients of variation (CV--%), the sample size (n), the design effect (DEFF), the intra-class correlation coefficient or Roh (ρ), the lower and upper boundaries of the confidence intervals (CI), and the effective sample size (EFFn). A brief summary of these terms is provided and then the results from LSMS surveys are presented.
• Standard Error (SE). The standard error reported in this exercise refers to the estimate of sampling error that is computed by taking into consideration the complexity of the sample design, such as relative probabilities, stratification and clustering, as opposed to a standard error that assumes a SRS.
• The Design Effect (DEFF). The design effect is the ratio of the true sampling variance of
an estimate (accounting for the sample design information as defined above) to the variance of the estimate which would have been obtained if an SRS sample of the same size were selected. It takes the variances of the estimates derived from the hypothetical
38 The section draws heavily on previous work by Temesgen and Morganstein (2000). 39 The statistical software WESVAR was used in the computations here. Some of the other programs that can be used to estimate sampling variances and a variety of related statistics for complex survey designs include: CENVAR, CLUSTERS, Epi-Info, PC CARP, SUDAAN, VPLX and STATA. Some of these software packages can be downloaded from the Worldwide Web for free.

Household Surveys in Developing and Transition Countries: Design, Implementation and Analysis
29
SRS as a benchmark against which to gauge the variances of the estimators derived from the actual designs. Note that a design effect equal to one means that the complexity of the sample design had no impact on the variance of the estimate compared to an SRS design, while a value greater than one (DEFF >1) indicates that the design has increased the variance and thus lowered the precision of the estimate.
• Roh (Intra-class Correlation Coefficient, ρ). Roh is defined as the degree of homogeneity
within clusters for a given variable of interest, that is, the degree to which the values of a particular variable are homogeneous within PSUs relative to their overall variability in the whole population. Estimates of roh measure the tendency of households (or persons) within the same PSU to have the same value of any given characteristic of interest. Roh is almost always positive (as long as DEFF>1), normally ranging from 0 (no intra-class correlation) to 1 (perfect correlation where all households or persons in the same PSU are exactly alike). For a given variable and sample design, the value of DEFF tends to increase as cluster size and roh increase. Using a computed value of DEFF an estimate of Roh can be computed as: Roh(ρ) = (DEFF-1)/( β -1) where β is the average cluster size of the sample.
• Effective Sample Size (EFFn). This gives the number of observations that would yield an
equivalent level of precision from a SRS design - in other words, the number of households or individuals that would be required in a SRS to provide the same level of precision obtained with the actual sample design. It is determined simply as a ratio between the actual survey sample size (n) and the design effect (DEFF). For example, an estimate from a complex sample design of 1,700 households or individuals with a design effect of 1.7 is only as precise as an estimate from a simple random sample of 1,000 households or individuals. The benefits of the complex sample design in this case in terms of the amount of time and money it saves should be weighed against the analytical cost of effectively losing 700 observations.
III. Standard errors, DEFF and Roh computed from LSMS surveys
One important aspect of calculating sampling errors for survey variables is to compare
the efficiency (precision) of the sample designs with each other; and with the precision that would have been yielded by a hypothetical simple random sample of the same size. In addition to indicating the reliability of existing survey data, such an exercise can also be equally important in helping analysts to evaluate how well a particular design has performed and provides information for the design of future surveys The three sets of tables below compare the DEFFs and related measures for several variables to show the differences which exist (i) within a country across different variables; (ii) within a country over time ; and (iii) between countries.40
As shown in Table A.2., within a country, the same survey will generate substantially different DEFFs for different variables. The table is based on data from the 1987 LSMS done in Ghana and variables constructed at the household and individual level. As can be seen, for some variables, such as per capita total expenditure, where the intra-class correlation is low, the design
40 For the full report, see Temesgen and Morganstein (2000).

Household Surveys in Developing and Transition Countries: Design, Implementation and Analysis
30
effect is not high (1.9). But for variables such as access to sanitation and water, where intra-class correlations are high (infrastructure tends to be concentrated in specific spatial areas), the design effects are substantial (7.8 and 8.0, respectively. And these design effects are higher when one looks only at urban or rural areas.
Table A.2. Variation of design effects by variable, Ghana, 1987 Conf. Interval
Variable Estimate Std.
Error CV(%) Lower Upper N DEFF EFF_n Roh (p)
ALL OBS. 0.267 0.019 7.265 0.229 0.305 3,138 6.034 520 0.300 Rural 0.078 0.022 28.744 0.034 0.121 2,023 14.063 144 0.787
Access to electricity
Urban 0.611 0.041 6.714 0.530 0.691 1,115 7.888 141 0.403 ALL OBS. 4.940 0.083 1.682 4.777 5.103 3,136 2.089 1,501 0.065 Rural 5.147 0.097 1.877 4.958 5.336 2,022 1.735 1,165 0.044
Household size
Urban 4.565 0.165 3.615 4.241 4.888 1,114 3.291 339 0.134 ALL OBS. 0.591 0.024 4.018 0.544 0.637 3,138 7.315 429 0.376 Rural 0.747 0.033 4.393 0.683 0.811 2,023 11.520 176 0.634
Land ownership
Urban 0.308 0.035 11.413 0.239 0.376 1,115 6.453 173 0.319 ALL OBS. 82745.2 1902.2 2.3 79017.1 86473.4 3,104 1.883 1,648 0.053 Rural 70908.1 2526.4 3.6 65956.3 75859.8 2,001 3.100 646 0.127
Per capita total expenditure
Urban 104219.5 3702.1 3.6 96963.6 111475.4 1,103 1.759 627 0.044 ALL OBS. 56779.3 1309.2 2.3 54213.2 59345.3 3,104 1.927 1,611 0.055 Rural 52382.3 1777.9 3.4 48897.6 55867.0 2,001 2.577 776 0.095
Per capita food expenditure
Urban 64756.0 2147.9 3.3 60546.2 68965.8 1,103 1.580 698 0.034 ALL OBS. 0.019 0.003 16.647 0.013 0.026 3,135 1.724 1,818 0.043 Rural 0.010 0.003 29.044 0.004 0.016 2,020 1.704 1,185 0.042
Safe garbage disposal
Urban 0.037 0.009 23.481 0.020 0.054 1,115 2.347 475 0.079 ALL OBS. 0.590 0.025 4.159 0.542 0.638 3,135 7.808 401 0.405 Rural 0.659 0.034 5.091 0.593 0.725 2,020 10.114 200 0.549
Access to safe toilet
Urban 0.465 0.038 8.092 0.392 0.539 1,115 6.357 175 0.313 ALL OBS. 0.395 0.025 6.251 0.347 0.443 3,135 7.994 392 0.416 Rural 0.224 0.031 13.818 0.164 0.285 2,020 11.150 181 0.611
Access to safe water
Urban 0.704 0.046 6.482 0.615 0.793 1,115 11.144 100 0.593 Source: Temesgen and Morganstein (2000). Note: For descriptions of the variables used, see the last page of the chapter.
Table A.3., also based on Ghana, shows that the DEFFs can vary over time as well as by
variable. In this case the difference between the two surveys is only one year and, the basic sample design did not change, but the DEFFs changed with the estimate for access to health becoming substantially more precise (DEFF falling from 5.01 to 3.64) and unemployment’s DEFF also declining, although not as much. The other variable in the table, adult literacy was measured with less precision in the second year of the survey.

Household Surveys in Developing and Transition Countries: Design, Implementation and Analysis
31
Table A.3. Variation in design effects over time, Ghana 1987 and 1988 Ghana, 1987
Conf. Interval Variable Estimate
Std. Error CV(%) Lower Upper N DEFF EFF_n Roh (p)
Female 0.402 0.021 5.103 0.362 0.442 1,339 2.342 572 0.080 Male 0.613 0.018 2.953 0.578 0.649 1,381 1.910 723 0.054
Adult literacy
ALL OBS. 0.509 0.016 3.192 0.477 0.541 2,720 2.875 946 0.112 Female 0.443 0.016 3.625 0.411 0.474 2,756 2.876 958 0.112 Male 0.423 0.017 4.017 0.390 0.457 2,542 3.011 844 0.120
Access to health services
ALL OBS. 0.433 0.015 3.517 0.403 0.463 5,298 5.013 1,057 0.239 Female 0.039 0.004 10.063 0.031 0.047 4,011 1.655 2,424 0.039 Male 0.047 0.004 9.136 0.038 0.055 3,543 1.454 2,437 0.027
Unemployment
ALL OBS. 0.043 0.003 7.666 0.036 0.049 7,554 1.983 3,810 0.059
Ghana, 1988
Conf. Interval Variable Estimate
Std. Error CV(%) Lower Upper N DEFF EFF_n Roh (p)
Female 0.390 0.022 5.526 0.348 0.432 1,289 2.519 512 0.090 Male 0.587 0.020 3.397 0.548 0.626 1,226 2.013 609 0.060
Adult literacy
ALL OBS. 0.486 0.018 3.654 0.451 0.521 2,515 3.179 791 0.130 Female 0.375 0.013 3.558 0.348 0.401 2,921 2.215 1,319 0.072 Male 0.365 0.015 4.118 0.335 0.394 2,606 2.539 1,026 0.092
Access to health services
ALL OBS. 0.370 0.012 3.346 0.346 0.394 5,527 3.635 1,521 0.157 Female 0.036 0.003 9.593 0.029 0.042 3,852 1.307 2,946 0.018 Male 0.034 0.003 9.885 0.027 0.041 3,260 1.123 2,904 0.007
Unemployment
ALL OBS. 0.035 0.003 7.306 0.030 0.040 7,112 1.372 5,185 0.022 Source: Temesgen and Morganstein (2000). Note: For descriptions of the variables used, see the last page of the chapter.

Household Surveys in Developing and Transition Countries: Design, Implementation and Analysis
32
Finally, as expected, DEFFs across countries can vary significantly. Table A.4. shows how surveys in the Ivory Coast and Pakistan produced quite different design effects for the same variables. This is both a function of the differing sample designs used in the countries and the different characteristics of these countries.
Table A.4 Variation in design effects across countries Ivory Coast, 1988
Conf. Interval Variable Estimate
Std. Error CV(%) Lower Upper N DEFF EFF_n Roh (p)
ALL OBS. 0.567 0.031 5.538 0.506 0.629 1,660 6.676 249 0.378 Rural 0.411 0.042 10.212 0.329 0.493 745 5.415 138 0.294
Adult literacy
Urban 0.738 0.024 3.217 0.691 0.784 915 2.661 344 0.111 ALL OBS. 0.417 0.029 6.883 0.361 0.473 1,849 6.260 295 0.351 Rural 0.303 0.034 11.174 0.236 0.369 1,051 5.693 185 0.313
Access to health services
Urban 0.622 0.025 4.078 0.572 0.671 798 2.181 366 0.079 ALL OBS. 0.038 0.007 18.837 0.024 0.052 4,979 6.991 712 0.399 Rural 0.007 0.003 50.457 0.000 0.013 2,529 4.357 580 0.224
Unemployment
Urban 0.081 0.013 16.218 0.055 0.107 2,450 5.679 431 0.312
Pakistan, 1991 Conf. Interval
Variable Estimate Std. Error CV(%) Lower Upper N DEFF EFF_n Roh (p)
ALL OBS. 0.5 0.013 2.5 0.48 0.53 6,834 4.335 1,577 0.222 Rural 0.42 0.017 3.95 0.39 0.45 3,249 3.669 885 0.178
Adult literacy
Urban 0.68 0.018 2.616 0.64 0.71 3,585 5.156 695 0.277 ALL OBS. 0.5 0.012 2.329 0.48 0.52 9,238 5.02 1,840 0.268 Rural 0.46 0.015 3.177 0.43 0.49 4,752 4.048 1,174 0.203
Access to health services
Urban 0.61 0.017 2.74 0.57 0.64 4,486 5.185 865 0.279 ALL OBS. 0.03 0.003 9.735 0.02 0.03 18,232 4.633 3,935 0.242 Rural 0.02 0.003 14.955 0.02 0.03 8,934 4.706 1,898 0.247
Unemployment
Urban 0.03 0.003 8.956 0.03 0.04 9,298 2.539 3,662 0.103 Source: Temesgen and Morganstein (2000). Note: For descriptions of the variables used, see the last page of the chapter.
In summary, the small sample sizes used in LSMS surveys and the multi-stage nature of the samples do have a tradeoff in the precision of sample estimates. For example, the DEFF value for 'Adult Literacy' for all the individuals in the 1988 Cote d'Ivoire data is high at 6.7. This DEFF means that the precision of the estimate with a sample size (n) of 1660 is equivalent to that obtained using a SRS sample of only 249. If we consider the 'urban' individuals only, however, we see that the DEFF is bit lower, although still higher than 1 (2.7), meaning that a sample size of 915 persons has the equivalent precision as one of 344 persons using a SRS. The fact that the DEFF can be quite large and the variation of such effects over variables, time and different countries makes it imperative that analysts recognize and take into account the sample design when using the data and especially when performing statistical tests of significance. It also highlights the difficulties in designing efficient samples for multi-topic household surveys. Trying to lower the DEFF of one variable may very well result in a higher DEFF for others. A

Household Surveys in Developing and Transition Countries: Design, Implementation and Analysis
33
rule of thumb here is to primarily consider the variable(s) of key importance to the survey, to the extent that this is possible.
Description of analysis variables
Individual level
Variable Description Population base Unemployment Adults currently unemployed but available for work and
looking for a job. Persons aged 15-64 years
Access to health Services
Proportion of individuals who were sick during the month prior to the interview and who visited modern health facilities such as hospitals, clinics and health centers (but not midwives, faith healers, or other traditional medical practitioners).
Persons who were sick during the previous month
Adult literacy The proportion of adults who are literate (defined as those who could read a newspaper)
Persons aged 15-24 years
Households level Variable Description Access to safe water The proportion of households that have access to safe drinking water. At the
household level, this variable takes a value of one if the household gets its drinking water from, for example, a tap, a pipe, or a well with a pump. It takes a value of zero if the source of drinking water for the household is considered potentially risky for health, such as water from a river, canal, open well, lake or marsh.
Land ownership The proportion of households that own land. For a household, this variable takes a value of one if the household owns land. Zero otherwise.
Access to electricity The proportion of households that have access to electricity. For a household, this variable takes a value of one if the household uses electricity for light and/or energy. Zero otherwise.