chapter 20 investments options markets: introduction slides by richard d. johnson copyright © 2008...
TRANSCRIPT
CHAPTER 20CHAPTER 20
InvestmentsInvestments
Options Markets: Options Markets: IntroductionIntroduction
Slides bySlides by
Richard D. JohnsonRichard D. Johnson
Copyright © 2008 by The McGraw-Hill Companies, Inc. All rights reservedCopyright © 2008 by The McGraw-Hill Companies, Inc. All rights reserved McGraw-Hill/IrwinMcGraw-Hill/Irwin
Cover image

20- 20- 22
CoverCoverimageimage
Buy - Long Sell - Short Call Put Key Elements
– Exercise or Strike Price
– Premium or Price
– Maturity or Expiration
Option Terminology
20- 20- 33
CoverCoverimageimage
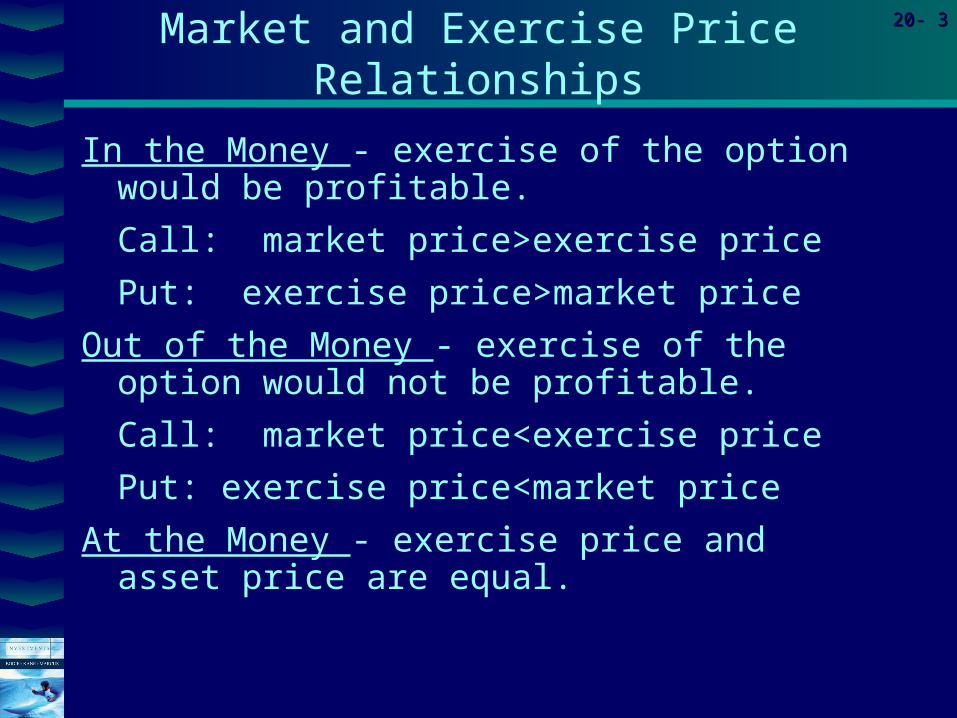
In the Money - exercise of the option would be profitable.
Call: market price>exercise price
Put: exercise price>market price
Out of the Money - exercise of the option would not be profitable.
Call: market price<exercise price
Put: exercise price<market price
At the Money - exercise price and asset price are equal.
Market and Exercise Price Relationships

20- 20- 44
CoverCoverimageimage
American - the option can be exercised at any time before expiration or maturity.
European - the option can only be exercised on the expiration or maturity date.
American vs. European Options
20- 20- 55
CoverCoverimageimage
Stock OptionsIndex OptionsFutures OptionsForeign Currency OptionsInterest Rate Options
Different Types of Options

20- 20- 66
CoverCoverimageimage
Figure 20.1 Stock Options on IBM
20- 20- 77
CoverCoverimageimage
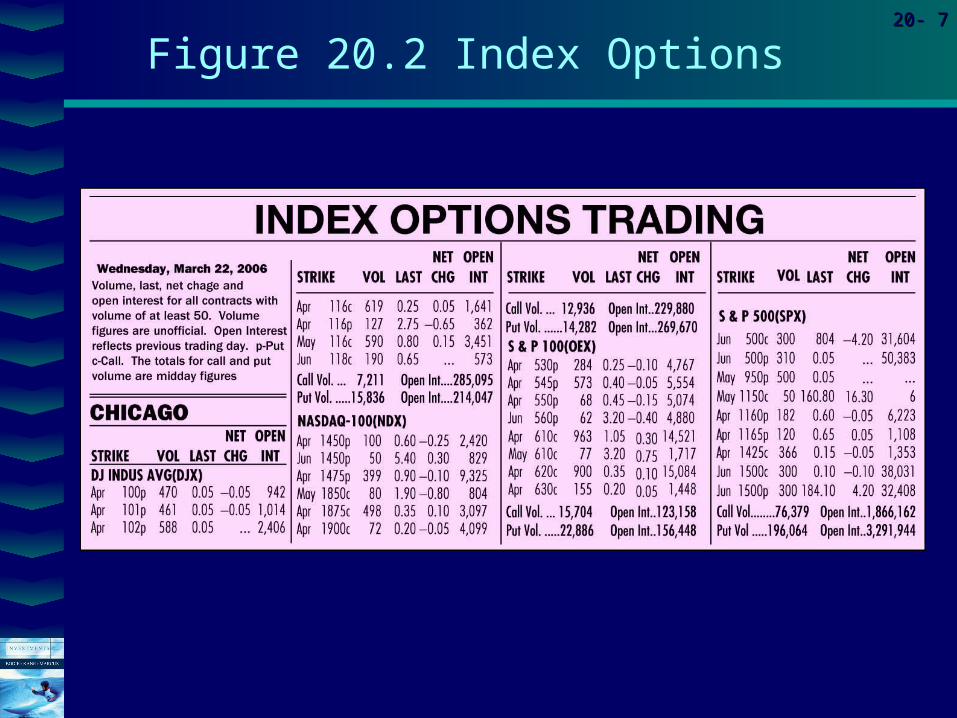
Figure 20.2 Index Options
20- 20- 88
CoverCoverimageimage
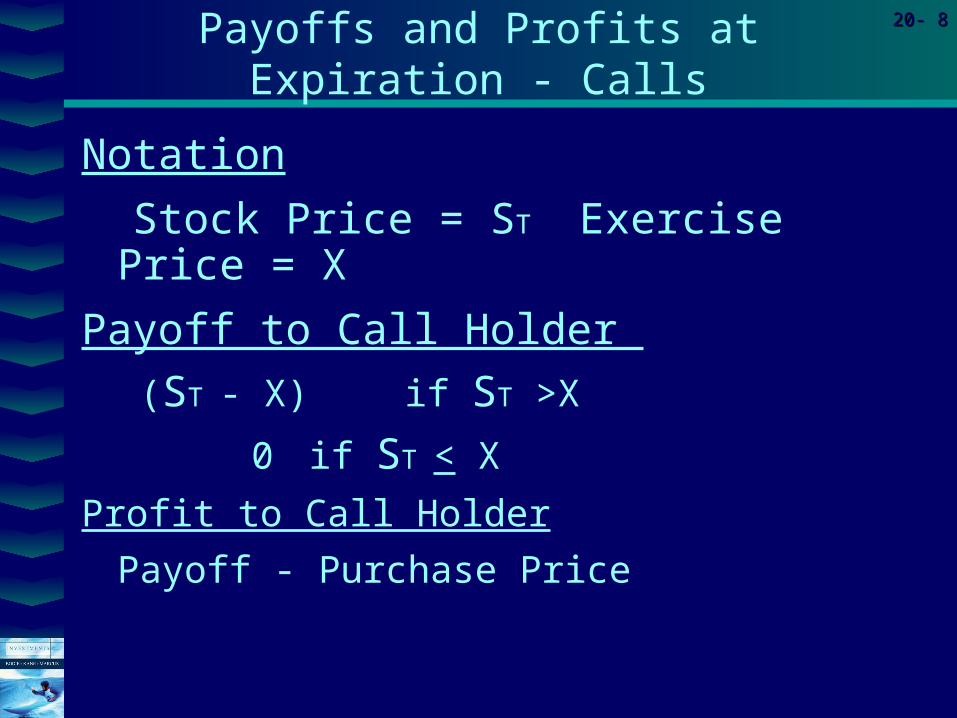
Notation
Stock Price = ST Exercise Price = X
Payoff to Call Holder
(ST - X) if ST >X
0 if ST < X
Profit to Call Holder
Payoff - Purchase Price
Payoffs and Profits at Expiration - Calls
20- 20- 99
CoverCoverimageimage
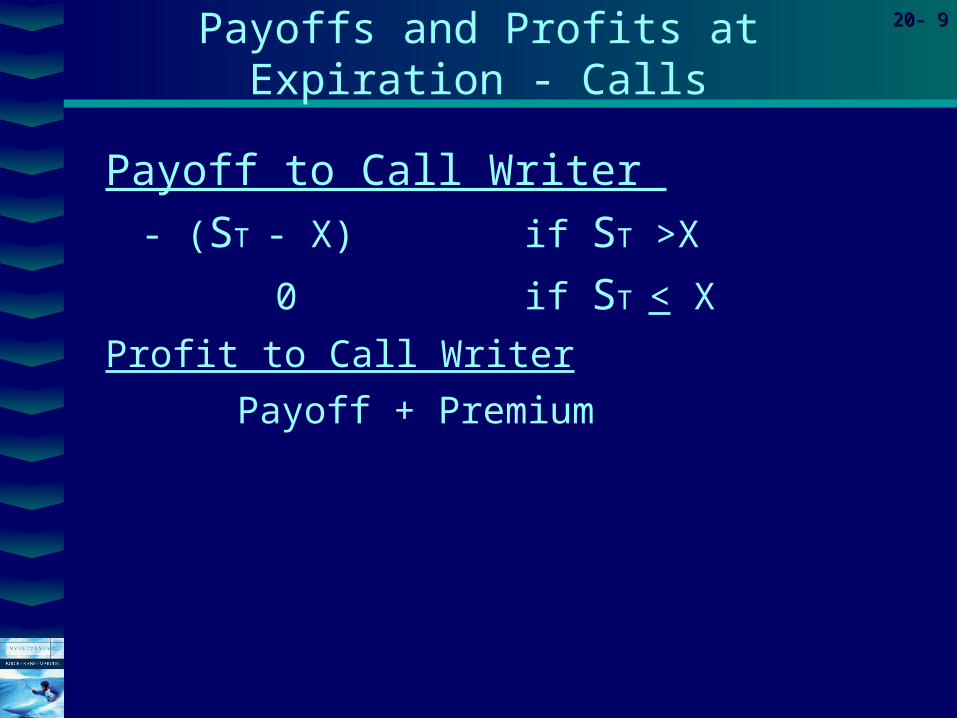
Payoff to Call Writer
- (ST - X) if ST >X
0 if ST < X
Profit to Call Writer
Payoff + Premium
Payoffs and Profits at Expiration - Calls

20- 20- 1010
CoverCoverimageimage
Figure 20.3 Payoff and Profit to Call Option at Expiration

20- 20- 1111
CoverCoverimageimage
Figure 20.4 Payoff and Profit to Call Writers at Expiration

20- 20- 1212
CoverCoverimageimage
Payoffs to Put Holder
0 if ST > X
(X - ST) if ST < X
Profit to Put Holder
Payoff - Premium
Payoffs and Profits at Expiration - Puts

20- 20- 1313
CoverCoverimageimage
Payoffs to Put Writer
0 if ST > X
-(X - ST) if ST < X
Profits to Put Writer
Payoff + Premium
Payoffs and Profits at Expiration - Puts
20- 20- 1414
CoverCoverimageimage
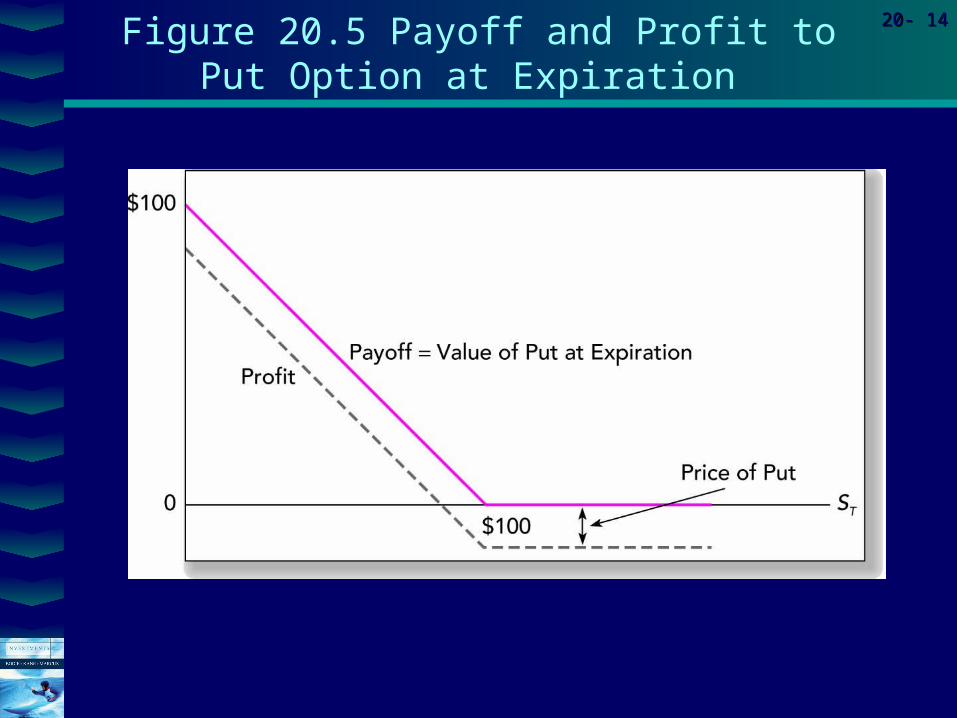
Figure 20.5 Payoff and Profit to Put Option at Expiration
20- 20- 1515
CoverCoverimageimage
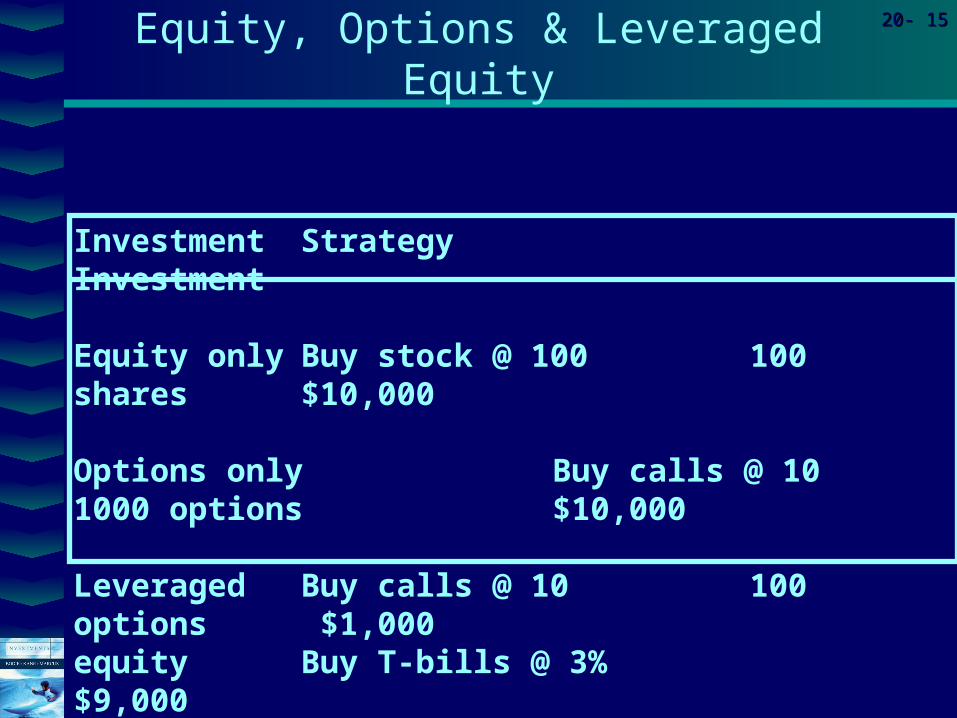
Investment Strategy Investment
Equity only Buy stock @ 100 100 shares $10,000
Options only Buy calls @ 10 1000 options $10,000
Leveraged Buy calls @ 10 100 options $1,000equity Buy T-bills @ 3% $9,000
Yield
Equity, Options & Leveraged Equity

20- 20- 1616
CoverCoverimageimage
IBM Stock Price
$95 $105 $115
All Stock $9,500 $10,500 $11,500
All Options $0 $5,000 $15,000
Lev Equity $9,270 $9,770 $10,770
Equity, Options Leveraged Equity - Payoffs

20- 20- 1717
CoverCoverimageimage
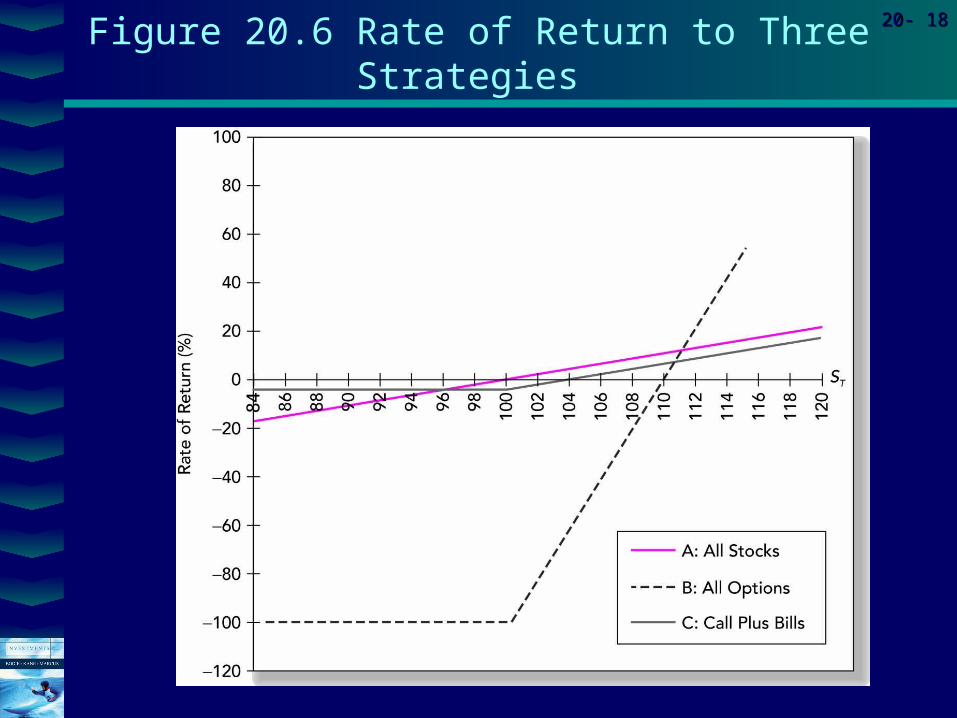
IBM Stock Price
$95 $105 $115
All Stock -5.0% 5.0% 15%
All Options -100% -50% 50%
Lev Equity -7.3% -2.3% 7.7%
Rates of Return
20- 20- 1818
CoverCoverimageimage
Figure 20.6 Rate of Return to Three Strategies

20- 20- 1919
CoverCoverimageimage
Table 20.1 Value of a Protective Put Position at Option Expiration

20- 20- 2020
CoverCoverimageimage
Figure 20.7 Value of a Protective Put Position at Option Expiration

20- 20- 2121
CoverCoverimageimage
Figure 20.8 Protective Put versus Stock Investment (at-the-money option)
20- 20- 2222
CoverCoverimageimage
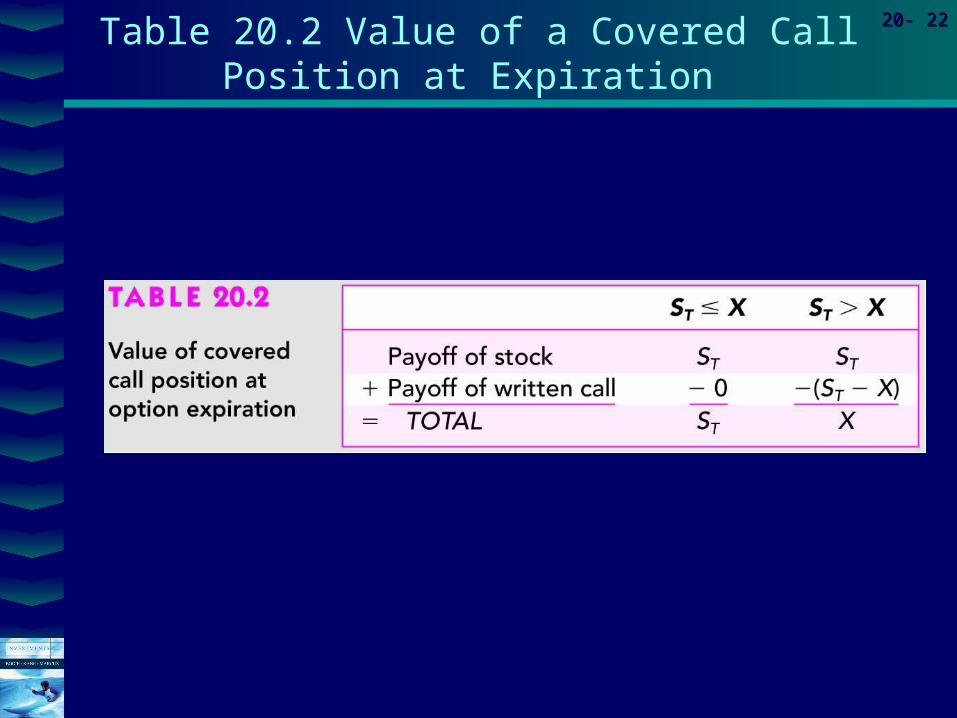
Table 20.2 Value of a Covered Call Position at Expiration
20- 20- 2323
CoverCoverimageimage
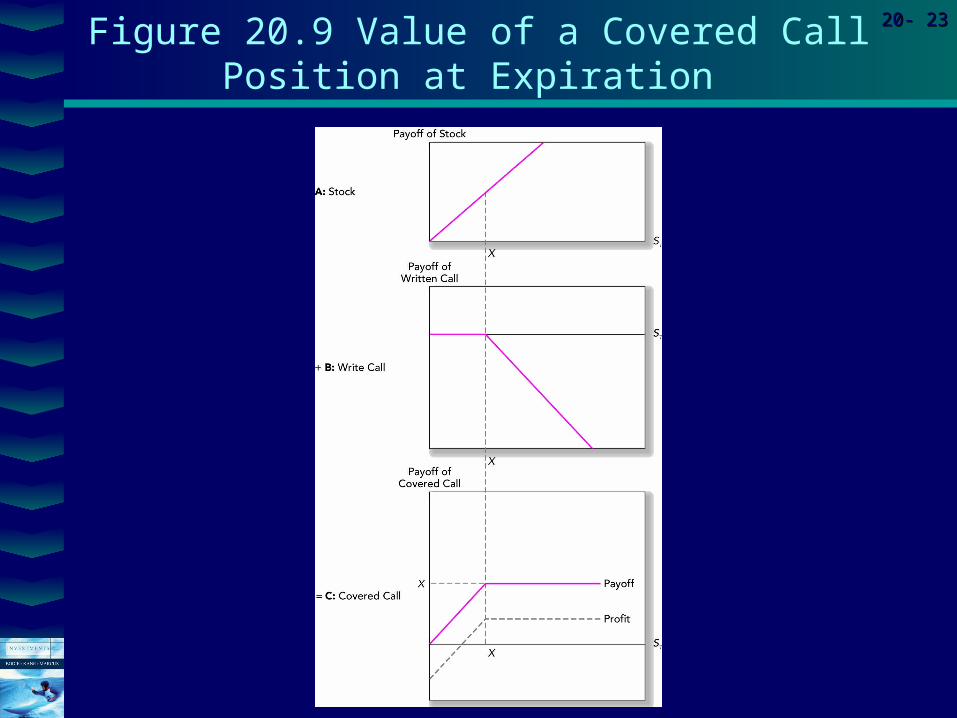
Figure 20.9 Value of a Covered Call Position at Expiration

20- 20- 2424
CoverCoverimageimage
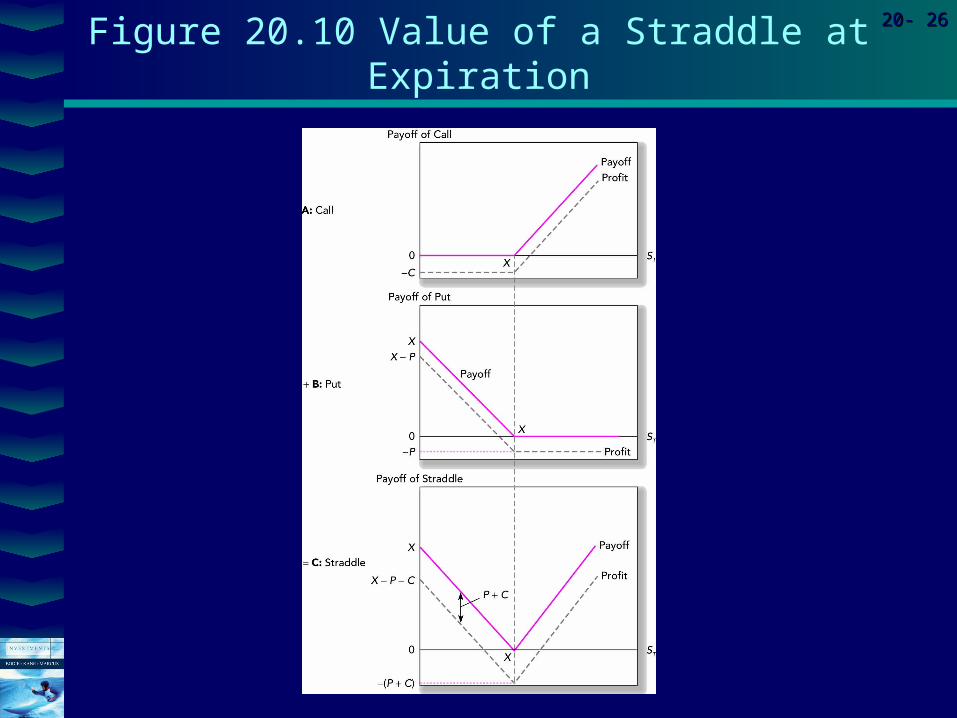
Straddle (Same Exercise Price)Long Call and Long Put
Spreads - A combination of two or more call options or put options on the same asset with differing exercise prices or times to expiration.Vertical or money spread:
Same maturityDifferent exercise price
Horizontal or time spread:Different maturity dates
Option Strategies

20- 20- 2525
CoverCoverimageimage
Table 20.3 Value of a Straddle at Option Expiration
20- 20- 2626
CoverCoverimageimage
Figure 20.10 Value of a Straddle at Expiration

20- 20- 2727
CoverCoverimageimage
Table 20.4 Value of a Bullish Spread Position at Expiration

20- 20- 2828
CoverCoverimageimage
Figure 20.11 Value of a Bullish Spread Position at Expiration
20- 20- 2929
CoverCoverimageimage
C + X / (1 + rf)T = S0 + P
If the prices are not equal arbitrage will be possible.
Put Call Parity

20- 20- 3030
CoverCoverimageimage
Stock Price = 110 Call Price = 17Put Price = 5 Risk Free = 5%Maturity = 1 yr X = 105
C + X / (1 + rf)T > S0 + P
117 > 115
Since the leveraged equity is less expensive, acquire the low cost alternative and sell the high cost alternative.
Put Call Parity - Disequilibrium Example

20- 20- 3131
CoverCoverimageimage
Table 20.5 Arbitrage Strategy

20- 20- 3232
CoverCoverimageimage
Optionlike Securities
Callable BondsConvertible SecuritiesWarrantsCollateralized Loans

20- 20- 3333
CoverCoverimageimage
Figure 20.12 Values of Callable Bonds Compared with Straight Bonds
20- 20- 3434
CoverCoverimageimage
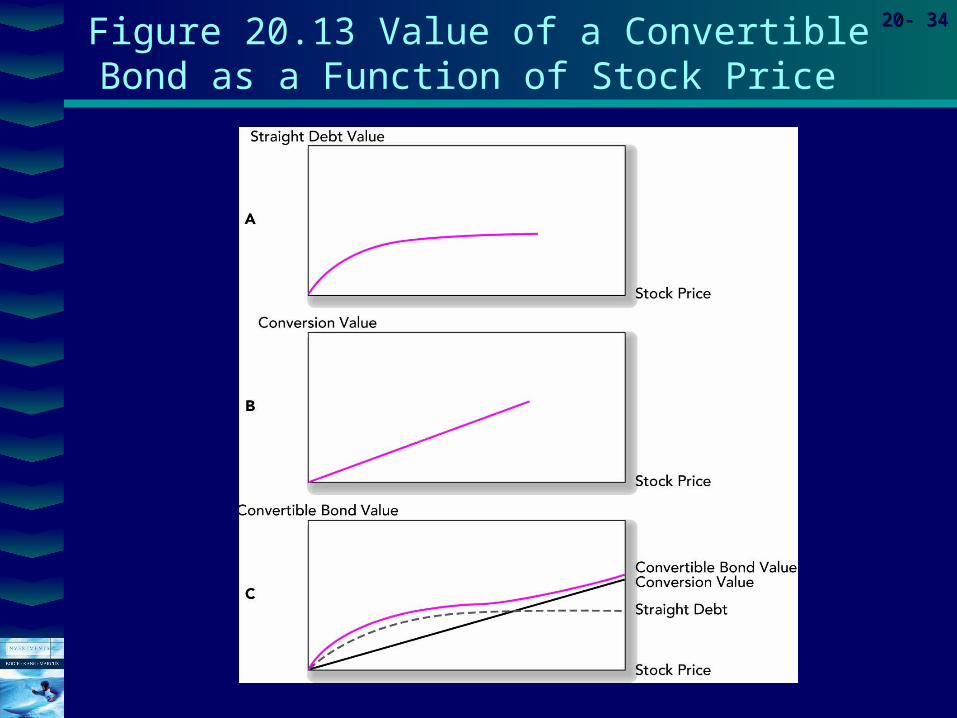
Figure 20.13 Value of a Convertible Bond as a Function of Stock Price

20- 20- 3535
CoverCoverimageimage
Figure 20.14 Collateralized Loan
20- 20- 3636
CoverCoverimageimage
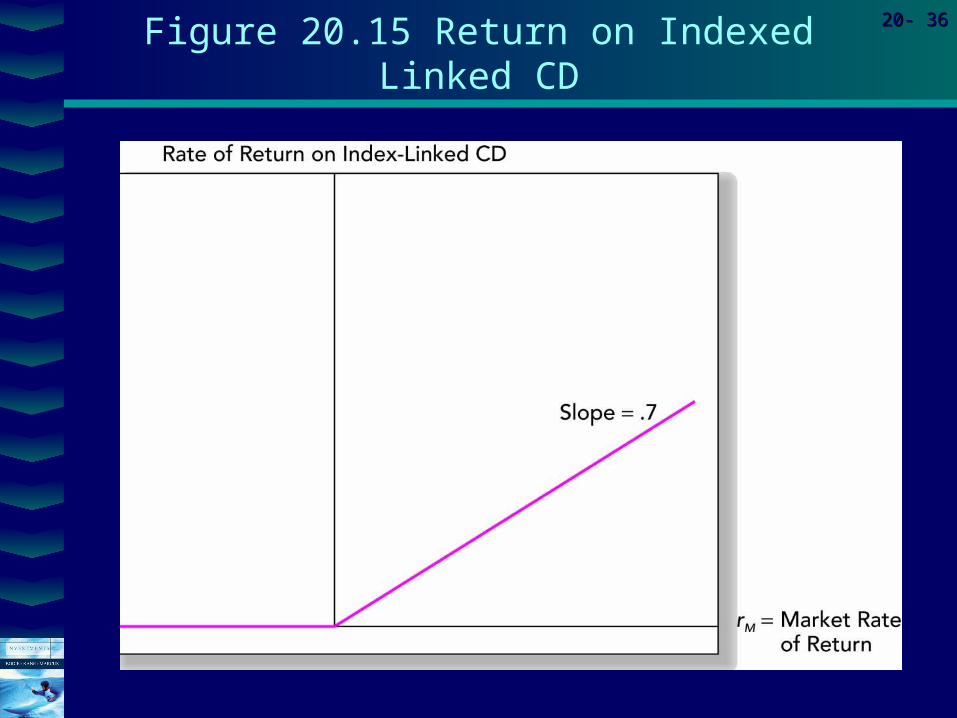
Figure 20.15 Return on Indexed Linked CD

20- 20- 3737
CoverCoverimageimage
Table 20.6 Prices of Digital Options on Initial Jobless Claims

20- 20- 3838
CoverCoverimageimage
Figure 20.16 Implied Probability of Jobless Claims Derived from Traded Digital Options

20- 20- 3939
CoverCoverimageimage
Exotic Options
Asian OptionsBarrier OptionsLookback OptionsCurrency Translated OptionsDigital Options