chapter 2 protection from cyclones · 39 table 2.1 amended saffir–simpson cyclone damage...
TRANSCRIPT

37
CHAPTER 2 PROTECTION FROM CYCLONES
Thematic paper: Role of forests and trees in protecting coastal areas against cyclones
Hermann M. Fritz1 and Chris Blount1
On 26 December 2004, a major earthquake and subsequent tsunami severely damaged coastal communities in countries along the Indian Ocean. Although tsunamis and cyclones are completely different natural disasters in their generation mechanisms, through inundation they both cause primary damage and mortality in coastal areas; in this context the importance of the multi-hazard approach in coastal protection is raised. However, coastal vulnerability is site- and hazard-dependent. The duration of the cyclone storm surge lasts from several hours up to a day and is significantly longer than the tsunami wave period. Narrow coastal forest belts and mangroves are inefficient in reducing storm surge. Kilometres of coastal wetlands or forests are required to significantly attenuate massive inland inundation caused by cyclones. However, mangroves and other coastal forests can reduce wind and storm wave impact as well as current velocities. The additional benefits of these forests include protection from coastal erosion and preservation of wetlands.
1 INTRODUCTION The Indian Ocean tsunami of December 2004, which killed over 200 000 people and affected livelihoods and coastal resources in 14 Asian and African countries, highlighted the need for coastal protection against tsunamis and other hazards, including cyclones and storm surges. A number of countries have called for the restoration of coastal forests to improve protection of coastal areas. It is difficult, however, to provide specific parametres for protection forests (i.e. width, density and biological characteristics) for effective dissipation of the energy of storm waves and cyclone-force winds because the potential for damage depends on many variables related to the particular site and cyclone. Anecdotal evidence needs to be analysed carefully as reduced impact behind mangrove forests can be attributable to the specific location and setting and not just the forest.
This paper is based on a scientific review of field, experimental and numerical modeling investigations and provides an objective analysis of the roles coastal forests play in protecting lives, natural resources and infrastructure, as well as valuable information for use in coastal area planning and management. An initial overview provides insight into the frequency, strength and location of tropical cyclones in conjunction with natural vegetation types, land-use patterns and coastal vulnerabilities. The effectiveness of coastal forests and trees in protecting population, infrastructure and natural resources from cyclones is discussed.
1 Civil & Environmental Engineering, Georgia Institute of Technology, Savannah, GA 31407, United States. [email protected]

38
2 TROPICAL CYCLONES
2.1 GENERATION In tropical and some subtropical areas, organized cloud clusters form in response to perturbations in the atmosphere. If a cloud cluster forms in an area sufficiently removed from the Equator, then Coriolis accelerations are not negligible and an organized, closed circulation can form. A tropical system with a developed circulation, but with windspeeds of less than 17.4 metres/second (i.e. 63 kilometres/hour or 39 mph), is termed a tropical depression. Given that conditions are favourable for continued development (basically warm surface waters, little or no wind shear and a high pressure area aloft), this circulation can intensify to the point where sustained windspeeds exceed 17.4 metres/second, at which time it is termed a tropical storm. If development continues to the point where the maximum sustained windspeed equals or exceeds 33.5 metres/second (121 kilometres/hour or 75 mph), the storm is termed a cyclone (Indian Ocean), typhoon (Western Pacific) or hurricane (Atlantic and Eastern Pacific).
2.2 SAFFIR–SIMPSON SCALE AND ASSOCIATED CYCLONE HAZARDS
The Saffir–Simpson Scale is a guideline for the damage potential of a tropical cyclone based solely on sustained windspeed (Saffir and Simpson, 1969). Potential cyclone damages due to storm winds, storm surges and storm waves associated with the five Saffir–Simpson categories are shown in Figure 2.1, Table 2.1 and 2.2.
Figure 2.1 Windspeed based on the Saffir–Simpson Scale and associated cyclone damage levels (USACE, 2002)

39
Table 2.1 Amended Saffir–Simpson cyclone damage potential scale based on windspeed, storm surge heights and beach erosion volumes
modified after Basillie (1998)
Cat Central
pressure
[mb]
Wind
speed
[km/h]
Peak storm
surge
elevation
above MSL
[m]
Cyclone centre
forward speed
[km/h]
Storm surge
rise time
[hr]
Average beach
erosion volume
[m3/m shoreline]
Max. beach
erosion volume
[m3/m shoreline]
Damage
potential
1 >980 119–153
1.2–1.7 50–88 2.5–4.5 3.0–8.3 6.3–17.6 Minimal
2 965–979 154–177
1.7–2.6 29–50 4.5–7.5 8.3–25 17.6–53 Moderate
3 945–964 178–210
2.6–3.8 19–29 7.5–11 25–63 53–133 Extensive
4 920–944 211–250
3.8–5.5 10–19 11–21 63–190 133–400 Extreme
5 <920 >250 >5.5 <10 >21 >190 >400 Catastrophic
Table 2.2 Local sea states with characteristic wave heights (H) and wave periods (T)
generated by cyclones for the Saffir–Simpson categories (USACE, 2002)
40
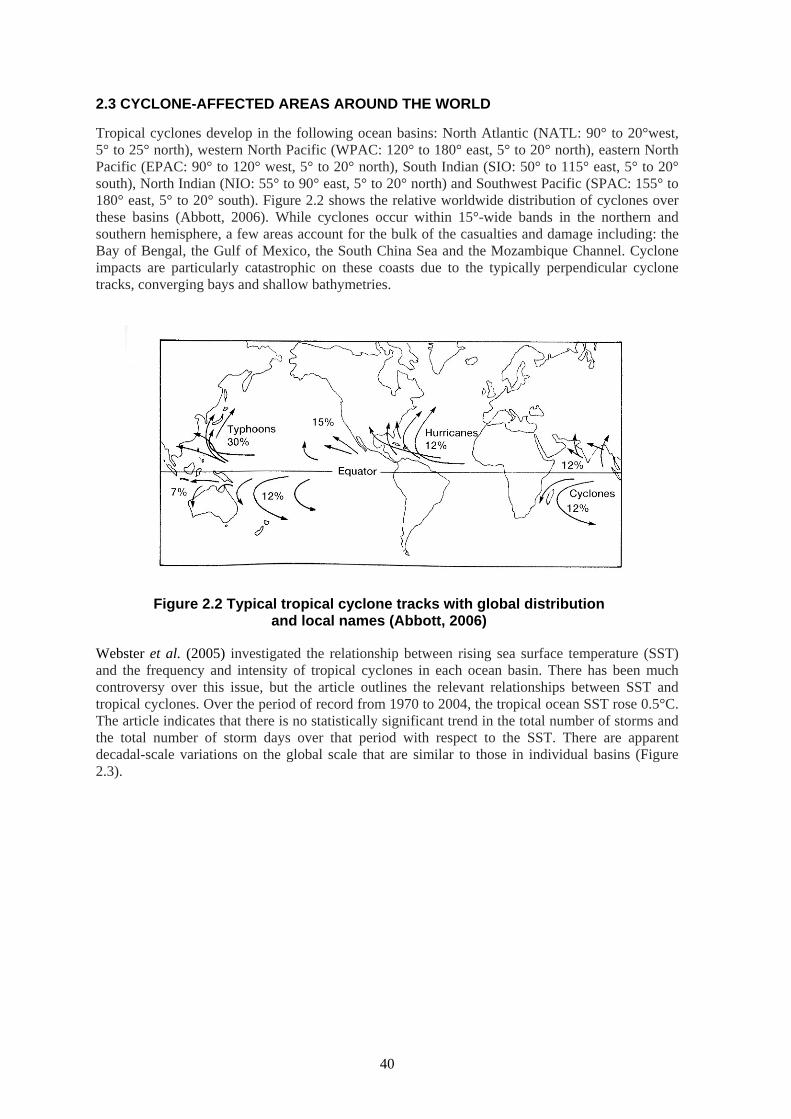
2.3 CYCLONE-AFFECTED AREAS AROUND THE WORLD
Tropical cyclones develop in the following ocean basins: North Atlantic (NATL: 90° to 20°west, 5° to 25° north), western North Pacific (WPAC: 120° to 180° east, 5° to 20° north), eastern North Pacific (EPAC: 90° to 120° west, 5° to 20° north), South Indian (SIO: 50° to 115° east, 5° to 20° south), North Indian (NIO: 55° to 90° east, 5° to 20° north) and Southwest Pacific (SPAC: 155° to 180° east, 5° to 20° south). Figure 2.2 shows the relative worldwide distribution of cyclones over these basins (Abbott, 2006). While cyclones occur within 15°-wide bands in the northern and southern hemisphere, a few areas account for the bulk of the casualties and damage including: the Bay of Bengal, the Gulf of Mexico, the South China Sea and the Mozambique Channel. Cyclone impacts are particularly catastrophic on these coasts due to the typically perpendicular cyclone tracks, converging bays and shallow bathymetries.
Figure 2.2 Typical tropical cyclone tracks with global distribution
and local names (Abbott, 2006)
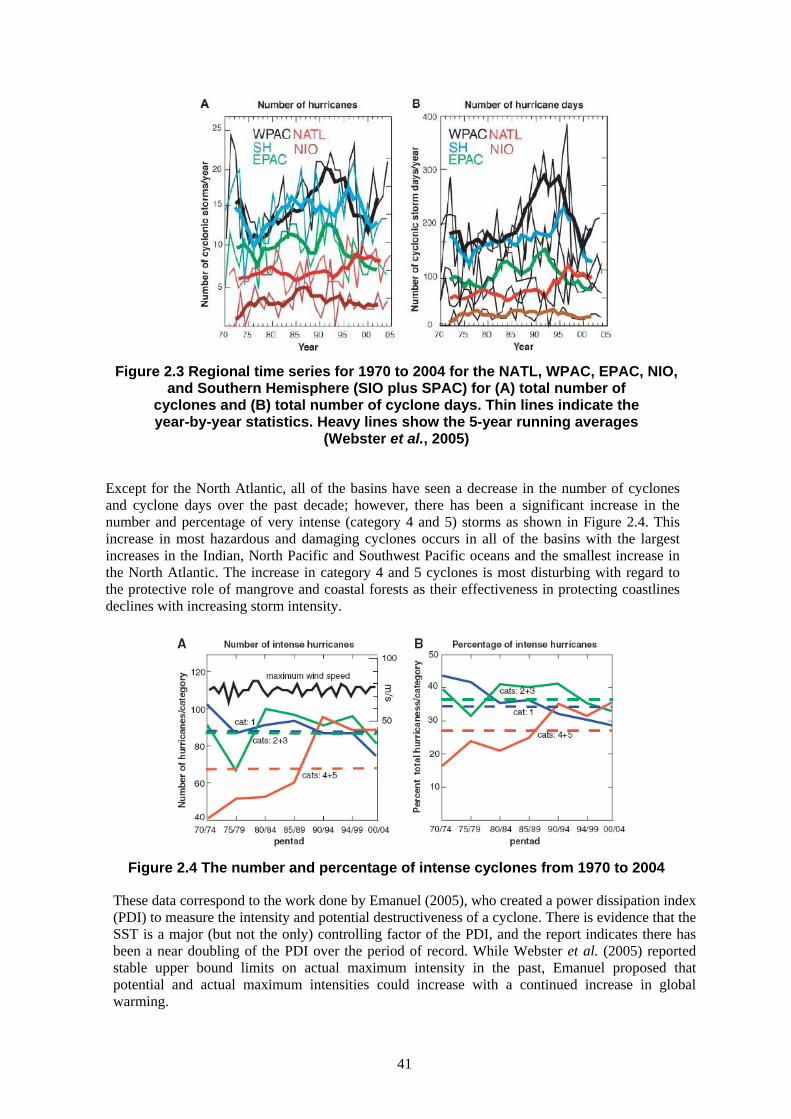
Webster et al. (2005) investigated the relationship between rising sea surface temperature (SST) and the frequency and intensity of tropical cyclones in each ocean basin. There has been much controversy over this issue, but the article outlines the relevant relationships between SST and tropical cyclones. Over the period of record from 1970 to 2004, the tropical ocean SST rose 0.5°C. The article indicates that there is no statistically significant trend in the total number of storms and the total number of storm days over that period with respect to the SST. There are apparent decadal-scale variations on the global scale that are similar to those in individual basins (Figure 2.3).
41
Figure 2.3 Regional time series for 1970 to 2004 for the NATL, WPAC, EPAC, NIO,
and Southern Hemisphere (SIO plus SPAC) for (A) total number of cyclones and (B) total number of cyclone days. Thin lines indicate the year-by-year statistics. Heavy lines show the 5-year running averages
(Webster et al., 2005)
Except for the North Atlantic, all of the basins have seen a decrease in the number of cyclones and cyclone days over the past decade; however, there has been a significant increase in the number and percentage of very intense (category 4 and 5) storms as shown in Figure 2.4. This increase in most hazardous and damaging cyclones occurs in all of the basins with the largest increases in the Indian, North Pacific and Southwest Pacific oceans and the smallest increase in the North Atlantic. The increase in category 4 and 5 cyclones is most disturbing with regard to the protective role of mangrove and coastal forests as their effectiveness in protecting coastlines declines with increasing storm intensity.
Figure 2.4 The number and percentage of intense cyclones from 1970 to 2004
These data correspond to the work done by Emanuel (2005), who created a power dissipation index (PDI) to measure the intensity and potential destructiveness of a cyclone. There is evidence that the SST is a major (but not the only) controlling factor of the PDI, and the report indicates there has been a near doubling of the PDI over the period of record. While Webster et al. (2005) reported stable upper bound limits on actual maximum intensity in the past, Emanuel proposed that potential and actual maximum intensities could increase with a continued increase in global warming.

42
2.4 NORTH INDIAN OCEAN TROPICAL CYCLONES
Singh et al. (2000) analysed 122 years (1877–1998) of tropical cyclone frequency in the North Indian Ocean. Approximately four times as many tropical cyclones occur in the Bay of Bengal compared to the Arabian Sea. Cyclones occur most often in May, October and November (Table 2.3), with an average of five to six tropical cyclones every year.
Table 2.3 Breakdown of cyclones by month, severity and sea in the North Indian Ocean
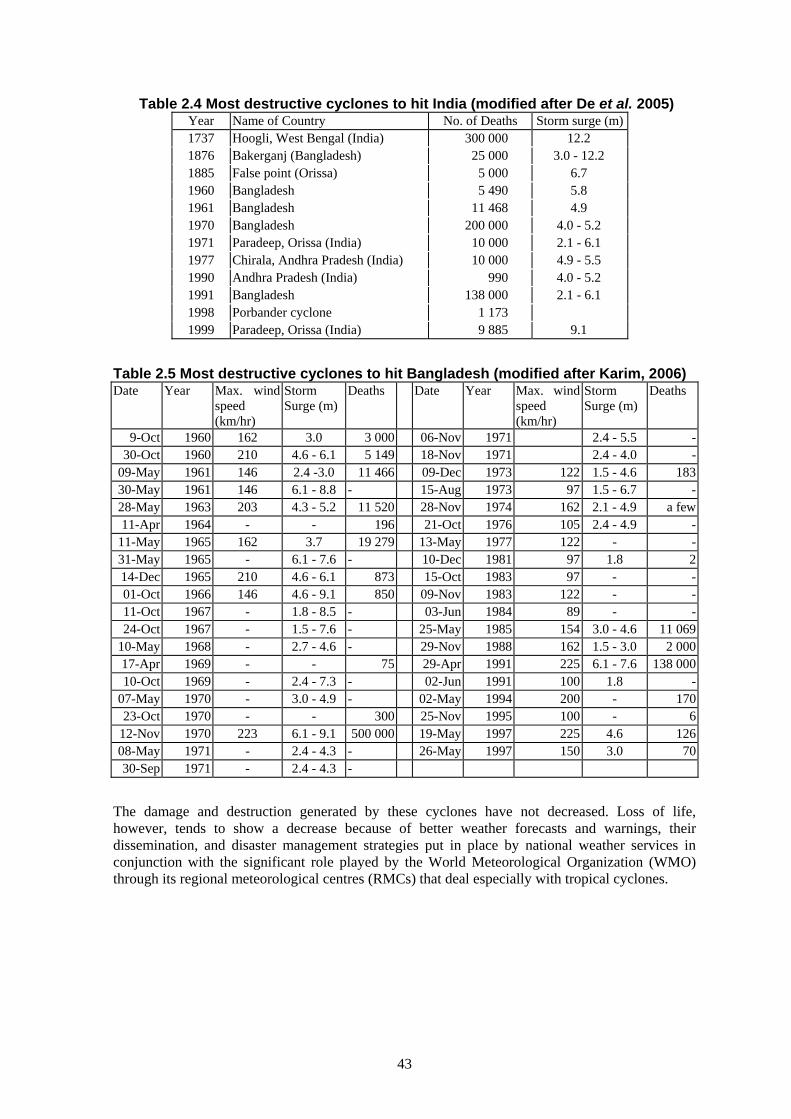
Because of the heavy socio-economic impact suffered along the Bay of Bengal annually due to cyclones, it is important to track any change in frequencies. The highest number of severe cyclones occurs in November with an average of one per year. These cyclones usually hit the Andhra Pradesh or Tamil Nadu regions of the Indian coast, but the cyclones sometimes affect Bangladesh or Myanmar. Over the 122 years studied, the frequency of tropical cyclones in the Bay of Bengal during November has doubled. The second highest number of severe tropical cyclones occurs in May, and most of these cyclones strike Bangladesh or Myanmar. Singh et al. (2000) concluded that cyclone frequency significantly increased in November and May (primarily in the Bay of Bengal), significantly decreased in June and September, and changed minimally during October. The overall frequency of tropical cyclones in the Bay of Bengal has a decreasing trend of 15 percent per hundred years, but November shows a 20 percent increase per 100 years vis-à-vis the rate of cyclones that reached severe cyclone stage. Table 2.4 (De et al., 2005) lists the most destructive cyclones to hit India and the surrounding area. Karim (2006) compiled a comprehensive list of cyclones to hit Bangladesh since 1960 (Table 2.5).
43
Table 2.4 Most destructive cyclones to hit India (modified after De et al. 2005) Year Name of Country No. of Deaths Storm surge (m) 1737 Hoogli, West Bengal (India) 300 000 12.2 1876 Bakerganj (Bangladesh) 25 000 3.0 - 12.2 1885 False point (Orissa) 5 000 6.7 1960 Bangladesh 5 490 5.8 1961 Bangladesh 11 468 4.9 1970 Bangladesh 200 000 4.0 - 5.2 1971 Paradeep, Orissa (India) 10 000 2.1 - 6.1 1977 Chirala, Andhra Pradesh (India) 10 000 4.9 - 5.5 1990 Andhra Pradesh (India) 990 4.0 - 5.2 1991 Bangladesh 138 000 2.1 - 6.1 1998 Porbander cyclone 1 173 1999 Paradeep, Orissa (India) 9 885 9.1
Table 2.5 Most destructive cyclones to hit Bangladesh (modified after Karim, 2006) Date Year Max. wind
speed (km/hr)
Storm Surge (m)
Deaths Date Year Max. wind speed (km/hr)
Storm Surge (m)
Deaths
9-Oct 1960 162 3.0 3 000 06-Nov 1971 2.4 - 5.5 -30-Oct 1960 210 4.6 - 6.1 5 149 18-Nov 1971 2.4 - 4.0 -
09-May 1961 146 2.4 -3.0 11 466 09-Dec 1973 122 1.5 - 4.6 18330-May 1961 146 6.1 - 8.8 - 15-Aug 1973 97 1.5 - 6.7 -28-May 1963 203 4.3 - 5.2 11 520 28-Nov 1974 162 2.1 - 4.9 a few11-Apr 1964 - - 196 21-Oct 1976 105 2.4 - 4.9 -
11-May 1965 162 3.7 19 279 13-May 1977 122 - -31-May 1965 - 6.1 - 7.6 - 10-Dec 1981 97 1.8 214-Dec 1965 210 4.6 - 6.1 873 15-Oct 1983 97 - -01-Oct 1966 146 4.6 - 9.1 850 09-Nov 1983 122 - -11-Oct 1967 - 1.8 - 8.5 - 03-Jun 1984 89 - -24-Oct 1967 - 1.5 - 7.6 - 25-May 1985 154 3.0 - 4.6 11 069
10-May 1968 - 2.7 - 4.6 - 29-Nov 1988 162 1.5 - 3.0 2 00017-Apr 1969 - - 75 29-Apr 1991 225 6.1 - 7.6 138 00010-Oct 1969 - 2.4 - 7.3 - 02-Jun 1991 100 1.8 -
07-May 1970 - 3.0 - 4.9 - 02-May 1994 200 - 17023-Oct 1970 - - 300 25-Nov 1995 100 - 6
12-Nov 1970 223 6.1 - 9.1 500 000 19-May 1997 225 4.6 12608-May 1971 - 2.4 - 4.3 - 26-May 1997 150 3.0 7030-Sep 1971 - 2.4 - 4.3 -
The damage and destruction generated by these cyclones have not decreased. Loss of life, however, tends to show a decrease because of better weather forecasts and warnings, their dissemination, and disaster management strategies put in place by national weather services in conjunction with the significant role played by the World Meteorological Organization (WMO) through its regional meteorological centres (RMCs) that deal especially with tropical cyclones.
44
2.5 WESTERN PACIFIC OCEAN TROPICAL CYCLONES
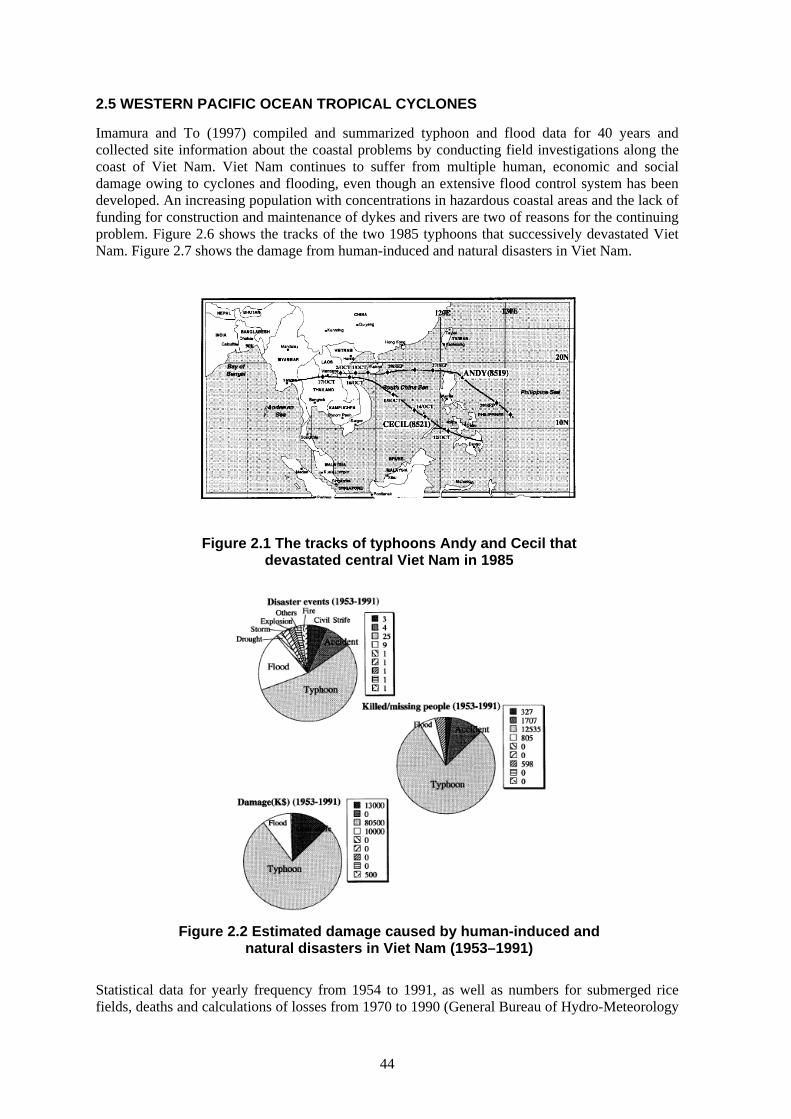
Imamura and To (1997) compiled and summarized typhoon and flood data for 40 years and collected site information about the coastal problems by conducting field investigations along the coast of Viet Nam. Viet Nam continues to suffer from multiple human, economic and social damage owing to cyclones and flooding, even though an extensive flood control system has been developed. An increasing population with concentrations in hazardous coastal areas and the lack of funding for construction and maintenance of dykes and rivers are two of reasons for the continuing problem. Figure 2.6 shows the tracks of the two 1985 typhoons that successively devastated Viet Nam. Figure 2.7 shows the damage from human-induced and natural disasters in Viet Nam.
Figure 2.1 The tracks of typhoons Andy and Cecil that devastated central Viet Nam in 1985
Figure 2.2 Estimated damage caused by human-induced and
natural disasters in Viet Nam (1953–1991)
Statistical data for yearly frequency from 1954 to 1991, as well as numbers for submerged rice fields, deaths and calculations of losses from 1970 to 1990 (General Bureau of Hydro-Meteorology

45
[1980] and UN/DHA [1994]) indicate that during the 1960s and 1970s there were five years with more than eight typhoons, whereas only one occurred in the 1980s; this suggests that there was high typhoon activity from 1960 to 1980, which corresponds to the tendency recorded elsewhere in Southeast Asia, including Japan (Ohnishi, 1994). Typhoons start in March, peak in October and finally decrease at the end of the year. The period between June and November is considered to be the storm season. Approximately one-third of the cyclones generated in the world occur in the Western North Pacific Ocean; consequently, Southeast Asia is always vulnerable. Table 2.6 summarizes 71 typhoons that caused damage to Southeast Asian countries from 1985 to 1989. Note that the totals each year do not add up, because each typhoon usually affected more than one country. China had the highest frequency at 46.5 percent; the Philippines and Japan were second (35.2 percent); the Republic of Korea, Viet Nam and Hong Kong Special Administrative Region were third (17.3 percent); and Thailand and Malaysia were fourth (5.6 percent). The number of typhoons hitting Viet Nam was almost half that of the Philippines, but higher than Thailand. The occurrence of typhoons decreases from the open sea to the coast. The report expected that Viet Nam would not be third but second in terms of losses because damage in Viet Nam has increased in spite of lower typhoon frequency. Financial losses in Japan and the Republic of Korea have decreased rapidly.
Table 2.6 Frequency of typhoons in Southeast Asian countries (1985–1989)
3 CYCLONE IMPACT CHARACTERISTICS
3.1 RETURN PERIOD CALCULATIONS
The Indian state of Orissa on the Bay of Bengal coast has been hit by many tropical cyclones in the past 200 years. Chittibabu et al. (2004) compiled a comprehensive list of 128 tropical cyclones that struck Orissa from 1804 to 1999. Included in these strikes was the supercyclone of 29 to 30 October 1999, which killed approximately 10 000 people and had a 7.5-metre storm surge. Cyclonic flooding in the Bay of Bengal is associated with storm surges, high tides and high water levels due to the heavy rainfall. Chittibabu et al. (2004) calculated that the 1999 cyclone had a return period of approximately 50 years. Cyclones in 1831, 1885 and 1895 were also possible supercyclones. A location map of Orissa and an inundation map of Orissa districts caused by the aforementioned supercyclone in 1999 are given in Figure 2.8. Table 2.7 shows the India Meteorological Department (IMD) cyclone classification system.

46
Figure 2.3 Location map of Orissa and the inundated areas of Orissa after the 1999 supercyclone
Table 2.7 IMD cyclone classification by sustained windspeed
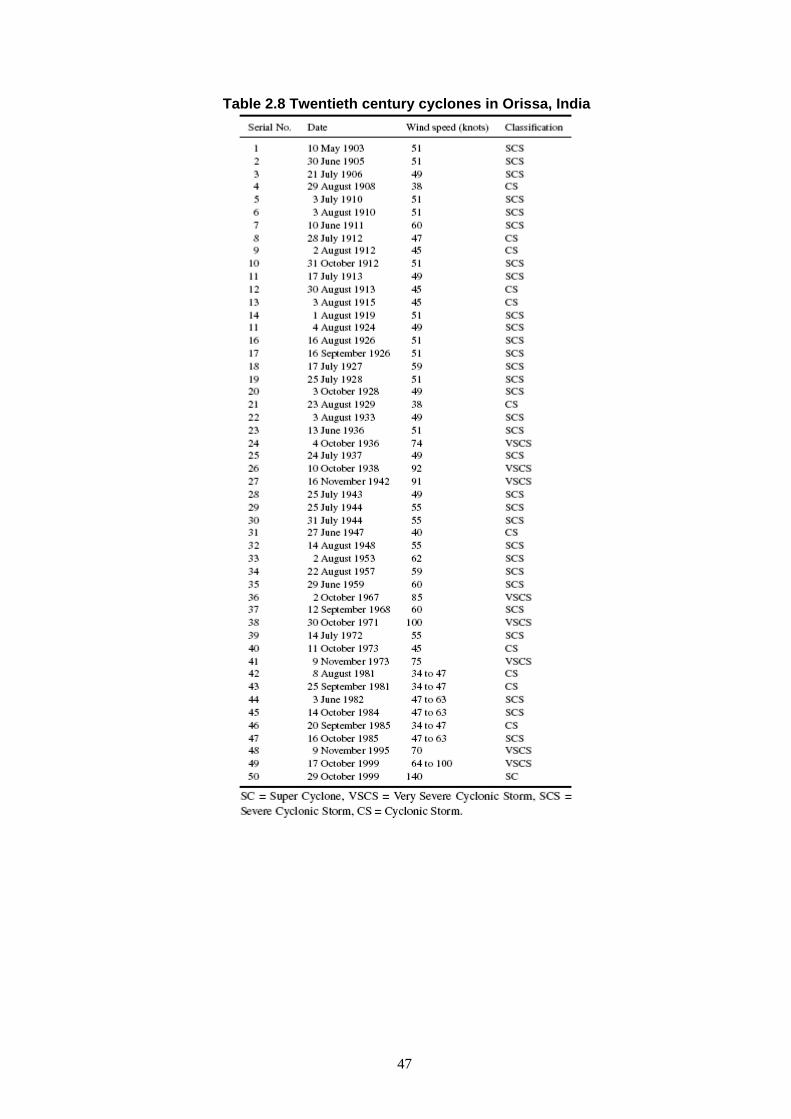
Table 2.8 shows the individual tropical cyclones in Orissa as reported by the IMD. By sorting the historical data, the report shows the return periods for flooding in the nineteenth and twentieth centuries (Table 2.9). The report notes that minor events were eliminated in the twentieth century due to the construction of river embankments.
47
Table 2.8 Twentieth century cyclones in Orissa, India

48
Table 2.9 Return periods for flooding in Orissa: (a) nineteenth century, (b) twentieth century
(a)
(a)
(b)
Accurate methods to determine the maximum windspeed (and therefore intensity) have only been available since 1971. Hence, the 16 moderate to severe storms from 1971 to 2000 were used for the computer simulations by Chittibabu et al. (2004). These tracks were used to synthesize six tracks (one intersecting each coastal district) to provide more complete geographical coverage of the coastal area (Figure 2.9).
(a) (b)
Figure 2.4 (a) Cyclone tracks impacting the coast of Orissa from 1971 to 2000 (b) six synthesized generic cyclone tracks (Chittibabu et al., 2004)
These tracks were used with the Indian Institute of Technology (ITT-D) numerical storm surge model to calculate the storm surges along the Orissa coast. It should be noted that the surge values in the southern part of Orissa are almost half of those in the northern part due to the nearshore topography and orientation of the coastline with respect to the storm track. Combining these storm surge data with a tidal prediction model (WXTide) and wave setup, Chittibabu et al. predicted the total water level for a 50-year return period (Figure 2.10).

49
Figure 2.5 Total water level on a 50-year return basis (Chittibabu et al., 2004)
A similar study was conducted for Bangladesh (Kabir et al., 2006). The report discussed the creation, calibration and validation of hydrodynamic, cyclone and storm surge models using 17 major cyclones in Bangladesh from 1960 to 2000. Using a statistical analysis of the models, surge levels were calculated for the 10-, 20-, 50- and 100-year return periods. Figure 2.11b shows the calculated surges for the 100-year return periods. The analysis indicated that the areas around Sandwip Island and the Meghna River mouth have the highest storm surges. The computed storm surge levels match the areas affected by 1970, 1985 and 1991 cyclones (Figure 2.11a). The Sundarbans mangrove forests to the west of the Ganges River Delta are the largest in the world extending up to 80 kilometres into the Bay of Bengal; they reduce cyclone impacts significantly. This is the prime example of natural cyclone impact mitigation.
a) b)
Figure 2.6 Bangladesh storm surges: (a) Areas most affected by historic cyclones (Karim 2006)
(b) computed 100-year return period surge levels (Kabir et al., 2006)

50
3.2 VULNERABILITY TO CYCLONES
Dube et al. (2004) created models to simulate the storm surgesfrom past cyclones in the head of the Bay of Bengal (Orissa, West Bengal and Bangladesh) and discussed how each of the storms that were modeled formed and how the storms affected the specific areas. Dube et al. (1997) also discussed storm surges in the Bay of Bengal and why the area is affected to such an extent by extreme sea levels. The reasons were summarized by Ali (1979) as follows:
• coastal waters (shallow bathymetry extending tens of kilometres offshore); • convergence of the bay; • high astronomical tides; • thickly populated low-lying islands; • favourable cyclone tracks impacting perpendicular to coastline; and • innumerable inlets and river systems.
Hossain and Singh (2006), using a geographic information system, developed a method to assess the vulnerability of people in India. They conceptualized vulnerability as the exposure to hazard (cyclone) and the coping capacity of the people (for example, provision of an early warning system, capital) to adapt and reduce adverse impacts. This coping capacity also includes defense mechanisms and access to the resources (such as education, infrastructure). The report assigned risk levels from 1 (low) to 4 (high). Figure 2.12 shows the population density of India (darker purple indicates high density) and the populations in the high-risk states. Per capita income versus the assigned risk level is given in Figure 2.13, with the poorest people being the most vulnerable.

51
(a)
(b)
Figure 2.7 (a) Population density of India (b) population of high-risk states in India

52
Figure 2.8 Per capita income of different states in India and risk level. Dark red
areas equal low per capita income and yellow areas equal high per capita income
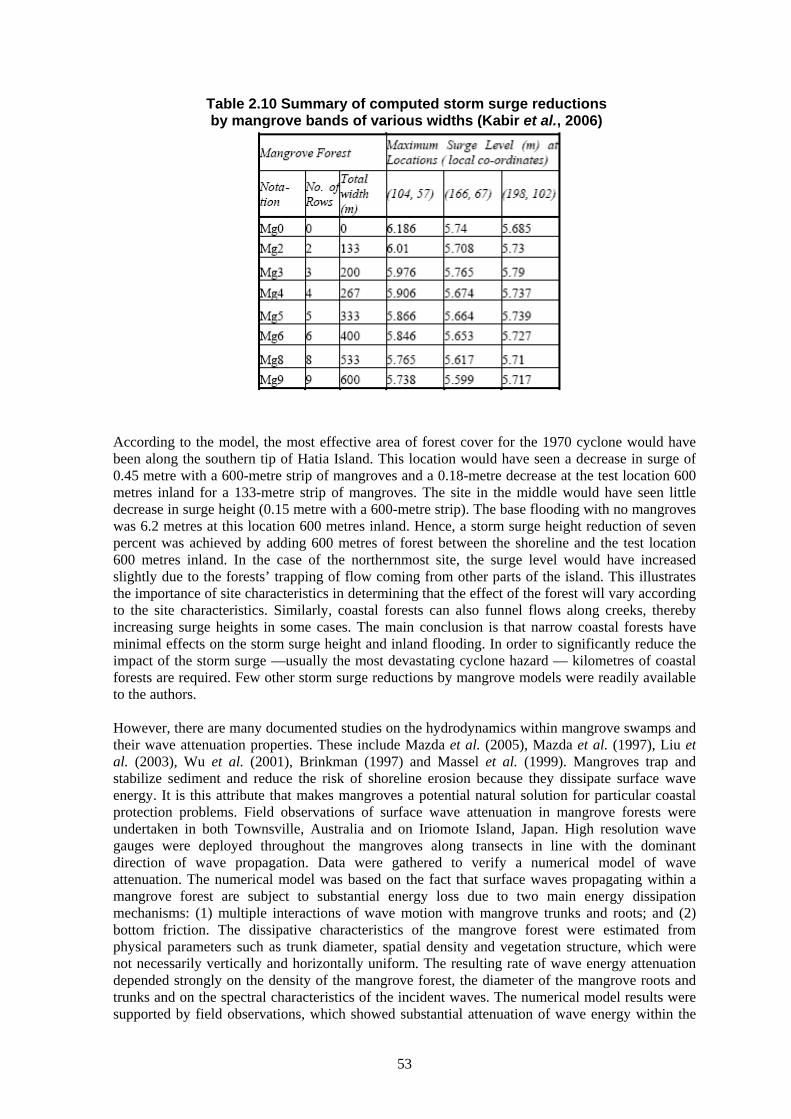
3.3 MANGROVE FOREST PROTECTION AGAINST CYCLONES According to Kabir et al. (2006), forests are considered a low-cost and natural form of protection for lands subjected to strong currents and surges. For their study, development of mangrove forests was considered to be one measure for coastal protection in Bangladesh. A model based on the MIKE 21 numerical model was created to study the effect of mangrove forests on storm surges that hit Hatia Island in southeastern Bangladesh. For the model, mangrove forests were laid on the southern tip of Hatia (Figure 2.14a) in bands that ranged from 133 to 600 metres, and eight total simulations were conducted using the 1970 cyclone. Three fixed locations 600 metres from the shoreline were chosen. The variation of surge height with respect to forest band widths at the fixed locations 600 metres inland are shown in Figure 2.14b and the results are summarized in Table 2.10. The results show the reduction at fixed locations 600 metres inland and do not represent transects from the shoreline to the test locations.
(a) (b)
Figure 2.9 (a) Hatia Island locations of simulations (b) surge variations at fixed locations 600 m inland from the shoreline with different forest widths
between the locations and the coastline (Kabir et al., 2006)
53
Table 2.10 Summary of computed storm surge reductions by mangrove bands of various widths (Kabir et al., 2006)
According to the model, the most effective area of forest cover for the 1970 cyclone would have been along the southern tip of Hatia Island. This location would have seen a decrease in surge of 0.45 metre with a 600-metre strip of mangroves and a 0.18-metre decrease at the test location 600 metres inland for a 133-metre strip of mangroves. The site in the middle would have seen little decrease in surge height (0.15 metre with a 600-metre strip). The base flooding with no mangroves was 6.2 metres at this location 600 metres inland. Hence, a storm surge height reduction of seven percent was achieved by adding 600 metres of forest between the shoreline and the test location 600 metres inland. In the case of the northernmost site, the surge level would have increased slightly due to the forests’ trapping of flow coming from other parts of the island. This illustrates the importance of site characteristics in determining that the effect of the forest will vary according to the site characteristics. Similarly, coastal forests can also funnel flows along creeks, thereby increasing surge heights in some cases. The main conclusion is that narrow coastal forests have minimal effects on the storm surge height and inland flooding. In order to significantly reduce the impact of the storm surge —usually the most devastating cyclone hazard — kilometres of coastal forests are required. Few other storm surge reductions by mangrove models were readily available to the authors. However, there are many documented studies on the hydrodynamics within mangrove swamps and their wave attenuation properties. These include Mazda et al. (2005), Mazda et al. (1997), Liu et al. (2003), Wu et al. (2001), Brinkman (1997) and Massel et al. (1999). Mangroves trap and stabilize sediment and reduce the risk of shoreline erosion because they dissipate surface wave energy. It is this attribute that makes mangroves a potential natural solution for particular coastal protection problems. Field observations of surface wave attenuation in mangrove forests were undertaken in both Townsville, Australia and on Iriomote Island, Japan. High resolution wave gauges were deployed throughout the mangroves along transects in line with the dominant direction of wave propagation. Data were gathered to verify a numerical model of wave attenuation. The numerical model was based on the fact that surface waves propagating within a mangrove forest are subject to substantial energy loss due to two main energy dissipation mechanisms: (1) multiple interactions of wave motion with mangrove trunks and roots; and (2) bottom friction. The dissipative characteristics of the mangrove forest were estimated from physical parameters such as trunk diameter, spatial density and vegetation structure, which were not necessarily vertically and horizontally uniform. The resulting rate of wave energy attenuation depended strongly on the density of the mangrove forest, the diameter of the mangrove roots and trunks and on the spectral characteristics of the incident waves. The numerical model results were supported by field observations, which showed substantial attenuation of wave energy within the
54
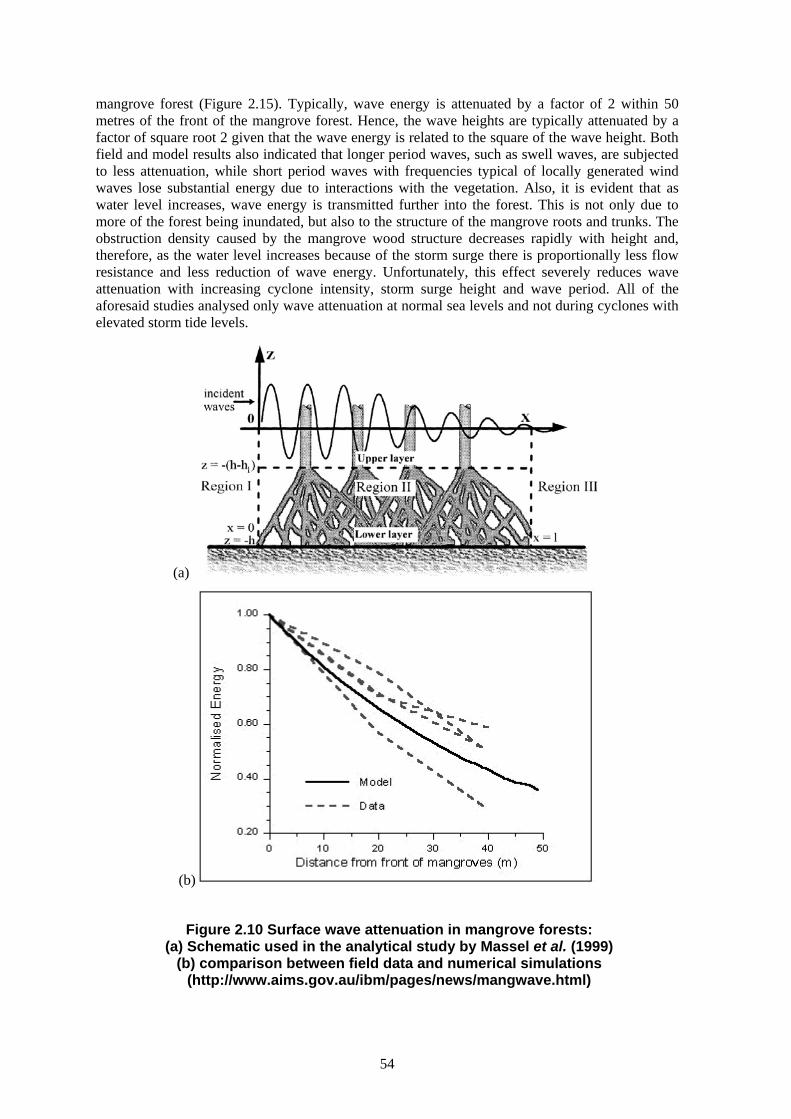
mangrove forest (Figure 2.15). Typically, wave energy is attenuated by a factor of 2 within 50 metres of the front of the mangrove forest. Hence, the wave heights are typically attenuated by a factor of square root 2 given that the wave energy is related to the square of the wave height. Both field and model results also indicated that longer period waves, such as swell waves, are subjected to less attenuation, while short period waves with frequencies typical of locally generated wind waves lose substantial energy due to interactions with the vegetation. Also, it is evident that as water level increases, wave energy is transmitted further into the forest. This is not only due to more of the forest being inundated, but also to the structure of the mangrove roots and trunks. The obstruction density caused by the mangrove wood structure decreases rapidly with height and, therefore, as the water level increases because of the storm surge there is proportionally less flow resistance and less reduction of wave energy. Unfortunately, this effect severely reduces wave attenuation with increasing cyclone intensity, storm surge height and wave period. All of the aforesaid studies analysed only wave attenuation at normal sea levels and not during cyclones with elevated storm tide levels.
(a)
(b)
Figure 2.10 Surface wave attenuation in mangrove forests: (a) Schematic used in the analytical study by Massel et al. (1999)
(b) comparison between field data and numerical simulations (http://www.aims.gov.au/ibm/pages/news/mangwave.html)

55
Badola and Hussain (2005) evaluated the protective function of mangroves in Bhitarkanika in the eastern state of Orissa, India. The Bhitarkanika mangrove ecosystem is the second largest mangrove forest of mainland India (Figure 2.16). Originally around 672 km2, it is now limited to an area of 145 km2 and is a wildlife sanctuary. This mangrove forest and the associated coast house the highest diversity of Indian mangrove flora and fauna. The mangrove forests of Bhitarkanika differ considerably from other mangroves because of the dominant tree species — Sonneratia apetal, Heritiera fomes, H. littoralis and several Avicennia species.
Figure 2.11 Kendarapara and Bhadrak districts of Orissa, India, with the location of
Bhitarkanika Conservation Area and the extent of mangrove forests
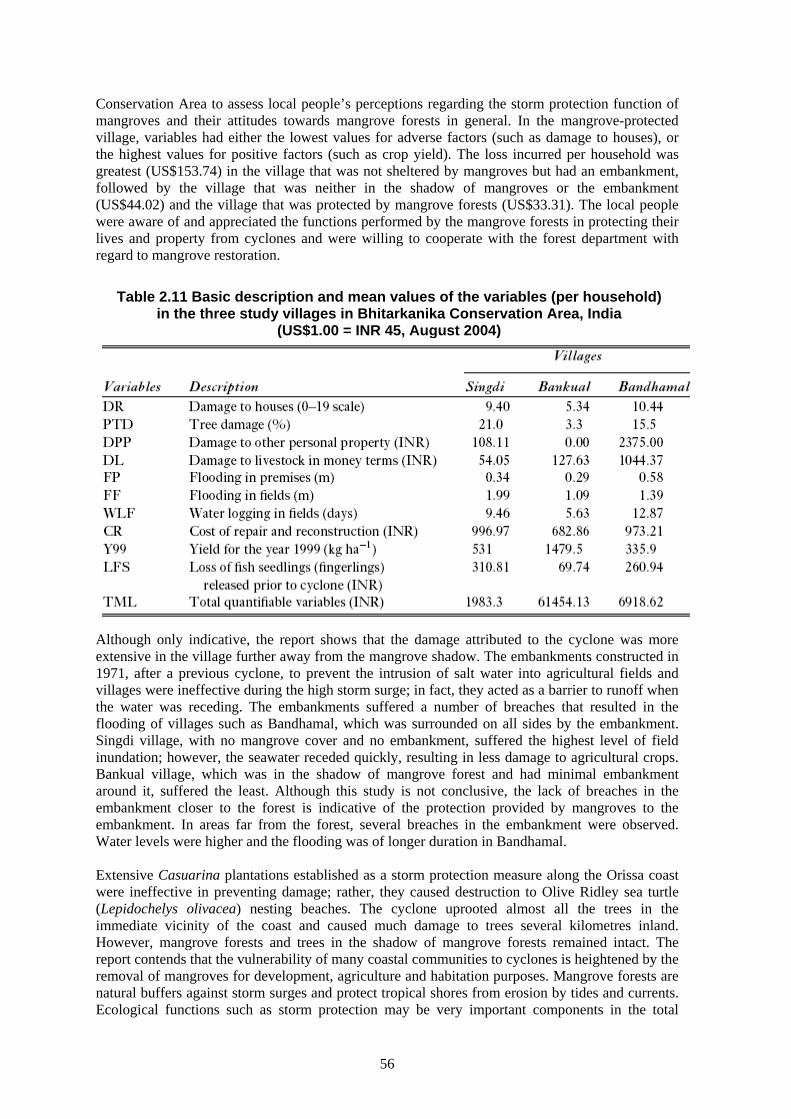
The report aimed to measure the economic losses attributed to the 1999 supercyclone relative to the prevailing socio-economic conditions of the study villages. It evaluated the extent of damage caused in areas that were under the umbrella of mangrove forests and areas that were not, in the wake of this supercyclone. In 1971, an embankment was created along the entire Orissa coast to prevent seawater intrusion into reclaimed paddy fields. Therefore, the report also studied the effectiveness of such artificial structures in providing storm protection, as opposed to mangrove forests. Hence, the following three situations were identified: (1) A village in the shadow of mangroves; (2) a village not in the shadow of mangroves and with no embankment; and (3) a village not in the shadow of mangroves, but with an embankment on the seaward side. Bankual village was in the shadow of a mangrove forest, Singidi village was neither in the shadow of mangroves nor protected by an embankment from storm surge and Bandhamal village was not in the shadow of mangroves, but had a seaward side embankment. The report indicated that the intensity of the impact of the 1999 cyclone on these villages should have been fairly uniform, as all the three selected villages were equidistant from the seashore and had similar aspects. The two villages outside mangrove cover were located close to each other, but both were far from the mangrove forest in order to eliminate any effect of mangrove forest presence. Services provided by the Bhitarkanika mangrove ecosystem in India and estimated cyclone damage avoided in the three selected villages, taking the supercyclone of 1999 as a reference point, were evaluated by assessing the socio-economic status of the villages, the cyclone damage to houses, livestock, fisheries, trees and other assets owned by the people, and the level and duration of flooding. Eleven variables were used to compare damage in the villages (Table 2.11). Attitude surveys were carried out in 10 percent of the households in 35 villages located in the Bhitarkanika
56
Conservation Area to assess local people’s perceptions regarding the storm protection function of mangroves and their attitudes towards mangrove forests in general. In the mangrove-protected village, variables had either the lowest values for adverse factors (such as damage to houses), or the highest values for positive factors (such as crop yield). The loss incurred per household was greatest (US$153.74) in the village that was not sheltered by mangroves but had an embankment, followed by the village that was neither in the shadow of mangroves or the embankment (US$44.02) and the village that was protected by mangrove forests (US$33.31). The local people were aware of and appreciated the functions performed by the mangrove forests in protecting their lives and property from cyclones and were willing to cooperate with the forest department with regard to mangrove restoration.
Table 2.11 Basic description and mean values of the variables (per household) in the three study villages in Bhitarkanika Conservation Area, India
(US$1.00 = INR 45, August 2004)
Although only indicative, the report shows that the damage attributed to the cyclone was more extensive in the village further away from the mangrove shadow. The embankments constructed in 1971, after a previous cyclone, to prevent the intrusion of salt water into agricultural fields and villages were ineffective during the high storm surge; in fact, they acted as a barrier to runoff when the water was receding. The embankments suffered a number of breaches that resulted in the flooding of villages such as Bandhamal, which was surrounded on all sides by the embankment. Singdi village, with no mangrove cover and no embankment, suffered the highest level of field inundation; however, the seawater receded quickly, resulting in less damage to agricultural crops. Bankual village, which was in the shadow of mangrove forest and had minimal embankment around it, suffered the least. Although this study is not conclusive, the lack of breaches in the embankment closer to the forest is indicative of the protection provided by mangroves to the embankment. In areas far from the forest, several breaches in the embankment were observed. Water levels were higher and the flooding was of longer duration in Bandhamal. Extensive Casuarina plantations established as a storm protection measure along the Orissa coast were ineffective in preventing damage; rather, they caused destruction to Olive Ridley sea turtle (Lepidochelys olivacea) nesting beaches. The cyclone uprooted almost all the trees in the immediate vicinity of the coast and caused much damage to trees several kilometres inland. However, mangrove forests and trees in the shadow of mangrove forests remained intact. The report contends that the vulnerability of many coastal communities to cyclones is heightened by the removal of mangroves for development, agriculture and habitation purposes. Mangrove forests are natural buffers against storm surges and protect tropical shores from erosion by tides and currents. Ecological functions such as storm protection may be very important components in the total

57
economic value of a wetland and may constitute almost 80 percent of the estimated value. These major benefits are often the principal reasons for restoring mangrove forests along much of the low-lying deltaic coasts. In the aforementioned study in Orissa, there was a 20 to 30 percent reduction in repair and maintenance costs of sea dyke systems due to the presence of mangroves in front of the dyke. The report realized that the artificial sea defenses were not only expensive to build and repair, but they were also, in many cases, ineffective.
3.4 CYCLONE DAMAGE TO MANGROVE FORESTS
Hurricane Mitch (1998) was the second deadliest hurricane on record at the time. The eye of the storm passed directly over three countries (Honduras, Guatemala and Mexico). Damage to the region’s coastal mangrove ecosystems resulted from three different mechanisms: winds, waves and sediment burial. Extreme winds (up to 287 kilometres/hour) defoliated and uprooted mangrove trees along the Caribbean coast, most notably in the Bay Island of Guanaja, which lost some 97 percent of its mangrove forest cover as shown in Plate 2.1 (Hensel and Proffitt, 2000). High wave activity eroded shorelines some 200 kilometres to the southwest, along the Caribbean coast of Guatemala (Punta de Manabique). Mangrove forests within the eroded zone were destroyed, and the remaining mangroves were buried with up to 1.2 metres of sand. Along the Pacific coast, damage was primarily attributable to the burial of mangrove forests by upland sediments, brought to the coastal area by massive flooding, upland erosion and mud and debris flows. These three mechanisms of hurricane damage had different impacts on coastal mangroves and led to different trajectories of recovery. The area of greatest damage was the Bay Island of Guanaja, where high mortality and the lack of natural regeneration made active restoration a priority. Over 27 months after the cyclone, severe chronic impacts remain evident, as recovery has not progressed to any significant degree. Wave-induced erosion and sedimentation some 200 kilometres away from the hurricane track also caused significant mangrove mortality.
(a)
(b) (c)
Plate 2.1 Mangrove damage after Hurricane Mitch on the Bay Island of Guanaja, Honduras: (a) defoliation (b) uprooting (c) erosion of shallow roots
(Hensel and Proffitt, 2000)
58
The negative example of the Bay Island of Guanaja shows that natural recovery is not always possible, even after several years in the aftermath of a cyclone. Unfortunately, cyclones tend to hit the most vulnerable coastlines with storms of various magnitudes within a few years. The possibility of multiple cyclone hits within a few years, or even within the same cyclone season prior to any significant recovery of mangrove forests, cannot be neglected when considering mangroves as protective shields.
Conclusions
The main conclusion is that narrow coastal forests have minimal effects on storm surge height and inland flooding. In order to significantly reduce the impact of the storm surge —usually the most devastating cyclone hazard — several kilometres of coastal forests are required. Mangroves are more efficient at attenuating surface waves and wind as well as providing protection against erosion. Typically, the wave energy is attenuated by a factor of two within 50 metres in front of the mangrove forest at normal sea level. The obstruction density caused by the mangrove wood structure decreases rapidly with height and, therefore, as the water level increases because of the storm surge there is proportionally less flow resistance and less reduction of wave energy. Unfortunately, this effect severely reduces wave attenuation with increasing cyclone intensity, storm surge height and wave period. Finally, the possibility of multiple cyclone hits prior to significant mangrove forest recovery needs to be considered.
ACKNOWLEDGEMENTS This paper was sponsored by the Food and Agriculture Organization of the United Nations.
59
BIBLIOGRAPHY
Abbott, P.L. 2006. Natural disasters. McGraw-Hill Higher Education. Ali, A. 1979. Storm surges in the Bay of Bengal and some related problems. University of
Reading, England. (Ph.D. thesis) Badola, R. & S.A. Hussain. 2005. Valuing ecosystem functions: an empirical study on the
storm protection function of Bhitarkanika mangrove ecosystem, India. Environmental Conservation, 32 (1): 85–92.
Balsillie, J.H. 1999. Volumetric beach and coast erosion due to storm and hurricane impact. Open File Report No. 78. Tallahassee, Florida, Florida Geological Survey.
Brinkman, R.M., Massel, S.R., Ridd, P.V. & K. Furukawa. 1997. Surface wave attenuation in mangrove forests. Pacific Coasts and Ports ’97, 2: 941–946.
Chittibabu, P., Dube, S.K., MacNabb, J.B., Murty, T.S., Rao, A.D., Mohanty, U.C. & P.C. Sinha. 2004. Mitigation of flooding and cyclone hazard in Orissa, India. Natural Hazards, 31:455–485.
Emanuel, K.A. 2005. Increasing destructiveness of tropical cyclones over the past 30 years. Nature, 436: 686–688.
De, U.S., Dube, R.K. & G.S. Prakasa Rao. 2005. Extreme weather events over India in the last 100 years. J. Ind. Geophys. Union, 9 (3): 173–187.
Dube, S.K, Chittibabu, P., Sinha, P.C., Rao, A.D. & T.S. Murty. 2004. Numerical modeling of storm surge in the head Bay of Bengal using location specific model. Natural Hazards, 31: 437–453.
Dube, S.K., Rao, A.D., Sinha, P.C., Murty, T.S. & N. Bahulayan. 1997. Storm surge in the Bay of Bengal and Arabian Sea: The problem and its prediction. Mausam, 48: 283–304.
Hensel, P. & C.E. Proffitt. 2002. Hurricane Mitch: acute impacts on mangrove forest structure and an evaluation of recovery trajectories: executive summary. USGS Open File Report 03-182, 25 pp.
Hossain, S. & A. Singh, 2006. Application of GIS for assessing human vulnerability to cyclone in India. Environmental System Research Institute. 21 July 2006. <http://gis.esri.com/library/userconf/proc02/pap0701/p0701.htm>
Imamura, F. & D.V. To. 1997. Flood and typhoon disasters in Viet Nam in the half century since 1950. Natural Hazards, 15: 71–87.
Kabir, M.M., Saha, B.C. & J.M.A. Hye. 2006. Cyclonic storm surge modelling for design of coastal polder. Institute of Water Modeling. 10 July 2006. <http://www.iwmbd.org/html/PUBS/ publications/P024.PDF>
Kabir, M.M, Ahmed, M.M.Z., Azam, M.H. & F. Jakobsen. 2006. Effect of afforestation on storm surge propagation: a mathematical model study. Institute of Water Modeling. 10 July 2006. <http://www.iwmbd.org/html/PUBS/publications/P015.PDF>
Karim, N. 2006. Options for cyclone protection: Bangladesh context. Climate Institute. 6 July 2006. <http://www.climate.org/PDF/Bangladesh.pdf>
Liu, W.C., Hsu, M.H. & C.F. Wang. 2003. Modeling of flow resistance in mangrove swamp at mouth of Tidal Keelung River, Taiwan. Journal of Waterway, Port, Coastal, and Ocean Engineering, 129 (2): 86–92.
Massel, S.R., Furukawa, K. & R.M. Brinkman. 1999. Surface wave propagation in mangrove forests. Fluid Dynamics Research, 24: 219–249.
Mazda, Y., Kobashi, D. & S. Okada. 2005. Tidal-scale hydrodynamics within mangrove swamps. Wetlands Ecology and Management, 13: 647–655.
Mazda, Y., Wolanski, E., King, B., Sase, A., Ohtsuka, D. & M. Magi. 1997. Drag force due to vegetation in mangrove swamps. Mangroves and Salt Marshes, 1: 193–199.
Singh, O.P., Khan, T.M.A. & M.S. Rahman. 2000. Has the frequency of intense tropical
cyclones increased in the north Indian Ocean? Current Science, 80(4): 575–580. USACE: US Army Corps of Engineers. 2002. Coastal engineering manual. Engineer Manual
1110-2-1100, Washington, DC (six volumes).

60
Webster, P.J., Holland, G.J., Curry, J.A. & H.R. Chang. 2005. Changes in tropical cyclone number, duration, and intensity in a warming environment. Science, 309 (5742): 1844–1846.
Wu, Y., Falconer, R.A. & J. Struve. 2001. Mathematical modeling of tidal currents in mangrove forests. Environmental Modelling and Software, 16: 19–29.

61
Field study presentation: Cyclone disaster mitigation in Bangladesh M. Alimullah Miyan, South Asian Disaster Management Center, Bangladesh Bangladesh has witnessed many natural calamities. Between 1797 and 1998, 67 major cyclones occurred. The 1991 cyclone killed approximately 139 000 people and generated economic losses of US$2.07 billion. The coastal zone comprises 19 southern districts with 35 million inhabitants (28 percent of the country). The Bangladesh Meteorological Department provides cyclone warnings. The Standing Orders for Cyclone constitute the basic plan for addressing cyclone disasters with guidelines for action at various stages during calamitous events. Elaborate institutional arrangements are in place to deal with disasters. The most dedicated agency is the Cyclone Preparedness Programme, which is an organization of 33 000 volunteers in the field who mobilize people at the community level to cope with cyclones. Structural mitigational measures such as cyclone shelters, coastal embankments and improved housing, as well as non-structural mitigation measures including coastal afforestation, public awareness, community preparedness, local level contingency planning and social mobilization are in place to a limited extent. Coastal afforestation activities were initiated in 1966. The protection afforded by natural mangrove forest has prompted afforestation in the five coastal districts. A coastal zone policy has been formulated with emphasis on sea dykes and afforestation, planned tree plantation, social forestry, plant care and maintenance, afforestation of new chars (accreted land) and their conservation. A number of recommendations have been made to: improve storm surge forecasting; enhance public awareness; increase investment in warning presentation; promote information dissemination and comprehension; simplify warning contents; address knowledge and attitudes; carry out surveys on cyclones; and integrate disaster management in development planning. The conclusions pointed to the need for mainstreaming disaster management activities, increasing the interface between disaster and development, and conducting sustained awareness and advocacy programmes. All of these issues call for a higher level of investment in preparedness, shelter construction, afforestation, institutional arrangement, policy formulation and community involvement for improved cyclone disaster mitigation.
Field study presentation: Evaluation of storm protection functions — a case study of mangrove forest in Orissa, India and the 1999 super cyclone Saudamini Das, University of Delhi Enclave, India The research aimed at making a quantitative assessment of the storm protection functions of mangrove forests. In October 1999, the state of Orissa was battered by a super cyclone that caused tremendous loss of life and property in the coastal region. It was widely reported in the national as well as international press that areas with mangrove forest on their coastlines experienced comparatively less damage. Using village level human casualty data, cyclone damage (taking into account wind velocity, storm surge velocity and the socio-economic status of the villages separately) was estimated; an attempt was made to evaluate how many human lives had been saved by the presence of mangroves in some areas.
62
Key points and observations emphasized in the discussions Cyclones are composite phenomena, consisting of winds, multiple storm waves, storm surges (which generally last from several hours up to a day) and inland flooding generated by heavy rainfall. This inland flooding often causes more fatalities than the wind. Cyclones generally cause massive erosion or deposition – both long- and cross-shore. In recent years important discussions on multihazard approaches for coastal protection have been ongoing; however, it should be noted that often coasts vulnerable to cyclone storm surges are less (or the least) vulnerable to tsunamis, and therefore require different protective measures. Coastal forests and mangroves can help to mitigate cyclone damage, but are not effective against all hazards. Their mitigation effect is limited (or absent) during cyclones of categories exceeding 4 on the Saffir–Simpson Scale and super cyclones. Narrow belts of coastal forest do not reduce storm surges; several square kilometres of forests or coastal wetlands are required to significantly absorb massive inland inundation caused by cyclones of high intensity. Preliminary analysis of the 1999 Orissa super cyclone showed that the mitigation effects of Casuarina plantations were lower in comparison to mixed indigenous forests. The following factors were identified:
1. Coastal forests are efficient in reducing wind and storm wave impacts up to a certain level.
2. Coastal forests and mangroves in narrow belts do not reduce storm surge efficiently; they can, however, help to decelerate flooding velocity and trap floating debris.
3. A dense forest can reduce 0.5 metres of surge for each kilometre of forest.
4. Extensive wetland systems are also important as mitigating measures and the loss of wetlands makes the coast more vulnerable. Mangroves and coastal wetlands must be preserved.
When planning a green belt for protective purposes, several factors should be taken into account.
1. Space availability: A very wide belt of forest is needed to ensure an appropriate reduction of cyclone strength. Because the coasts of several Asian countries (for example, Bangladesh) often have very high population densities, this space may not be available and consequently a green belt cannot be prepared to the required width. In this case environmental and hard engineering structures should be used in combination with – or as an alternative to – the green belt.
2. Social involvement in planning and management of protective forests is essential for the long-term success of the project. The green belt should also be a source of additional yield to local communities (for example, controlled harvesting of wood and non-wood forest products, ecotourism, etc.), which will avoid illegal felling and damage to the green belt.
Additional factors which would benefit the ultimate goal of saving lives and resources in cyclone-prone countries are as follows:
1. The creation or enhancement of an appropriate cyclone warning system (together with reliable storm forecasting) at the national level, which should be easily understood by rural people and which should also extend to remote areas and communities.
2. Investment in public awareness on cyclone mitigation, including the protective role of forests (knowledge–attitude–practice).

63
3. The encouragement of local community participation in prevention and rehabilitation activities (for example, volunteer groups).
4. Improvement or initiation of institutional arrangements (for example, collaboration between disaster managers and other government agencies).
