chapter 2 production of crude laccase...
TRANSCRIPT

CHAPTER 2 PRODUCTION OF CRUDE LACCASE ENZYME AND ITS APPLICATION IN DECOLORIZATION OF PROTOTYPICAL TEXTILE DYES SINGLY
AND IN COMBINATION

46
CHAPTER 2
PRODUCTION OF CRUDE LACCASE ENZYME AND ITS APPLICATION IN DECOLORIZATION OF PROTOTYPICAL
TEXTILE DYES SINGLY AND IN COMBINATION
2.1 ENZYME BASED BIO-REMEDIATION
Many organisms have been reported to degrade/decolorize dyes
prototypically or in consortia include bacteria, fungi, actinomycetes etc (Khehra et
al., 2005; Asgher et al., 2006). White-rot fungi can tolerate a broad range of
environmental conditions, involving nutrients, pH, and moisture content, making
them suitable to bio-remediate contaminated soils (Asgher et al., 2006).
Basidiomycete’s lignin mineralizing enzymes are more potent dye-degraders than
their prokaryotic counterparts due to their extracellular sometimes and their non-
specific nature (Christian et al., 2005). Among fungal laccases, those produced by
the basidiomycete white-rot fungi are of great biotechnological interest due to their
higher redox potential at the T1 site (Solomon et al., 1996; Riva 2006; Morozova
et al., 2007; Sun et al., 2009; Santhanam et al., 2011). Dye decolorization studies
were performed in the laboratory (Bench scale) using liquid cultures. However, in
the real life scenario, scale up poses significant challenges. Hence, there has been a
paradigm shift from live organisms approaches using purified or recombinant
laccase towards crude enzyme/enzyme mediated bioremediation because the cost
latter process is comparatively cheaper and is more stable (Couto et al., 2009; Sun
et al., 2009; Zeng et al., 2011; Sasmaz et al., 2011; Jiang et al., 2012; Sridhar et al.,
2013). High titers of crude enzyme are produced by SSF using renewable, easily

47
available, cost effective and eco-friendly agro-waste (Sarnthima et al., 2009; Nandal
et al., 2013). Enzyme mediated bioremediation particularly by crude laccase and/ or
mediator systems have attracted much interest towards decolorization of textile dyes
in the textile processing industries (Couto et al., 2003; Kandelbauer et al., 2004;
Stoilova et al., 2010; Sasmaz et al., 2011; Zeng et al., 2011; Da ssi et al., 2012;
Sridhar et al., 2013). The action of laccases upon pollutants occurs through two
main degradation pathways or coupling reactions. The main reactions involved in
laccase-induced degradation include depolymerization, demethoxylation,
decarboxylation, and ring opening (Baldrian, 2004; Zille et al., 2004; 2005a; 2005b).
Table 2.1 provides summary of the crude enzyme systems that have been used for
the decolorization of prototypical synthetic organic textile dyes.
Table 2.1 Enzyme mediated bioremediation
S. No Organism Type of
fermentation Nature Dyes References
1. Trametes hirsuta (BT 2566)
Solid State Fermentation Purified Indigo dye Campos et al.,
2001
2. Trametes modesta Semi-Solid State Fermentation Crude
Acid Blue 225, Acid Violet 17, Basic Red 9 base, Direct Blue 71 Reactive Black 5, Acid Blue 225, Acid Violet 17, Basic Red 9 base Direct Blue 71, Reactive Black 5
Nyanhongo et al., 2002
3. Ganoderma lucidum KMK2
Solid State Fermentation Crude Remazol Brilliant Blue R,
Reactive Black 5 Chang et al.,
2006
4. Trametes trogii Liquid media Crude
Neolane yellow, Neolane pink , Neolane blue, Bezaktiv yellow
Zouari -Mechichi et al., 2006
5. Trametes hirsute Solid State fermentation Crude
Derma Carbon NBS, Derma Burdeaux V, Derma Pardo 5 GL, Derma Blue DBN, Sella Solid Blue 4GL, Sella Solid Yellow4GL
Couto SR 2007

48
Table 2.1 Enzyme mediated bioremediation (Continued)
S. No Organism Type of
fermentation Nature Dyes References
6. Stereum ostrea Liquid media Purified Remazol Black 5, Remazol Brilliant Blue R, Remazol Orange 16
Viswanath et al., 2008
7. Pleurotus sajor-caju
Solid State Fermentation Unbound enzyme Indigo carmine
Sarnthima and Khammaung et
al., 2008
8. T. pubescens Solid State Fermentation Crude Reactive Black 5 Roriz et al., 2009
9. Trametes sp. AH28-2
Solid State Fermentation Crude Levafix Blue CA,
Cibacron Blue FN-R Sun et al., 2009
10. Rigidoporus lignosus Liquid media Crude Malachite Green,
Reactive Brilliant Blue R Li et al., 2009
11. Trametes Versicolor
Solid State Fermentation Crude
Indigo carmine, Remazol Brilliant Blue R, Orange II, Congo Red
Stoilova et al.,.2010
12. Armillaria sp. (White rot fungus F022
Liquid media Purified Remazol Brilliant Blue R, Reactive Black 5, Brilliant Green
Hadibarata et al., 2011
13. T. maxima CU1 Liquid media - Dhouib modified medium
Purified
Acid Blue 25, Disperse Red 60, Acid Black 194, Reactive Blue 19, Disperse Blue 79, Disperse Orange 29, Reactive Black 5
Hernández-Luna et al., 2011
14. F. fomentarius laccase Wheat bran-SSF
Ammonium Sulphate precipitation
Polyazo dye Solophenyl red 3BL Neifar et al., 2011
15. Trametes sp. strain CLBE55 Liquid media Crude Sirius rose BB Benzina et al.,
2011
16. Trametes versicolor ATCC200801
Submerged fermentation Crude
Remazol Blue RR, Dylon Navy 17, Reactive Red 198, Remazol Red RR, Remazol Yellow RR
Sasmaz et al., 2011
17. Trametes trogii Solid State Fermentation Crude
Remazol Brilliant Blue R, Reactive Blue 4, Acid Blue 129, Acid Red 1, Reactive Black 5
Zeng et al., 2011
18. Trametes versicolor CBS 100.29 Liquid media Crude Crystal Violet, Phenol Red Moldes et al.,
2012
19. Mycena purpureofusca Liquid media Crude
Bromo Thymol Blue, Reactive Brilliant Blue R, Crystal Violet
Sun et al., 2012
20. T. versicolor DSM11269 Liquid media Crude
Alizarin red, Remazol Brilliant Blue R, Amaranth, Direct Blue 71, Reactive Black 5
Theerachat et al., 2012
21. P. pulmonarius CCB-19
Solid State Fermentation Crude Methylene Blue, Ethyl
Violet, and Congo Red
Dos Santos Bazanella et al.,
2013
22. Rigidoporus sp. Solid State Fermentation Crude
Acid Blue 113, Reactive Blue 19, Acid Red 88, Reactive Blue RGB, Reactive Black B, Reactive Orange 122,Direct Blue 14, Drimarene Blue HF-RL, Acid Blue 9, Orange G
Sridhar et al., 2013

49
2.2 SOLID STATE FERMENTATION
Adverse environmental impact has forced industries to opt for the
utilization of organic wastes specifically agro-industries as raw materials to produce
value-added by products by SSF (Kalogeris et al., 2003). SSF is defined as any
fermentation process occurring in absence or near absence of free liquid, employs an
inert substrate or a natural substrate as a solid support (Pandey et al., 1999; 2000). SSF,
for the production of commercially valuable products is at present under-utilized
(Robinson et al., 2001). In SSF, organisms such as fungi grow under conditions that
mimick environment close to their natural habitats, due to which they are more capable
of producing enzymes in comparison with enzyme production by Submerged
Fermentation (SmF) processes (Pandey et al., 1999; Couto et al., 2012). Figure 2.1
represents the two types of fermentation methodologies, depending upon the nature of
the support (Barrios-Gon alez and Mejía, 1996; Couto, 2012; Gonzalez et al., 2013).
Figure 2.1 Types of fermentation
Solid State Fermentation (SSF) is generally preferred because highly
concentrated crude enzymes are obtained at low costs (Kashyap et al., 2003;
Silva et al., 2005; Suresh et al., 2009; Machado et al., 2013). Moreover it has
numerous advantages over submerged fermentation system including high
volumetric productivity, relatively higher concentration of the products, less effluent
Fermentation
Solid-State Fermentation
Submerged Fermentation
50
generation, requirement for simple fermentation equipment (Nigam and Singh 1994;
Pandey et al., 2000; Holker et al.,., 2004; Kareem et al., 2009; Rehman et al., 2011;
Zeng et al., 2011; Couto 2012; Birhanli and Yesilada 2013; Machado et al., 2013).
Various agricultural substrates such as wheat bran, rice bran, rice peel, corn cob, cotton
seed husk, sugarcane bagasse, coconut shell, banana peelings, orange peelings,
vegetable wastes have been utilized by production of ligninolytic enzymes by SSF
(Pandey et al., 1999; Neifar et al., 2011; Dos Santhos Bazanella et al., 2013)
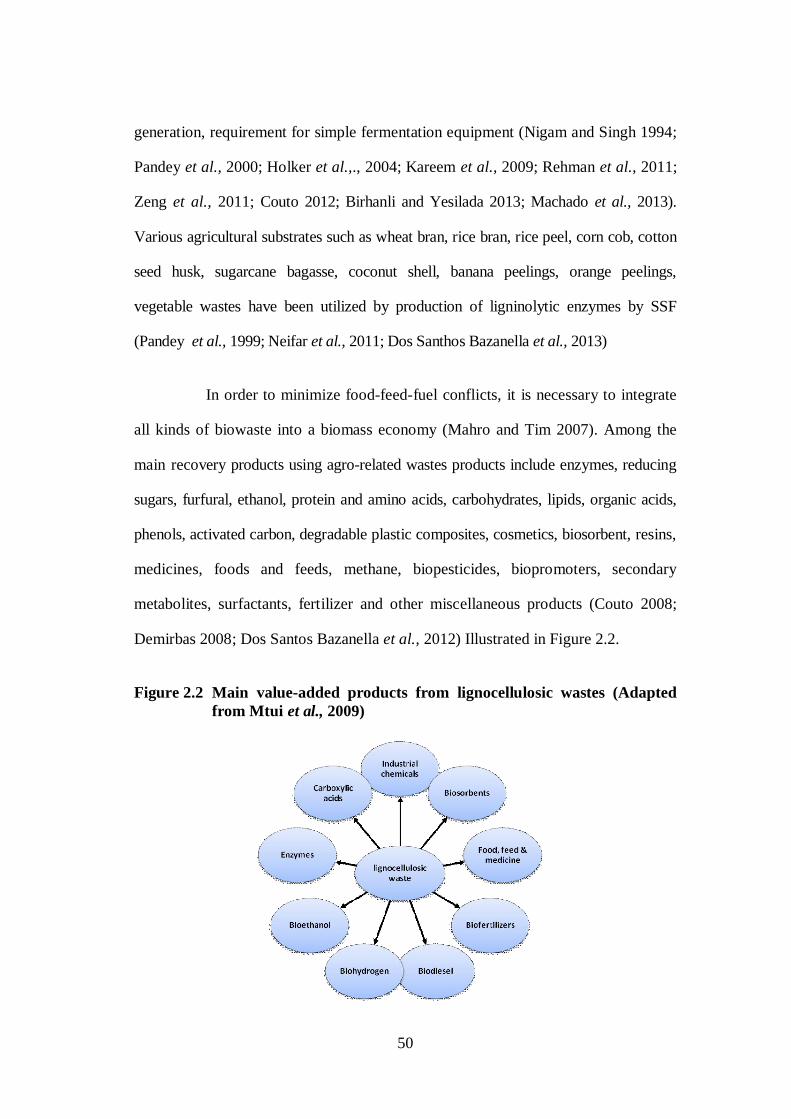
In order to minimize food-feed-fuel conflicts, it is necessary to integrate
all kinds of biowaste into a biomass economy (Mahro and Tim 2007). Among the
main recovery products using agro-related wastes products include enzymes, reducing
sugars, furfural, ethanol, protein and amino acids, carbohydrates, lipids, organic acids,
phenols, activated carbon, degradable plastic composites, cosmetics, biosorbent, resins,
medicines, foods and feeds, methane, biopesticides, biopromoters, secondary
metabolites, surfactants, fertilizer and other miscellaneous products (Couto 2008;
Demirbas 2008; Dos Santos Bazanella et al., 2012) Illustrated in Figure 2.2.
Figure 2.2 Main value-added products from lignocellulosic wastes (Adapted from Mtui et al., 2009)

51
Wheat bran, an abundant byproduct formed during wheat flour
preparation, provides a microenvironment similar to the natural habitat of the white
rot fungus, which is conducive for the high secretion of ligninolytic enzymes. In
addition, wheat bran is an abundant source for hydroxycinnamic acids, particularly
ferulic and p-coumaric acids, which are known to stimulate laccase production
(Neifar et al., 2009; Stoilova et al., 2010; Neifar et al., 2011). Laccase was the main
ligninolytic enzyme produced by most of the white rot fungus in wheat bran cultures
(Dos Santos Bazanella et al., 2013; Irbe et al., 2013). Wheat bran is the most
commonly used substrate for the cultivation of white-rot fungi in solid-state cultures
(Couto 2008; Boran and Yesilada, 2011). In our study, all decolorization
experiments of both prototypical dyes, singly and in combination (AB113, HFRL
and RB19) were performed using crude enzyme extract obtained after SSF without
further purification.
2.3 ENZYMATIC BIO-DECOLORIZATION OF TERNARY DYE MIXTURE
Textile manufacturing industries discharge effluents, containing more
than one dye, soluble organic and inorganic derivatives in the form of salts and
volatile compounds. Scientific communities till date have focused largely on
prototypical single dye bio-remediation without investigating the interactions and
reactions of multiple dye mixtures in real-time dyeing industries. Information is
scanty with regards to textile dye consortium decolorization by laccase catalyzed-
reactions (Chhabra et al., 2008; Cristóváo et al., 2009; Barreto et al., 2012). The
kinetics and thermodynamics involved in the process of decolorization has to be
investigated, as it may provide necessary insights regarding the mechanistic aspects
of laccase enzyme-assisted catalytic reactions. The information can be used to
possibly optimize experimental conditions for an improved dye decolorization

52
process. Three representative dyes such as AB113, HFRL and RB19 were selected
for further decolorization studies. The rationale for selecting the three dyes are as
follows; as Acid Blue 113 (AB113) is a commercially important diazo dye used
extensively in textile and tannery industry (Nachiyar et al., 2012), Reactive Blue 19
(RB19) is frequently used as a starting material in production of polymeric dyes
(Sun et al., 2012) and Drimarene Blue HFRL (HFRL) is more frequently used
reactive dyes (Baêta et al., 2012). The objective of the present work is to
demonstrate the thermodynamics of degradation at room temperature at their
optimum pH without addition of external added mediators.
2.4 MATERIALS AND METHODS
2.4.1 Textile Dyes and Chemicals
Acid Blue 113(AB113) was gifted by Punjab Rang Udyog, Punjab, India,
Orange G (OG) were purchased from Merck, Acid Blue 9 (AB9) and Direct Blue 14
(DB14) were purchased from Hi Media India limited, while all other dyes such as
Drimarene Blue HF-RL (HFRL), Reactive Blue 19 (RB19), Reactive Orange 122
(RO122), Reactive Blue RGB (RGB), Reactive Black B (BB) and Acid Red 88
(AR88) was gifted by India dyes and chemicals, Tirupur. All other chemicals and
solvents were purchased from SD fine Chemicals limited, Merck and Hi media India
limited.
2.4.2 Analytical Instruments
pH of the culture filtrate was measured using LI120 digital pH meter
(Elico, India). All enzyme assays, total protein assays and dye decolorization assays

53
were performed using the UV-Visible Spectrophotometer, SL 159 (Elico India
Private Limited).
2.5 FUNGAL ISOLATION
Rigidoporous sp. was isolated from Kodaikanal hills, Tamil Nadu, India.
This strain was submitted to the National Fungal Collection Centre (NFCC),
Agharkar Research Foundation, Pune, India for the molecular identification of the
fungi. It was authenticated by the isolation of genomic DNA and subsequent
amplification of rDNA fragments using universal primers as well as alignment and
analyses with publically available sequences. The analyzed DNA sequence was
submitted to Genbank and assigned an accession number (HQ018817). Stock
cultures were maintained in Potato Dextrose Agar (PDA) medium and stored at 4°C
with a periodic subculture.
2.5.1 Screening of the Strains for Ligninolytic Enzyme Production
Primary screening of the strains was done the by plate assay method.
Guaiacol were added to PDA medium (pH 5.0) at the concentration of 5 mM for the
qualitative screening of the oxidizing ability of the lignolytic enzyme. The isolates
were spot inoculated on the in Petri dishes (90 mm diameter), plates without
substrates were used as controls. For each test, 90 mm diameter plates were
inoculated at the center using a 7mm in diameter cylindrical plug of mycelium and
incubated at 27°C for ten days and observed for clear zones around the colonies
(Kiiskinen et al., 2004).

54
2.6 ENZYME AND PROTEIN CHARACTERIZATION
Clear crude enzyme was assayed for laccase activity using syringaldazine
as the substrate as described by (Szklarz et al., 1989). The reaction mixture for this
assay (in a total volume of 1 ml) consisted of 0.4 ml of Mcilvaine buffer (pH 5.0),
0.1 ml of 1 mM syringaldazine in ethanol, and 0.5 ml of extracellular clear filtrate.
Oxidation of syringaldazine to its quinone (molar absorptivity of 65,000 M-1 cm-1)
by laccase was measured by monitoring the increase in A525. Soluble protein content
in the extracellular filtrate was determined according to Bradford method (1976)
using Bovine Serum Albumin (BSA) as a standard protein (Bradford 1976).
However, the enzymatic activity reported represents the average of six experiments
along with standard deviation and the data presented here corresponded to average
values of three independent duplicates with standard deviation (Sridhar et al., 2012).
The enzyme activities were calculated using the following formula (Equation 2.1):
UmL
=((Ab( )- ( )×1000×Dilution factor )
Extinction coefficient ×Enzyme volume (mL)×time (Minutes) (2.1)
Molecular extinction coefficient (Syringaldazine) = 6.5 × 10⁴/M/cm
The extracted crude enzyme was subjected to ammonium sulphate
precipitation, followed by dialysis using 0.2M sodium acetate buffer. The partially
purified concentrated enzyme was analyzed for isoform patterns using a SDS-PAGE
in a 10% separating gel and 4% stacking gel (Laemmli 1970). Electrophoresis was
performed at a constant 100V for 60 minutes using a Mini-electrophoresis unit
(Bio-Rad). Proteins were visualised by staining for 3 hours with Coomassie Brilliant
Blue-R250. Gels were then destained with a mixture of acetic acid and ethanol
(40 %: 10 %). The Himedia protein molecular weight marker mix (Hi media, India)

55
included (sizes in Dalton): myosin: 205 kDa; phosphorylase B: 97.4 kDa; bovine
serum albumin: 66 kDa; egg albumin: 43 kDa; carbonic anhydrase: 29 kDa; trypsin
inhibitor: 20kDa; lysozyme: 14.3 kDa.
2.7 PRODUCTION OF CRUDE LACCASE ENZYME BY SOLID STATE FERMENTATION BY UNIVARIATE ANALYSIS
Twenty grams (20g) each of the eight different agro-wastes such as rice
bran (X1) , wheat bran (X2), cereal husk (X3), black gram husk (X4), cotton seed
husk (X5), corn cob (X6), green gram husk (X7) and millet husk (X8) were moistened
by adding distilled water in a 250 ml Erlenmeyer flask (Borosil) and then sterilized
by autoclaving at 121°C at 20 psi for 20 minutes. After cooling, the substrates were
inoculated directly into the Erlenmeyer flasks with an agar plug (diameter 6mm) cut
from the peripheral region of a 7-day-old actively growing fungus culture on PDA
medium. The cultures were kept under aerobic state condition at room temperature
(approximately 27±2°C) in static condition for fifteen (15) days. On the 16th day, the
crude enzyme was recovered by a simple extraction method. The fermented solid
agro waste substrates were mixed with 100 ml of 0.1 M sodium acetate buffer
(pH 5.8) and the contents were agitated in a rotary shaker for overnight incubation.
The crude extract was obtained by filtering it through a gauze cloth and
subsequently centrifuged at 2800g for 10 minutes (Remi, India and R-23). The clear
supernatant obtained was subjected to both enzyme and protein assays.
2.8 PRODUCTION OF CRUDE LACCASE ENZYME BY SOLID STATE FERMENTATION BY MULTIVARIATE ANALYSIS
The Plackett–Burmann design, an effective technique for medium-
component optimization, was used to select factors that significantly influenced
laccase production. This technique is based on the first-order polynomial model,
which has been used conventionally for statistical design-based optimization

56
processes (Plackett and Burmann, 1946). Based on the Plackett–Burmann design,
each factor was prepared in two levels: -1 for low level and +1 for high level.
Table 2.4 represents the design matrix of eight variables. Eight variables such as rice
bran (X1), wheat bran (X2), cereal husk (X3), black gram husk (X4), cottonseed husk
(X5), corncob (X6), green gram husk (X7) and millet husk (X8) were taken according
to the matrix experimental design. The fermentation procedure, enzyme recovery
and activity of the laccase were estimated as described above. Laccase production
was carried out in triplicate and the average value along with standard deviation was
taken as the response. Those factors with p values less than 0.05 (95%) were
considered to have a significant effect on laccase production (Sridhar et al., 2012).
2.9 PHYSICO-CHEMICAL PROPERTIES OF CRUDE LACCASE ENZYME
Various physico-chemical process parameters such as pH, temperature
and thermostability of the crude laccase enzyme were investigated. Crude laccase
activity as a function of pH was measured in 0.2M Mcilvaine’s buffer (over a pH
range of 3.0 to 8.0), to predict the optimum pH using the aforesaid assay by
correlating with laccase activity. Subsequently, temperature conditions were
optimized at the optimal pH (30-80°C at an interval of 10°C for one hour using
0.2 M Mcilvaine’s buffer).
2.10 SUBSTRATE SPECIFICITY
Substrate specificity of laccase was studied using syringalzazine for
laccase activity determination (Xu 1996; Palmieri et al., 1997). Kinetic studies were
conducted using five different substrate concentrations (Syringaldazine) ranging
from 1mM – 5mM were assayed at the optimal pH and at room temperature for each
57
enzyme. Triplicates of each assay were performed (N = 3). The data was subjected
to nonlinear regression analysis (Graph Pad Prism Software) using the Michaelis-
Menten equation and the kinetic parameters (Km and Vmax) were determined. After
optimizing the process variables, using commercial available substrates, the enzyme
was evaluated interms of its decolorizability.
2.11 ENZYME BASED DECOLORIZATION
Synthetic textile decolorization studies using crude enzyme, obtained by
SSF using wheat bran from Rigidoporous sp., was investigated using ten different
textile dyes separately. The reaction mixture consist of 0.5 ml of 100 mg L 1 dye
concentration, 0.5 ml of crude enzyme in 3.0 ml of 0.1 M McIlvaine’s buffer in a
total volume of 5 ml in a 10-ml air tight screw cap polypropylene vial (Roriz et al.,
2009). The reaction mixture was incubated at room temperature in the dark for
1 h under static conditions. Dye decolorization was measured by monitoring the
decrease in absorbance of each dye in a UV–Vis spectrophotometer (Elico, India)
and expressed in terms of a percentage. A control run was conducted in parallel,
where enzyme was replaced by the use of buffer in the reaction mixture. The
reactions were run in triplicate (N =3).
2.11.1 Enzyme-Based Remediation of Prototypical Dye Decolorization – One Factor at a Time Approach
Ten prototypical dyes such as AB113, OG, AB9, DB14, HFRL, RB19,
RO122, RGB, BB and AR88 was selected to study the potential decolourizing
ability of crude laccase. The influence of pH on dye decolorization was monitored
with 100 mgL-1 dye concentration at different pH ranging from 3.0 to 8.0 using the
above mentioned reaction conditions for two (2) hours. The influence of temperature
58
on enzymatic decolorization was studied by incubating the reaction mixture in a
screw cap polypropylene vial under different temperatures ranging between 30 °C to
80 °C at 10 °C intervals at the optimized pH for 2 hours. The residual dye
decolorization percentage was calculated at 30 minute intervals. At the same, pH
and the effect of incubation time on dye decolorization was determined by
incubating the reaction mixture for 2 hours at room temperature, and decolorization
percentage was calculated for every 30 minutes based on decrease in the absorbance.
The optimal dye concentration was determined by incubating the reaction mixture at
six different concentrations ranging from 25 mg/L to 150mg/L using optimal
conditions of pH under static conditions. The reactions were run in triplicate (N =3).
All the process parameters (pH, temperature, dye concentration and incubation time)
were optimized by one factor at a time and screened to study the influence of these
variables on improvements in prototypical dye decolorization. The graphical
representation of the effect of process parameters was represented as radar
representation generated using Microsoft Excel 2007 in all our studies.
2.12 ENZYME IMMOBILIZED CALCIUM ALGINATE BEAD MEDIATED DECOLORIZATION
One hundred ml of sterile sodium-alginate solution (3%, w/v) was mixed
with 10 ml of crude filtrate of enzyme obtained from Rigidoporus sp. grown on
wheat bran as solid support. The clear crude enzyme supernatant was used as such
(without any further processing and purification) for all dye decolorization studies.
The crude enzyme and sodium-alginate mixture was thoroughly mixed using a
magnetic stirrer and withdrawn aseptically using a sterile syringe fitted with an 18
gauge needle. The mixture was slowly fed into 0.2 M calcium chloride solution from
a height of 20 cm using sterile syringe. Calcium alginate beads are formed instantly

59
upon contact with 0.2 M calcium chloride solution forming beads of 2.0-3.0 mm
diameter. The beads were allowed to harden for about 2 hours at 8°C in the 0.2 M
calcium chloride, after which this solution was removed. The beads were washed
twice with distilled water and stored in 50mM calcium chloride solution.
Immobilization (%) was inferred from the difference in enzyme activity in the
solution before and after the immobilization (Equation 2.2)
Immobilization (%)=[Aload-Awash]
Aload×100 (2.2)
where, Aload is total loaded activity into the mixture of sodium-alginate solution
assayed using syringaldazine as substrate and Awash is laccase activity detected in the
curing solution. All immobilized crude laccase alginate beads were kept in double
distilled water at 4°C.
2.12.1 Immobilized Enzyme-Mediated Remediation of Prototypical Dye Decolorization – One Factor at a Time Approach
The effect of dye concentration, incubation and contact time towards
decolorization of three prototypical dyes (AB113, HFRL and RB19) was studied by
adding optimal enzyme immobilized beads (1, 3, 5, 7 and 9) to six 15 ml screw cap
vials (Borosilicate) containing 10 ml of textile dye (concentration ranging from 50 to
300 mg/L). Samples were aliquoted at every one hour to seven hours. Dye
decolorization was measured by monitoring the decrease in absorbance of each dye
in a UV–Vis spectrophotometer (Elico, India) and expressed in terms of percentage.
A control run was conducted in parallel, where enzyme was replaced by the use of
distilled water alone in the reaction mixture. The reactions were run in triplicate
(N =3). The graphical representation of the effect of process parameters was

60
represented as radar representation generated using Microsoft Excel 2007 in all our
studies.
2.13 EFFECT OF CRUDE ENZYME TOWARDS DECOLORIZATION TERNARY DYES
The effect of mixture of three lead textile dyes such as HFRL, AB113
and RB19 on the dye decolorization potential of the crude enzyme was determined
(Barreto et al., 2012). The influence of pH on dye decolorization was monitored for
two hours using a mixture of dye solution, obtained by mixing three dyes namely
AB113, HFRL and RB19 in equal proportions (1:1:1). at different pH ranging from
3.0 to 8.0 using the reaction conditions for two hours as follows; the reaction
mixture consist of 0.5 ml of dye consortia, 0.5 ml of crude enzyme in 3.0 ml of
0.1 M McIlvaine’s buffer in a total volume of 5 ml in a 10-ml air-tight screw cap
polypropylene vials (Roriz et al., 2009). The reaction mixture was incubated at room
temperature in the dark for two hours under static conditions. Dye decolorization
was measured by monitoring the decrease in absorbance of each dye in a UV–Vis
spectrophotometer (Elico, India) and expressed in terms of percentage. A control run
was conducted in parallel, where enzyme was replaced by the use of buffer in the
reaction mixture. The reactions were run in triplicate.
2.14 KINETICS AND THERMODYNAMICS OF CRUDE LACCASE ENZYME TOWARDS TERNARY DYE DECOLORIZATION
Kinetics and thermodynamics of crude enzyme mediated towards ternary
dye decolorizaton were investigated by incubating the reaction conditions as
mentioned above at different temperatures (30, 40, 50, 60 and 70 °C). Aliquots were
withdrawn at periodic intervals, cooled and the quantified dye decolorization in
terms of percentage decolourized. Thermodynamic parameters such as free energies

61
G), enthalpy ( H) and entropy ( S) involved in the degradation process can be
estimated by making use of the absolute reaction rates (Whitaker 1994). The
temperature dependency of the decolorization rate can be expressed as represented
in Equation (2.3):
lnKT
=lnkb
h+
SR
-H
R.T(2.3)
where R is the universal gas constant, T the absolute temperature, h the Plank
constant (6.6262×10⁻³⁴ J/s) and k the Boltzmann constant (1.3806×10⁻²³ (J/(mol.K)).
The values for H* and S* were calculated from the slope and intercept of the plot
of ln(K/T) versus 1/T.
Equation (2.4) represents the standard equation, from which Gibbs free
energy ( G) can be estimated from the following below mentioned relationship
(Annuar et al., 2009),
G= H-T S (2.4)
2.15 RESULTS AND DISCUSSION
2.15.1 Isolation of Organisms
Our fungal isolate was found to be non-sporulating hyaline form solitary,
intercalary Chlamydospores. Molecular sequence analysis revealed that the strain
ABTRI-I showed 99% sequence similarity with Rigidoporus sp (Figure 2.3). The
analyzed DNA sequence was submitted to Genbank and was assigned an accession
number (HQ018817). The stock cultures were maintained in PDA medium and
stored at 4°C with a periodic subculture (Figure 2.4).

62
Figure 2.3 Molecular sequence analyses
Figure 2.4 Fungal culture
63
2.16 PRODUCTION OF CRUDE LACCASE ENZYME BY UNIVARIATE ANALYSIS
Twenty grams each of the eight different agro-wastes such as rice bran,
wheat bran, cereal husk, black gram husk, cotton seed husk, corn cob, green gram
husk and millet husk was used as a solid support for production of laccase using
Rigidoporus sp. Laccase is common component of fungal components (Mayers and
Staples 2002; Sadhasivam et al., 2008). The characterization of laccase enzyme activity
present was carried out according to Skarlz et al., 1989 and the enzyme titers obtained in
the present study were within the comparable range of reported literatures (Elisashvili
et al., 2009; Krishnaprasad 2011; Sridhar et al., 2012). Among the eight agro-wastes,
wheat bran gave the maximum laccase activity. The order of decreasing solid-
support in terms of laccase activity is Wheat bran (0.722±0.084 U/mL) > Pearl
millet (0.607±0.007U/mL) > Cotton seed husk (0.527±0.021 U/mL) > Corn cob
(0.478±0.022 U/mL) > Rice bran (0.468 ±0.023 U/mL) > Channa
(0.440±0.031U/mL) > Cereal husk (0.361±0.023 U/mL) > Black gram
(0.152±0.016 U/mL) using Rigidoporus sp. as solid support on incubation for 15 days.
Bjerkandera adusta, Fomes fomentarius, Fomes fomentarius IBB 38,
Ganoderma applanatum IBB 107, Pleurotus ostreatus IBB 10, Pleurotus tephroleuca
IBB 50, Pleurotus gibbosa IBB 17, Pleurotus gibbosa IBB 22, Trametes hirsuta IBB
45, Trametes ochracea IBB 7, Trametes pubescens IBB 11, Trametes versicolor IBB
13, Trametes versicolor IBB 16, Trametes biforme IBB 117 produced 0.89±0.12 U/mL,
4.34±0.40 U/mL, 12.34±0.960 U/mL, 0.55±0.390 U/mL, 8.18±1.15 U/mL,
1.59±0.21 U/mL, 0.81±0.09 U/mL, 5.06±0.360 U/mL, 3.5±0.380 U/mL,
0.65±0.040 U/mL, 5.46±0.410 U/mL, 0.4±0.050 U/mL, 1.93±0.210 U/mL and
2.09±0.180 U/mL laccase enzyme respectively grown on wheat bran as solid support
on incubation for 14 days. Maximal laccase enzyme production by Bjerkandera
adusta, Trametes versicolor, Phlebia rufa and Ganoderma applanatum by solid state
64
fermentation using wheat straw as substrate reported 0.004, 0.216, 0.049, and
0.062U/mL respectively after 28 days of incubation (Dinis et al., 2009).
Pleurotus sp. IE137 and Pleurotus pulmonarius CCB19 reported a maximum
laccase activity of 0.145 U/mL and 20 U/mL grown on Wheat bran as solid support
(Gonzalez et al., 2013). Other fungi such as Trametes trogii and Trametes versicolor
reported 0.214 U/mL and 0.215U/mL on 10 days of incubation using wheat straw
(Birhanli and Yesilada 2013).
Marasmius sp. grown on rice husk produced highest laccase activity
(1.116U/mL) on day 10. Similarly Marasmius sp. reached peak activity at
0.872 U/mL followed by T. hirsuta and T. versicolor with a peak activity of
0.400U/mL (on day 8) and 0.134U/mL (on day 8) respectively grown on corn cob as
solid support (Risdianto et al., 2012). Pleurotus pulmonarius reported laccase as
main ligninolytic enzyme produced by SSF using Wheat bran (0.830U/mL), Corn
cob (0.450U/mL), Rice hull (0.600U/mL) as solid support respectively on 10 days of
incubation (Laccase activity is given in paranthesis) (Dos Santos Bazanella 2013).
2.17 PRODUCTION OF CRUDE LACCASE ENZYME BY MULTIVARIATE ANALYSIS
In Plackett-Burmann design, each factor was prepared in two levels; low
level (-1) and high level (+1) based on Plackett–Burmann design (PBD) (Plackett
and Burmann, 1946). Table 2.4 represents the design matrix of eight variables.
Table 2.2 represents the design matrix of eight variables. Eight variables such as rice
bran (X1), wheat bran (X2), cereal husk (X3), black gram husk (X4), cotton seed husk
(X5), corn cob (X6), green gram husk (X7) and millet husk (X8) were taken according
to the matrix experimental design.

65
Plackett-Burmann design was applied to investigate the relative
significance of eight variables with the minimum and maximum laccase production
values being 1.210± 0.20 to 4.251± 0.20 U/gds. The Plackett-Burmann Design
(PBD) uses the predictive model equation based on the multiple regression analysis
for crude laccase production. The student t-test, corresponding p value and ANOVA
table along with the parameter estimate are given in Table 2.3.
The p values were used to check the significance of each of the coefficients
which, in turn, are necessary to understand the pattern of mutual interactions between
the best variables. The parameter estimates and the corresponding p-values showed that
among the variables, X2, X3, X4, X5 and X7 had significant effect on laccase enzyme
production. X2, X3, X4, X5, X6 and X8 displayed a positive effect for laccase production,
whereas X1 and X7 had a negative effect on laccase production. The variables with
confidence levels greater than 95% were considered as influencing laccase
production significantly. Pareto analysis illustrates the order of significance of the
variables affecting laccase production as X2 >X3 > X5> X7 >X4.
Based on Pareto analysis, wheat bran was selected for production of
extracellular enzymes for all further studies. Wheat bran was as substrate for
production of extracellular enzyme because, it occurs as a by-product of the
commercial wheat milling process, which could be a potential source of added-value
biomolecules such as hydrocinnamic acid derivatives and other phenolic derivatives
(Hofrichter et al., 1999; Neifar et al., 2009). Wheat bran provides a conducive, natural
habitat for high secretion of lignino-cellulolytic enzymes without incorporation any
initial amount of carbon and nitrogen supplements, thereby reducing the process
economics. Natural phenolic mediators such as ferulic acid, coumaric acid and
syringic acid are present as abundant source in wheat bran, which stimulates in
enhanced laccase enzyme production in white rot fungi (Revankar et al., 2006).

66
Table 2.2 Multivariate Response using Plackett-Burmann design for Laccase production by Solid State Fermentation
Run Order
Rice bran (X1)
Wheat bran (X2)
Cereal husk (X3)
Black gram (X4)
Cotton husk (X5)
Corncob (X6)
Pulse husk (X7)
Millet husk (X8)
Response ± SD (U/g)
1 1 -1 1 -1 -1 -1 1 1 2.191±0.25 2 1 1 -1 1 -1 -1 -1 1 3.350±0.22 3 -1 1 1 -1 1 -1 -1 -1 3.787±0.34 4 1 -1 1 1 -1 1 -1 -1 3.929±0.14 5 1 1 -1 1 1 -1 1 -1 2.829±0.15 6 1 1 1 -1 1 1 -1 1 4.251±0.20 7 -1 1 1 1 -1 1 1 -1 3.730±0.20 8 -1 -1 1 1 1 -1 1 1 3.395±0.22 9 -1 -1 -1 1 1 1 -1 1 3.961±0.22
10 1 -1 -1 -1 1 1 1 -1 1.210±0.20 11 -1 1 -1 -1 -1 1 1 1 1.376±0.18 12 -1 -1 -1 -1 -1 -1 -1 -1 1.532±0.19
(* Statistically significant at 95% confidence limit)
Table 2.3 Levels of the variables, statistical analysis and ANOVA of Plackett-Burman design for crude laccase production
Code Substrate Low level (g)
High level (g)
Effects Coefficients t test Prob>[t]
2.9726 38.26 0 X1 Rice Bran 3 6 -0.0243 -0.0122 -0.16 0.886 X2 Wheat Bran 3 6 0.4967 0.2483 3.2 0.049* X3 Cereal husk 3 6 1.1914 0.5957 7.67 0.005* X4 Black Gram 3 6 1.1616 0.5808 7.47 0.005* X5 Cotton husk 3 6 0.5747 0.2874 3.7 0.034* X6 Corncob 3 6 0.2082 0.1041 1.34 0.273 X7 Pulse husk 3 6 -0.9925 -0.4962 -6.39 0.008* X8 Millet husk 3 6 0.2719 0.136 1.75 0.178 Source DF Seq SS Adj SS Adj MS F value Prob>[t]
Main Effects 8 13.3461 13.3461 1.66826 23.02 0.013* Residual
Error 3 0.2174 0.2174 0.07246
Total 11 13.5634
S=0.26177 PRESS = 3.4779 R2= 98.40%, R2(Pred)=74.36%, R2(Adj)=94.12%
(* Statistically significant at 95% confidence limit)

67
2.18 ENZYME CHARACTERIZATION
A substrate specific for laccase assay was performed using syringaldazine
[N, N9-bis (3,5-dimethoxy hydroxybenzylidenehydrazine)] as substrate (Leonowicz
and Grzywnowicz, 1981; Sarnthima et al., 2009). The minimal and maximal laccase
enzyme activity produced Rigidoporus sp. grown on wheat bran for fifteen (15) days
as solid support is 0.312±0.015 U/mL and 0.722±0.084 U/mL respectively is
represented in Figure 2.5.The enzyme secretion depends on the physiological,
nutritional and biochemical nature of the microorganism employed, and even on the
strain of the microorganism (Neifar et al., 2011; Birhanli and Yesilada, 2013;
Nandal et al., 2013).
Figure 2.5 Laccase enzyme production by wheat bran (Laccase activity using Syringaldazine as substrate at pH (pH 5.8) and at 30°C (Szkarlz et al., 1989)
0
1
2
3
4
5
6
7
8
9
1 2 3 4 5
Crud
e la
ccas
e ac
tivity
(U/m
L)
Trials
U/mL
U/mg

68
2.19 PHYSICO-CHEMICAL PROPERTIES OF CRUDE LACCASE ENZYME
2.19.1 Effect of pH and Temperature
Figure 2.6 Effect of pH on crude laccase activity obtained using wheat bran as solid support using syringaldazine as substrate at 30°C
Figure 2.6 represents optimum pH of crude laccase obtained from wheat
bran as solid support using syringaldazine as substrate studies at 30°C. The optimum
pH of crude laccase isolated from Rigidoporus sp. was found to be pH 6.0 (Chen
et al., 2010). Crude laccase was proved to be active pH in the range of 3.3 to 6.0 and
in consensus with date reported by others (Xu, 1999; Baldrian et al., 2006; Stoilova
et al., 2010; Fernandez et al., 2011; Sharma et al., 2013). Table 2.4 specifically
represents laccase enzyme activity from various fungi sources has reported (Bekker
et al., 1990; Galliano et al., 1991; Youn et al., 1995; Xu et al., 1996). Table 2.4
represents the optimum pH of laccase from various fungal laccase using
Syringaldazine as substrate.
0
0.2
0.4
0.6
0.8
1
1.2
3 4 5 6 7 8 9
Crud
e en
zym
e ac
tivity
(U/m
L)
pH

69
Table 2.4 Optimum pH of laccase from various fungal sources estimated using Syringaldazine as substrate
Organism pH References
Pleurotus sajor-caju Lac4 6.5 Soden et al., 2002
Coprinus cinereus Lcc1 5.5 Schneider et al., 1999
Pleurotus ostreatus POXA1 6.0 Palmieri et al., 1997
Rhus vernicifera 9.0 Xu et al., 1996
Rigidoporus lignosus 6.0 Galliano et al., 1988
Pleurotus sajor-caju Lac4 6.5 Soden et al., 2002
At higher alkaline pH, the enzyme activity decreased gradually, due to
the difference in redox potential between a reducing substrate and the type 1 copper
in the active site of the enzyme and the inhibition of type 3 copper by the hydroxyl
ion at higher pH (Sadhasivam et al., 2008). Under optimized pH conditions (pH
6.0), Figure 2.7 represents the effect of different temperature on crude laccase
activity (10°C increments, in the range 30–70°C). Crude laccase enzyme isolated
from Rigidoporus sp. using syringaldazine as substrate, maximal activity was
reported at 70°C. Abrahão et al., 2008 reported a class of isolated Basidiomycetes
with an optimum activity at 70 °C, on par with our results. It has been reported that
temperature stability of laccases varies considerably depending on the source of the
organism (Sadhasivam et al., 2008).

70
Figure 2.7 Effect of temperature on crude laccase activity obtained using wheat bran as solid support (Laccase activity using Syringaldazine as substrate at optimum pH (pH 6.0)
2.19.2 Protein Profiling
Molecular masses for laccases typically range between 60 kDa and
80 kDa (Palmieri et al., 1997; Sadhasivam et al., 2008), but in reality, there are few
exceptions are present in the nature, which do not adhere to this typical size
(Thurston 1994). Table 2.5 represents the molecular weights of laccases from
different fungal sources. SDS-PAGE profiling of laccase secreted by Rigidoporus
sp. grown on wheat bran as solid support secreted is represented, as all further
decolorization experiments are carried out using crude laccase obtained from Wheat
bran in the Figure 2.8. The molecular masses of Rigidoporus sp. proteins were
found grown on various agro-wastes were found to be between 43-66 KDa, falls
Sadhasivam et al., 2008).
0
0.1
0.2
0.3
0.4
0.5
0.6
0.7
0 20 40 60 80 100
Crud
e en
zym
e ac
tivity
(U/m
L)
Temperature°C
within the range of molecular masses reported in the literature (Baldrian et al., 2006;

71
Figure 2.8 Crude laccase profiling by SDS-PAGE obtained from wheat bran as solid-support
From left Lane 1:Wheat bran; Lane 2: Marker
Property N Median Q25 Q75 Min Max MW (kDa) 103 66 61 71 43 383 pI 67 3.9 3.5 4.2 2.6 6.9 Temperature optimum (°C) 39 55 50 70 25 80
pH optimum ABTS 49 3 2.5 4 2 5 2,6 Dimethoxyphenol 36 4 3 5.5 3 8 Guiacol 24 4.5 4 6 3 7 Syringaldazine 31 6 4.7 6 3.5 7
KM (µM) ABTS 36 39 18 100 4 770 2,6 Dimethoxyphenol 30 405 100 880 26 14720 Guiacol 23 420 121 1600 4 30000 Syringaldazine 21 36 11 131 3 4307
Kcat (S-1) ABTS 12 24050 5220 41460 198 350000 2,6 Dimethoxyphenol 12 3680 815 6000 100 360000 Guiacol 10 295 115 3960 90 10800 Syringaldazine 4 21500 18400 25500 16800 28000
Table 2.5 Properties of fungal laccases (Baldrian et al., 2006)

72
2.20 SUBSTRATE SPECIFICITY
The data observed for Michaelis-Menten (MM) kinetics with different
substrates is explained with help of syringaldazine as substrate. Table 2.5 represents
the main kinetic parameters, Vmax (maximum enzyme velocity) and Km (affinity
constant) using syringaldazine as substrates specifically Syringaldazine as substrates
for measuring the kinetic constants. Vmax, Km and Kcat values of laccases isolated
from various organisms widely vary for the same substrate (Yaropolov et al., 1994;
pH-independent for substrate, while the catalytic constant is pH-dependent.
Figure 2.9 represents the kinetic constants Vmax (maximum enzyme velocity) and
Km (affinity constant) for crude laccase obtained from Rigidoporus sp. using wheat
bran as solid support was found to be 0.9376±0.237 U/mL and 1.382±1.076mM at
their optimal pH (pH 6.0) and at 30°C temperature.
Figure 2.9 Effect of Km and Vmax on crude laccase activity (Laccase activity using Syringaldazine as substrate at optimum pH (pH 6.0) and at 30°C
Baldrian et al., 2006). The kinetic constants differ in their dependence on pH. Km is

73
2.21 ENZYME-BASED REMEDIATION OF PROTOTYPICAL DYE DECOLORIZATION – ONE FACTOR AT A TIME APPROACH - EFFECT OF PH, TEMPERATURE, DYE CONCENTRATION AND INCUBATION TIME TOWARDS DYE DECOLORIZATION
Crude laccase – catalyzed bioremediation is gaining avenues over past
decade due to its reactivity over wide range of substrates. Various parameters
affecting the decolorization of textile dyes were investigated in our research includes
pH (3-8), temperature (30°C-80°C), textile dye concentration (50- 300mg/L) and
incubation time (30-120 minutes). In our study, ten prototypical textile dyes such as
AB113, HFRL, RO122, RGB, AR88, OG, AB9, RB19, BB and DB14 were selected
for decolorization studies. Crude laccase-mediated decolorization of eight
representative dyes (AB113, HFRL, RO122, RGB, AR88, OG, AB9, and DB14)
was reported for the first time in our study. Decolorization of BB and RB19 by
crude laccase system has been reported in the past, whereas OG data showed no
detectable decolorization (Vyas and Molitoris, 1995, Sridhar et al., 2013).
Figure 2.10 represents the optimum pH for prototypical ten dyes after
two hours of incubation at room temperature. Figure 2.11 represents the effect of pH
of ten dyes towards decolorization. Among the ten dyes, seven dyes showed less
than 40% decolorization at their optimum pH, incubated at room temperature
without addition of any externally added mediators, after one hour of incubation, but
five dyes showed more than 40% decolorization on longer period of incubation of
two hours. Prolonged exposure of oxidizing enzymes had role in the decolorizing
ability, as the decreasing order of decolorization of the dyes were found to vary after
two hours of incubation, compared to one hour of incubation. The decreasing order
of decolorization after two hours were found to be; HFRL (99.93%) > AB113
(71.63%) > RO122 (53.50%) > RB19 (48.21%) > DB14 (45.24%) > AR88

74
(36.58%) > AB9 (30.97%) > BB (23.52%) > RGB (21.05%). This might be
attributed to the fact that redox potential of the dyes (reporting lower decolorization)
may be higher than that of crude laccase due to the dyes, which may not have had
access to the active site of the enzyme because of their structure (Sasmaz et al.,
2011).
In our present study, RB19 and DB14 decolorized at high pH, RO122 at
the neutral pH, and OG reported no detectable decolorization, while remaining dyes
reported decolorization at pH 5.0 (Gahlout et al., 2013). Results revealed that crude
enzyme showed good decolorization activity in the pH range between 3.0 and 7.0,
with optimum pH for maximum decolorization of pH 5.0 for remaining six dyes.
The most promising finding is that, out of ten, eight dyes were found to be
decolorized at acidic pH range from pH 3.0 to pH.5.0, may be due to the
participation of protons, leading to decolorization and also the variation in pH
optimum for crude enzyme being 6.0 may not effect decolourizability (Murugesan
et al., 2006; Gahlout et al., 2013; Yesilada et al., 2014).
Figure 2.12 represents the effect of temperature on ten dyes towards
decolorization at their optimum pH respectively. Temperature plays a significant
role in the process of textile dye decolorization. HFRL and AB113 showed more
than 65% at room temperature, while all other dyes except BB and RGB reported an
optimal temperature of 60 °C. BB and RGB reported to have maximal
decolorization of 21.63% and 20.88 % at 80°C and 70°C, respectively after two
hours of incubation. Decolorization of RO122, AR88, RBR and DB14 increases
with increase in temperature, as variation of dye decolorization might be attributed
to the thermostability of the crude enzyme. Dye decolorization was maintained at
30–60 °C but dropped beyond 70 °C. The decline of decolorization activity is

75
probably due to the denaturation of crude laccase enzyme at high temperatures
(Shamsuri et al., 2012). The increasing order of decolorization based on temperature
is as follows; HFRL=AB113 (30°C) > RO122=AR88=RBR=AB9=DB14 (60°C) >
BLUE RGB (70°C) > BB (80°C).
Figure 2.13 represents the effect of dye concentration and incubation
time towards dye decolorization. The order of tolerance of dye concentration of
various dyes is HFRL (300 mg/l) > AB113 / RB19 (150 mg/l) > DB14 (125 mg/l) >
RGB (100 mg/l) > RO122/BB/AR88 (50 mg/l) > AB9 (25 mg/l) at their respective
optimal pH conditions (Figure 2.11).
Figure 2.10 Optimum pH for ten prototypical dyes at 30°C at static condition
Similarly, the order of incubation time is HFRL /AB113 (30 min)
>RB19/AB9 (45 min)>RO122/BB/RGB/AR88/DB14 (60 min). AB113 reached
maximal decolorization within 30 min of incubation, followed by RB19 and AB9,
while remaining took 60 min to reach maximal decolorization at their respective
optimal pH. OG showed increase in the absorbance leading to polymerization
reactions. Dye concentration of up to 300 mg/l was tolerated, resulting in slow
decolorization but is not inhibitory. Maximum decolorization was obtained within 1
hour of decolorization at room temperature.
0 1 2 3 4 5 6 7 8
AB113
BLUE RGB
BLACK B
RO122
DB14
pH
Prot
otyp
ical
Dye
s

76
Figure 2.11 Effect of pH towards dye decolorization by enzyme remediation methodology at 30°C
Figure 2.12 Effect of temperature towards dye decolorization by enzyme remediation methodologyat optimum pH and at repective temperatures (°C)

77
Figure 2.13 Effect of dye concentration and incubation time towards dye decolorization by enzyme remediation methodology at dye optimum pH and temperature
2.22 ENZYME IMMOBILIZED CALCIUM ALGINATE BEADS MEDIATED DYE DECOLORIZATION
Crude enzyme immobilized calcium-alginate bead based methodology
was applied to investigate the decolorization of three dyes such as AB113, HFRL
and RB19 under static conditions in aqueous media. The effect of three process
variables such as dye concentration (mg/L), incubation time (hours) and crude
enzyme immobilized calcium-alginate microcapsules were selected to investigate its
influence towards dye decolorization.
The effect of crude enzyme immobilized beads towards decolorization
was studied by adding three, five and seven beads at a standard dye concentration of
78
100mg/L. As incubation time is increased, the decolorization of the dyes also
increased. This may be attributed to be due increase in contact time, resulting in
more reactivity and hence, enhanced decolorization.
Figure 2.14 (A), (B) and (C) represents the effect of crude enzyme
immobilized calcium alginate microcapsules and incubation time towards
decolorization of three prototypical dyes (AB113, HFRL and RB19) respectively.The
effect of microcapsules had little variation with respect to incubation time, as the crude
enzyme was able to decolorize the dye effectively, where after three and five hours
of incubation, the decolorization percentage of dyes is as follows; 48.37% and
58.23% (AB113), 86.37% and 91.55% (HFRL), 15.73% and 31.86% (RB19)
respectively. After seven hours of incubation of the dye solution, at 100mg/L of dye
concentration of each dye and addition of seven microcapsules, resulted a maximum
decolorization of 60.11% (AB113), 92.32 % (HFRL) and 32.50% (RB19). Cell free
systems are faster in buffered homogenous phase, as enzymes accelerate their reactions
by entropic effects, playing a major role in a biochemical reaction (Villá et al., 2000).
The reason for the low percentage of decolorization and biodegradability might be due
to the resistant and more stable organic structure of this anthraquinone dye.
The effect of dye concentration towards dye decolorization was studied
using six dye concentrations ranging from 50 mg/L to 300 mg/L, at an optimal crude
enzyme immobilized calcium alginate beads of five beads for all three dyes over
seven hours.
Figure 2.15 (A), (B) and (C) represents the effect of dye concentration
and incubation time towards decolorization of three representative dyes such as
AB113, HFRL and RB19 respectively. There was a linear decrease in the percentage

79
decolorization with increase in the dye concentration, because this may be attributed
to fact that, the dyes may/might inhibit the enzyme or the steric factors might reduce
the oxidation-reduction potential of the enzyme or finally, the enzyme active sites
may/might be saturated (Wesernberg et al., 2003; Sharma et al., 2009; Zucca et al.,
2012). In case of AB113, after 150 mg/L of AB113 dye concentration, the
decolorizing ability became saturated and it showed a decline in percentage
decolorization. In the case of HFRL, the enzyme was able to tolerate 150 mg/L of
HFRL dye, while in the case of RB19; the enzyme was able to tolerate only
100mg/L of RB19 dye concentration. After seven hours of incubation, at a standard
100mg/L dye concentration, the percentage decolorization was found to be 58.30%
93.70% and 32.49% for AB113, HFRL and RB19 respectively.
Figure 2.14 Effect of dye concentration and incubation time towards dye decolorization by crude enzyme immobilized calcium alginate beads

80
Figure 2.15 Effect of crude enzyme immobilized calcium alginate beads and incubation time towards dye decolorization of three dyes
2.23 ENZYME MEDIATED DECOLORIZATION OF TERNARY DYE COMPLEX
The decolorization of ternary dye mixture was compared to individual
dyes in terms of percentage decolorization (69%, 98% and 45% of decolorization of
AB113, HFRL and RB19 at their optimum pH of 5.0, 5.0 and 3.0 respectively
compared to >70% at pH 4.0). Figure 2.17 represents the comparison among single
and ternary dye complex by crude-laccase mediated decolorization.

81
Figure 2.16 Crude laccase-mediated decolorization of single and mixture of textile dyes at optimum pH (pH 4.0) and at 30°C
All kinetic and thermodynamic studies of the ternary dye mixture were
carried out at optimum pH (pH 4.0). A precise mathematical description of enzyme-
assisted decolorization is indispensable for the accurate prediction of thermodynamic
parameters involved in decolorization process. Equation (2.5) represents the
equation for calculating thermodynamic parameters (Laidler and Meiser 1999).
lnKT
=lnkb
h+
SR
-H
R.T(2.5)
Table 2.6 First order rate – regression analysis at various temperatures at dye optimum pH (pH 4.0)
Temperature ( C) Rate
30°C y = -0.0027x - 1.4639 40°C y = -0.0022x - 1.2471 50°C y = -0.0019x - 1.2582 60°C y = -0.0007x - 1.5233 70°C y = -0.0004x - 1.1285

82
Transition state theory explains the reaction rate in terms of change in the
free energy change, if the system passes to a transition state, transition state occurs
with a large increase in entropy, the reaction proceeds faster. In the same way, in
cases where there is decrease in entropy, the reaction will proceed slowly
(Panchenkov and Lebedev 1976). The order of the reactions was determined by
fitting the best straight line obtained to rate equations for zero-order, first order and
second order reactions. Based on the graphs, the kinetics for the degradation/
decolorization reactions with straight lines with best values of correlation coefficient
(R) for first-order kinetics was calculated (Table 2.6).
Crude laccase catalyzed bio-degradation reaction were found to be
enthalpy-driven (high negative H values: – 43.856KJ/), with negative entropy
S: -15.206J/mol. K) indicating that in the transition state, more complex ternary
dye structures were formed (Barreto et al., 2012).
Negative values of free entropy changes indicate a reduction of unstable
systems at the interface between enzyme and ternary dye complex. Negative entropy
is associated with non-randomness i.e. the activated complex is highly organized
compared to reactants and such reactions, because, when the dye complex and the
crude are separate in the liquid phase, the translational motion leads to high
disorientation (High entropy), whereas during equilibrium or near-equilibrium the
activity of dye complex is restricted and posses low entropy (Whiteley and Lee
2006).
Thermodynamic parameters such as Gibbs free energy ( G), Enthalpy
H) and Entropy ( S) were calculated using Erying-Polanyi plot (Figure 2.17).
Results indicate that the reaction is endoergonic by nature, where G of the reaction

83
positive ( G = 71.62KJ/mol), supporting slow degradation of the ternary complex at
the transition state. The decolorization reaction were found to be non-spontaneous as
indicated by positive G values, implies that decolorization is thermodynamically
limited. The positive free energy indicates a reversible process, as it proceeds
through a sequence of equilibrium state as reversibility of a reaction depends upon
the solution conditions.
Oxidation by oxidative-redox enzymes generates breakdown products
(intermediary metabolites), which undergo linking/coupling reactions, where
breakdown product react with each other and/ or with parent dyes, leading to less
soluble polymers, depolymerization (i.e. breakdown of existing formed polymers)
and finally ring cleavage of synthetic aromatic dyes (Zille et al., 2005, Franciscon
et al., 2010, Demarche et al., 2011). The possible hypothetical mechanism of
positive free energy might be due to initiation of coupling reaction, restricting
forward direction, thereby maintaining the complex at near-transition state, even
though there is decrease in the absorbance at absorption maxima. Variation in the
degradation rates might be attributed to structural changes located near the active
sites (Barreto et al., 2012).
AB113 produces soluble polymers leading to darkening of solution;
HFRL undergoes complete decolorization, while RB19 undergoes degradation with
little change in color with decrease in the absorption maxima based on our previous
studies (Sridhar et al., 2013). The decolorization pattern of ternary dye mixture
reported better decolorization compared to individual dyes in terms of percentage
decolorization (65%, 98% and 45% of decolorization of AB113, HFRL and RB19 at
their optimum pH of 5.0, 5.0 and 3.0 respectively compared to 80% at pH 4.0).

84
Based on the thermodynamic parameters, crude laccase catalyzed reactions are
non-spontaneous, where T S outweighs H at certain higher temperatures. The high
redox potential of the free enzyme accesses ternary dye complex, bringing
decolorization.
Figure 2.17 Eyring-Polanyi plot to predict thermodynamic parameters
Ln(k/T) = - H/RT .+ln(kB/h)+ S/R A plot of ln (k/T) vs 1/t gives the slope and intercept Y = 5275x – 21.899 (R2 = 0.9157)
H/R = -5275 H = -5275×8.314 H = -43856.35J/mol H = -43.85 KJ/mol
Boltzmann constant = 1.3806×10⁻²³ Planck’s constant= 6.6262×10⁻³⁴
ln(kB/h)+ S/R = -26.290 ln {(1.3806×10⁻²³/6.6262×10-34) + S/8.314 = -21.899 ln(0.2084×10¹¹).8.314 + S = -21.899×8.314 (23.7601×8.314)+ S = -21.899×8.314 197.5418 + S = -182.06
S = -379.601 J/mol G = H-T S G =43856.35J -303 (-379.601) G = -65680+115018.8 G = 71162.45 G = 71.62KJ/mol

85
2.24 CONCLUSION
This research work highlights the probable avenues for bio-prospecting
various agro-wastes as substrates/mediators for the towards production of crude
extracellular laccase enzyme from Rigidoporus sp. We are reporting for the first
time the application of laccase-based remediation methodology using this enzyme
(crude) obtained by SSF to investigate the decolorization of ten representative
organic dyes under optimized/defined experimental conditions (pH, temperature,
dye concentration and incubation time). The decolorizability, kinetics and
thermodynamics of crude laccase enzyme of ternary mixture of three prototypical
textile dyes were studied to study the insights of mechanism of degradation. From
our studies, we conclude that, crude laccase obtained from wheat bran seem to be
good candidature towards dye decolorization at room temperature without addition
of any externally added mediators, as laccase acts on a wide of variety of substrates
making it suitable for a wide range of industrial application.