chapter 2: learning and teaching - eacea.ec.europa.eu · chapter 2: learning and teaching 47 figure...
TRANSCRIPT

Chapter 2: Learning and Teaching

The European
Higher Education Area
in 2018
Bologna Process
Implementation Report

This document is published by the Education, Audiovisual and Culture Executive Agency (EACEA, Education and Youth Policy Analysis).
Please cite this publication as:
European Commission/EACEA/Eurydice, 2018. The European Higher Education Area in 2018: Bologna Process Implementation Report. Luxembourg: Publications Office of the European Union.
Printed version EC-01-18-252-EN-C ISBN 978-92-9492-739-2 doi:10.2797/63509
PDF EC-01-18-252-EN-N ISBN 978-92-9492-740-8 doi:10.2797/265898
Epub EC-01-18-252-EN-E ISBN 978-92-9492-741-5 doi:10.2797/091435
This document is also available on the Internet (http://ec.europa.eu/eurydice).
Text completed in April 2018.
© Education, Audiovisual and Culture Executive Agency, 2018.
Reproduction is authorised provided the source is acknowledged.
Education, Audiovisual and Culture Executive Agency Education and Youth Policy Analysis Avenue du Bourget 1 (J-70 – Unit A7) BE-1049 Brussels Tel. +32 2 299 50 58 Fax +32 2 292 19 71 E-mail: [email protected] Website: http://ec.europa.eu/eurydice
3
FOREWORD
The Bologna Process has brought us a long way towards achieving the
goals for European higher education set two decades ago. This third
edition of the Bologna Process Implementation Report provides clear
evidence of change in the higher education landscape. It shows where
progress has been made, but also points to the gaps that need to be
filled if we are to strengthen European higher education cooperation on
the basis of quality and mutual trust.
Higher education has been evolving rapidly to respond to fast changing
demands. Overall in Europe, we are becoming better educated, as more
students have the opportunity to develop the high-level skills and knowledge that our societies require.
Thanks to the Bologna Process and the Erasmus+ programme, students have become more mobile,
and can benefit from study and employment opportunities abroad. Yet we also face challenges in this
changing environment: How do we recognise and reward good teaching as well as good research?
How do we ensure that young people from disadvantaged backgrounds can access and successfully
complete higher education? How do we remove burdensome recognition procedures to ensure that
students and graduates can be mobile? And how do we increase the relevance of higher education
programmes for a labour market that is in a state of permanent transformation? The Bologna Process
provides a space for countries to discuss these challenges, and this dialogue remains critical.
Twenty years ago four countries signed the Sorbonne Declaration, initiating a wave of coordinated
higher education reform through the Bologna Process. Now ministers from 48 European countries will
gather in Paris to take stock of our current situation, and to discuss the path forward. This
geographical evolution illustrates the impact the Bologna Process has had – and it highlights Europe’s
potential to set high standards for modern and relevant educational provision. The Bologna Process
has not only inspired change within European higher education, but also across other world regions.
This is important to recognise, as today, more than ever, Europeans have to embrace an increasingly
complex and inter-connected global reality.
We should of course be proud of our achievements. But we must not be complacent. We need to
redouble our efforts to bring Europe's higher education institutions, researchers and students even
closer together. The technical goals of the Bologna Process – converging degree structures, shared
standards for quality assurance and common recognition practice – were never ends in themselves.
Rather they were the preconditions for ensuring that we understand and trust each other's higher
education provision, enabling us to work together in a more seamless way. This is what our young
people demand, this is what our economies require and this is what our societies need.
The European Commission’s role is to support, but also to drive positive change. And this is why we
have been working on proposals to create a European Education Area by 2025. Our ambition is to
4
enable EU Member States to intensify and accelerate their cooperation in areas such as mobility,
multilingualism, innovation and mutual recognition of diplomas, and thus also to provide inspiration to
non-EU countries to follow. Our vision for 2025 is of a Europe in which learning, studying and doing
research will not be hampered by borders and in which people have a strong sense of their identity as
Europeans.
Where the Bologna Process has provided stable foundations, we must now build on them. Yet where
the foundations are still not stable, we must secure them. The Commission's actions will aim both at
working jointly with the EU Member States towards the European Education Area and at strengthening
the Bologna process with all partner countries.
Tibor Navracsics
Commissioner for Education, Culture, Youth and Sport

5
CONTENTS
Foreword 3
Table of Figures 5
Executive Summary 13
Introduction 17 The Bologna Process 17 Report outline 19
Chapter 1: The European Higher Education Area Landscape 21 1.1. Student population 22 1.2. Higher education institutions and staff 29 1.3. Expenditure on higher education 32 1.4. Values and governance 40 1.5. Conclusions 46
Chapter 2: Learning and Teaching 47 2.1. National and institutional strategies 48 2.2. Credits and learning outcomes 50 2.3. Modes and forms of study 66 2.4. Learning in digital environments 74 2.5. Teaching in new learning environments 83 2.6. Conclusions 91
Chapter 3: Degrees and Qualifications 93 3.1. Implementation of a common degree structure 94 3.2. Transparency of qualifications: Diploma Supplement and national qualifications frameworks 113 3.3. Conclusions 125
Chapter 4: Quality Assurance and Recognition 127 4.1. Quality Assurance 128 4.2. Recognition 142 4.3. Conclusions 151
Chapter 5: Opening Higher Education to a Diverse Student Population 153 5.1. Access and participation 154 5.2. Attainment and completion 193 5.3. Conclusions 214
Chapter 6: Relevance of the Outcomes and Employability 215 6.1. Graduates on the labour market: transition from education to work 216 6.2. Policies for enhancing graduates' employability 230 6.3. Conclusions 240
Chapter 7: Internationalisation and Mobility 241 7.1. Policies for internationalisation 242 7.2. Student Mobility 249 7.3 Staff mobility 274 7.4. Conclusions 276

6
Glossary and Methodological Notes 279 I. Codes, abbreviations and acronyms 279 II. General terms 280 III. Statistical terms 289 IV. Data sources 298 V. Notes on figures 303
References 317
Acknowledgements 323

7
TABLE OF FIGURES
Chapter 1: The European Higher Education Area Landscape 21 Figure 1.1: Number of students enrolled in tertiary education by ISCED level, 2014/15 23 Figure 1.2: Percentage change in the total number of students enrolled in tertiary education
between 2009/10 and 2011/12 and between 2012/13 and 2014/15 25 Figure 1.3: Enrolment rates in tertiary education for the 18-34 years old
(% of the total population aged 18-34), 2008/09, 2011/12 and 2014/15 27 Figure 1.4: Demographic projections in steering documents for higher education policy, 2016/17 28 Figure 1.5: Number of higher education institutions in the EHEA, 2016/17 29 Figure 1.6: Percentage change in the total number of academic staff between 2000 and 2016 30 Figure 1.7: Academic staff by age groups (%), 2015 31 Figure 1.8: Female academic staff (%), 2000 and 2016 31 Figure 1.9: Annual public expenditure on tertiary education as
a % of GDP, total with R&D and total without R&D, 2014 33 Figure 1.10: Annual public expenditure on tertiary education as
a % of total public expenditure, 2008, 2011, 2014 35 Figure 1.11: Yearly changes in real public expenditure on tertiary education
between year 2011 and year 2015 (price index 2010=100) 36 Figure 1.12: Annual public and private expenditure on public and private tertiary education institutions,
per full-time equivalent student in PPS, 2008, 2011 and 2014 37 Figure 1.13: Annual public expenditure on public and private tertiary education institutions,
per full-time equivalent student in euro, 2014 38 Figure 1.14: Annual public and private expenditure on public and private education institutions on tertiary education,
per full-time equivalent student in PPS relative to the GDP per capita in PPS, 2008, 2011 and 2014 40 Figure 1.15: Legal authority to appoint and/or dismiss higher education institution executive heads (rectors) and
some categories of higher education staff (e.g. professors), 2017 43 Figure 1.16: Decision making regarding the development of new higher education programmes, 2017 44 Figure 1.17: Support for higher education institutions to promote
gender equality, political and religious tolerance, and democratic and civic values, 2017 45
Chapter 2: Learning and Teaching 47 Figure 2.1: Expectations towards higher education institutions specified in national learning and teaching strategies
(% of institutions reporting that there is a national strategy in place), 2017 48 Figure 2.2: Elements included in institutional learning and teaching strategies
(% of institutions reporting that there is an institutional strategy in place), 2017 49 Figure 2.3: Credit system used for the accumulation and transfer of credits, 2016/17 51 Figure 2.4: Share of higher education institutions using ECTS credits for accumulation and transfer,
first- and second-cycle programmes, 2016/17 52 Figure 2.5: Share of first- and second-cycle programmes using ECTS credits for accumulation and transfer
for all elements of study programmes, 2016/17 52 Figure 2.6: Extent to which ECTS credits are linked with learning outcomes in higher education programmes, 2016/17 53 Figure 2.7: Basis to allocate ECTS credits in the majority of higher education institutions, 2016/17 54 Figure 2.8: Impact of the learning outcomes approach in higher education institutions (% of institutions), 2017 55 Figure 2.9: Steering and/or encouraging use of learning outcomes
in national policy for programme development, 2016/17 56 Figure 2.10: Steering and/or encouraging student assessment procedures
to focus on learning outcomes, 2016/17 57 Figure 2.11: Training for higher education teaching staff in developing learning outcomes (% of institutions), 2017 58 Figure 2.12: Basis for external quality assurance to monitor ECTS implementation in higher education, 2016/17 59

8
Figure 2.13: Monitoring key aspects of ECTS implementation by external quality assurance, 2016/17 60 A) Requirement to monitor learning outcomes and credit allocation 60 B) Requirement to monitor credit accumulation and transfer 61 C) Requirement to monitor appeals procedures for problems of credit recognition 61 Figure 2.14: Use of ECTS for credit accumulation and transfer by all higher education institutions,
first- and second cycle programmes, students' perspective, 2016/17 62 Figure 2.15: Elements used for the calculation of ECTS points
in public higher education institutions, students' perspective, 2016/17 63 Figure 2.16: Scorecard indicator n°1:
Monitoring the implementation of the ECTS system by external quality assurance, 2016/17 65 Figure 2.17: Provision of part-time programmes or other alternative study forms by higher education institutions, 2016/17 66 Figure 2.18: Existence of different formal student statuses related to modes of study, 2016/17 67 Figure 2.19: Impact of formal student status on
financial contributions related to higher education studies, 2016/17 68 Figure 2.20: Impact of formal student status on
eligibility to financial support for students, 2016/17 69 Figure 2.21: Median of country percentages of students enrolled as part-timers in tertiary education, by age, 2014/15 70 Figure 2.22: Students enrolled as part-timers in tertiary education, by country and by age (%), 2014/15 71 Figure 2.23: 25, 50 and 75 percentile of countries according to the percentage of students enrolled as part-timers in tertiary
education, by year, 2005-2015 72 Figure 2.24: Students qualifying themselves as full-timers (%), 2016/17 73 Figure 2.25: Part-time students according to their study intensity (self-reported) as % of students in different study intensity groups,
2016/17 74 Figure 2.26: National strategies on the use of new technologies in teaching and learning in higher education, 2016/17 75 Figure 2.27: National policies and allocated funding for promoting the use of new technologies in teaching and learning
in higher education, 2016/17 77 Figure 2.28: Incentives/support to the use of new technologies in teaching and learning
in higher education (other than direct public funding), 2016/17 78 Figure 2.29: Most commonly offered online courses by higher education institutions, 2016/17 80 Figure 2.30: Level of degree programmes with online components, most commonly offered, 2016/17 80 Figure 2.31: Level of most commonly offered online degree programmes, 2016/17 81 Figure 2.32 Quality assurance of online programmes, 2016/17 82 Figure 2.33: Trends in higher education institutions regarding digital learning, last three years, (% of institutions), 2017 82 Figure 2.34: Formal or most common requirements for holding higher education positions with teaching responsibilities (% of
institutions), 2017 84 Figure 2.35: Top-level requirements for third-cycle (doctoral) programmes to include teaching components, 2016/17 85 Figure 2.36: Measures to promote and develop teaching skills of academics (% of institutions), 2017 87 Figure 2.37: Means of assessment/enhancement of teaching in place throughout the institution (% of institutions), 2017 88 Figure 2.38: Students' satisfied with quality of teaching in their current study programme (%), 2016/17 90 Figure 2.39: Students agreeing with the statement that their teachers inspire them (%), 2016/17 90
Chapter 3: Degrees and Qualifications 93 Figure 3.1: Distribution of students enrolled in ISCED 5-8 programmes, 2014/15 95 Figure 3.2: Share of first cycle-programmes with a workload of
180, 210, 240 or another number of ECTS credits, 2016/17 96 Figure 3.3: Share of second-cycle programmes with a workload of
60-75, 90, 120 or another number of ECTS credits, 2016/17 97 Figure 3.4: Centrally set minimum total workload of first- and second-cycle programmes, 2016/17 98 Figure 3.5: Most common total workload of first- and second-cycle programmes, 2016/17 99 Figure 3.6: Proportion of first-cycle graduates entering a second-cycle programme within one year after graduation, 2016/17 100 Figure 3.7: Presence of short-cycle programmes considered as part of higher education, 2016/17 101 Figure 3.8: Typical (most common) workload of short-cycle higher education programmes, 2016/17 102 Figure 3.9: Recognition of short-cycle higher education within first-cycle studies in the same field, 2016/17 103 Figure 3.10: Proportion of second-cycle graduates eventually entering a third-cycle programme, 2016/17 105

9
Figure 3.11: Percentage of third-cycle candidates in doctoral schools, 2016/17 106 Figure 3.12: Duration of full-time third-cycle programmes as defined in top-level steering documents, 2016/17 107 Figure 3.13: Use of ECTS in third-cycle programmes, 2016/17 108 Figure 3.14: Presence of integrated/long programmes leading to a second-cycle degree and the percentage of students in these
programmes, 2016/17 109 Figure 3.15: Number of higher education systems reporting integrated/long programmes in defined fields, 2016/17 110 Figure 3.16: Programmes outside the Bologna-degree structure (other than integrated/long programmes), 2016/17 111 Figure 3.17: Number of higher education systems issuing the Diploma Supplement according to the agreed principles, first and
second cycle, 2016/17 114 Figure 3.18: Scorecard indicator n°2:
Stage of implementation of the Diploma Supplement, 2016/17 115 Figure 3.19: Issuing the Diploma Supplement to graduates in short-cycle higher education, 2016/17 116 Figure 3.20: Issuing the Diploma Supplement to third-cycle graduates, 2016/17 117 Figure 3.21: Monitoring of the implementation of the Diploma Supplement by top-level authorities or their mandated bodies, 2016/17117 Figure 3.22: Presence of large-scale projects/initiatives aiming to digitalise the Diploma Supplement, 2016/17 118 Figure 3.23: Progress in development of national qualifications frameworks according to the 11 steps, 2016/17 120 Figure 3.24: Use of national qualifications frameworks by national authorities, 2016/17 122 Figure 3.25: Scorecard indicator n°3:
Implementation of national qualifications frameworks, 2016/17 124
Chapter 4: Quality Assurance and Recognition 127 Figure 4.1: Requirements for higher education institutions to develop and publish quality assurance strategies, 2016/17 129 Figure 4.2: Responsibility for external quality assurance, 2016/17 130 Figure 4.3: Main outcome of external evaluation, 2016/17 131 Figure 4.4: Requirements for external quality assurance to consider the elements specified in the ESG 2015, 2016/17 132 Figure 4.5: European Student Unions perception of student participation in external quality assurance, 2016/17 133 Figure 4.6: Scorecard indicator n°4:
Level of student participation in external quality assurance system, 2016/17 134 Figure 4.7: Required involvement of employers in quality assurance governance bodies and external review teams, 2016/17 135 Figure 4.8: Scorecard indicator n°5:
Level of international participation in external quality assurance, 2016/17 136 Figure 4.9: Countries with quality assurance agencies registered on EQAR, 2017 137 Figure 4.10: Scorecard indicator n°6:
Stage of development of external quality assurance system, 2016/17 138 Figure 4.11: Scorecard indicator n°7:
Level of openness to cross border quality assurance of EQAR registered agencies, 2016/17 140 Figure 4.12: Countries allowing the European Approach for Quality Assurance of Joint Programmes, 2016/17 141 Figure 4.13: Principles of the Lisbon Recognition Convention in national legislation, 2016/17 143 Figure 4.14: Principles of the Lisbon Recognition Convention monitored in external quality assurance, 2016/17 144 Figure 4.15: Institution which makes final decisions on recognising foreign qualifications for academic purposes, 2016/17 145 Figure 4.16: Additional recognition procedures for higher education qualifications from other EHEA countries, 2016/17 146 Figure 4.17: Scorecard indicator n°8:
System level (automatic) recognition for academic purposes, 2016/17 148 Figure 4.18: Implementation of Article VII of the LRC at national level, 2016/17 150

10
Chapter 5: Opening Higher Education to a Diverse Student Population 153 Figure 5.1: Relationship between the educational background of first-cycle new entrants (ISCED 6) and
the educational attainment of their parents' cohort (population aged 45-64), 2016/17 155 A) Proportion of first-cycle new entrants with highly educated parents and
the corresponding percentage of people aged 45-64 with high educational attainment (ISCED 5-8) 155 B) Main clusters of countries concerning the educational background of first-cycle new entrants and
the educational attainment of their parents' cohort 156 Figure 5.2: Percentage of delayed transition students among students with/without higher education background, 2016/17 159 Figure 5.3: Percentage of women among new entrants in tertiary education in 2004/05 and 2014/15 160 Figure 5.4: Percentage of women among new entrants in tertiary education by level of education, 2014/15 161 Figure 5.5: Median percentage of women among enrolled students in Bologna structures
by field of education and level of Bologna structure (first and second cycle, ISCED 6 and 7), 2014/15 163 Figure 5.6: Composition of students by migration background (%), 2016/17 164 Figure 5.7: Participation rates in tertiary education among persons aged 18-29,
foreign-born, native-born and total population (%), 2016 165 Figure 5.8: Percentage of students enrolled in tertiary education, 30 or more years old, in 2011/12 and 2014/15 166 Figure 5.9: Percentage of delayed transition students among respondents 30 or more years old, 2016/17 167 Figure 5.10: Number of education systems monitoring the composition of the student body, by stage and by students'
characteristics, 2016/17 169 Figure 5.11: Monitoring the composition of the student body from entry to completion, 2016/17 170 Figure 5.12: Entry routes to higher education 172 Figure 5.13: Supporting the access of under-represented groups through standard entry routes:
preferential treatment, 2016/17 173 Figure 5.14: Second-chance routes to first-cycle higher education:
standard or alternative qualifications, 2016/17 175 Figure 5.15: Possibilities to access higher education without formal qualifications:
typology of access routes, 2016/17 176 Figure 5.16: Percentage of students entering higher education through standard and alternative routes, 2016/17 178 Figure 5.17: Prevalence of fees in public higher education institutions for home students in the first cycle, 2016/17 180 Figure 5.18: Percentage of first-cycle students who pay fees, 2016/17 181 Figure 5.19: Need-based fee reductions for full-time home students in the first cycle, 2016/17 182 Figure 5.20: Most common amount of yearly fees for full-time home students
as a percentage of GDP per capita, 2016/17 183 Figure 5.21: Support to students enrolled at tertiary education level
as a percentage of public expenditure on tertiary education, 2008, 2011 and 2014 185 Figure 5.22: Proportion of full-time home students receiving need-based or universal grants, 2016/17 187 A) In the first cycle 187 B) In the second cycle 187 Figure 5.23: Proportion of home students taking out publicly subsidised loans, 2016/17 188 Figure 5.24: Presence of age limits applicable to financial support, full-time home students, 2016/17 189 Figure 5.25: Percentage of fee-payers among recipients and non-recipients of public support, 2016/17 191 Figure 5.26: Scorecard indicator n°9:
Measures to support the access of under-represented groups to higher education, 2016/17 192 Figure 5.27: Percentage of persons with tertiary education, by age group, 2013 and 2016 194 Figure 5.28: Completion rates in ISCED 6 (first-cycle) programmes (%), 2014 196 Figure 5.29: Attainment by gender:
odds ratios of men over women to attain higher education, 2006-2016 197 Figure 5.30: Percentage of female graduates in tertiary education programmes by level of education, 2014/15 198 Figure 5.31: Tertiary education attainment of 25 to 34-year-olds by country of birth:
odds ratio of native-born over foreign-born population to complete tertiary education, 2013 and 2016 199 Figure 5.32: Adults (30-64) who attained their tertiary education degree during adulthood (aged 30-64)
as a percentage of all adults (30-64), 2013 and 2016 200 Figure 5.33: Systematic measurement of completion and/or drop-out rates, 2016/17 201 Figure 5.34: Targeting the retention of first-year students, 2016/17 203

11
Figure 5.35: Application of main measures (introductory or insertion courses, tutoring or mentoring programmes, support for learning and organisational skills) targeting the retention of first-year students, 2016/17 204
Figure 5.36: Financial consequences for students who do not complete an expected minimum number of ECTS and/or their degree within a defined period of time, 2016/17 205
Figure 5.37: Number of higher education systems reporting different financial consequences for students who do not complete the expected minimum number of ECTS and/or their degree within a defined period of time, 2016/17 206
Figure 5.38: Recognition of prior non-formal and informal learning for progression in higher education studies, 2016/17 208 Figure 5.39: Possible outcomes of the recognition of prior non-formal and informal learning, 2016/17 209 Figure 5.40: Scorecard indicator n°10: Recognition of prior non-formal and informal learning, 2016/17 210 Figure 5.41: Impact of completion performance on higher education institutions' funding, 2016/17 212 Figure 5.42: Scorecard indicator n°11:
Measures to support the retention and completion of students from under-represented groups, 2016/17 213
Chapter 6: Relevance of the Outcomes and Employability 215 Figure 6.1: Unemployment rate and unemployment ratio of people aged 20-34
by educational attainment level (%), 2016 217 A) Unemployment rate vs ratio (High education level) 217 B) Unemployment rate 217 Figure 6.2: Compound annual growth rate of unemployment by educational attainment (%), 2013-2016 218 Figure 6.3: Unemployment rate of people aged 20-34 by educational attainment level and by sex (%), 2016 219 Figure 6.4: Unemployment rate of tertiary education graduates aged 20-34,
by the number of years since graduation (%), 2016 220 Figure 6.5: Unemployment rate of tertiary education graduates aged 20-34,
by the number of years since graduation and by sex (%), 2016 221 Figure 6.6: 25, 50 and 75 percentiles of annual gross income of employees
by educational attainment, EU-28, in PPS EUR, 2013 and 2015 222 Figure 6.7: Ratio of median annual gross income of employees with tertiary education to
the median annual gross income of employees with lower levels of education, 2013 and 2015 223 A) Tertiary education compared to upper secondary education 223 B) Tertiary education compared to lower secondary education 223 Figure 6.8: At-risk-of-poverty rate by educational attainment for people aged 25-34 by education level, 2015 224 Figure 6.9: Distribution of people with tertiary education (ISCED 5-8) aged 25-34 and employed
in ISCO 1 or 2 (legislators, senior officials, managers and professionals), in ISCO 3 (technicians and associate professionals) and in ISCO 4-9 (%), 2016 226
Figure 6.10: Change in percentage points (pp) of the share of people with tertiary education (ISCED 5-8) aged 25-34 and employed in ISCO 4-9, 2013 to 2016 227
Figure 6.11: Distribution of people with tertiary education (ISCED 5-6) aged 25-34 and employed in ISCO 1 or 2 (legislators, senior officials, managers and professionals), in ISCO 3 (technicians and associate professionals) and in ISCO 4-9, by sex (%) 228
Figure 6.12: Percentage of people aged 25-34 with tertiary education (ISCED 5-6) who are vertically mismatched (in ISCO 4-9) by field of study, 2016 229
Figure 6.13: Students’ self-assessment of their chances on the national and international labour market based on the competences gained during studies (for all students and/or different focus groups), 2017 230
Figure 6.14: Labour-market and skills forecasting at national level, 2016/17 231 Figure 6.15: Using labour-market and skills forecasting in central planning, 2016/17 232 Figure 6.16: Involvement of employers in higher education planning and management 233 A) Curriculum development, 2016/17 233 B) Higher education institutions' decision-making bodies, 2016/17 233 Figure 6.17: Regulations and incentives on including work placements in HEIs' programmes, 2016/17 234 Figure 6.18: Monitoring the proportion of students taking work placements and
proportion of programmes with compulsory work placements, 2016/17 235 Figure 6.19: Obligation and incentives for higher education institutions to support students' transition to work 2016/17 236 Figure 6.20: Following graduates' career developments – different approaches, 2016/17 237 Figure 6.21: Channelling information on graduates’ career developments into education policy planning, 2016/17 238

12
Figure 6.22: Impact of employability performance on higher education institutions' funding, 2016/17 239
Chapter 7: Internationalisation and Mobility 241 Figure 7.1: National strategies for internationalisation of higher education, 2016/17 243 Figure 7.2: Estimated percentage of higher education institutions that have adopted
an internationalisation strategy, 2016/17 244 Figure 7.3: Legal possibility for HEIs to award joint degrees, 2016/17 246 Figure 7.4: Estimated percentage of institutions that participate in joint programmes, 2016/17 247 Figure 7.5: Estimated percentage of institutions that award joint degrees, 2016/17 247 Figure 7.6: Central level actions to support the development of joint degree programmes, 2016/17 248 Figure 7.7: Mobility targets for outgoing students, 2016/17 249 Figure 7.8: Mobility targets for incoming students, 2016/17 250 Figure 7.9: Requirements for HEIs to provide a mobility period for students, 2016/17 251 Figure 7.10: Incoming degree mobility rate – tertiary education mobile students from the EHEA and
from outside the EHEA studying in the country as a percentage of the total number of students enrolled, by country of destination, 2014/15 253
Figure 7.11: Number of incoming degree tertiary education mobile students from inside and outside the EHEA, by country of destination, 2014/15 255
Figure 7.12: Number of outward degree tertiary education students inside and outside the EHEA by country of origin, 2014/15 255
Figure 7.13: Outward degree mobility rate – mobile tertiary education graduates within the EHEA as a percentage of all graduates of the same country of origin, by country of origin, 2014/15 256
Figure 7.14: Share of degree mobile graduates from abroad by education level, sex and country of origin, 2014/15 257
Figure 7.15: Share of tertiary students enrolled abroad (degree mobility), by country of origin, 2014/15 258
Figure 7.16: Outward degree mobility rate – tertiary education students studying abroad outside the EHEA as a percentage of the total number of students of the same country of origin, 2014/15 259
Figure 7.17: Mobility balance: Incoming/outgoing tertiary students ratio within the EHEA, 2014/15 260
Figure 7.18: Mobility balance: Incoming/outgoing tertiary students ratio within and outside the EHEA, 2014/15 261
Figure 7.19: Balance as a measure of the attractiveness of the education system of the country at tertiary education level (mobility flows within and outside EHEA), 2014/15 262
Figure 7.20: Student mobility flows: Top three countries of ORIGIN (INWARD) in %, 2014/15 263
Figure 7.21: Student mobility flows: Top three countries of DESTINATION (OUTWARD) in %, 2014/15 264
Figure 7.22: Outward mobility versus diversity of destination countries (mobility flows within and outside the EHEA) 2014/15 265
Figure 7.23: Recognition of credits gained during (most recent) enrolment abroad – Share of students who have been enrolled abroad (in %), 2015/16 266
Figure 7.24: Portability of public grants, first and second cycle, 2016/17 267 Figure 7.25: Portability of publicly-subsidised loans, first and second cycle, 2016/17 268 Figure 7.26: Scorecard indicator n°12:
Portability of public grants and publicly-subsidised loans, 2016/17 270 Figure 7.27: Scorecard indicator n°13:
Supporting the mobility of students from under-represented groups, 2016/17 273 Figure 7.28: Mobility targets for outgoing staff, 2016/17 275 Figure 7.29: Mobility targets for incoming staff, 2016/17 275

13
EXECUTIVE SUMMARY
The Bologna Process Implementation Report provides a wide-ranging and detailed picture of how the European Higher Education Area (EHEA) has been moving forward since the Yerevan Conference in 2015. This has not been a period of radical change. Instead, for most countries, the recent years have focused on consolidating the implementation of reforms.
The Bologna Follow Up Group has identified three key commitments that underpin the EHEA. These commitments concern the implementation of the three-cycle degree structure, recognition of qualifications and quality assurance. They can be considered as the foundations of the EHEA: if these foundations are not in place, further European higher education cooperation is undermined.
In addition to the implementation of these commitments, the priorities of the Bologna Process as set out in the Yerevan Communiqué are learning and teaching, social inclusion and employability – all topics addressed centrally in this report. In Yerevan, ministers also pledged to continue to foster mobility and internationalisation, and called for attention to the values of the EHEA.
T h r e e - c y c l e d e g r e e s t r u c t u r e s
Implementation of the Bologna three-cycle degree commitments is improving, with most countries having made the necessary reforms in line with Bologna guidelines. The main Bologna tools – ECTS, Diploma Supplement and national qualifications frameworks – are also well implemented in most countries. Nevertheless, there remains a minority of countries where this is not the case. These countries still need to implement further reforms to ensure that their degree programmes are coherent with those in other EHEA countries.
The dominant European model is now a clearly structured three-cycle degree system. However, although Bologna commitments have mostly been met, there remain significant differences in degree structures across the EHEA as a whole.
In around half of the EHEA countries, the majority of first-cycle graduates continue to study in a second-cycle programme while in a quarter of countries it is less than 25 % that move directly into the second cycle. This may suggest significant differences in labour market recognition of first-cycle qualifications across the EHEA.
Alongside the three main cycles, around half of all EHEA countries offer short-cycle higher education programmes. These programmes are usually vocational, offered at ISCED 5 level, and most often have a workload of 120 ECTS. In around half of the countries with such programmes, learning achievements can be fully recognised within first-cycle studies in the same field, while in the other half recognition is less substantial. Comparing short-cycle higher education programmes across the EHEA is further complicated by the existence in many countries of 'short-cycle tertiary education' programmes, which are not recognised within the national higher education systems.
Most EHEA countries also offer other programmes outside the three-cycle-degree structure. 'Integrated' or 'long' programmes of at least five years duration leading directly to a second-cycle degree exist in most EHEA countries, usually in regulated professional fields. They involve fewer than 5 % of students in some countries, but more than 20 % in others. In around a quarter of EHEA countries, there are also other programmes outside the main three-cycle degree framework.
There has been good progress since 2015 in the implementation of the Diploma Supplement. Indeed, most EHEA countries now comply with all the commonly agreed principles. The Diploma Supplement
14
is also commonly issued after short-cycle higher education programmes, but is far from being the norm in the third cycle.
Good progress can also be observed in the implementation of national qualifications frameworks (NQFs). Most countries have established a national qualifications framework for higher education, self-certified it to the Framework for Qualifications of the European Higher Education Area (QF-EHEA) and it is used by national authorities in public policy. In most countries, NQFs for higher education are integrated into NQFs for lifelong learning, which suggests widespread efforts in using NQFs for coordinating qualifications across sectors and levels of education.
Although many countries have now completed their NQF, there remain a few where development is slow or not moving. These countries are missing the opportunity to increase the transparency of their qualifications system both within and outside the country.
R e c o g n i t i o n o f q u a l i f i c a t i o n s
Formal compliance with most aspects of the Lisbon Recognition Convention (LRC) at national level is well established across the EHEA, as the content of national legislation and regulations is generally coherent with the international legal framework. However, work still needs to be done to ensure that appropriate procedures are established and followed for recognition of qualifications of refugees, displaced persons and persons in a refugee-like situation as specified in Article VII of the LRC.
Nevertheless recognition problems are reported to be still prevalent. This could be because higher education institutions, who are usually responsible for recognition decisions for academic purposes, may not always follow all the required principles of good recognition practice.
With regard to the goal of securing more 'automatic recognition' – understood as system-level recognition for the purposes of further academic study – considerable effort is still required to agree on a common understanding of the concept, and to make it a reality.
Q u a l i t y a s s u r a n c e
Quality assurance continues to be an area of dynamic development in European higher education. The requirement for higher education institutions to develop and publish quality assurance strategies and evaluation reports is becoming increasingly established, while external quality assurance is almost always undertaken by independent agencies working in line with the Standards and Guidelines for European Quality Assurance (ESG). Indeed the adoption and integration of the ESG in national practice has been widely addressed and achieved.
Nevertheless, there are still areas where attention is needed. Some countries still need to take action to ensure that students are fully involved in all quality assurance processes as equal partners. It is also worth noting that improvement-oriented models of external quality assurance are far less prevalent in the EHEA than supervisory models. Higher education institutions in many countries are also restricted to using national quality assurance agencies to fulfil their external quality assurance obligations, rather than benefitting from the work of other suitable EQAR-registered European agencies. In addition, the European Approach to the Quality Assurance of Joint Programmes, although adopted in Yerevan, has hardly been implemented. Indeed it is not yet permitted by national legislation in many countries, and in particular in those where programme accreditation is required. These are precisely the countries where the European Approach to the Quality Assurance of Joint Programmes potentially offers the greatest potential benefit as a more appropriate, effective and efficient form of quality assurance.

15
L e a r n i n g a n d t e a c h i n g
Improving learning and teaching is among the most fundamental objectives of the Bologna Process. Strategies to achieve this objective are now quite widespread across the EHEA, both at national level and within higher education institutions. Steering commonly promotes the development of international opportunities, academic staff development and measures to improve teaching. Digitally enabled teaching and learning is also increasingly addressed strategically at national and institutional levels.
In most countries ECTS has been integrated as both a credit accumulation and transfer system, with learning outcomes and student workload increasingly used as the basis for credit allocation. This provides common foundations for the understanding of European higher education programmes. However, there is a need to ensure that the 2015 ECTS Users Guide adopted by ministers is the basis for correct implementation of the system. To this end, around a third of the countries could take action to encourage quality assurance processes to pay attention to this issue.
Higher education teachers are the key players in enabling students’ learning, and appropriate training in teaching skills both before being employed and throughout careers is an essential pre-requisite for a high quality system. Yet, regulations rarely require academics to hold a teaching qualification, and the development of teaching skills is often left to ad hoc measures.
O p e n i n g h i g h e r e d u c a t i o n
Social dimension challenges have accompanied the Bologna Process throughout its existence. Yet, disadvantaged learners still face access barriers to higher education: students from low and medium-educated families are strongly under-represented, and are more likely to enter higher education with a delay; gender imbalances, if improving slightly, still persist and remain marked in some discipline areas with significant implications for the labour market and society; and life-long learning is not a reality for learners in many countries.
In addition to barriers to access, disadvantaged students also face difficulties in completing higher education, dropping out in higher proportions. Despite evidence of these trends over a number of years, and commitments re-iterated in several ministerial communiqués, only a few countries have introduced measures in recent years to improve the conditions for under-represented groups to access and complete higher education.
E m p l o y a b i l i t y
Employment of recent graduates has improved as countries recover from the economic crisis. Nevertheless, graduate unemployment remains a significant problem in some parts of Europe, as not all countries have recovered to the same extent and at the same speed. There is also a gender aspect to employment issues, as in some countries women face more difficulties than men in finding employment after graduation.
Systematic efforts to improve the relationship between higher education and the labour market still need to be better developed and implemented. Action could include using labour market forecasts, involving employers in curriculum planning and higher education governance, providing incentives to include work placements in higher education programmes, improving career guidance services, as well as encouraging student mobility.

16
I n t e r n a t i o n a l i s a t i o n
The trend for internationalisation is growing across the EHEA. However, mobility flows and the level of engagement in internationalisation activities vary considerably from country to country. There has been a significant increase in the use of targets to support and monitor progress in student mobility with only one quarter of all countries now having no targets for either incoming or outgoing student mobility.
There continue to be substantial differences between countries with regard to portability of domestic student financial support. Only around one-third of EHEA countries enable domestic financial support to be portable for credit and degree mobility. Moreover there is almost no support facilitating the mobility of students from under-represented groups in the majority of countries. Staff mobility targets are also reported by almost half of all EHEA countries, but often refer only to a general objective of increasing the numbers of mobile staff.
V a l u e s
The Yerevan Communiqué emphasises shared values as the foundation of a renewed vision of the European Higher Education Area. Specifically, the ministers highlight academic freedom and autonomy of higher education institutions, while EHEA values also include student and other stakeholder participation in the democratic governance and management of higher education.
While concerns have been raised about violations of values in some EHEA countries, it is difficult to find causal explanations related to the different systems of higher education governance in operation across the EHEA. There is nevertheless a continuing need to discuss the values that unite higher education systems, and to be vigilant that robust legal protection is in place – including defining and limiting the role of governments in the organisation and management of higher education institutions.

17
INTRODUCTION
The Bologna Process The Bologna Declaration was signed in 1999 by ministers responsible for higher education from 29 European countries. However its origins lie a year further back in the Sorbonne Conference and Declaration of 1998. These events and texts set in motion a European cooperation process that has radically changed higher education. Reforms have affected countries within and beyond Europe, and the number of official signatory countries has risen to 48, with Belarus the most recent state to join in 2015.
The chart below outlines the main milestones and commitments of the ministerial conferences within the Bologna Process up to 2015. It illustrates that several main themes can be followed throughout the process – mobility of students and staff, a common degree system, the social dimension, lifelong learning, a European system of credits, quality assurance and the development of Europe as an attractive knowledge region. Learning and teaching was added as an explicit priority in the Yerevan Communiqué.
The Yerevan Communiqué sets out a streamlined and updated policy agenda focusing on four key policy areas: implementation of key commitments; learning and teaching; employability; and social inclusion. These goals and objectives are all addressed in the report, and the combined analysis across the seven chapters aims to present a picture of the current reality of the European Higher Education Area (EHEA).

18
The Bologna Process: from Sorbonne to Yerevan, 1998-2015
Mobility of students and teachers
Mobility also for researchers and administrative staff
Social dimension of mobility
Portability of loans and grants
Attention to visa and work permits
Attention also to pension systems and recognition
Benchmark of 20 % by 2020 for student mobility
Explore path to automatic recognition of academic qualifications
Implementation of key commitments
A common two-cycle degree system
Easily readable and comparable degrees
Fair recognition Development of joint degrees Inclusion of
doctoral level as third cycle
QF-EHEA adopted National Qualifications Frameworks (NQFs) launched
NQFs by 2010 NQFs by 2012 Roadmaps for countries without NQF
Implementation of key commitments
Social dimension
Equal access Reinforcement of the social dimension
Commitment to national action plans
National targets for the social dimension to be measured by 2020
Widening access and completion rates
Social inclusion
Lifelong learning (LLL)
Alignment of national LLL policies Recognition of Prior Learning (RPL)
Flexible learning paths
Partnerships to improve employability
LLL as a public responsibility Focus on employability
Enhance employability, LLL and entrepreneurial skills through cooperation with employers
Employability
Use of credits A system of credits (ECTS) ECTS and
Diploma Supplement (DS)
ECTS for credit accumulation
Coherent use of tools and recognition practices
Implementation of Bologna tools
Ensure that Bologna tools are based on learning outcomes
Adoption of ECTS Users Guide
European cooperation in quality assurance (QA)
Cooperation between QA and recognition professionals
QA at institutional, national and European level
European Standards and Guidelines for quality assurance (ESG) adopted
Creation of the European Quality Assurance Register (EQAR)
Quality as an overarching focus for EHEA
Allow EQAR registered agencies to perform their activities across the EHEA
Adoption of revised ESG and European Approach to QA of joint programmes
Europe of Knowledge
European dimensions in higher education
Attractiveness of the EHEA
Links between higher education and research areas
International cooperation on the basis of values and sustainable development
Strategy to improve the global dimension of the Bologna Process adopted
Enhance global policy dialogue through Bologna Policy Fora
Evaluate implementation of 2007 global dimension strategy
Learning and Teaching: Relevance and quality
1998 1999 2001 2003 2005 2007 2009 2012 2015 Sorbonne
Declaration Bologna
Declaration Prague
Communiqué Berlin
Communiqué Bergen
Communiqué London
Communiqué Leuven/
Louvain-la-Neuve Communiqué
Bucharest Communiqué
Yerevan Communiqué

19
Report outline This report has been prepared for the European Ministerial Conference in Paris, France, on 24-25 May 2018. It provides a snapshot of the state of implementation of the Bologna Process from various perspectives using data collected mostly in the first half of 2017. It provides both qualitative information and statistical data, and covers all main aspects of higher education reforms aiming at a well-functioning EHEA.
The report is a successor to the two Bologna Process Implementation Reports (2012 and 2015) and has been developed through collaboration between the Bologna Follow-up Group (BFUG) and Eurostat, Eurostudent and Eurydice. For the first time, it also includes some indicators collected by the European Students Union (ESU), the European University Association (EUA), and the European Quality Assurance Register for higher education (EQAR).
The development of the report has been overseen by the Bologna Follow-up Group (BFUG), and specifically by a working group established to guide all aspects of the reporting process. The group was co-chaired by Tone Flood Strøm (Norway), Andrejs Rauhvargers (Latvia) and David Crosier (Eurydice). Close collaboration was also established with all BFUG advisory and working groups.
Qualitative information was gathered through two extensive questionnaires (an Excel questionnaire and an on-line questionnaire) addressed to BFUG members. These were submitted, after consultation with all relevant national actors, by the Bologna representatives in all 48 countries between March and December 2017. For the United Kingdom and Belgium, two responses each were submitted. The United Kingdom (England, Wales and Northern Ireland) is therefore treated as a separate higher education system to that of Scotland, while the Flemish and French Communities of Belgium are also considered as distinct higher education systems. However where statistical data is combined for Belgium and the United Kingdom in Eurostat's database, it is presented in a combined form in this report.
The qualitative data is based mainly on official information about legislation, regulations and national policies, and in some cases country representatives are asked to report on their perception of specific aspects of higher education reality. The data refers to higher education institutions that are directly or indirectly administered by a public education authority, which means public and publicly-subsidised private higher education institutions.
With regard to statistical data, the European Union's Education, Audiovisual and Culture Executive Agency (EACEA), working through a consortium led by Sogeti, Luxembourg, undertook a specific data collection in 2017 for the EHEA countries that are not part of regular Eurostat data gathering exercises.
The report draws upon a number of additional data sources. Eurostudent data is provided by the Eurostudent VI survey and focuses on the social and economic conditions of student life in Europe. The reference year for the data is 2016/17, and the report covers 28 of the 48 EHEA countries.
Information from the European University Association's Trends 2018 report is used substantially in Chapter 2 on learning and teaching. This report provides an institutional perspective on higher education developments in Europe. The reference year for this survey is 2017, and it involves 303 higher education institutions from 43 of the EHEA systems.
Certain indicators throughout the report are provided by the European Student Union (ESU) member organisations. This data was collected through an online survey to European student unions in the second half of 2017, and will also be used in ESU's 2018 edition of Bologna with Student Eyes.

20
The European Quality Assurance Register (EQAR) also hosted a short survey on cross border higher education quality assurance, and the responses to this questionnaire are used for the report's information on cross border quality assurance.
The reference year 2016/17 is applicable for qualitative data throughout the report, as well as for Eurostudent indicators. Eurostat statistical indicators generally use 2015 as the most recent reference year, with other years shown where relevant to provide a picture of trends.
The report is divided into seven thematic chapters, with a structure that aims to maintain coherence with the previous Bologna Process Implementation Reports, but also to reflect the most recent political priorities set in Yerevan in 2015. Each chapter has an introduction presenting the relevance of the topic in the Bologna Process, the commitments made in the Yerevan Communiqué, and the main findings of the 2015 Bologna Process Implementation Report, where relevant. The chapter then presents information through comparative indicators whose purpose is to describe the state of implementation in all countries from various perspectives. The text explains main developments, highlights issues regarding implementation, and provides examples of practice that may be of general interest.
The majority of indicators were developed for the 2012 Bologna Process Implementation Report, were updated in 2015 and have again been updated in this report, sometimes with substantial modification. A number of new indicators have also been developed, particularly to investigate more recent policy priorities.
Among the indicators presented in the report are 13 'scorecard indicators' that are designed to track country progress in implementing Bologna Process policy commitments. These scorecard indicators were already used in the 2015 edition of the Bologna Process Implementation Report to cover all but one of the issues assessed, although in some cases there have been significant revisions to the indicators for this edition. The new scorecard indicator in this report focuses on system level (automatic) recognition for academic purposes.

47
CHAPTER 2: LEARNING AND TEACHING
T h e Y e r e v a n C o m m u n i q u é
The 2015 Yerevan Communiqué stresses that 'enhancing the quality and relevance of learning and teaching is the main mission of the EHEA' (19). Regarding learning, ministers acknowledge that study programmes should enable students to develop the competences that can best satisfy personal aspirations and societal needs, through effective learning activities. Such student-centred learning 'should be supported by transparent descriptions of learning outcomes and workload, flexible learning paths and appropriate teaching and assessment methods' (20). Benefits of digital technologies should also be fully exploited in this context. The Yerevan Communiqué also stresses that it is necessary to 'actively involve students, as full members of the academic community, as well as other stakeholders, in curriculum design and in quality assurance' (21). In relation to teaching, the Communiqué notes that '[i]t is essential to recognize and support quality teaching, and to provide opportunities for enhancing academics’ teaching competences' (22). It also highlights a need to 'promote a stronger link between teaching, learning and research at all study levels, and provide incentives for institutions, teachers and students to intensify activities that develop creativity, innovation and entrepreneurship' (23).
T h e 2 0 1 5 B o l o g n a P r o c e s s I m p l e m e n t a t i o n R e p o r t
The 2015 Bologna Process Implementation Report (European Commission/EACEA/Eurydice, 2015), did not comprise a chapter dedicated specifically to learning and teaching. However, it provided a mapping of several policy areas directly related to the 2015 ministerial engagements. For example, like the previous mappings, the 2015 report examined the implementation of ECTS, learning outcomes and student-centred learning. It recognised progress in all these areas but still highlighted a need for additional efforts. The report also looked at policy approaches targeting flexible delivery of higher education programmes, noticing that in many countries, higher education institutions have a well-established flexible course provision, offering various types of distance and e-learning studies, in addition to part-time studies.
C h a p t e r o u t l i n e
Following the 2015 Yerevan Communiqué, this newly created chapter examines learning and teaching in higher education in five sections. The first section provides a general frame for the chapter, looking at the place of learning and teaching in higher education strategies and policies (Section 2.1). The two sections that follow build on previous Bologna mappings, providing information on the implementation of credits and learning outcomes (Section 2.2) and flexible study options, in particular part-time studies (Section 2.3). The fourth newly created section looks at learning in digital environments (Section 2.4), while the final section, which is also a new element of the Bologna mapping, examines teaching in new learning environments (Section 2.5).
(19) Yerevan Communiqué, adopted at the EHEA Ministerial Conference in Yerevan, 14-15 May 2015, p. 2. (20) Ibid. (21) Ibid. (22) Ibid. (23) Ibid.
48
2.1. National and institutional strategies The Bologna Process recognises learning and teaching as a key area of higher education reforms. In this context, the question can be raised as to whether and to what extent national and institutional strategies cover this field.
Within a survey conducted in 2017 by the European University Association (EUA) (24), higher education institutions were asked to indicate the presence of a national strategy for higher education learning and teaching. Among around 300 participating institutions, the vast majority – 78 % – replied positively, indicating either a strategy dedicated to learning and teaching in higher education or a wider higher education strategy including learning and teaching among other matters (25).
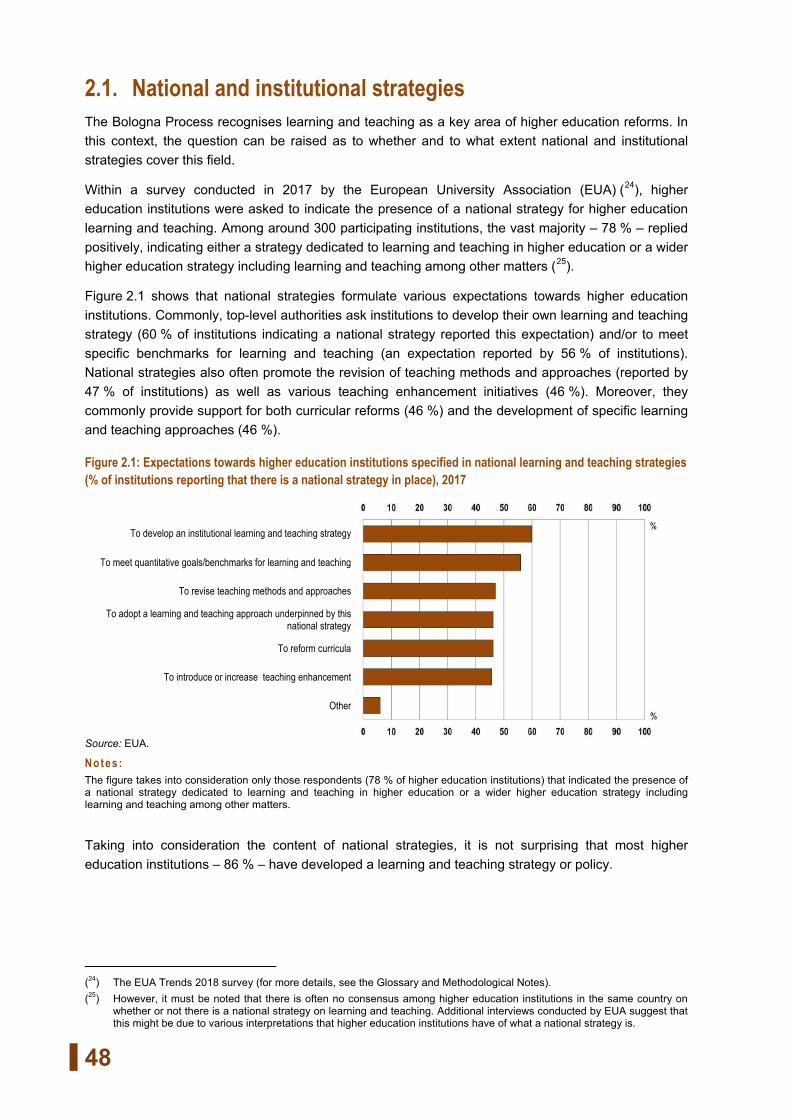
Figure 2.1 shows that national strategies formulate various expectations towards higher education institutions. Commonly, top-level authorities ask institutions to develop their own learning and teaching strategy (60 % of institutions indicating a national strategy reported this expectation) and/or to meet specific benchmarks for learning and teaching (an expectation reported by 56 % of institutions). National strategies also often promote the revision of teaching methods and approaches (reported by 47 % of institutions) as well as various teaching enhancement initiatives (46 %). Moreover, they commonly provide support for both curricular reforms (46 %) and the development of specific learning and teaching approaches (46 %).
Figure 2.1: Expectations towards higher education institutions specified in national learning and teaching strategies (% of institutions reporting that there is a national strategy in place), 2017
To develop an institutional learning and teaching strategy
To meet quantitative goals/benchmarks for learning and teaching
To revise teaching methods and approaches
To adopt a learning and teaching approach underpinned by this national strategy
To reform curricula
To introduce or increase teaching enhancement
Other
Source: EUA.
N otes : The figure takes into consideration only those respondents (78 % of higher education institutions) that indicated the presence of a national strategy dedicated to learning and teaching in higher education or a wider higher education strategy including learning and teaching among other matters.
Taking into consideration the content of national strategies, it is not surprising that most higher education institutions – 86 % – have developed a learning and teaching strategy or policy.
(24) The EUA Trends 2018 survey (for more details, see the Glossary and Methodological Notes). (25) However, it must be noted that there is often no consensus among higher education institutions in the same country on
whether or not there is a national strategy on learning and teaching. Additional interviews conducted by EUA suggest that this might be due to various interpretations that higher education institutions have of what a national strategy is.

49
As Figure 2.2 indicates, institutional strategies most commonly target the development of international opportunities (reported by 87 % of institutions), academic staff development (86 % of institutions) and measures to improve teaching (84 % of institutions). Other common topics include curriculum design, student support services, learning environments and modes of delivery (elements reported by 70-80 % of institutions). Slightly less common but still widespread areas are lifelong learning, course design and students' role in learning. However, benchmarks to reach strategies and operational plans for their implementation are the least frequently cited areas (reported by only around 50 % of institutions), which may raise some concerns regarding the actual implementation and/or evaluation of institutional strategies.
Figure 2.2: Elements included in institutional learning and teaching strategies (% of institutions reporting that there is an institutional strategy in place), 2017
Providing international opportunities
Academic staff development
Measures to improve teaching
Curriculum design, approval and/or evaluation
Student support services
Learning environment
Modes of delivery (e-learning, lectures, group work, flipped classrooms, etc.)
Providing lifelong learning opportunities
Course design, approval and/or evaluation
The role of students in their learning
Quantitative goals/benchmarks to reach the strategy/policy
An operational plan for implementing the strategy/policy
Other
Source: EUA.
N otes : The figure takes into consideration only those respondents (86 % of higher education institutions) that indicated the presence of an institutional strategy on learning and teaching, including respondents referring to strategies at faculty/department level.
Overall, the EUA Trends 2018 survey suggests that teaching and learning in higher education is now commonly embedded in both national and institutional higher education policies and strategies. Keeping this in mind, the sections that follow look at four distinct areas related to learning and teaching in higher education, namely credits and learning outcomes, modes and forms of study, learning in digital environments and teaching. Each of these areas is closely linked to the concept of student-centred learning, defined as 'both a mindset and a culture […] characterised by innovative methods of teaching which aim to promote learning in communication with teachers and other learners and which take students seriously as active participants in their own learning, fostering transferable skills such as problem-solving, critical thinking and reflective thinking' (ESU 2015, n.p.).

50
2.2. Credits and learning outcomes Effectively supporting students in acquiring knowledge, skills and competences that best meet their self-development goals and social needs is at the centre of the Bologna Process. The development and continuous improvement of the structural reform tools – such as the degree structures, qualifications frameworks (see Chapter 3), credit systems or quality assurance (see Chapter 4) – aim to enable a better learning experience for students, promoting mobility and improving the quality of higher education.
The transparent and systematic use of European Credit Transfer and Accumulation System (ECTS) and its inherent principles in higher education institutions across Europe can make an important contribution to student centred teaching and learning. Using a combination of the learning outcomes approach and student workload in programme design and delivery puts the student in the centre of the teaching and learning process. Such an approach, on the one hand, makes it clearer both to academic staff and students what they need to achieve, and, on the other hand, it also helps in monitoring and, eventually, adapting programmes, teaching material and methods to different modes of delivery and student populations.
In addition, ECTS as a credit transfer and accumulation mechanism has the potential to offer significant flexibility to learners to plan their own learning paths. For example, it enables combining learning experiences within an institution, recognising mobility experience between higher education institutions, valuing prior learning, adapting to the specific pace of studies, or completing only certain components of programmes.
When in 2015 ministers endorsed the ECTS Users Guide (European Commission, 2015) in Yerevan as an official EHEA document, they acknowledged that ECTS can only foster student centred learning and collaboration between higher education institutions if all its elements are fully and correctly implemented. In order to improve the coherent use of the main elements of ECTS, ministers formally committed themselves to systematically using the ECTS Users' Guide at policy level and to supporting higher education institutions in the correct implementation of ECTS. This part of the report will take stock of the progress made in the implementation of ECTS since 2015.

51
2.2.1. Implementation of ECTS – state of play As shown in Figure 2.3, ECTS is used as a national credit transfer and accumulation system in most countries in the EHEA. There are eight countries where a national credit system is used for the accumulation and transfer of credits.
Belarus, Bulgaria, Kazakhstan, Latvia, Sweden and the United Kingdom (Scotland) require the use of a national credit system and determine specific conversion rules between the national system and ECTS. In the Czech Republic and the United Kingdom (England, Wales and Northern Ireland), there are no formal requirements to use any credit systems in higher education. Nevertheless, in all countries, including those having national systems, ECTS is used in practice by all or most higher education institutions at least in the context of international mobility. Some countries indicate that ECTS is not used for accumulation within higher education institutions or for credit transfer between institutions at national level.
Figure 2.3: Credit system used for the accumulation and transfer of credits, 2016/17
Source: BFUG data collection.
Figures 2.4 and 2.5 broadly present the proportion of higher education institutions and higher education programmes which use ECTS for credit accumulation and transfer. 45 systems indicate that all of their first- and second-cycle higher education programmes use ECTS compared to 36 countries in 2013/14. Since the 2015 report, progress has been reported in Kazakhstan, the former Yugoslav Republic of Macedonia and Russia – countries where all programmes now use ECTS for credit transfer.
In Cyprus, the Czech Republic, the Holy See and Ireland, neither all programmes nor all institutions use ECTS. In the Flemish Community of Belgium, pre-Bologna programmes are gradually rewritten in terms of learning outcomes and ECTS credits are allocated to the revised programmes.
Overall, however, both figures suggest that the use of ECTS for the accumulation and transfer of credits is gaining ground across Europe.
ECTS is used
National credit system compatible with ECTS

52
Figure 2.4: Share of higher education institutions using ECTS credits for accumulation and transfer, first- and second-cycle programmes, 2016/17
Source: BFUG data collection.
Figure 2.5: Share of first- and second-cycle programmes using ECTS credits for accumulation and transfer for all elements of study programmes, 2016/17
Source: BFUG data collection.
An important element of ECTS is the learning outcomes approach. Programmes and their components have to be described in terms of learning outcomes: what students need to know, understand and be able to do by the end of the learning process. To correctly implement the system, it is essential that all credits are linked to programme components which are described in learning outcomes. This is important to maintain trust in ECTS.
100 % of higher education institutions
75-99 % of higher education institutions
Primacy of national credit system compatible with ECTS
100 % of programmes
75-99 % of programmes
Data not available

53
Figure 2.6 depicts the extent to which ECTS credits are linked to learning outcomes in higher education programmes in the EHEA. Significant progress has been made in this area compared to the situation in 2013/14. Eleven additional countries (Azerbaijan, Bulgaria, Croatia, Hungary, Kazakhstan, Liechtenstein, Malta, Montenegro, Portugal, Romania and Ukraine) now describe all programmes and their components in terms of learning outcomes, while the Czech Republic does so for more than half. However, in 14 countries, ECTS credits are still not linked to learning outcomes in between 1-49 % of programmes, and in more than half of the programmes in Cyprus. Albania and Belarus have not started implementing the learning outcomes approach in their higher education programmes. The current data collection does not provide sufficient information on the challenges these countries face in progressing further.
Figure 2.6: Extent to which ECTS credits are linked with learning outcomes in higher education programmes, 2016/17
Source: BFUG data collection.
Programme components to which ECTS credits are allocated may have different weight and may require different time and work investment from students. For this reason, describing all components of higher education programmes in terms of learning outcomes and indicating the workload that students typically invest to achieve the intended learning outcomes provide an important basis for making programme delivery more student-centred. Fully understanding what knowledge, skills and competences they need to acquire, students can take more ownership for their own learning and be even more active partners in the process. Teachers can better plan and adapt teaching material and learning support to meet the needs of the specific groups with whom they work. Equally, when it comes to the assessment of student achievement, evaluating the extent to which intended learning outcomes have been acquired makes evaluations and ultimately the award of credits more transparent. In addition, linking credits to learning outcomes and workload also facilitates the monitoring of programmes. For example, constructive dialogue and reflective feedback between students, teachers and other staff can focus on whether the expected learning outcomes can be achieved within the given timeframe or whether workload needs to be revised.
For this reason, in 2015 in Yerevan, ministers agreed that the common approach to ECTS is to allocate credits based on the learning outcomes achieved and the associated student workload.
100 % of programmes
50-99 % of programmes
5-49 % programmes
No programmes

54
Figure 2.7 shows to what extent this agreement is put into practice and presents the most common approaches taken by countries in allocating ECTS credits. The majority of countries report that ECTS are allocated on the basis of learning outcomes and associated student workload. In addition to the countries that already used this approach in 2015, the Czech Republic and Liechtenstein now also require their higher education institutions to use this combination. This is in line with the Yerevan commitments.
Figure 2.7: Basis to allocate ECTS credits in the majority of higher education institutions, 2016/17
Source: BFUG data collection.
The United Kingdom remains the only country that uses only learning outcomes for the allocation of credits, and does not take into account the required student workload. Albania is the only country referring to student workload only. Seven countries (Belarus, Bosnia and Herzegovina, Holy See, Hungary, Montenegro, Slovakia and Spain) allocate credits to programme components based on a combination of student workload and teacher-student contact hours. These approaches take into account input – the time factor – but fail to make explicit what should be learnt within the indicated timeframe. In such systems that do not link ECTS credits to learning outcomes and student workload, the risk is higher that students may not acquire the same level of learning outcomes as others who gain the same number of credits, or that they may be overloaded with tasks to obtain these credits. Systems that do not require learning outcomes to be specified also create a difficulty for the whole EHEA, as the objective of transferring credits across countries in a transparent and equitable way is undermined. Indeed, no student should face difficulties in the recognition of his/her learning outcomes when participating in credit mobility.
Responses from higher education institutions to the EUA Trends 2018 survey suggest that the learning outcomes approach is having an impact on life in higher education. 76 % of higher education institutions reported that learning outcomes have been developed for all of their programmes, and a further 16 % reported that some courses are described in learning outcomes. Figure 2.8 shows the areas where higher education institutions perceive most strongly that the introduction of the learning outcomes approach has had an impact.
Learning outcomes achieved and associated student workload
Learning outcomes only
Student workload only
Combination of students workload and teacher-student contact hours

55
Figure 2.8: Impact of the learning outcomes approach in higher education institutions (% of institutions), 2017
Course contents have been revised
Assessment and examinations have been revised
Students are more aware of their learning objectives
Teaching methods have changed
The overall quality of teaching has improved
Cooperation among teaching staff has improved
Course duplication has been reduced
Recognition of credits/degrees from other institutions easier
Recognition of prior learning has become easier
Learning paths have become more flexible
Student pass rates have improved
Drop out has decreased
No real change
Source: EUA.
Most institutions report that course contents (91 %) and assessment and examination requirements (88 %) have been revised to be compatible with the learning outcomes approach. These two direct impacts are in line with the policy steering that national authorities provide. 83 % of institutions reported that students are more aware of their learning objectives and 81 % feel that teaching methods have changed due to the introduction of the learning outcomes approach. The learning outcomes approach seems to have had less impact on student pass rates and drop-out rates. This perception is not surprising. On the one hand, there are multiple factors that influence pass and drop-out rates, and student performance in general, and institutions do not associate it with the learning outcomes approach. On the other hand, the learning outcomes approach has not yet been used long enough for institutions to have data on its impact on student performance.
In contrast, a little more than half of the institutions reported that the learning outcomes approach has not resulted in real change. A deeper analysis of institutional responses may shed light on the reasons for the lack of impact and how institutions concerned fare on other questions related to the learning outcomes approach.
2.2.2. Policy guidance for the implementation of the learning outcomes approach Previous Bologna implementation reports showed that the coherent implementation of the learning outcomes approach and related credit allocation has not been attained across higher education institutions even within individual countries, often not even across faculties within individual institutions. Responses from higher education institutions to the recent EUA Trends 2018 survey also suggest that while many institutions are becoming more confident about designing curricula based on learning outcomes and revising student assessment to align to the learning outcomes approach, to one fifth of the institutions (58 of 263 responding to a specific question) expressing the intended learning outcomes in curricula still causes problems. In Portugal, more than half of the responding institutions reported that this is still a challenge. About a third of higher education institutions (84 of 263 responding to the question) find it difficult to revise student assessment to focus on learning outcomes, i.e. whether students have achieved the intended knowledge, skills and competences, (more than half of the participating institutions reported this in Austria and Portugal). Finally, 39 % of institutions report that resources are not sufficient to support staff in implementing learning outcomes (more than 50 % in Austria, France, Italy, Portugal and Romania).

56
In most countries higher education institutions have the competence to develop programmes and allocate credits. Responsible staff, thus, needs to acquire expertise in this domain. Through their important role in the governance of higher education systems, national authorities have the capacity to provide framework conditions that guide and support institutional change to coherently implement the learning outcomes approach throughout the system. Figure 2.9 depicts to what extent national level steering exists for this purpose.
Figure 2.9: Steering and/or encouraging use of learning outcomes in national policy for programme development, 2016/17
Source: BFUG data collection.
There has been little change in the EHEA since 2015 with regard to the steering tools used by national authorities to encourage higher education institutions to use learning outcomes in programme development. As Figure 2.9 depicts that most countries use laws or regulations. In 2015, Cyprus also adopted a law which makes the use of ECTS obligatory for all higher education institutions within a certain transition period. The use of learning outcomes is often regulated as part of the legislation on the implementation of the national qualifications framework – making the use of learning outcomes an explicit condition for the inclusion of qualifications in the framework (Croatia, France, Hungary, Ireland, Liechtenstein, Malta and Montenegro). Higher education programme accreditation rules (Malta), or quality assurance standards or guidelines (Portugal, the United Kingdom – Scotland) may also require the use of learning outcomes in programme descriptions. In Kazakhstan, Russia and Ukraine, national higher education standards provide orientation for defining learning outcomes for programmes and their components. In Albania, the only country without policy steering in 2016/17, a working group is currently working on new legislation which will introduce learning outcomes in the higher education system.
Steering and/or encouraging through law, regulations
Steering and/or encouraging through guidelines, recommendations
No steering or encouragement

57
In student-centred teaching, assessing to what extent students have achieved the intended learning outcomes provides essential feedback to the students as well as to the teacher. However, the learning outcomes approach requires new ways of student assessment. In order to trigger change in the area of assessment, public authorities also have responsibility to encourage student assessment that increasingly focuses on learning outcomes – measuring to what extent intended knowledge, skills and competences are acquired – rather than on input or other dimensions. Figure 2.10 shows that together with the countries that already had steering in 2015, now Hungary and Portugal have adopted regulations and guidelines, respectively, for this purpose. In four countries (Albania, Slovakia, Switzerland and Ukraine), no steering is provided and the countries do not signal developments in this area.
Figure 2.10: Steering and/or encouraging student assessment procedures to focus on learning outcomes, 2016/17
Source: BFUG data collection.
Besides formal steering on the use of learning outcomes, a few countries report that they have put in place other support measures or incentives for higher education institutions to foster the correct use of ECTS for credit accumulation and transfer. Some of the support and monitoring measures mentioned that could have a multiplier effect are: training to higher education staff (Armenia), guidelines or recommendations on how to use ECTS in higher education institutions (Armenia, Austria, Belarus and the Czech Republic), monitoring (Armenia and Bosnia and Herzegovina), project funding or pilot projects (Germany and Norway) and Bologna experts or policy advisors providing expertise to higher education institutions (Austria, France and Malta).
Responses to the EUA Trends 2018 survey also demonstrate that large-scale systematic training for higher education staff is not a frequent phenomenon across the EHEA (see Figure 2.11).
Yes, through law, regulations
Yes, through guidelines, recommendations
No steering or encouragement

58
Figure 2.11: Training for higher education teaching staff in developing learning outcomes (% of institutions), 2017
In a systematic way (for all teachers and all courses/programmes)
In a systematic way for new teachers (only)
In a systematic way for new courses/programmes (only)
Teachers can receive assistance or get training on request only
No such training is being offered
Other
Source: EUA.
Figure 2.11 shows that only in a quarter of the higher education institutions that responded to a specific question is there systematic training for all teachers and in all programmes on developing learning outcomes. Austria, Kazakhstan, Russia and Ukraine are the countries where a somewhat higher share of institutions report systematic trainings. About 39 % of the institutions reported that teachers can receive assistance or training on developing learning outcomes only if they request it. Finally, 13 % of the institutions across the EHEA report that no such training is organised.
2.2.3. Monitoring the implementation of ECTS In addition to legislative frameworks, funding and other incentives, national authorities may use systematic monitoring to support the implementation of the learning outcomes approach and ECTS. Monitoring efforts send a signal to stakeholders that national authorities pay specific attention to the implementation of a policy, gather information on the progress and seek to identify challenges. National authorities and institutions themselves can use monitoring information for reviewing and eventually revising their policies.
The ECTS Users' Guide 2015 explicitly suggests that ECTS should be quality assured through appropriate evaluation processes (e.g. monitoring, internal and external quality reviews and students’ feedback) and continuous quality enhancement. The Standards and Guidelines for Quality Assurance in the European Higher Education Area (ESG, 2015) (26) also refer to areas that are related to ECTS. At national and European levels, external quality assurance systems are best placed to monitor whether higher education institutions have the necessary procedures and practice in place to ensure the correct implementation of ECTS.
In order to assess the extent to which ECTS implementation at national level takes into account the principles presented in the ECTS Users' Guide 2015, two aspects are considered in this report: first, the basis for external quality assurance to monitor ECTS; and second, the monitoring of ECTS key principles.
(26) http://www.enqa.eu/wp-content/uploads/2015/11/ESG_2015.pdf

59
Figure 2.12 shows whether or not there is a requirement to monitor ECTS implementation in external quality assurance procedures, as well as pointing out the main reference point for external quality assurance.
Figure 2.12: Basis for external quality assurance to monitor ECTS implementation in higher education, 2016/17
Source: BFUG data collection.
Over the last three years, 28 of the 50 systems managed to incorporate the ECTS Users' Guide 2015 principles into their quality standards or legislation on external quality assurance as the basis to monitor ECTS. In another 11 systems, monitoring is based on national legislation, quality standards or steering documents, but not on the ECTS Users' Guide 2015 principles. This mainly means that these countries did not yet review their national regulations or steering documents and the ECTS Users' Guide 2015 is not yet reflected in their external quality assurance framework (27). Finally, in 11 systems, monitoring is not requested by public authorities. In two systems among these (Ireland and Finland), such monitoring may, however, happen in practice. In these cases, lack of formal basis for external quality assurance to monitor ECTS may mean, on the one hand, that ECTS is not on the radar of external quality assurance agencies, or, on the other hand, it may suggest that the system is not prescriptive about external quality assurance. For example, ECTS is monitored as part of internal quality assurance in Finland.
(27) In Croatia, the external quality assurance agency applies new standards and criteria from 2018, which build on the 2015
ECTS Users’ Guide.
ECTS Users' Guide 2015 principles (incl. national legislation/steering documents building on the ECTS Users' Guide 2015)
National legislation or steering documents not building on ECTS Users' Guide 2015 principles
No requirement to monitor ECTS implementation or no formal basis to monitoring ECTS

60
Figure 2.13 looks at the monitoring of some key principles of ECTS. Those features considered are of particular importance for the systemic implementation of ECTS as a credit system for the accumulation and transfer of credits. The figure shows the extent to which external quality assurance monitors whether higher education institutions have integrated the following six features of ECTS into their procedures and practice:
• ECTS credits are awarded on the basis of learning outcomes and student workload;
• ECTS credit allocation is regularly monitored and followed up by appropriate revision if necessary;
• ECTS is used as a credit system for the accumulation of credits acquired within higher education institutions;
• ECTS is used as a credit system for the transfer of credits for student learning outcomes acquired in another institutions within the country;
• ECTS is used as a credit system for the transfer of credits for student learning outcomes acquired during periods of study abroad;
• Appropriate appeals procedures are in place to deal with problems of credit recognition.
Figure 2.13 is comprised of three parts. The first part focuses on credit allocation and credit monitoring. As discussed above, these two features – awarding ECTS credits based on learning outcomes and student workload, and regularly checking if the intended learning outcomes can be achieved with the foreseen time – are fundamental for the full roll-out of ECTS. The second part of the figure depicts whether the correct use of ECTS in credit accumulation and credit transfer is monitored. Finally, the third part presents whether external quality assurance checks the existence of appropriate appeals procedures for problems in credit recognition.
Figure 2.13: Monitoring key aspects of ECTS implementation by external quality assurance, 2016/17
A) Requirement to monitor learning outcomes and credit allocation
Monitoring that ECTS credits are allocated on the basis of learning outcomes and student workload
Monitoring whether ECTS credit allocation is regularly monitored and followed up by appropriate revision if necessary
No requirement to monitor these aspects of ECTS implementation
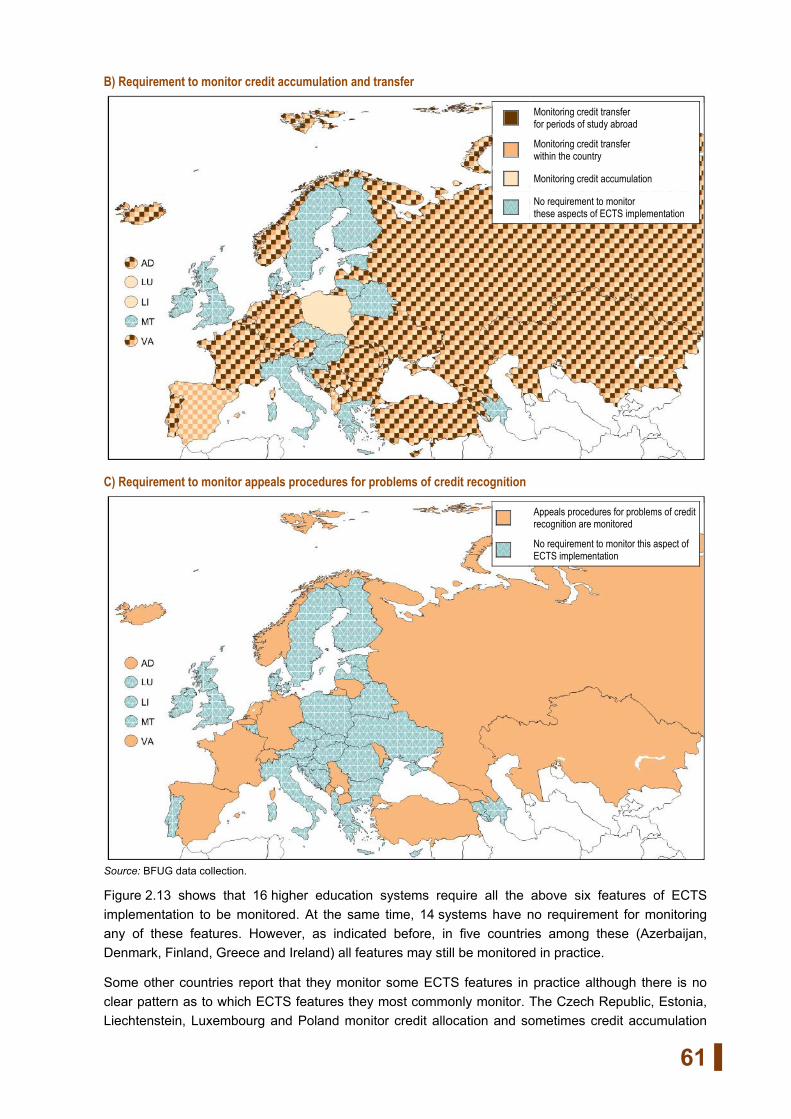
61
B) Requirement to monitor credit accumulation and transfer
C) Requirement to monitor appeals procedures for problems of credit recognition
Source: BFUG data collection.
Figure 2.13 shows that 16 higher education systems require all the above six features of ECTS implementation to be monitored. At the same time, 14 systems have no requirement for monitoring any of these features. However, as indicated before, in five countries among these (Azerbaijan, Denmark, Finland, Greece and Ireland) all features may still be monitored in practice.
Some other countries report that they monitor some ECTS features in practice although there is no clear pattern as to which ECTS features they most commonly monitor. The Czech Republic, Estonia, Liechtenstein, Luxembourg and Poland monitor credit allocation and sometimes credit accumulation
Appeals procedures for problems of credit recognition are monitored
No requirement to monitor this aspect of ECTS implementation
Monitoring credit transfer for periods of study abroad
Monitoring credit transfer within the country
Monitoring credit accumulation
No requirement to monitor these aspects of ECTS implementation

62
within institutions, but do not require the use of ECTS for credit transfer to be monitored. In contrast, Albania, Armenia and Austria do not require monitoring of the basis to award credits, but do require monitoring of credit accumulation and transfer.
One finding, however, is more widespread. 31 countries do not require monitoring of whether there are procedures that make it possible for students to appeal if they face problems in the recognition of their acquired credits. A third of these countries report that monitoring appeals procedures would even be an unusual practice. This is an important lacking element since national authorities will not have information on whether students have guarantees that ECTS is applied correctly and their credits are recognised. This may result in missing the opportunity to provide students’ feedback and improve the system across the country and Europe.
2.2.4. Students' perspective on the implementation of ECTS The main goal of ECTS is to promote the transparent recognition of learning outcomes and flexible pathways during students' learning career in higher education. Thus, students’ experiences and perceptions about the use of ECTS provide key feedback in assessing the maturity of ECTS in the EHEA.
In its survey to the 2018 Bologna Ministerial Conference, the European Students' Union (ESU) asked its members in EHEA countries whether ECTS was used for credit accumulation and transfer, what the basis was for the calculation of credit points and whether higher education institutions worked in accordance with the ECTS Users' Guide 2015.
Figure 2.14 shows that students' unions in 23 of the 36 countries participating in the survey reported that all higher education institutions use ECTS for credit accumulation and credit transfer between institutions in their countries and equally for recognising periods of study abroad. In seven additional countries, ECTS is used for one or two of these purposes in all higher education institutions.
Figure 2.14: Use of ECTS for credit accumulation and transfer by all higher education institutions, first- and second cycle programmes, students' perspective, 2016/17
Source: ESU data collection.
Credit transfer for periods of study abroad
Credit transfer within the country
Credit accumulation
National credit system used
Some institutions use ECTS for some or all of these purposes
Data not available

63
In Armenia, Austria, the Czech Republic, France, Germany and Sweden, students claim that ECTS is used for credit accumulation in all higher education institutions, and not all (some) institutions use it as a credit transfer system (within the country and/or for study periods abroad). In Malta and Serbia, according to students’ perceptions, some institutions use ECTS. In Hungary, students indicate that a national credit system is used for credit accumulation and credit transfer between institutions within the country and ECTS is used in the context of study periods abroad. In Belarus, a national credit system is used for credit accumulation and transfer. Finally, a national credit system and ECTS are simultaneously in use in Latvia and the United Kingdom.
Students' experience points to more varied approaches to ECTS credit allocation at the level of higher education institutions. Figure 2.15 depicts what elements are used for the calculation of ECTS points according to student unions. Student responses from only nine countries (Austria, Belgium, the Czech Republic, Hungary, Iceland, Ireland, Lithuania, Norway and the United Kingdom) confirm the approach shown in Figure 2.7. In Estonia, Finland, Germany, Malta, Romania and Switzerland, students report that learning outcomes, student workload and teacher-student contact hours are equally taken into account in the calculation of ECTS credit points.
Figure 2.15: Elements used for the calculation of ECTS points in public higher education institutions, students' perspective, 2016/17
Source: ESU data collection.
In Armenia, Bulgaria, Denmark, France, Italy, Latvia, the Netherlands, Sweden and Ukraine, where national legislation or recommendations foresee the use of learning outcomes achieved and associated student workload in credit allocation, students report only about the use of student workload or teacher-student contact hours. There may be various reasons for the differences between legislation/recommendations and students' reporting. However, this difference suggests that there is a need for more coordination and information among stakeholders. This is also confirmed by student unions’ response to the question on whether they were involved in any activity related to the implementation of the ECTS Users’ Guide 2015. Only seven (Austria, Cyprus, Germany, Lithuania, the Netherlands, Switzerland and Norway) of the 36 unions responded positively.
Learning outcomes
Student workload
Teacher-student contact hours
Other
Data not available

64
2.2.5. Stage of implementation of ECTS: summary of the main criteria for the assessment of the implementation of ECTS by external quality assurance agencies
Scorecard indicator n°1 (Figure 2.16) summarises the main ECTS elements that are required to be monitored by external quality assurance agencies. All elements discussed under 'Monitoring the implementation of ECTS' are taken into account: the basis for the implementation of ECTS and whether monitoring is required to take into account the issues such as credit allocation based on learning outcomes and student workload, regular monitoring of ECTS credit allocation; the use of ECTS in credit accumulation and credit transfer between institutions within the country and for periods of study abroad; and requirements to monitor student appeals procedures.
The Scorecard indicator is not comparable with the Scorecard indicator n°4 (see Figure 2.21) in the Bologna Process Implementation Report 2015. In 2015, the scorecard indicator on ECTS implementation built on the information on the share of higher education programmes to which ECTS credits are allocated and the use of learning outcomes in ECTS. In 2018, the scorecard indicator focuses, as explained above, on monitoring ECTS implementation. The reason for this change is two-fold. Firstly the data on the share of institutions implementing ECTS provided by national authorities was mainly based on perceptions. The second reason is the understanding that in a policy implementation cycle, national authorities and all other stakeholders can acquire real insights into the implementation of a policy by monitoring how effectively it is taking place. In higher education, external quality assurance is best placed to provide macro level information on the level of ECTS implementation in higher education institutions, while respecting institutional autonomy. It is foreseen that in higher education systems where external quality assurance is required to monitor ECTS implementation, national authorities and stakeholders will have access to sufficiently reliable data on the state of play of ECTS implementation, challenges and good practices in the coming years.
As Figure 2.16 shows the majority of countries requires external quality assurance agencies to monitor at least one key aspect of the implementation of ECTS. In 16 systems, external quality assurance uses the ECTS Users' Guide 2015 principles as a basis and monitors all six issues listed below. Seven systems do not require ECTS implementation to be monitored by external quality assurance, but it often happens in practice. These systems also include less prescriptive systems where formal requirements are not made; however, in practice such monitoring may take place. In seven systems, the ECTS Users’ Guide principles are not required to be used by external quality assurance and are typically not used in practice. Overall, the scorecard indicator suggests that there is still much to be done to ensure the full implementation of ECTS.

65
Figure 2.16: Scorecard indicator n°1: Monitoring the implementation of the ECTS system by external quality assurance, 2016/17
Source: BFUG data collection.
Scor ecar d ca tegor ies
The ECTS Users' Guide 2015 principles are required to be used by external quality assurance as a basis to assess the implementation of ECTS in all higher education institutions.
All the following issues are monitored specifically:
o ECTS credits are allocated on the basis of learning outcomes & student workload; o ECTS credit allocation is regularly monitored and followed up by appropriate revision if necessary; o ECTS is used as a credit system for the accumulation of credits acquired within higher education institutions; o ECTS is used as a credit system for the transfer of credits for student learning outcomes acquired in another institution in the country; o ECTS is used as a credit system for the transfer of credits for periods of study abroad; o The higher education institution has an appropriate appeals procedure to deal with problems of credit recognition.
The ECTS Users' Guide 2015 principles are required to be used by external quality assurance as a basis to assess the implementation of ECTS in all higher education institutions.
Four or five of the above issues are monitored specifically.
The ECTS Users' Guide 2015 principles are required to be used by external quality assurance agencies as a basis to assess the implementation of ECTS in all higher education institutions.
One to three of the above issues are monitored specifically.
The ECTS Users' Guide 2015 principles may in some cases be used by external quality assurance as a basis to assess the implementation of ECTS.
The ECTS Users' Guide 2015 principles are not required to be used by external quality assurance agencies as a basis to assess the implementation of ECTS in higher education institutions.
2016/17
16
10
10
7
7
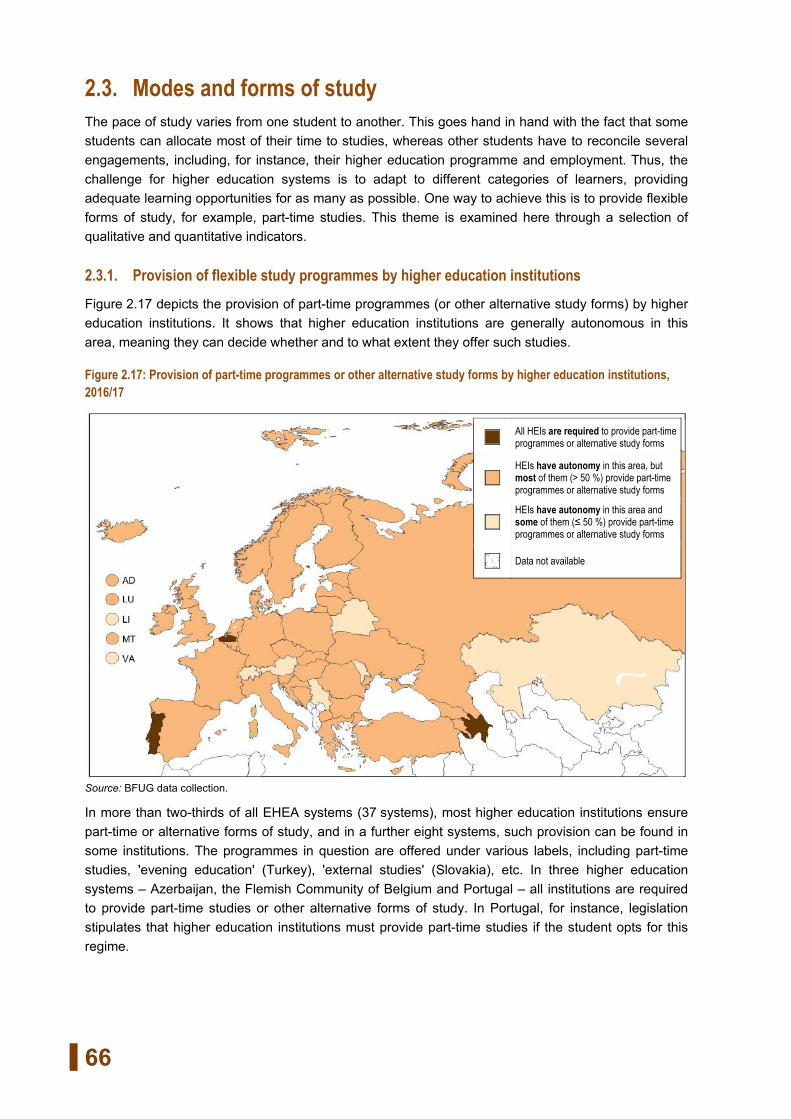
66
2.3. Modes and forms of study The pace of study varies from one student to another. This goes hand in hand with the fact that some students can allocate most of their time to studies, whereas other students have to reconcile several engagements, including, for instance, their higher education programme and employment. Thus, the challenge for higher education systems is to adapt to different categories of learners, providing adequate learning opportunities for as many as possible. One way to achieve this is to provide flexible forms of study, for example, part-time studies. This theme is examined here through a selection of qualitative and quantitative indicators.
2.3.1. Provision of flexible study programmes by higher education institutions Figure 2.17 depicts the provision of part-time programmes (or other alternative study forms) by higher education institutions. It shows that higher education institutions are generally autonomous in this area, meaning they can decide whether and to what extent they offer such studies.
Figure 2.17: Provision of part-time programmes or other alternative study forms by higher education institutions, 2016/17
Source: BFUG data collection.
In more than two-thirds of all EHEA systems (37 systems), most higher education institutions ensure part-time or alternative forms of study, and in a further eight systems, such provision can be found in some institutions. The programmes in question are offered under various labels, including part-time studies, 'evening education' (Turkey), 'external studies' (Slovakia), etc. In three higher education systems – Azerbaijan, the Flemish Community of Belgium and Portugal – all institutions are required to provide part-time studies or other alternative forms of study. In Portugal, for instance, legislation stipulates that higher education institutions must provide part-time studies if the student opts for this regime.
All HEIs are required to provide part-time programmes or alternative study forms
HEIs have autonomy in this area, but most of them (> 50 %) provide part-time programmes or alternative study forms
HEIs have autonomy in this area and some of them (≤ 50 %) provide part-time programmes or alternative study forms
Data not available

67
2.3.2. Formal student statuses reflecting modes of study Figure 2.18 shows that in around two-thirds of all EHEA systems (31 systems), different modes of study are linked to different student statuses.
Figure 2.18: Existence of different formal student statuses related to modes of study, 2016/17
Source: BFUG data collection.
Most commonly, the alternative student status is a 'part-time' status, which can be defined in many ways. Indeed, as the 2012 Bologna Process Implementation Report explains (European Commission/ EACEA/Eurydice, Eurostat and Eurostudent 2012, the distinction between different student statuses is often based on the workload of students, measured either in ECTS credits or hours/weeks. In some countries, however, the definition does not refer to the workload, but to a limited participation in study sessions. This means that part-time students should in principle achieve the same number of credits as full-timers, but they are expected to dedicate more time to self-study activities.
Some higher education systems offer alternative modes of study, but they do not formally recognise different student statuses. For example, in Slovenia, according to the Higher Education Act, students can opt for 'full-time' or 'part-time' studies, but the study mode does not translate into distinct student statuses (i.e. there is only one formally recognised student status). In the Czech Republic, the Higher Education Act recognises three study modes – 'on-site', 'distance' and 'combined' –, but it does not refer to different student statuses. Turkey offers 'evening education', but, like the two previous countries, recognises only one student status (28).
When an alternative student status (e.g. 'part-time') is formally recognised, students holding such a status may be required to pay higher fees for the same volume of study (i.e. the same number of credits) than students following traditional study arrangements (see Figure 2.19). This is the case in half of the systems that recognise several student statuses, namely Bosnia and Herzegovina, Croatia, Cyprus, Denmark, Estonia, Hungary, Ireland, the former Yugoslav Republic of Macedonia, Malta,
(28) However, as the Eurostudent survey shows (see Figure 2.24), a substantial proportion of students in the Czech Republic, Slovenia
and Turkey indicate that they have a part-time or other alternative status. This suggests that the regulatory perspective does not always overlap with students' perceptions.
There are different formal student statuses reflecting different modes of study (e.g. 'full-time', 'part-time')
There is only one formal student status

68
the Netherlands, Poland, Slovakia, Switzerland, Ukraine and the United Kingdom (Scotland). The remaining systems either do not recognise different student statuses or, if they do, the financial investment required from different categories of students is calculated proportionally to the volume of study or credits.
Figure 2.19: Impact of formal student status on financial contributions related to higher education studies, 2016/17
Source: BFUG data collection.
N otes : When students holding an alternative status (e.g. part-time students) are required to make higher contributions, it means that they pay higher fees for the same volume of study than students following typical/traditional study arrangements. When students holding an alternative status are not required to make higher contributions, it means that they pay the same amount of fees for the same volume of study as students enrolled in typical/traditional study arrangements.
Countries where alternative study forms go hand in hand with higher financial contributions do not refer to the same arrangements and/or the same student statuses. For example, in Slovakia, students following so-called 'external studies' are expected to pay fees, while this expectation does not apply to full-time students who do not exceed the regular length of study. In Denmark, there are generally no fees for studying in higher education, except for programmes designed specifically for adults. In the United Kingdom (Scotland), tuition fees related to first-cycle full-time studies are centrally regulated, whereas fees related to part-time studies are unregulated and can be set by higher education institutions themselves. It follows that students may be required to make higher contributions if studying part-time, but it is not a rule. In Hungary, higher education institutions can charge fees for part-time studies, and these may correspond to the full cost of training.
As mentioned previously, some higher education systems offer alternative modes of study, but do not recognise different student statuses (see the analysis related to Figure 2.18). In these systems, students following flexible study forms may still be required to make higher financial contributions. For example, in Slovenia, students following full-time studies pay only small fees (registration, and field work or excursions if required by study programme), whereas part-timers pay fees set by higher education institutions. In Turkey, daytime students do not pay fees, whereas students in evening programmes may pay fees. In contrast, in the Czech Republic, fees are not differentiated by study modes.
Students holding an alternative status (e.g. 'part-time')
are not required to make higher financial contributions than students following traditional study arrangements
are required to make higher financial contributions than students following traditional study arrangements
Only one formal student status
Data not available

69
The picture regarding the financial support 'part-time' students receive compared to 'full-time' students for the same volume of study (i.e. the same number of credits) is also varied (see Figure 2.20). In 12 higher education systems, students with an alternative status are eligible for the same amount of support as students following traditional study arrangements; in seven systems, they receive lower support, while in 11 systems, they are not eligible for financial support.
Figure 2.20: Impact of formal student status on eligibility to financial support for students, 2016/17
Source: BFUG data collection.
N otes : When students holding an alternative status (e.g. part-time students) are eligible for the same level of support, it means that they receive the same amount of support for the same volume of study as students enrolled in typical/traditional study arrangements. When students holding an alternative status are eligible for lower level of support, it means that they receive a lower amount of support for the same volume of study than students following typical/traditional study arrangements.
When examining the two previous figures in a combined perspective, some clusters of countries with different relationships between students' financial contributions and the support they receive can be identified. A first group can be characterised as offering 'equal treatment', since students with an alternative status do not have to pay higher fees, and are eligible for the same level of support as students following traditional study arrangements. This group consists of Azerbaijan, Greece, Italy, Kazakhstan, Lithuania, Luxembourg, Norway, Portugal, Spain and the United Kingdom (England, Wales and Northern Ireland). In an opposing group, 'part-timers' are required to make higher contributions than 'full-time' students, and they are not eligible for financial support. This group includes Bosnia and Herzegovina, Croatia, Denmark, Estonia, Hungary, the former Yugoslav Republic of Macedonia, the Netherlands and Switzerland. While this combined perspective should be interpreted with caution (e.g. it does not consider the actual levels of support in relation to financial contributions), data suggest that financial attractiveness of alternative modes of study varies across the EHEA.
Students holding an alternative status (e.g. 'part-time')
are eligible for the same level of financial support as students following traditional study arrangements
are eligible for lower level of financial support than students following traditional study arrangements
are not eligible for financial support
Only one formal student status
Data not available

70
2.3.3. Student participation in part-time studies Looking at alternative study forms from another perspective, the following indicators examine the participation of students in part-time studies. The analysis starts with Eurostat data (the UOE data collection complemented by an additional EHEA data collection), followed by the Eurostudent survey.
Figure 2.21 looks at the median of country percentages for students enrolled as part-timers by age. It shows that age influences part-time studying, and that older students are much more likely to study part-time than their younger peers. More specifically, the median of country percentages for part-time students aged 22 is only 7 %, meaning that in half of the countries for which data is available, 7 % or less students aged 22 study part-time. In contrast, starting from the late thirties (age range 35-39), the majority of students are part-timers in half of the EHEA systems. In older age groups (45+), the median of country percentages for students studying part-time is more than 60 %, i.e. at least two-thirds of students in half of the countries study part-time.
Figure 2.21: Median of country percentages of students enrolled as part-timers in tertiary education, by age, 2014/15
Age 18 19 20 21 22 23 24 25 26 27 28 29 30-34 35-39 40-44 45-49 50-54 55-59 60-64 65+ % 1.2 1.9 3.4 5.2 7.0 11.1 14.4 19.0 23.6 28.7 32.7 34.3 46.0 50.7 52.5 62.0 63.6 64.7 65.8 62.5
Source: Eurostat, UOE and additional collection for the other EHEA countries.
Age

71
Figure 2.22 looks at the percentage of students enrolled as part-timers among students of age groups 20 to 24 and 30 to 34. It illustrates, once again, that the older the students are, the more likely they are to study part-time. Indeed, the share of part-time students in the older age group is more than twice as high as in the younger age group in virtually all EHEA systems for which data is available. In Denmark, Ireland, Liechtenstein, Luxembourg and the Netherlands, the share of part-timers in the older age group is more than ten times higher than among younger students.
Behind the above general pattern, there are substantial differences between countries when each of the two age groups is considered separately. The share of part-time students in the age group 30-34 varies from 9 % (Denmark) to 88 % (Russia). Part-time students represent a substantial proportion of older students (more than 50 %) in around half of all EHEA systems analysed. In four systems – Russia, Ukraine, Slovakia and Hungary – more than 80 % of students aged 30-34 are part-timers. The systems with the highest proportion of young part-timers (aged 20-24) are Andorra (45.4 %), Belarus (44 %), Russia (38.6 %), Ukraine (37.5 %), Sweden (29.5 %), Moldova (29.2 %) and Poland (28.6 %).
Figure 2.22: Students enrolled as part-timers in tertiary education, by country and by age (%), 2014/15
20-24 year-olds 30-34 year-olds (*): the former Yugoslav Republic of Macedonia
% RU UA SK HU HR MT AD SI FI NL LT MD SE UK BG LV NO KZ LI 20-24 years 38.6 37.5 11.0 9.0 19.5 8.0 45.4 10.8 20.0 2.3 15.7 29.2 29.5 10.3 19.0 16.2 18.5 22.6 1.2 30-34 years 88.3 86.5 82.1 80.8 79.3 72.3 68.3 65.4 65.1 63.7 62.7 62.4 59.5 56.5 56.4 55.3 54.6 53.4 53.4
% ES PL (*) AL BA IE AZ CH LU IS BE DE EE RO PT DK AT TR BY 20-24 years 15.3 28.6 5.7 9.8 7.6 3.2 20.6 13.1 1.6 11.0 22.4 4.1 7.6 6.1 4.0 0.9 0.0 0.0 44.0 30-34 years 52.3 49.6 47.4 47.2 47.0 46.0 40.5 40.1 39.3 36.7 35.0 33.3 23.6 20.5 10.9 9.2 0.0 0.0 :
Source: Eurostat, UOE and additional collection for the other EHEA countries.
N otes : Countries are arranged by the participation of mature students (30-34 year-olds) in part-time studies.

72
Figure 2.23 shows trend data covering all age categories. It indicates that in 2014/15, more than 26.3 % of all students are part-timers in half of the EHEA countries. Between 2008/09 and 2010/11, the proportion of part-time students declined, but rose again for the academic year 2011/12. Following the later academic year, it has been declining. A decline is also observed when considering the top as well as bottom quartile of the distribution of the EHEA countries. Regarding the top quartile, in 2006/07, part-time students accounted for more than 41.7 % in a quarter of the EHEA countries before falling to 30.6 % in 2014/15.
Figure 2.23: 25, 50 and 75 percentile of countries according to the percentage of students enrolled as part-timers in tertiary education, by year, 2005-2015
P25 P50 P75
2005 19.2 29.0 39.3
2006 20.1 28.0 40.8
2007 20.6 27.6 41.7
2008 18.2 30.1 41.3
2009 20.2 30.1 39.5
2010 20.7 26.6 37.2
2011 20.1 26.5 37.6
2012 20.5 28.2 33.0
2013 19.1 28.0 31.9
2014 18.7 28.0 33.4
2015 17.2 26.3 30.6
Source: Eurostat, UOE and additional collection for the other EHEA countries.
The Eurostudent survey complements all the previously presented indicators, by looking at the participation in different forms of study from students' perspective (self-reported data) (29).
As Figure 2.24 shows, in five countries – Austria, Denmark, France, Georgia and Serbia –, all students qualify themselves as 'full-timers'. At the other end of the scale are ten countries – Croatia, the Czech Republic, Hungary, Lithuania, Malta, Norway, Poland, Slovakia, Sweden and Turkey – where at least 20 % of students report a student status other than 'full-time'.
A comparison between Figure 2.24 and BFUG data (see Figure 2.18) shows that the self-reported student status is not always aligned with the information provided by top-level authorities. For example, in Sweden, despite the fact that top-level authorities report only one formal student status (see Figure 2.18), almost 30 % of students indicate that they are formally 'part-timers' (see Figure 2.24). A further six countries – the Czech Republic, Finland, Germany, Iceland, Slovenia and Turkey – also report only one formal student status (see Figure 2.18), whereas some of their students – between 3 % and 20 % – indicate alternative statuses (see Figure 2.24). In contrast, Denmark reports the existence of different student statuses (see Figure 2.18), but all students indicate being full-timers. One explanation for this could be that the concept of 'formal student status' offers some space for interpretation: top-level authorities are likely to interpret it based on regulatory frameworks,
(29) Within the Eurostudent survey, students are asked to indicate their formal student status, which should be assessed on the basis of
their official registration. For more detailed description of 'formal student status', see the Glossary and Methodological Notes (Section III).

73
whereas students may evaluate it based on other criteria, including alternative forms of study offered by their higher education institution (30).
While not depicted on a specific figure, most students with an alternative status qualify themselves as 'part-timers'. Yet, in Turkey, all students who do not fall under the category 'full-time' (i.e. 20 % of students) refer to other student statuses. As mentioned previously (see the analysis related to Figures 2.17 and 2.18), higher education institutions in Turkey do not provide 'part-time' studies, but they offer 'evening education' programmes leading to formal higher education qualifications. In Norway and Romania, most students who report an alternative status qualify themselves as 'part-timers', while a small proportion – 1 % and 2 %, respectively – refer to other statuses.
Figure 2.24: Students qualifying themselves as full-timers (%), 2016/17
AT DK FR GE RS DE EE IS RO NL CH SI FI IE 100 100 100 100 100 97 94 94 93 90 88 87 86 85 PT CZ LT MT NO TR SK HR HU SE PL AL IT LV 83 80 80 80 80 80 78 74 73 72 63 : : :
Source: Eurostudent.
The Eurostudent survey also provides details on the meaning of 'full-time' and 'part-time' studies in terms of study intensity. As Figure 2.25 shows, part-time students can commonly be found among low intensity students, i.e. students who dedicate less than 20 hours per week to their studies. For example, in Malta, Sweden and Portugal, among students reporting low study intensity, more than half are part-timers, whereas the proportion of part-time students in these countries does not exceed 30 %. Part-time students also form a substantial proportion of the low study intensity group (between 40 % and 50 %) in Ireland, Poland, Norway, Hungary, Slovakia, Croatia and Finland. In contrast, they represent less than 20 % of students reporting low study intensity in the Netherlands, Iceland, Estonia, Romania and Germany. Yet, in the latter group of countries, the proportion of part-timers in the student population is relatively small.
As might be expected, part-timers are not often found in the high study intensity group, i.e. among students who dedicate more than 40 hours per week to their studies. In most countries for which data is available, they represent less than 10 % of all high intensity students. In Lithuania, however, a relatively high proportion of high intensity students – 25 % – are part-timers. Differences between countries can partly be explained by the fact that part-time studies have different meanings and follow different organisational patterns (see the analysis related to Figure 2.18).
(30) For example, in the Czech Republic, the Higher Education Act refers to three study modes – 'on-site', 'distance' and 'combined' –,
but not to different student statuses. It is therefore likely that students qualifying themselves as 'part-timers' refer to 'distance' or 'combined' studies (see also the analysis related to Figure 2.18).

74
Overall, Figure 2.25 indicates that part-time students are often – but not always – low study intensity students. At the same time, low intensity students can also be found among those who are formally considered as studying 'full-time'. Thus, the link between official student status and hours devoted to studying is not always straightforward.
Figure 2.25: Part-time students according to their study intensity (self-reported) as % of students in different study intensity groups, 2016/17
Part-time students among low intensity students (<20h/week on studies)
Part-time students among medium intensity students (21h-40h/week)
Part-time students among high intensity students (>40h/week)
- Not applicable : Not available
% MT SE PT IE PL NO HU SK HR FI CZ SI LT CH Low 67 58 55 49 49 47 45 44 41 40 36 30 28 27 Medium 20 18 23 11 47 13 26 20 24 8 17 13 12 12 High 3 9 8 3 11 5 10 7 13 2 5 5 25 2
% NL IS EE RO DE AT DK FR GE RS TR AL IT LV Low 17 15 12 12 11 - - - - - - : : : Medium 6 7 3 7 4 - - - - - - : : : High 2 1 2 2 2 - - - - - - : : :
Source: Eurostudent.
2.4. Learning in digital environments As part of the efforts in enhancing the quality and relevance of learning and teaching in higher education, ministers of higher education in Yerevan called for exploiting better the potential benefits of digital technologies.
This commitment responds to various challenges that higher education systems currently face and embraces new opportunities that new technologies offer. Technology, in particular digital technology, is evolving fast. Failing to jump on the train may result in graduates whose skills are not fully relevant in the labour market, less opportunities in research, significant back-lag in innovation within higher education institutions and in the economy. All generations are now using popular new technologies in their lives. The user-experience that new technologies provide has proved to have the capacity to deepen and accelerate learning (European Commission, 2014), for example, adaptive learning technologies adjust to the learners’ needs and pace; but much depends on how technology is actually used. Furthermore, higher education is expanding and more people study in different phases of their adult life, but not everywhere yet in the EHEA. Digital technologies potentially may broaden access to higher education and to lifelong learning. They give learners the opportunity to participate in education in a more flexible way – both in time and in space. Finally, digital technologies, for example through

75
Massive Open Online Courses (MOOCs), open up the possibility of linking informal, non-formal and formal education.
But to what extent is the integration of new technologies in teaching and learning in higher education present on national policy agendas in the EHEA? How is their mainstreaming supported by national policies? Do higher education institutions receive guidance and incentives to install appropriate technology? In particular, do national authorities help prepare and motivate higher education staff and teachers to use technology in improving the quality of teaching and learning? To what extent do the regulatory and funding conditions promote online provision and certification? What steps are made to increase trust towards online programmes and learning acquired there?
This part of the report aims to explore to what extent digital environments are becoming a reality in learning and teaching in higher education. The difficulty in getting full grasp on the developments in this area is that they mainly take place in autonomous higher education institutions. The data discussed below focuses on national policies, the steering and support effort that national authorities provide to higher education institutions in making full use of digital technologies.
2.4.1 Steering and support to higher education institutions in using digital technologies For new technologies to be used in an effective, efficient and trustful way in teaching and learning in higher education, certain framework conditions need to be met. New technologies need resources, infrastructure and human resources to use them. They equally need to be integrated into curricula, while learning outcomes acquired through using new tools need to be assessed and trusted at national level and abroad. Action required for the implementation of these changes needs long-term strategic planning, changes in the legal environment and financial resource allocation.
Figure 2.26 provides an overview of the situation regarding national strategies and policies on the use of new technologies in teaching and learning across the EHEA. Most systems (38 of 50) have such a strategy or policies in place.
Figure 2.26: National strategies on the use of new technologies in teaching and learning in higher education, 2016/17
Source: BFUG data collection.
National strategy on the use of digitally-based teaching & learning methods in higher education
Broader strategy within which the use of digitally based teaching & learning methods in higher education is covered
No strategy, but specific policy measures are in place
Neither strategy no policy measures

76
Three countries have a strategy on the use of new technologies in teaching and learning specifically for higher education. Eighteen systems have broader national strategies which include new technologies in higher education. Three main types of broad strategic approaches can be observed. A first group of countries – Belarus, the Czech Republic, Hungary and Slovakia – have adopted strategies for the digitalisation of education addressing the different levels and sectors of the education system. A second group of countries integrate the use of new technologies in specific education strategies. For example, Bulgaria refers to new technologies in its higher education development strategy; Croatia and Portugal in their strategies for education, science and technology; Estonia, Moldova, Russia and Serbia integrate strategic planning on new technologies in their strategies for education or for lifelong learning. A third group of systems (Azerbaijan, Greece, Lithuania, Luxembourg, Serbia, Sweden, Switzerland and the United Kingdom – England, Wales and Northern Ireland) have adopted digital society strategies which discuss broader strategic considerations. Seventeen systems report not to have a strategy document, but they do have policy measures to encourage progress in this field. In this context, Kazakhstan, Russia and Turkey specifically focus on enabling digitally provided distance education programmes in their national legislation. About a quarter of the countries (12), however, have neither strategies nor policies in this area.
A strategic document, action plan and policy measures at national level indicate a (long-term) commitment from national authorities. They usually outline strategic objectives to be achieved, and sometimes they set measureable targets. None of the countries participating in this report set quantitative targets for their strategies. Many of them, however, do identify general objectives and priority areas for action and also allocate public funding to these.
Figure 2.27 depicts the main areas where policy objectives have been set or major policy interventions have been carried out by national authorities. The figure also shows whether the top-level injects additional (new) funding for implementation, whether authorities reallocate or higher education institutions can redistribute existing financial resources, or if there is no funding planned for this purpose in the public higher education budget.
From the 38 systems that have strategies or policies on the use of new technologies, all, except Portugal and Switzerland, identified specific objectives related to the use of these new technologies in teaching and learning in higher education. The most commonly set objectives are in the area of providing access to ICT infrastructure. This confirms that availability of broadband access and digital tools are considered as essential. Infrastructure is the field to which eight systems (Armenia, Belgium – French Community, Belarus, the Czech Republic, Germany, France, Hungary and Norway) allocate additional (new) resources in public funding to higher education. Eighteen countries allow the reallocation of higher educational funding for this purpose. There are also countries which, while identifying this area as a priority, do not earmark funds for it.
The other two fields which most countries identify as important are developing the skills of higher education staff to use digitally-based methods in their teaching and improving students' digital skills. These are essential in a digitally enabled learning environment as well as in the labour market. For example, in Hungary, the learning outcomes descriptions of all higher education programmes systematically include digital competences as part of the generic competences that all graduates need to acquire by the end of their studies. From the 25 countries that prioritise work on skills development only seven provide 'new' resources for these purposes. The Czech Republic, Finland, France and Germany and provide additional financial resources both for staff and students’ digital skills development.

77
Figure 2.27: National policies and allocated funding for promoting the use of new technologies in teaching and learning in higher education, 2016/17
Providing access to relevant ICT infrastructure
Training academic staff to be able to integrate digitally-based teaching & learning methods in their teaching
Equipping students with digital skills
Adapting higher education programmes to digital provision
Ensuring assessment and certification of digitally acquired skills
Developing appropriate quality assurance of digital learning
Developing digital qualifications/certificates
Other
New public funding provided Public funding may be re-allocated No funding allocated : Data not available
(*): the former Yugoslav Republic of Macedonia Source: BFUG data collection.
Recognising the potential of digital learning materials and courses in providing more opportunities also for students from under-represented groups, some countries report mainstream or targeted measures reaching out to these students. In Romania, socially disadvantaged students can obtain subsidies to buy computers. Finland and Norway make digital learning material widely available and Norway encourages their adaptation for students with special learning needs: for example, software adapted for the use of dyslectic students. In the Flemish Community of Belgium, blended learning opportunities are open for working students. In Georgia, a learning management system processes data on on-line student learning which teaching staff can use to adapt their teaching material and methodologies. In France and Italy, digital courses are available for refugees. In France, the 'FUN-MOOC' platform offers online language courses for those refugees who wish to enter higher education. In Italy, the Telematic University Uninettuno provides a 'University for Refugees', which offers on-line courses for refugees.
While using ICT tools in teaching and learning and skills development are on the policy agenda in the majority of countries, significantly fewer countries prioritise adapting programmes to digital provision and related certification processes. Hardly any countries invest in additional resources for these purposes (see Figure 2.27). Twenty-three countries work on adapting higher education programmes to digital provision, only 17 and 18, respectively, mention assessment and certification or quality assurance of these courses as priority. In Andorra, all distance education programmes have been adapted for digital provision. In Croatia, higher education institutions are financially supported through

78
calls for proposals for the development of new, innovative approaches to teaching. In Austria and the United Kingdom – Scotland, project funding is secured for staff for the development and certification of open education resources.
The funding mechanisms used for financing this area also vary. In Finland and Italy, higher education institutions have access to additional funding for digitally enabled learning and teaching through performance agreements; in Hungary and Slovenia, higher education institutions can apply for funds co-financed from the European Social and Investment Funds (ESIF). In the Flemish Community of Belgium, higher education institutions receive extra funding for a quota of students who combine study and work, which institutions can invest in developing and providing blended courses or open and online degree programmes.
Next to targeted financial support, national authorities have other means of encouraging and mainstreaming the modernisation of teaching and learning at higher education institutions. These include the review and revision of the legal framework in which higher education institutions work, provision of training to staff, and exchange of good practices (see Figure 2.28).
Figure 2.28: Incentives/support to the use of new technologies in teaching and learning in higher education (other than direct public funding), 2016/17
Legal framework has been adapted to support the use of digitally-based teaching & learning methods
ITE and CPD for higher education teaching staff includes training on using digitally-based teaching & learning methods
Regular stakeholder events are organised on using digitally-based teaching & learning methods in higher education
External quality assurance requirements adapted to include the use of digitally-based teaching & learning methods
The legal framework for RPL and the recognition of qualifications adapted to digital learning and digital certification
(*): the former Yugoslav Republic of Macedonia; UK (1): UK-ENG/WLS/NIR Source: BFUG data collection.
As Figure 2.28 demonstrates, reflecting the strategic priority for the development of academic staff's skills in using digitally based teaching and learning methods, most systems (21) support higher education institutions in mainstreaming the use of new technologies by providing methodological training in initial teacher education (ITE) and in continuous professional development (CPD) of academic staff. In France and Germany, for example, there are support centres for higher education didactics, and in the United Kingdom, CPD providers for higher education staff offer courses on digitally enabled teaching.
Less than half of the countries (16) have adapted their legal framework and external quality assurance procedures to facilitate and monitor digital provision. Finally, only very few systems, the Flemish Community of Belgium, Denmark and Norway, adapted their legal frameworks for recognition of prior

79
learning (RPL) and the recognition of qualifications to digital courses. None of the countries adapted its higher education admission system to recognise digital certification.
This data collection suggests that national strategic frameworks across the EHEA currently focus rather on promoting digitally enabled provision on campus and blended learning. Only few work towards extending the scope for fully digital provision, digital certification and MOOCs. Importantly, 18 systems among those that have national strategies carry out some sort of monitoring on the implementation of their strategies. These, mainly annual, monitoring data are likely to provide interesting information on the evolution of national policies in this area.
2.4.2 Online courses in higher education Besides presenting an overview of national strategic approaches to the use of new technologies in teaching and learning in higher education, this report also intends to provide a rough picture of the digital provision landscape in higher education. Online courses are increasingly part of the higher education reality and the variety of courses offered is broad. This section distinguishes between three types of provision. First, the section looks at online components of degree programmes, which are traditional campus-based programmes and have some components that are delivered online. These are often called blended programmes. Second, full degree programmes which are fully provided online are looked at. These may be short, first, second, integrated or third cycle programmes which lead to qualifications corresponding to these levels. Third, the existence of MOOCs is explored. MOOCs are courses which allow open entry, are free, and are delivered online usually with peer or automated support. For the purposes of this report, MOOCs are considered as (usually shorter) online courses offered by higher education institutions and which do not result in a degree qualification.
Figure 2.29 shows which of the above mentioned three types of courses are offered most commonly across the EHEA. Online components of degree programmes (blended programmes) are by far the most widespread provision in European countries (39 systems). In contrast, only 18 systems offer online degree programmes. Finally, higher education institutions in more than half of the countries (28) also provide courses as MOOCs. Only 11 systems' institutions offer all three types of course. The figure needs to be interpreted with caution as while such programmes are part of the higher education reality of these countries, they are usually offered by not all but only a few higher education institutions. Exceptions are Andorra, Denmark, Estonia, Finland, France, the Netherlands, Norway and the United Kingdom (Scotland), where all higher education institutions have online programme components in degree programmes. In contrast, in Albania, Azerbaijan, Belarus, Georgia and Malta, no online course is provided in higher education.

80
Figure 2.29: Most commonly offered online courses by higher education institutions, 2016/17
Source: BFUG data collection.
Degree programmes with online components and degree programmes that are fully delivered online may be offered at any cycle of higher education: in the short cycle, first, second or third cycle, integrated/long programmes. Figures 2.30 and 2.31 show where traditional degree programmes incorporating online components (blended courses) and fully online degree programmes can be found, and at which higher education levels such programmes are offered.
Figure 2.30: Level of degree programmes with online components, most commonly offered, 2016/17
Source: BFUG data collection.
Full degree programmes
Online components of degree programmes
MOOCs
No online courses
Data not available
Short-cycle programmes
First-cycle programmes
Second-cycle programmes
Degree programmes with online components are not common in the short, first and second cycle
Data not available

81
Figure 2.31: Level of most commonly offered online degree programmes, 2016/17
Source: BFUG data collection.
Figure 2.30 shows that the majority of higher education systems have degree programmes with some online components in the first and second cycles. Online components are less widespread at other levels of higher education. Twelve systems have online components in short-cycle programmes and 17 in doctoral programmes. Programmes outside the Bologna cycles, including integrated/long programmes, have online components in 15 systems. However, when it comes to entire degree programmes online (see Figure 2.31) only 16 systems provide such programmes at the first and second cycles, while four systems offer online short cycle programmes.
Similarly to traditional on-campus programme delivery, it is necessary to monitor the quality of online courses and ensure trust towards this type of provision among students, those working on credit or degree recognition, employers and other stakeholders. For this reasons, the ESG (Standards and Guidelines for Quality Assurance in the European Higher Education Area, 2015 (31)) provide recommendations that external and internal quality assurance should equally apply to programme design, delivery, assessment and certification of traditional and online programmes.
Figure 2.32 shows that most countries that have online courses apply the same quality assurance procedures for online programmes as for face-to-face programme provision and three have specific quality arrangements for online courses. Eleven countries have no quality assurance procedures for online programmes. For these latter countries it may prove challenging to maintain trust in their online provision. They may also fail in meeting their commitments to implementing all provisions of the ESG (see Chapter 4 on quality assurance).
(31) http://www.enqa.eu/wp-content/uploads/2015/11/ESG_2015.pdf
Short-cycle programmes
First-cycle programmes
Second-cycle programmes
Full degree programmes are not common in the short, first and second cycle
Data not available
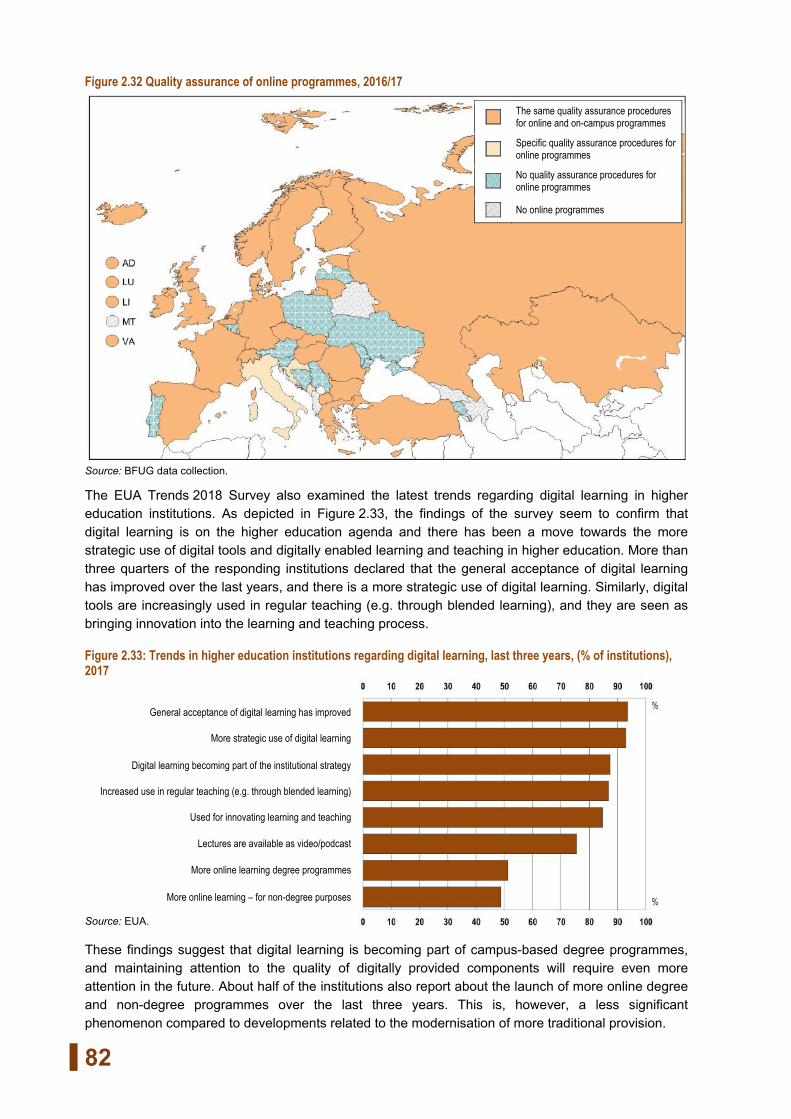
82
Figure 2.32 Quality assurance of online programmes, 2016/17
Source: BFUG data collection.
The EUA Trends 2018 Survey also examined the latest trends regarding digital learning in higher education institutions. As depicted in Figure 2.33, the findings of the survey seem to confirm that digital learning is on the higher education agenda and there has been a move towards the more strategic use of digital tools and digitally enabled learning and teaching in higher education. More than three quarters of the responding institutions declared that the general acceptance of digital learning has improved over the last years, and there is a more strategic use of digital learning. Similarly, digital tools are increasingly used in regular teaching (e.g. through blended learning), and they are seen as bringing innovation into the learning and teaching process.
Figure 2.33: Trends in higher education institutions regarding digital learning, last three years, (% of institutions), 2017
General acceptance of digital learning has improved
More strategic use of digital learning
Digital learning becoming part of the institutional strategy
Increased use in regular teaching (e.g. through blended learning)
Used for innovating learning and teaching
Lectures are available as video/podcast
More online learning degree programmes
More online learning – for non-degree purposes
Source: EUA.
These findings suggest that digital learning is becoming part of campus-based degree programmes, and maintaining attention to the quality of digitally provided components will require even more attention in the future. About half of the institutions also report about the launch of more online degree and non-degree programmes over the last three years. This is, however, a less significant phenomenon compared to developments related to the modernisation of more traditional provision.
The same quality assurance procedures for online and on-campus programmes
Specific quality assurance procedures for online programmes
No quality assurance procedures for online programmes
No online programmes

83
2.5. Teaching in new learning environments The 2015 Yerevan Communiqué places teaching at the top of the Bologna Process agenda, considering the development of teaching relevance and quality as one of the main missions of the EHEA (32). The communiqué puts emphasis on various aspects related to teaching, promoting, in particular, pedagogical innovation in student-centred learning environments and opportunities for the development of academics’ teaching competences.
This section explores teaching in higher education from several perspectives. It starts with the top-level and institutional perspective, enquiring about qualification requirements for higher education teachers, opportunities for the development of teaching skills and the role of teaching in career advancement of academics. The second part addresses teaching from the student perspective, exploring students' satisfaction with the quality of teaching.
The section is based on several data sources, including the BFUG data collection, the European University Association (EUA) survey on learning and teaching in higher education (33) and the Eurostudent survey.
2.5.1. Teaching in higher education: top-level and institutional perspective As the EUA Trends 2018 survey on learning and teaching in higher education shows, national strategies for higher education learning and teaching are now quite widespread across the EHEA (see Section 2.1). The same survey reveals that these strategies commonly address the revision of teaching methods and approaches (reported by 47 % of institutions indicating a national strategy) and/or promote teaching enhancement initiatives (46 % of institutions). Besides national strategies, most higher education institutions have put in place an institutional strategy or policy for learning and teaching, and these strategies commonly refer to measures to improve teaching (reported by 84 % of institutions indicating an institutional strategy or policy). The enhancement of teaching therefore appears as a topic widely embedded in both national and institutional higher education policies and strategies.
Building on this background, the sections that follow provide details on qualification requirements towards academics with teaching responsibilities, teaching components in academics' education, opportunities for the development of teaching skills and the role of teaching in academic careers.
2 . 5 . 1 . 1 . R e q u i r e m e n t s f o r t e a c h i n g i n h i g h e r e d u c a t i o n
One key question related to teaching in higher education is whether and to what extent academics are equipped to teach. Indeed, while it is commonly expected that teachers at levels below higher education possess a degree or a diploma in teaching, the question may be raised as to whether the same applies to higher education staff with teaching responsibilities. This section provides some insight into this area.
Starting from the institutional perspective, Figure 2.34, which is based on the EUA Trends 2018 survey, captures requirements for different academic positions. Within the survey, higher education institutions were asked to indicate formal or most common requirements for holding positions with teaching responsibilities.
(32) Yerevan Communiqué, adopted at the EHEA Ministerial Conference in Yerevan, 14-15 May 2015, p. 2. (33) The EUA Trends 2018 survey.

84
Figure 2.34: Formal or most common requirements for holding higher education positions with teaching responsibilities (% of institutions), 2017
Professors Lecturers, associate
professors Researchers Experts,
practitioners Teaching
support staff
Doctorate or post-doctoral academic degree Proven teaching
experience Regular evaluation of teaching performance
Participation in teaching enhancement courses
Any other academic degree
Other requirements
Source: EUA.
As the figure shows, the doctorate or a post-doctoral degree is commonly required for professors (indicated by almost 90 % of responding institutions), associate professors and lecturers (around 70 % of institutions), and researchers (around 60 % of institutions). In the case of experts, practitioners and other teaching support staff, the doctorate or a post-doctoral degree is less frequently required, but an academic degree other than the PhD is often needed.
There are also other formal or common requirements. For example, proven teaching experience and/or regular evaluation of teaching performance are commonly requested in the case of professors, lecturers and associate professors (around 50 % of institutions reported these requirements), but less often required for other teaching staff. Academics may also be requested to participate in teaching enhancement courses, although this is less common compared to the above requirements.
Although not depicted on a specific figure, the EUA Trends 2018 survey points to substantial differences between countries in requirements for distinct academic positions. For example, all responding institutions in Greece, Poland, Portugal, Romania, Russia, Switzerland and Ukraine report the doctorate or a post-doctoral degree as a formal or most common requirement for professorial positions, whereas their share is significantly lower in the Netherlands, Austria and the Czech Republic (43 %, 63 % and 67 %, respectively) (34). Proven teaching experience is commonly required for professors in Ukraine (all responding institutions reported this requirement), Russia (92 % of institutions) and Austria (75 %), and less frequently requested in Romania (13 %), Italy (23 %), Turkey (27 %) and Ireland (29 %). Regular evaluation of teaching performance is a requirement for professors in all responding institutions in Ukraine, 80 % of institutions in Kazakhstan and 77 % in Russia. In contrast, in the Czech Republic, France, Ireland, Italy and Sweden, the same requirement is reported by less than 15 % of institutions. Participation in teaching enhancement courses as a requirement for professors is relatively common in Kazakhstan, Romania, Russia, Ukraine and the United Kingdom (reported by at least half of all surveyed institutions), but quite uncommon in France, Italy, Poland Portugal and Turkey (less than 10 % of institutions).
Since the doctorate or a post-doctoral degree is commonly expected for various categories of staff with teaching responsibilities – in particular professors, associate professors and lecturers (see the previous figure) – one key question is whether and to what extent programmes leading to these qualifications include teaching components, i.e. courses in teaching or teaching practice. Figure 2.35
(34) These findings are partly consistent with a recent Eurydice report on academic staff (European Commission/EACEA/
Eurydice, 2017a) showing that in Austria, the Czech Republic and the Netherlands, the doctorate is not legally required for professors (ibid., pp. 112, 128-129). However, while not legally required, it is still commonly expected for professorial positions (ibid., pp. 32-34).

85
addresses this question by looking at whether top-level regulations require doctoral programmes to include such components.
Figure 2.35: Top-level requirements for third-cycle (doctoral) programmes to include teaching components, 2016/17
Source: BFUG data collection.
N otes : Teaching components in third-cycle programmes refer to courses in teaching or teaching practice.
As the figure indicates, only in a minority of EHEA systems (11 systems out of 49 for which data is available) do regulations specify that doctoral programmes have to include teaching components. Most of these systems are situated in the eastern part of the EHEA.
The requirement to include teaching components in doctoral programmes is often formulated in a flexible way, providing a high degree of autonomy to higher education institutions. For example, in Bulgaria, Georgia, Kazakhstan and Russia, regulations require doctoral programmes to include teaching components, but it is up to programme providers to specify their exact volume. A comparable situation can be observed in Denmark, where doctoral programmes have to include a course in university teaching, but the exact number of teaching hours is set individually, within the overall programme workload of 840 hours. In the former Yugoslav Republic of Macedonia, regulations refer to several competence areas to be included in doctoral programmes, one of them being 'lectures and other communication activities'. Regulations in Estonia are even more generic, defining teaching skills among the expected outcomes of doctoral programmes, but providing no details on teaching components to be incorporated into doctoral curricula.
In contrast to previous examples, there are also regulatory frameworks defining quite precisely the volume of teaching components to be included in doctoral programmes. In Poland, for instance, doctoral-degree programmes provided by universities (i.e. the vast majority of doctoral programmes (35)) should include a module of at least five ECTS credits targeting the development of teaching skills and they should also comprise an internship (practical training) corresponding to no less than 10 hours and no more than 90 hours per year.
(35) Programmes provided by institutes of the Polish Academy of Sciences and research institutes are not concerned.
Third-cycle (doctoral) programmes have to include teaching components
Third-cycle (doctoral) programmes do not have to include teaching components
Data not available

86
Teaching components – when indicated in regulations – sometimes apply only to specific doctoral programmes and/or to some categories of doctoral candidates. This is the case in Slovakia, where the requirement to teach applies only to full-time doctoral programmes and candidates, the extent of teaching being limited to an average of four hours per week. In Luxembourg, doctoral candidates employed at the university (i.e. around 80 % of all doctoral candidates) have a contractual obligation to carry out one to four teaching units per week. In Ukraine, the requirement applies to the degree 'doctor of philosophy', which includes courses in teaching corresponding to 30-60 ECTS and a mandatory teaching practice.
Even when not required by regulations, teaching components may still be commonly included in doctoral programmes. This is the case in Hungary and Latvia, both reporting that most doctoral programmes include teaching practice. The Netherlands indicates that all higher education institutions offer a range of courses and training programmes for higher education teachers, including introductory courses that can be followed by doctoral candidates. Still, around one-quarter of EHEA countries specify that doctoral programmes generally do not include teaching components.
The rather limited extent to which regulations require teaching components to be included in doctoral programmes can be partly explained by the fact that the doctorate opens employment opportunities that are wider than academia. In other words, only some doctoral degree holders stay in academia and, among those in academia, only some teach. Thus, it is important to look specifically at academic staff, enquiring about the extent to which those with teaching responsibilities are qualified to teach.
The BFUG data collection indicates that top-level regulations rarely require academics with teaching responsibilities to hold a teaching qualification, i.e. a degree, diploma or a certificate that validates a programme targeting the development of teaching skills.
The rare regulations requiring a teaching qualification generally do not concern all staff with teaching responsibilities. For example, in segmented higher education systems (i.e. systems with several higher education sectors), the requirement to hold a teaching qualification commonly applies only to one higher education sector, usually the professional higher education sector. This is the case in the French Community of Belgium, where academics teaching in professional higher education institutions have to hold a second-cycle degree qualification (master) and a certificate of capacity for teaching in higher education (certificat d’aptitude approprié à l’enseignement supérieur – CAPAES). A comparable situation can be observed in Switzerland, where academics teaching in universities of applied sciences and universities of teacher education are required to possess a 'teaching diploma', i.e. a diploma obtained from a university of teacher education, a diploma in adult education or a qualification in higher education pedagogy. In the Netherlands, universities of applied sciences have made it obligatory for all staff with teaching responsibilities of more than 0.4 FTE (full-time equivalent) to obtain a basic qualification in teaching (Basis Didactische Bekwaamheid – BDB). Another approach is observed in Denmark, where regulations differentiate between permanent and temporary positions. At universities, all permanent teaching staff must complete a course in university pedagogy.
When top-level regulations do not require teaching qualifications, holding such a qualification may still be a common practice for academics. For example, in Finland, most academics with teaching responsibilities possess a teaching qualification, although there are no regulations requiring it. In the Netherlands, the university sector agreed, in 2008, on the content and features of the University Teaching Qualification (UTQ). As a result, all universities have included these features in their own qualifications, and certified teachers are now recognised as qualified teachers in academic education by all participating institutions.
Practice reported by some other top-level authorities refers to 'training in teaching' rather than 'teaching qualifications'. In Ireland, for instance, professional development of certain academic staff categories (e.g. teaching fellows) generally includes the attainment of additional training in teaching.

87
In Romania, higher education institutions commonly require psycho-pedagogical training at entry to the academic career.
While academics in most countries do not have to possess a teaching qualification or undergo training in teaching, they are often requested by law to demonstrate teaching skills, especially when higher academic ranks or permanent positions are concerned. For example, in Estonia, regulations specify that academics who wish to fulfil a position of professor, associate professor (docent) or lecturer, should possess teaching skills and experience. A comparable situation can be observed in Kazakhstan, where the regulatory framework requires university professors to possess a higher education title in the profile of the subjects taught as well as research and teaching experience. In Germany, it is a pre-condition to have teaching experience to be hired by higher education institutions as an academic with teaching responsibilities. In Norway, all academics with teaching responsibilities are required to prove their teaching competence, following procedures defined by each higher education institution. In the former Yugoslav Republic of Macedonia, teaching skills of academics are assessed by a peer review panel within the process of appointment to academic positions, and by the Higher Education Accreditation and Evaluation Board within the process of accreditation or evaluation.
2 . 5 . 1 . 2 . O p p o r t u n i t i e s f o r t h e d e v e l o p m e n t o f t e a c h i n g s k i l l s
Data presented in the previous section suggest that teaching development in academia essentially consists of 'learning on the job'. Consequently, it is important to examine in more detail the extent and nature of the provision allowing academics to continuously develop their teaching skills.
Based on the EUA Trends 2018 survey, Figure 2.36 shows that higher education institutions commonly offer optional courses targeting the enhancement of teaching skills (77 % of responding institutions reported the presence of such provision) (36). Optional courses are followed by research activities in learning and teaching, and various initiatives to promote good teaching (both 66 % of institutions). Other types of activities promoting or developing teaching skills – e.g. compulsory teaching courses, peer feedback or team teaching – are less common, but they are still provided by a substantial share of higher education institutions (between 37 % and 51 %).
Figure 2.36: Measures to promote and develop teaching skills of academics (% of institutions), 2017
Optional courses to enhance teaching skills (preparation or training courses)
Research on learning and teaching
Recognition of good teaching (e.g. awards, career development, incentives)
Team teaching (two or more teachers jointly prepare and deliver a course or a class)
Portfolios in which teachers document their teaching practices (e.g. pedagogical materials, forms of student assessment)
Peer feedback system (teachers provide feedback on each other’s teaching)
Compulsory courses to enhance teaching skills (preparation or training courses)
Source: EUA.
(36) The survey, however, does not capture the extent of the existing provision, i.e. whether all interested academics can
easily participate in such courses.

88
When focusing on compulsory courses to enhance teaching skills – which are provided by 37 % of responding institutions (see Figure 2.36) –, some differences between countries can be observed. The share of higher education institutions reporting the existence of such courses is clearly above the average in Kazakhstan (93 % of responding institutions), Sweden (88 %), the United Kingdom (78 %), the Netherlands (67 %) and Russia (62 %). In contrast, compulsory courses to enhance teaching skills seem to be quite uncommon in Portugal (no responding institution reported this type of provision), Turkey (9 %), Italy (11 %), France (13 %), Spain (15 %) and Greece (17 %).
The EUA Trends 2018 survey also shows that compulsory courses to enhance teaching skills are not necessarily obligatory for all teaching staff. Most commonly, this type of provision is foreseen for newly hired staff (50 % of institution reporting compulsory courses indicated this staff category), followed by young teachers and early stage researchers (35 %). Still, 32 % of institutions providing compulsory courses reported that all teaching staff is expected to take part.
According to the above survey, compulsory courses in teaching cover a range of topics, some being more common than others. Often, these courses cover pedagogy and didactics (77 % of institutions reporting compulsory courses indicated these areas), student-centred learning (67 % of institutions), development of learning outcomes (62 %), teaching in an ICT environment and assessment of intended learning outcomes (both 60 %). Less common content areas include the integration of citizenship or entrepreneurship skills into teaching, or the development of social engagement initiatives as part of the curriculum (20-30 %).
2 . 5 . 1 . 3 . A s s e s s m e n t o f t e a c h i n g p e r f o r m a n c e a n d r o l e o f t e a c h i n g i n a c a d e m i c c a r e e r s
Higher education institutions may use various approaches to assess and/or enhance the quality of teaching. According to the EUA Trends 2018 survey, student feedback surveys represent the most common means of teaching assessment. Indeed, as Figure 2.37 shows, these surveys are in place (throughout the institution) in almost 90 % of responding institutions.
Figure 2.37: Means of assessment/enhancement of teaching in place throughout the institution (% of institutions), 2017
Student feedback surveys
Engagement with students (face time, mentoring, thesis supervision)
Processes in place to intervene in case teaching performance is constantly poor
Heads of departments/deans of faculties regularly discuss teaching performance with individual academic staff
Self-evaluations
Completion of teaching enhancement courses
Students’ progression
Peer assessments
Engagement with industry/business sector, community engagement
Other
Source: EUA.

89
Other assessment approaches are noticeably less common. For example, self-evaluations are in place in 44 % of institutions and peer assessment in around 30 % of institutions. A relatively high share of responding institutions (around 50 %) report approaches related to teaching enhancement (rather than teaching assessment), such as interventions in case of constantly poor teaching performance or performance discussions between faculty management and academics.
While not presented on a specific figure, there are differences between countries in the use of teaching assessment methods. For example, all responding institutions in Austria, Ireland, Kazakhstan, the Netherlands, Romania, Sweden, Switzerland and the United Kingdom reported the use of student feedback surveys throughout the institution, compared to only around 60-70 % in France, Russia, Turkey and Ukraine. Another assessment approach – self-evaluation – is common in Kazakhstan (in place throughout the institution in 93 % of responding institutions) as well as in the Netherlands, Romania, Russia, Ukraine and the United Kingdom (around 60-70 % of institutions), but less common in Austria, Ireland and Sweden (around 25-30 % of institutions). Peer assessment is relatively common in Kazakhstan, the Netherlands, Portugal, Romania, Ukraine and the United Kingdom (50 % or more responding institutions use it throughout the institution), but rather uncommon in Germany and Italy (around 10 % of institutions).
The EUA Trends 2018 survey also suggests that teaching performance evaluations play a non-negligible role in the promotion and career development of teaching staff. Indeed, among around 300 responding institutions, almost 90 % reported that these evaluations play either an important role or an important role to some extent. However, behind the average figure lie variations between countries. In Austria, Kazakhstan, Romania, Russia, Switzerland, Ukraine and the United Kingdom, all responding institutions indicated that teaching performance evaluations play an important role (at least to some extent) in the promotion and career development of teaching staff. In contrast, in France, only around half of all respondents reported an important role to some extent, whereas another half indicated that these evaluations do not play any substantial role in the promotion and career development of teaching staff. France was followed by Ireland, Italy and Turkey, where between 25 % and 30 % of responding institutions indicated no substantial role.
The EUA survey findings can be complemented by outcomes of the BFUG data collection that asked top-level authorities to ponder the role of research and teaching in career progression of academics. While answers provided have to be seen as estimates, they point to a rather clear pattern: around three-quarters of respondents (34 higher education systems) indicated that research is in general a stronger component than teaching in career progression of academics; around a quarter (12 systems) stated that teaching and research are equally important; and only one respondent reported that teaching is in general a stronger component than research (37). This finding combined with the previously analysed EUA data suggests that while teaching performance plays a non-negligible role in academic careers, research is still the key career component in most higher education systems.
2.5.2. Teaching from students' perspective One aspect to consider when analysing teaching quality is the students' point of view. Are students satisfied with their teachers? Are they inspired by them? Questions such as these are included in the Eurostudent survey providing data for around half of all EHEA countries.
The survey shows that the satisfaction of students with the quality of teaching is overall quite high (see Figure 2.38). Indeed, in virtually all the countries analysed, more than half of all students are satisfied or very satisfied with the quality of teaching in their current study programme. The highest level of satisfaction – 70 % of students or above – is recorded in Finland, Georgia, the Czech Republic,
(37) Respondents from further three systems stated that they had no access to information on these aspects.

90
Hungary, Ireland, Iceland, Sweden and Denmark. In contrast, in Romania, only 39 % of students are satisfied or very satisfied with teaching quality.
Figure 2.38: Students' satisfied with quality of teaching in their current study programme (%), 2016/17
FI GE CZ HU IE IS SE DK EE AL FR LV SI SK NO PT NL MT LT PL RS HR RO AT CH DE IT TR 76 76 74 71 71 71 70 70 69 69 68 67 66 65 65 61 61 60 58 55 55 51 39 : : : : :
Source: Eurostudent.
N otes : Students rated their satisfaction on a five-point scale ranging from 'very satisfied' to 'not at all satisfied'. The figure shows the two highest levels of satisfaction that were aggregated.
In almost two-thirds of the countries for which Eurostudent data is available, at least half of all students agree or strongly agree with the statement that their teachers inspire them (see Figure 2.39). The highest proportion of students considering their teachers as 'inspiring' – 60 % or above – is observed in Georgia, Iceland and Finland. In contrast, Croatia and Serbia record the lowest share of students agreeing with the statement that their teachers inspire them (33 % and 40 %, respectively).
Figure 2.39: Students agreeing with the statement that their teachers inspire them (%), 2016/17
GE IS FI EE DK CZ NO SI PT NL SE LV HU MT 76 67 60 58 58 58 57 55 54 54 52 51 51 50 SK AL IE LT RO PL RS HR AT CH DE FR IT TR 49 47 47 46 45 43 40 33 : : : : : :
Source: Eurostudent.
N otes : Students rated their agreement on a five-point scale ranging from 'strongly agree' to 'do not agree at all'. The figure shows the two highest levels of agreement that were aggregated.

91
When considering different elements presented in sections 2.5.1 and 2.5.2 in a combined perspective, some concordant – and rather positive – findings emerge. Teaching in higher education appears as an area of policy interest in both national and institutional strategies, courses for academics targeting the enhancement of teaching skills seem to be quite widespread and students' satisfaction with the quality of teaching is overall quite high. At the same time, requirements for teaching in higher education are still less clearly defined compared to other educational levels, and research performance of academics remains the key career component in most higher education systems.
2.6. Conclusions Improving the quality and relevance of teaching and learning in higher education has always been at the centre of the Bologna Process. This dimension was further strengthened in the Yerevan Communiqué, which calls for better visibility of this policy area. This chapter examined learning and teaching in higher education in five interlinked parts, covering, respectively, national and institutional strategies on promoting learning and teaching, the implementation of ECTS and the learning outcomes approach, flexible modes of study, learning in digital environments and, finally, teaching in new learning environments.
National strategies for higher education learning and teaching are now quite widespread across the EHEA, and they formulate various expectations towards higher education institutions. Commonly, top-level authorities ask institutions to develop their own learning and teaching strategy and/or to meet specific benchmarks for learning and teaching. National strategies also often promote the revision of teaching methods and approaches, as well as various teaching enhancement initiatives. Alongside national strategies, most higher education institutions have put in place an institutional strategy or policy for teaching and learning. This type of steering commonly promotes the development of international opportunities, academic staff development and measures to improve teaching. Overall, the enhancement of learning and teaching in higher education appears as a priority topic.
ECTS is one of the tools that is also having an impact on the modernisation of teaching and learning in the EHEA. There has been important progress in linking ECTS credits to learning outcomes; however, in a third of countries still not all first-and second-cycle programmes are described using this approach. Learning outcomes and associated student workload together are becoming the basis for credit allocation across the EHEA, except in ten countries. This difference in credit allocation approaches can have a negative impact on credit transfer of mobile students. New information compared to previous reports, and shown in Scorecard indicator n 1, is that in a third of the EHEA countries, external quality assurance is required to monitor six key principles of ECTS. In contrast, national authorities in another third of the countries do not provide policy steering for external quality assurance in this area.
The flexibility of higher education studies can be enhanced by the provision of alternative modes of study, e.g. 'part-time' studies. The majority of EHEA countries report that most of their higher education institutions ensure part-time or alternative forms of study. In around two-thirds of the countries, different modes of study go hand in hand with different student statuses (e.g. 'full-time'/'part-time'). Yet, studying with a formal status other than 'full-time' often requires higher private financial investment.
The provision of part-time (or other alterative) forms of study is particularly important for mature students. In virtually all EHEA countries, the share of part-timers among older students (aged 30-34) is more than twice as high as in a younger age group (aged 20-24) and, in some countries, it is more than ten times higher.
92
Since part-timers commonly combine studies with other engagements, they are often found among low intensity students, i.e. students who dedicate less than 20 hours per week to their studies. However, low intensity students can also be found among those who are formally considered as studying 'full-time'. Thus, the link between official student status and hours devoted to studying is not always straightforward.
Digitally enabled teaching and learning is increasingly addressed strategically at national and institutional levels. Most countries have strategies or policies in this area, with the main priority often on using digital technology in enhancing teaching and learning in on-campus programmes and, although to a lesser degree, on developing blended programmes. While online degree programmes (in particular in the first and the second cycles) and Massive Open Online Courses (MOOCs) are now part of the higher education courses landscape, they are less widespread. Importantly, the majority of countries invest in providing access to technology and equipping staff and students with digital skills. Nevertheless, framework conditions, encompassing for example, the legal framework, quality assurance and the certification of digital learning, are adapted to digital provision in around a third of the countries.
Higher education teachers are the key players in enabling students’ learning. However, while some academic staff categories – in particular professors, associate professors, lecturers and researchers – are commonly required to hold the doctorate or a post-doctoral degree, programmes leading to these qualifications do not necessarily include courses in teaching or teaching practice. Moreover, regulations generally do not require academics with teaching responsibilities to hold a teaching qualification, i.e. a degree, diploma or a certificate that validates a programme targeting the development of teaching skills. This suggests that the development of teaching skills in academia essentially consists of 'learning on the job'.
Higher education institutions commonly offer optional courses targeting the enhancement of teaching skills. Optional courses are followed in frequency by research activities in learning and teaching, and various initiatives to promote good teaching. Other types of activities promoting or developing teaching skills – e.g. compulsory teaching courses, peer feedback or team teaching – are less common, but they are still provided by a substantial share of higher education institutions.
Teaching performance of academics – which is most commonly assessed through student feedback surveys – seems to play a non-negligible role in promotion and career development. However, when asked to ponder the role of research and teaching in career progression of academics, around three-quarters of EHEA countries indicated that research is in general a stronger component than teaching.
The reported satisfaction of students with the quality of teaching is overall quite high. In virtually all the countries for which data is available, more than half of all students are satisfied or very satisfied with the quality of teaching in their current study programme. Moreover, in almost two-thirds of countries with data, at least half of all students agree or strongly agree with the statement that their teachers inspire them.
When considering different elements related to teaching in a combined perspective, some rather positive findings emerge. Teaching in higher education appears as an area of policy interest in both national and institutional strategies, courses for academics targeting the enhancement of teaching skills seem to be quite widespread and students' satisfaction with the quality of teaching is overall quite high. However, requirements for teaching in higher education are still less clearly defined compared to other educational levels and research performance of academics remains the key career component in most higher education systems.

279
GLOSSARY AND METHODOLOGICAL NOTES
I. Codes, abbreviations and acronyms I.1. Country Codes
AD Andorra AL Albania AM Armenia AT Austria AZ Azerbaijan BA Bosnia and
Herzegovina BE de Belgium – German-speaking
Community BE fr Belgium – French Community BE nl Belgium – Flemish Community BG Bulgaria BY Belarus CH Switzerland CY Cyprus CZ Czech Republic DE Germany DK Denmark EE Estonia
EL Greece ES Spain FI Finland FR France GE Georgia HR Croatia HU Hungary IE Ireland IS Iceland IT Italy KZ Kazakhstan LI Liechtenstein LT Lithuania LU Luxembourg LV Latvia MD Moldova ME Montenegro MT Malta
NL Netherlands NO Norway PL Poland PT Portugal RO Romania RS Serbia RU Russia SE Sweden SI Slovenia SK Slovakia (*) The former Yugoslav Republic of
Macedonia (Provisional code) TR Turkey UA Ukraine UK-ENG United Kingdom – England UK-NIR United Kingdom – Northern Ireland UK-SCT United Kingdom – Scotland UK-WLS United Kingdom – Wales VA Holy See

280
I.2. Abbreviations : Data not available BFUG Bologna Follow-Up Group CEEPUS Central European Exchange Program for University Studies COFOG Classification of the Functions of Government EEA European Economic Area EHEA European Higher Education Area ENIC European Network of Information Centres ESG European Standards and Guidelines for Quality Assurance EU European Union EUA European University Association EU-SILC European Union Statistics on Income and Living conditions EU-LFS EU Labour Force Survey FTE Full-time equivalent GDP Gross Domestic Product ISCED International Standard Classification of Education ISCO International Standard Classification of Occupations NARIC National Academic Recognition Information Centres OECD Organisation for Economic Co-operation and Development PPS Purchasing Power Standard R&D Research and Development UNESCO-UIS United Nations Educational, Scientific and Cultural Organization, Institute for Statistics UOE UNESCO-UIS/OECD/Eurostat
II. General terms Access routes to h igher educat ion
Routes to higher education are the different formal access requirements that are defined to be the necessary conditions of higher education access. Questions of selection or acceptance into a programme are not part of the definition.
Standard route: entering higher education with a standard entry qualification. The standard entry qualification is the most widely used diploma or certificate issued by a competent authority attesting the successful completion of an education programme and giving the holder of the qualification the right to be considered for admission to higher education (typically the upper secondary school leaving certificate).
Alternative route: entering higher education without a standard entry qualification, based on requirements other than the standard entry requirements (e.g. based on qualification other than the standard entry qualification or based on the recognition of prior non-formal and informal learning).
Admission ( to h igher educat ion inst i tut ions and programmes)
The act of, or system for, allowing qualified applicants to pursue studies in higher education at a given institution and/or a given programme (see the Lisbon Recognition Convention (143)).
Complet ion
The successful finishing of a study programme (graduation).
(143) Council of Europe Convention on the Recognition of Qualifications concerning Higher Education in the European Region,
ETS No.165, [Online] Available at: http://www.coe.int/en/web/conventions/full-list/-/conventions/treaty/165 [Accessed 22 February 2018].
281
Credi t accumulat ion/Accumulat ion of cred i ts
The process of collecting credits awarded for achieving the learning outcomes of educational components in formal contexts and for other learning activities carried out in informal and non-formal contexts. A student can accumulate credits in order to obtain qualifications, as required by the degree-awarding institution, or to document personal achievements for lifelong learning purposes (European Commission 2015 p. 66).
Credi t mobi l i ty
Credit mobility is a short-term form of mobility – usually a maximum of one year – aiming at the acquisition of credits in a foreign institution in the framework of on-going studies at the home institution.
Credi t t ransfer /Transfer of cred i ts
Is the process of having credits awarded in one context (programme, institution) recognised in another formal context for the purpose of obtaining a qualification. Credits awarded to students in one programme may be transferred from an institution to be accumulated in another programme offered by the same or another institution. Credit transfer is the key to successful study mobility. Institutions, faculties, departments may make agreements which guarantee automatic recognition and transfer of credits (European Commission 2015, p. 68).
Cycle
One of the objectives in the Bologna Declaration in 1999 was the ‘adoption of a system based on two main cycles, undergraduate and graduate.’ In 2003 doctoral studies were included in the Bologna structure and referred to as the third cycle. The EHEA has thus defined a hierarchy of three Higher Education cycles (first cycle, second cycle and third cycle). All higher education qualifications in the European Higher Education Area are located within these three cycles (European Commission 2015, p. 68).
Degree mobi l i ty
Degree mobility is a long-term form of mobility which aims at the acquisition of a whole degree or certificate in the country of destination.
Dig i ta l cert i f icates
Two types exist: a) Certificates that confirm participation in/ completion of a course, b) Certificates that verify the learner’s identity and confirm attainment of learning outcomes. Digital certificates typically include a URL which leads to the course information and/or the display of certificate information at the website of the course provider to prove the authenticity of the credential (Witthaus, et al., 2016).
Dip loma Supplement (DS)
Is a document accompanying a higher education diploma, providing a standardised description of the nature, level, context, content and status of the studies completed by its holder. It is produced by the higher education institutions according to standards agreed by the European Commission, the Council of Europe and UNESCO. The Diploma Supplement is also part of the Europass framework transparency tools.
It has the following eight sections of information: the holder of the qualification; the qualification; its level and function; the contents and results gained; certification of the supplement; details of the national higher education system concerned (provided by the National Academic Recognition Information Centres (NARICs)); any additional relevant information.

282
Graduates in all the countries taking part in the Bologna Process have the right to receive the Diploma Supplement automatically, free and in a major European language (European Commission 2015, p. 69).
Doctora l /Research school
An organisational structure that includes only doctoral students. It may be organised around a particular discipline, research theme or a cross-disciplinary research area and/or it is focused on creating a research group/network and is project-driven. It may involve one institution or several institutions and organise co-operation among them (EUA 2007, p. 27).
Credi t (ECTS)
ECTS credits express the volume of learning based on the defined learning outcomes and their associated workload. 60 ECTS credits are allocated to the learning outcomes and associated workload of a full-time academic year or its equivalent, which normally comprises a number of educational components to which credits (on the basis of the learning outcomes and workload) are allocated. ECTS credits are generally expressed in whole numbers (European Commission 2015, p. 68).
Drop-out
Refers to students who start but do not continue or finish a study programme.
European Associat ion for Qual i ty Assurance in H igher Educat ion (ENQA)
The association of quality assurance agencies in the European Higher Education Area was set up in 2000. It aims to disseminate information, experiences and good practices in the field of quality assurance in higher education. Membership of the association is open to quality assurance agencies in the EHEA member states. Membership of ENQA represents recognition that an agency complies with the Standards and Guidelines for Quality Assurance in the European Higher Education Area (ESG).
European Credi t Transfer and Accumulat ion System (ECTS)
ECTS is a learner-centred system for credit accumulation and transfer, based on the principle of transparency of the learning, teaching and assessment processes. Its objective is to facilitate the planning, delivery and evaluation of study programmes and student mobility by recognising learning achievements and qualifications and periods of learning (European Commission 2015, p. 69).
European Qual i f icat ions Framework for L i fe long Learn ing (EQF)
The European Qualifications Framework for lifelong learning is a common European reference framework which aims to increase the transparency, comparability and portability of qualifications systems and all types and levels of qualifications in Europe. The EQF uses eight common European reference levels based on learning outcomes that are defined in terms of knowledge, skills and competences. The EQF is implemented by referencing levels of national qualifications frameworks to the levels of the EQF. The EQF was adopted by the Council of Ministers in the EU in 2008 and revised in 2017.
European Qual i ty Assurance Register for H igher Educat ion (EQAR)
The Register aims at increasing transparency of quality assurance in higher education across Europe. It has been founded in 2008 by the European Association for Quality Assurance in Higher Education (ENQA), the European Students' Union (ESU), the European University Association and the European Association of Institutions in Higher Education (EURASHE). EQAR publishes and manages a list of quality assurance agencies that substantially comply with the European Standards and Guidelines for

283
Quality Assurance (ESG) to provide clear and reliable information on quality assurance agencies operating in Europe (144).
External qual i ty assurance
External quality assurance refers to the process of evaluation or audit of a higher education programme or institution undertaken by a specialised body outside the institution. Typically the body may be a quality assurance or accreditation agency, or an ad hoc panel of experts and peers constituted by the responsible Ministry. The evaluation will involve the collection of data, information and evidence for assessment against agreed standards.
Fee
Any sum of money paid by students with which they formally and compulsorily contribute to the cost of their higher education. This may include, but is not restricted to e.g. a registration fee, tuition fees, graduation fees, administrative fees, etc. Payments to student unions are not taken into account.
Formal learning
Formal learning means learning which takes place in an organised and structured environment, specifically dedicated to learning, and typically leads to the award of a qualification, usually in the form of a certificate or a diploma. It includes systems of general education, initial vocational training and higher education (145).
Framework for Qual i f icat ions of the European Higher Educat ion Area /Qual i f icat ions Framework for the European Higher Educat ion Area (QF-EHEA)
Refers to the overarching framework for qualifications in the EHEA, which comprises three cycles (including, within national contexts, the possibility of intermediate qualifications), generic descriptors for each cycle based on learning outcomes, and credit ranges in the first and second cycles. In order to prove the compatibility of national qualifications frameworks for higher education with the QF EHEA, NQFs need to be self-certified to the QF-EHEA.
Funding formulas
Funding formulas are formulas that automatically allocate funds to institutions. They may vary on the basis of the factors used in their development. These might include among others inputs, such as students or staff, nominal, real or average costs per student and performance-based criteria (Salmi and Hauptman 2006, p. 10).
Govern ing bodies
Refers to structures with responsibility for the strategic orientation and organisation/management of higher education institutions.
Graduate t rack ing surveys
A survey of graduates from institutions of higher education (sometimes also called as 'alumni survey' or 'follow-up survey') that usually aims at mapping the labour market situation (professional success, relevance of skills etc.) of graduates. Graduate surveys provide information for evaluating the results of the education and training of a specific institution of higher education (Schomburg 2003, p. 11).
Regular graduate tracking surveys are conducted repeatedly, in regular intervals.
(144) For more details on the European Quality Assurance Register for Higher Education (EQAR), see http://www.eqar.eu/
[Accessed 8 March 2018]. (145) Council Recommendation of 20 December 2012 on the validation of non-formal and informal learning,
O.J. 2012/C 398/01.
284
Grant
Non-repayable public financial support. A need-based grant is awarded on the basis of financial hardship/socio-economic background of students. Universal grants are awarded to (almost) all students. For the purposes of this report, grants can be regarded as universal if they are awarded to at least 50 % of students. A merit-based grant is awarded on the basis of the academic performance of students.
Higher educat ion inst i tut ion
Any institution providing services in the field of higher and/or tertiary education, as defined by national law.
Higher educat ion qual i f icat ion
Any degree, diploma or other certificate issued by a competent authority attesting the successful completion of a higher education programme (Lisbon Recognition Convention (146)).
Incent ives
Apart from regulations, educational authorities can also encourage higher education institutions to follow certain policy lines (e.g. support under-represented groups, enhance completion, include work placements or mobility windows into study programmes, etc.) through incentives. Incentives can be financial, based on funding formulas or performance-based funding, or can include organisational or managerial support.
Incoming mobi l i ty
Incoming mobility refers to students that moved (i.e. crossed a national border) to a specified country to study.
In formal learn ing
Informal learning means learning resulting from daily activities related to work, family or leisure and is not organised or structured in terms of objectives, time or learning support; it may be unintentional from the learner's perspective; examples of learning outcomes acquired through informal learning are skills acquired through life and work experiences, project management skills or ICT skills acquired at work, languages learned and intercultural skills acquired during a stay in another country, ICT skills acquired outside work, skills acquired through volunteering, cultural activities, sports, youth work and through activities at home (e.g. taking care of a child) (147).
In tegrated / long programmes
Programmes including both the first and the second cycle and leading to a second-cycle qualification.
In terna l qual i ty assurance
Internal quality assurance refers to the processes involved in assuring and/or improving the quality of defined areas of activity within higher education institutions. Typically, it involves the systematic collection and analysis of administrative data, as well as the feedback of students, lecturers, other staff and external stakeholders.
(146) Council of Europe Convention on the Recognition of Qualifications concerning Higher Education in the European Region,
ETS No.165, [Online] Available at: http://www.coe.int/en/web/conventions/full-list/-/conventions/treaty/165 [Accessed 22 February 2018].
(147) Council Recommendation of 20 December 2012 on the validation of non-formal and informal learning, O.J. 2012/C 398/01.

285
Joint degree
A joint degree is a single document officially recognised by the appropriate (national or, if applicable, regional) authorities of at least two countries.
Joint programme
Joint programmes are usually inter-institutional arrangements among higher education institutions leading to a joint degree. Parts of joint programmes undertaken by students at partner institutions are recognised automatically by the other partner institutions. The same is true for joint degrees.
Labour market /sk i l ls forecast ing
'Forecasting skill needs involves estimating the expected future number of jobs available in an economy [in the medium or long term] and their particular skill or qualification requirements. Skills needs forecasts are complemented by forecasts of the number of people (supply) with particular skills. The comparison of demand and supply can indicate potential imbalances or skill mismatches in future labour markets. Most typically, skills supply and demand is forecasted in order to help different labour market actors – employees, employers, students and parents, social partners, policy makers – to take informed decisions and appropriate action concerning the labour market. Labour market forecasting is usually conducted by occupation and qualification levels (Cedefop, 2012).
Learn ing outcome
Learning outcomes are statements of what the individual knows, understands and is able to do on completion of a learning process. The achievement of learning outcomes has to be assessed through procedures based on clear and transparent criteria. Learning outcomes are attributed to individual educational components and to programmes at a whole. They are also used in European and national qualifications frameworks to describe the level of the individual qualification (European Commission 2015, p. 72).
Lisbon Recogni t ion Convent ion (LRC)
The Convention on the Recognition of Qualifications concerning Higher Education in the European Region (148) was developed by the Council of Europe and UNESCO and adopted in 1997 in Lisbon. It aims to ensure that holders of a qualification from one European country have that qualification recognised in another.
Loan
Repayable financial aid. Student loan models may differ in many aspects, such as in their repayment plans, the level of subsidy, the expenses covered, eligibility rules, etc. A student loan is subsidised when the government bears a part of the costs. This can take the form of a government guarantee, when student loans are guaranteed or insured by the government against the risk of default and loss (Salmi and Hauptman 2006, p. 43).
Massive Open Onl ine Courses (MOOCs)
Courses which allow open entry, are free, and are delivered online usually with peer or automated support. They often have large enrolment numbers. For the purposes of this data collection, we consider MOOCs as (usually shorter) online courses which do not result in degree qualifications. MOOCs may be provided by higher education institutions as well as other providers.
(148) Council of Europe Convention on the Recognition of Qualifications concerning Higher Education in the European Region,
ETS No.165, [Online] Available at: http://www.coe.int/en/web/conventions/full-list/-/conventions/treaty/165 [Accessed 22 February 2018].
286
Mobi l i ty w indow
A period of time reserved for international student mobility that is embedded into the curriculum of a study programme.
Moni tor ing
Monitoring is the process of systematic data gathering, analysis and use of information by top-level authorities to inform policy. Systematic monitoring must include mechanisms of cross-institutional data gathering and allow cross-institutional data comparability.
Nat ional qual i f icat ions f rameworks for h igher educat ion
National qualifications frameworks describe qualifications in terms of level, workload, learning outcomes and profile. They relate qualifications and other learning achievements in higher education coherently and are internationally understood.
Non-formal learn ing
Non-formal learning means learning which takes place through planned activities (in terms of learning objectives, learning time) where some form of learning support is present (e.g. student-teacher relationships); it may cover programmes to impart work skills, adult literacy and basic education for early school leavers; very common cases of non-formal learning include in-company training, through which companies update and improve the skills of their workers such as ICT skills, structured on-line learning (e.g. by making use of open educational resources), and courses organised by civil society organisations for their members, their target group or the general public (149).
Onl ine programme
A higher education programme that is provided primarily or entirely through the use of an Internet-connected computer, rather than attending a programme in a traditional higher education institution/campus setting.
Outward mobi l i ty
Outward mobility refers to students that left their country of residence (i.e. crossed a national border) to study elsewhere (in which they are counted as inwardly mobile students).
Performance-based mechanisms
Performance-based mechanisms are funding mechanisms related to actual or intended results by an institution over a certain period. They may be based on outputs, such as number of graduates, or inputs, such as number of students/staff with certain characteristics. Performance-based mechanisms may take the form of performance contracts, performance set asides and payments for results in research and/or education (Salmi and Hauptman 2006, p. 16).
Portabi l i ty
The possibility to take the support available to students in their home country abroad (within EHEA) for credit mobility (credit portability) or degree mobility (degree portability) (European Commission/ EACEA/Eurydice 2016b, p. 57).
(149) Council Recommendation of 20 December 2012 on the validation of non-formal and informal learning,
O.J. 2012/C 398/01.
287
Preferent ia l t reatment
The treatment of one individual or group of individuals in a manner that is likely to lead to greater benefits, access, rights, opportunities or status than those of another individual or group of individuals. Regarding admission to higher education, preferential treatment can include, for example, entry quotas, the awarding of extra points in a selection process on the basis of belonging to an under-represented group, etc.
Publ ic h igher educat ion inst i tut ion
With this term we refer to higher education institutions directly or indirectly administered by a public education authority. Public higher education institutions thus include two categories of institution: 'public institution', i.e. an institution directly managed by a government agency/authority or by a governing body, most of whose members are either appointed by a public authority or elected by public franchise, and: 'government-dependent private higher education institution', i.e. an institution controlled/managed by a non-governmental organisation or where the governing board consists of members not selected by a public agency but receiving 50 percent or more of its core funding from government agencies or whose teaching personnel are paid by a government agency – either directly or through government.
Qual i ty assurance agency
A body established by public authorities with responsibility for external quality assurance. Agencies are intended to play a strong role in ensuring accountability of higher education institutions and may have specific objectives and developmental roles regarding enhancing quality.
Quant i tat ive ob ject ives
Quantitative targets defining a goal to be reached (in terms of a concrete percentage) regarding the composition of students in various respects (e.g. regarding the proportion of under-represented groups entering higher education, completing it or participating in mobility programmes).
Recognit ion of non- formal and in formal learn ing
Validation and formal recognition of learners' non-formal and informal learning experiences in order to:
• provide higher education access to candidates without an upper secondary school leaving certificate; or
• within a higher education programme, allocate credits towards a qualification and/or provide exemption from some programme requirements.
Retent ion
The successful continuation of a study programme.
Self -cert i f icat ion
A procedure when national authorities, other bodies and stakeholders certify the compatibility of their national qualifications framework for higher education with the overarching Qualifications Framework for the European Higher Education Area. A set of procedures for the transparent self-certification of compatibility by member states was agreed by higher education ministers in the Bologna Process.
Short cycle
Degree programmes of less than 180 ECTS (or lasting less than 3 years), leading to a qualification that is recognised at a lower level than a qualification at the end of the first cycle. Short-cycle qualifications are recognised in the overarching framework of qualifications for the European Higher Education Area (QF-EHEA).
288
Socio-economic status
A combined economic and sociological measure of an individual's or family's economic and social position relative to others, based on income, level of education, and occupation. Definitions of socio-economic status might differ depending on the national context.
Standards and Guidel ines for Qual i ty Assurance in the European Higher Educat ion Area (ESG)
European standards and guidelines are an agreed set of standards and guidelines for quality assurance in European higher education. They were developed by the 'E4 Group' (i.e. ENQA, EUA, EURASHE and ESU) and adopted by the ministers in Bergen in 2005. Revision to the ESG was undertaken between the Bucharest and Yerevan Ministerial Conferences, and an updated version of the ESG was adopted at the Yerevan Ministerial Conference in 2015 (150).
Steer ing documents
Official documents containing guidelines, obligations and/or recommendations for higher education policy and/or institutions.
Strategy
An official policy document developed by the central authorities in an effort to achieve an overall goal. A strategy can comprise a vision, identify objectives and goals (qualitative and quantitative), describe processes, authorities and people in charge, identify funding sources, make recommendations, etc.
Student -cent red learn ing
The European Students' Union (ESU) defines student-centred learning as 'both a mindset and a culture […] characterised by innovative methods of teaching which aim to promote learning in communication with teachers and other learners and which take students seriously as active participants in their own learning, fostering transferable skills such as problem-solving, critical thinking and reflective thinking' (ESU, 2015, n.p.).
Tax benef i ts
Tax relief of any kind, not limited to income tax.
Under- represented groups of students
Societal groups that may be considered as not being proportionally represented in higher education in different countries. Examples might include people with disabilities, migrants, ethnic groups, lower socio-economic status groups, women/men, etc.
Vert ica l segregat ion
Vertical segregation refers to the phenomenon that while women outnumber men amongst higher education graduates, they are slightly under-represented at doctoral level, and there are even fewer women amongst higher ranking academic staff in universities. Thus, vertical segregation refers to the under-representation of women at higher levels of the professional hierarchy.
Workload
An estimation of the time learners typically need to complete all learning activities such as lectures, seminars, projects, practical work, work placements, individual study required to achieve the defined learning outcomes in formal learning environments. The correspondence of the fulltime workload of an academic year to 60 credits is often formalised by national legal provisions. In most cases, student
(150) For more details on the European Standards and Guidelines for Quality Assurance in the European Higher Education
Area (ESG), see http://www.enqa.eu/index.php/home/esg/ [Accessed 8 March 2018].

289
workload ranges from 1 500 to 1 800 hours for an academic year, which means that one credit corresponds to 25 to 30 hours of work. It should be recognised that this represents the normal workload and that for individual learners the actual time to achieve the learning outcomes will vary. (European Commission 2015, p. 77)
Work p lacement /pract ica l t ra in ing
The term 'work placement' refers to experience gained in a working environment as an integrative part of a higher education programme. Most typically, it refers to the placement of students in supervised work settings (e.g. through internships) so they can apply the knowledge and skills learned during their studies. Alternatively, it can also refer to a period of voluntary work (also referred to as 'student-community engagement') that is intended to allow students to become familiar with the working environment in general, whilst also conveying some benefit to the community (Bourner and Millican, 2011).
III. Statistical terms Academic sta f f (F igures 1 .6 , 1 .7 and 1 .8)
This category includes:
• Personnel employed at the tertiary level of education whose primary assignment is instruction or research;
• Personnel who hold an academic rank with such titles as professor, associate professor, assistant professor, instructor, lecturer or the equivalent of any of these academic ranks;
• Personnel with other titles, (e.g. dean, director, associate dean, assistant dean, chair or head of department), if their principal activity is instruction or research.
It excludes student teachers, teachers’ aides and paraprofessionals (UNESCO-UIS, OECD and Eurostat 2016, p. 43).
Access routes to h igher educat ion (F igure 5 .16)
Standard route: entering higher education with the standard entry qualification (the upper secondary school leaving certificate) obtained in direct relation to leaving school for the first time (e.g. Matura, Abitur, Baccalauréat), either in the country of survey or abroad.
Delayed route: entering higher education with the standard entry qualification (the upper secondary school leaving certificate) obtained with a delay, e.g. via evening classes or adult learning.
Alternative route: entering higher education without the standard entry qualification.
At-r isk-of -poverty rate (F igure 6 .8)
The at-risk-of-poverty rate is the share of people with an equivalised disposable income (after social transfer) below the at-risk-of-poverty threshold, which is set at 60 % of the national median equivalised disposable income after social transfers (Eurostat, 2018a).
The equivalised disposable income is the total income of a household, after tax and other deductions, that is available for spending or saving, divided by the number of household members converted into equalised adults; household members are equalised or made equivalent by weighting each according to their age, using the so-called modified OECD equivalence scale (Eurostat, 2018b).

290
Complet ion ra te (F igure 5 .28)
Tertiary completion rates show the percentage of students who enter (i.e. entrants) a tertiary programme and ultimately graduate from it. The preferred method used to calculate the completion rate is the true cohort method based on panel data (survey or registers), which follow the individual student from entrance to graduation in the programme. The completion rate gives the proportion of entrants who graduated within the theoretical duration of the programme (N) plus 3 years (N+3), to ensure that only a minority of entrants are still enrolled in the system by that time. Unfortunately, as Figure 5.28 shows, only a limited number of countries apply the true cohort method to calculate completion rates.
Delayed t ransi t ion students (F igures 5 .2 and 5 .9 )
Delayed transition is a characteristic used for defining a type of student, who entered higher education for the first time more than 24 months after leaving school.
Educat ional a t ta inment (F igures 5 .1 , 5 .2 , 6 .1 , 6 .2 , 6 .3 , 6 .6 , 6 .7 and 6 .8 )
Educational attainment refers to the highest level of education successfully completed. Indicators using the International Standard Classification of Education (ISCED) often distinguish between low, medium and high educational attainment. These categories are compiled as follows (in EU LFS):
• Low educational attainment corresponds to completed pre-primary, primary and lower secondary education (ISCED levels 0, 1 and 2). For figures in Chapter 6, low educational attainment refers to completed lower secondary education (ISCED 2).
• Medium educational attainment corresponds to upper secondary and post-secondary non-tertiary education (ISCED levels 3 and 4). For figures in Chapter 6, medium educational attainment refers to completed upper secondary education (ISCED 4).
• High educational attainment corresponds to tertiary education (ISCED levels 5 to 8).
When referring to students with or without a higher education background (Figure 5.2), then students with higher education background are those whose parents' highest degree is at ISCED level 5-8; and students without higher education background are those whose parents' highest degree is at ISCED level 0-4.
Expendi ture on ter t iary educat ion (F igures 1 .9 , 1 .10 , 1 .12 , 1 .13 , 1 .14 and 5 .21)
Within the UOE data collection, education expenditure includes the following financial data:
• Goods and Services of educational institutions: All direct public, private and international expenditure whether educational or non-educational (e.g. ancillary services), but with some exceptions; and;
• Goods and Services purchased outside educational institutions: private expenditure on educational goods and services; plus
• Public subsidies to students for student living costs regardless of where or how the student spends these subsidies (UNESCO-UIS, OECD and Eurostat 2016, p. 48).
Public expenditure refers to spending of public authorities. Expenditure on education by other ministries or equivalent institutions, for example Health and Agriculture is included. It includes subsidies provided to households and other private entities (often in the form of financial aid to students) which can be attributable to educational institutions (e.g. fees) or not (e.g. private living costs outside of institutions). Expenditure that is not directly related to education (e.g., culture, sports, youth activities, etc.) is excluded unless provided as ancillary services. (Ibid, p. 56).

291
Three main types of government expenditure (at central, regional or local levels) on education are distinguished:
• Direct expenditure on educational institutions,
• Intergovernmental transfers for education, and
• Transfers or other payments from governments to households and other private entities.
Public subsidies to households includes:
• Scholarships and other grants (including child allowances contingent to student status, special public subsidies in cash or in kind that are contingent on student status) and
• Student loans (including those not attributable to household payments for educational institutions, such as subsidies for student living costs) (Ibid, p. 58).
On differences between the UOE data collection and data based on COFOG (see Figure 1.11), see Section IV.
Formal student status (Eurostudent ) (F igures 2 .24 and 2 .25)
In the framework of Eurostudent research, formal status includes student’s official registration, which is recognised by the state’s order and/or the higher education institutions in the respective country. It contains the categories full-time, part-time, and other. A full-time/part-time student is a student who formally holds the respective status irrespective of the weekly number of hours spent on study-related activities (taught and personal study time) (Hauschildt et al., 2015).
Ful l - t ime equiva lent student (F igures 1 .12 , 1 .13 and 1 .14)
A full-time equivalent (FTE) is a unit to measure students in a way that makes them comparable although they may study a different number of hours per week. The unit is obtained by comparing a student's average number of hours studied to the average number of hours of a full-time student. A full-time student is therefore counted as one FTE, while a part-time student gets a score in proportion to the hours he or she studies (Eurostat, 2015b).
Gross income (F igures 6 .6 and 6 .7)
Gross income is the sum of the variables PY010G 'Employee cash or near cash income' and PY020G 'Non-Cash employee income' derived from the EU-SILC database. Gross means that neither taxes nor social contributions have been deducted at source. Employee income is defined as the total remuneration, in cash or in kind, payable by an employer to an employee in return for work done by the latter during the income reference period.
Gross employee cash or near cash income (PY010G) refers to the monetary component of the compensation of employees in cash payable by an employer to an employee. It includes the value of any social contributions and income taxes payable by an employee or by the employer on behalf of the employee to social insurance schemes or tax authorities. Examples of items included are:
• Wages and salaries paid in cash for time worked or work done in main and any secondary or casual job(s);
• Remuneration for time not worked (e.g. holiday payments);
• Enhanced rates of pay for overtime;
• Supplementary payments (e.g. thirteenth month payment);
• Profit sharing and bonuses paid in cash;
• Allowances for transport to or from work.

292
Gross non-cash employee income (PY020G) refers to the non-monetary income components which may be provided free or at reduced price to an employee as part of the employment package by an employer (only the value of private use is taken into account). Examples are a company car and associated costs, free or subsidised meals, luncheon vouchers, reimbursement or payment of housing-related expenses.
Incoming mobi l i ty rate (F igures 7 .10, 7 .11 , 7 .17 , 7 .18, 7 .19 and 7 .20)
Incoming mobility rate refers to mobile students (enrolments or graduates) from abroad studying in the country of destination as a percentage of the total number of students enrolled/graduating in the country.
In ternat ional Standard Classi f icat ion of Educat ion ( ISCED)
The International Standard Classification of Education (ISCED) has been developed to facilitate comparisons of education statistics and indicators across countries on the basis of uniform and internationally agreed definitions. The coverage of ISCED extends to all organised and sustained learning opportunities for children, young people and adults, including those with special educational needs, irrespective of the institutions or organisations providing them or the form in which they are delivered.
The older ISCED classification – known as ISCED 1997 (UNESCO, 1997b) – referred to seven levels of education:
ISCED 0: Pre-primary education;
ISCED 1: Primary education;
ISCED 2: Lower secondary education;
ISCED 3: Upper secondary education;
ISCED 4: Post-secondary non-tertiary education;
ISCED 5: Tertiary education (first stage);
ISCED 6: Tertiary education (second stage).
The current classification – ISCED 2011 or 'ISCED' (UNESCO-UIS, 2012) – refers to the following levels of education:
ISCED 0: Pre-primary education
Programmes at level 0 (pre-primary), defined as the initial stage of organised instruction, are designed primarily to introduce very young children to a school-type environment, i.e. to provide a bridge between the home and a school-based atmosphere. Upon completion of these programmes, children continue their education at level 1 (primary education).
ISCED level 0 programmes are usually school-based or otherwise institutionalised for a group of children (e.g. centre-based, community-based, home-based).
Early childhood educational development (ISCED level 010) has educational content designed for younger children (in the age range of 0 to 2 years). Pre-primary education (ISCED level 020) is designed for children aged at least 3 years.
ISCED 1: Primary education
Primary education provides learning and educational activities typically designed to provide students with fundamental skills in reading, writing and mathematics (i.e. literacy and

293
numeracy). It establishes a sound foundation for learning, a solid understanding of core areas of knowledge and fosters personal development, thus preparing students for lower secondary education. It provides basic learning with little specialisation, if any.
This level begins between 5 and 7 years of age, is compulsory in all countries and generally lasts from four to six years.
ISCED 2: Lower secondary education
Programmes at ISCED level 2, or lower secondary education, typically build upon the fundamental teaching and learning processes which begin at ISCED level 1. Usually, the educational aim is to lay the foundation for lifelong learning and personal development that prepares students for further educational opportunities. Programmes at this level are usually organised around a more subject-oriented curriculum, introducing theoretical concepts across a broad range of subjects.
This level typically begins around the age of 11 or 12 and usually ends at age 15 or 16, often coinciding with the end of compulsory education.
ISCED 3: Upper secondary education
Programmes at ISCED level 3, or upper secondary education, are typically designed to complete secondary education in preparation for tertiary or higher education, or to provide skills relevant to employment, or both. Programmes at this level offer students more subject-based, specialist and in-depth programmes than in lower secondary education (ISCED level 2). They are more differentiated, with an increased range of options and streams available.
This level generally begins at the end of compulsory education. The entry age is typically age 15 or 16. Entry qualifications (e.g. completion of compulsory education) or other minimum requirements are usually needed. The duration of ISCED level 3 varies from two to five years.
ISCED 4: Post-secondary non-tertiary education
Post-secondary non-tertiary programmes build on secondary education to provide learning and educational activities to prepare students for entry into the labour market and/or tertiary education. It typically targets students who have completed upper secondary (ISCED level 3) but who want to improve their skills and increase the opportunities available to them. Programmes are often not significantly more advanced than those at upper secondary level as they typically serve to broaden rather than deepen knowledge, skills and competencies. They are therefore pitched below the higher level of complexity characteristic of tertiary education.
ISCED 5: Short-cycle tertiary education
Programmes at ISCED level 5 are short-cycle tertiary education, and are often designed to provide participants with professional knowledge, skills and competencies. Typically, they are practice-based and occupation-specific, preparing students to enter the labour market. However, these programmes may also provide a pathway to other tertiary education programmes.
Academic tertiary education programmes below the level of a Bachelor's programme or equivalent are also classified as ISCED level 5.
ISCED 6: Bachelor's or equivalent level
Programmes at ISCED level 6 are at Bachelor's or equivalent level, which are often designed to provide participants with intermediate academic and/or professional knowledge, skills and

294
competencies, leading to a first degree or equivalent qualification. Programmes at this level are typically theory-based but may include practical elements; they are informed by state of the art research and/or best professional practice. ISCED 6 programmes are traditionally offered by universities and equivalent tertiary educational institutions.
ISCED 7: Master's or equivalent level
Programmes at ISCED level 7 are at Master's or equivalent level, and are often designed to provide participants with advanced academic and/or professional knowledge, skills and competencies, leading to a second degree or equivalent qualification. Programmes at this level may have a substantial research component but do not lead to the award of a doctoral qualification. Typically, programmes at this level are theory-based but may include practical components and are informed by state of the art research and/or best professional practice. They are traditionally offered by universities and other tertiary educational institutions.
ISCED 8: Doctoral or equivalent level
Programmes at ISCED level 8 are at doctoral or equivalent level, and are designed primarily to lead to an advanced research qualification. Programmes at this ISCED level are devoted to advanced study and original research and are typically offered only by research-oriented tertiary educational institutions such as universities. Doctoral programmes exist in both academic and professional fields.
The first statistical data collection based on ISCED 2011 took place in 2014.
The ISCED classification also refers to fields of education. This area was revised in 2013 (ISCED-F 2013). The current classification refers to 'broad fields', which are further divided into 'narrow fields' and 'detailed fields' (UNESCO-UIS, 2015). The 'broad fields' are as follows:
00 Generic programmes and qualifications;
01 Education;
02 Arts and humanities;
03 Social sciences, journalism and information;
04 Business, administration and law;
05 Natural sciences, mathematics and statistics;
06 Information and Communication Technologies (ICTs);
07 Engineering, manufacturing and construction;
08 Agriculture, forestry, fisheries and veterinary;
09 Health and welfare;
10 Services;
99 Field unknown.

295
In ternat ional Standard Classi f icat ion of Occupat ions ( ISCO) (F igures 6 .9 , 6 .10, 6 .11 and 6 .12)
ISCO is a tool for organizing jobs into a clearly defined set of groups according to the tasks and duties undertaken in the job. The first version of ISCO was adopted in 1957 by the Ninth International Conference of Labour Statisticians (ICLS). The second version, ISCO-68 was adopted in 1966 and the third version, ISCO-88, in 1987. Though ISCO-88 was updated in December 2007 (ISCO-08), this report uses the classification of the ISCO-88 version, which defines the following major groups:
4. Legislators, senior officials and managers
5. Professionals
6. Technicians and associate professionals
7. Clerks
8. Service workers and shop and market sales workers
9. Skilled agricultural and fishery workers
10. Craft and related trades workers
11. Plant and machine operators and assemblers
12. Elementary occupations
13. Armed forces (151)
Mature students (F igures 5 .8 , 5 .9 and 5 .32)
For the purposes of this report, mature students are defined as students aged 30 or more years old.
Median
The median is the middle value in a group of numbers ranked in order of size, thus dividing the group into two halves. In other words, it is the number in a range of scores that falls exactly in the middle so that 50 % of the scores are above and 50 % are below (Eurostat, 2018c). In this report, the EHEA median refers to the median of values among the EHEA countries where data are available.
Migrant s tatus (F igure 5 .6 )
In the Eurostudent survey, students are classified according to their own and their parents' places of birth and the location of their latest educational attainment. Students are classified as international students if they possess a foreign higher education entry qualification or have left the school system for the first time abroad (regardless of their and their parents' birthplace). Students with a national higher educational entry qualification, or who have left the regular school system for the first time without a qualification in the country of the survey, are further categorised according to their own and their parents' places of birth. First generation students with national educational background were born abroad, as were at least one of their parents. Second generation students with national educational background have one (mixed) or two (foreign) parents who were not born in the country of the survey. The category "Other" comprises students who were born abroad, but have parents born in the country of survey. Students without migration background and national educational background were born in the country of survey, as were their parents.
Eurostat data (Figure 5.7) only makes a distinction between the foreign-born and the native-born population, without reference to migrant status.
(151) For more details on the ISCO classification, see: http://www.ilo.org/public/english/bureau/stat/isco/
[Accessed 8 March 2018].

296
New entrants (F igures 5 .1 , 5 .3 and 5 .4 )
New entrants to a level of education are students who, during the course of the reference school or academic year, enter for the first time any programme in a given level of education, irrespective of whether the students enter the programme at the beginning or at an advanced stage of the programme (e.g. by virtue of credits gained for relevant work experience or courses taken at another level of education) (UNESCO, OECD and Eurostat 2016, p. 36).
Odds rat io (F igures 5 .29 and 5 .31)
The odds ratio refers to the ratio of the likelihood that an event may occur in one group in comparison to its likelihood ratio in another group. An odds ratio of 1 indicates that the condition or event under study is equally likely to occur in both groups. An odds ratio greater than 1 indicates that the condition or event is more likely to occur in the first group. And an odds ratio less than 1 indicates that the condition or event is less likely to occur in the first group. An odds ratio is calculated in the following way (probabilities of the event in each of the groups are p1 (first group) and p2 (second group)): (p1/(1-p1))/(p2/(1-p2).
Outward mobi l i ty rate (F igures 7 .12, 7 .13, 7 .16, 7 .17 , 7 .18 and 7 .21)
Outward mobility rate refers to students (enrolment or graduates) from a country of origin studying abroad (outwardly mobile students) as a percentage of the total number of students with the same country of origin.
Percent i le
The percentile X (with X ≥0 and ≤100) of a sampled variable is the value of the variable under which are X per cent of the observations in the sample. For example, a percentile 25 (denoted P25) of EUR 1 000 for an income variable means that 25 % of people in that sample earn less than EUR 1 000. Percentile 0 is the minimum, and P100 the maximum. The median is percentile 50 (Eurostat and Eurostudent 2009, p. 129).
Purchasing power par i ty (PPP)
A currency conversion rate which converts economic indicators expressed in a national currency into an artificial common currency that equalises the purchasing power of different national currencies. In other words, PPP eliminates the differences in price levels between countries in the process of conversion to an artificial common currency, called Purchasing Power Standard (PPS).
Purchasing power standard (PPS) (F igures 1 .12, 1 .14, 6 .6 and 6 .7)
The artificial common reference currency unit used in the European Union to express the volume of economic aggregates for the purpose of spatial comparisons in such a way that price level differences between countries are eliminated. Economic volume aggregates in PPS are obtained by dividing their original value in national currency units by the respective PPP (Purchasing power parity). PPS thus buys the same given volume of goods and services in all countries, whereas different amounts of national currency units are needed to buy this same volume of goods and services in individual countries, depending on the price level.
Students enro l led as par t - t imers (F igures 2 .21, 2 .22 and 2 .23)
Within the UOE data collection, the part-time/full-time classification is regarded as an attribute of student participation rather than as an attribute of the educational programmes or the provision of education in general. A part-time student is one who is enrolled in an education programme whose intended study load is less than 75 % of the normal full-time annual study load (UNESCO-UIS, OECD and Eurostat 2016, p. 27).
Tert iary educat ion (as def ined wi th in the ISCED c lass i f icat ion)

297
Tertiary education builds on secondary education, providing learning activities in specialised fields of education. It aims at learning at a high level of complexity and specialisation. Tertiary education includes what is commonly understood as academic education but also includes advanced vocational or professional education. It comprises ISCED levels 5, 6, 7 and 8, which are labelled as short-cycle tertiary education, Bachelor’s or equivalent level, Master’s or equivalent level, and doctoral or equivalent level, respectively. The content of programmes at the tertiary level is more complex and advanced than in lower ISCED levels.
Unemployment rate and unemployment rat io (F igures 6 .1 , 6 .2 , 6 .3 , 6 .4 and 6 .5)
An unemployed person is defined by Eurostat, according to the guidelines of the International Labour Organization, as:
• someone aged 15 to 74 (in Italy, Spain, the United Kingdom, Iceland, Norway: 16 to 74 years);
• without work during the reference week;
• available to start work within the next two weeks (or has already found a job to start within the next three months);
• actively having sought employment at some time during the last four weeks.
The unemployment rate is the number of people unemployed as a percentage of the labour force (Eurostat, 2018d).
The unemployment ratio is the number of people unemployed as a percentage of the total population.
Vert ica l mismatch (F igure 6 .12)
Refers to a situation in which the level of education or skills is less or more than the required level of education or skills (Cedefop 2010, p. 13). Regarding Figure 6.12, vertical mismatch refers to the situation in which people with tertiary qualifications have jobs not requiring this qualification level.
IV. Data sources BFUG data collection
This direct data collection based on two questionnaires (an Excel questionnaire and an on-line questionnaire) was aimed at collecting information for the present report. The reference year was the academic year 2016/17. The questionnaires primarily focused on qualitative information, and consisted of several parts covering the following areas:
• contextual data;
• learning and teaching;
• degree structures, qualifications, and Bologna tools;
• quality assurance;
• social dimension policies and measures;
• fees, support and portability;
• employability;
• internationalisation and mobility.

298
When filling in the questionnaires, the Bologna Follow-Up Group representatives were asked to consult all the relevant actors/stakeholders in their respective systems to ensure the highest degree of accuracy possible.
The information covered by the questionnaires was submitted by all signatory countries.
Bologna with Student Eyes 2018 (European Students’ Union) Reference year: 2018
Coverage : 38 EHEA count r ies , 43 Nat iona l Un ions o f Students
Descr ipt ion:
With different methodological approaches, ESU has been reviewing the implementation of the Bologna Process since 2003 with the Bologna with Student Eyes (BWSE) publication, launched prior to each ministerial conference.
BWSE2018 explores the perception of implementation amongst ESU's members operating in EHEA countries and seeks to bring attention to the students' priorities and recommendations for the future of the Bologna Process.
The 2018 edition of the publication highlights the need for further implementation, the slow development within the field of social dimension and embraces the importance of respect for the fundamental values of the Bologna Process.
Classification of Functions of Government (COFOG)
The Classification of Functions of Government (COFOG) was developed by the Organization for Economic Cooperation and Development (OECD) and is published by the United Nations Statistical Division (UNSD).
COFOG is regarded as the appropriate basis to examine the structure of government expenditure. It is a 3-level classification with 10 'divisions' at the top level, each of which is broken down to about 6 'groups' at the next level of detail, which in turn are subdivided into 'classes'. Divisions describe the broad objectives of government, while groups and classes both define the means by which these broad objectives are achieved (152).
EQAR/Eurydice survey to BFUG members
This data collection was undertaken through an on-line questionnaire. It aimed at collecting information to be presented in this report and used by EQAR on the legal frameworks allowing higher education institutions to choose a suitable EQAR-registered agency for external quality assurance processes. The reference year was the academic year 2016/17.
Questionnaires responses were submitted by national authorities in all signatory countries with the exception of Cyprus and the Holy See.
(152) For more details on the Classification of Functions of Government (COFOG), see: http://ec.europa.eu/eurostat/statistics-
explained/index.php/Glossary:Classification_of_the_functions_of_government_(COFOG) [Accessed 8 March 2018].

299
EU Labour Force Survey (EU-LFS)
The EU-LFS is the largest European household sample survey providing quarterly and annual results on labour participation of people aged 15 and over as well as on persons outside the labour force. It covers residents in private households. The EU-LFS is an important source of information about the situation and trends in the EU labour market.
The EU-LFS currently covers thirty-four countries (participating countries) providing Eurostat with data from national labour force surveys: the 28 Member States of the European Union, three EFTA countries (Iceland, Norway and Switzerland), and three candidate countries, i.e. the former Yugoslav Republic of Macedonia, Montenegro and Turkey. The EU-LFS is conducted by the national statistical institutes in accordance with Council Regulation (EEC) No. 577/98 of 9 March 1998 and the data are centrally processed by Eurostat.
Each quarter around 1.7 million interviews are conducted throughout the participating countries to obtain statistical information for some 100 variables. Due to the diversity of information and the large sample size the EU-LFS is also an important source for other European statistics like Education statistics or Regional statistics.
The main statistical objective of the EU-LFS is to divide the resident population of working age (15 years and above) into three mutually exclusive and exhaustive groups – persons employed, unemployed and economically inactive persons – and to provide descriptive and explanatory data on each of these categories. Respondents are assigned to one of these groups according to international classification on the basis of the information obtained through the survey questionnaire, which principally relates to their actual activity within a particular reference week. The EU-LFS defines the resident population as persons living in private households.
The EU-LFS data collection covers demographic background, labour status, employment characteristics of the main job, hours worked, employment characteristics of the second job, time-related underemployment, search for employment, education and training, previous work experience of persons not in employment, situation one year before the survey, main labour status and income (153).
Eurostudent VI survey Reference year: 2016/17
Coverage: 28 EHEA count r ies
Descr ipt ion:
EUROSTUDENT couples a central coordination approach with a strong network of national partners in each participant country. The EUROSTUDENT consortium provides national contributors with the EUROSTUDENT core questionnaire, as well as extensive instructions for conducting the field phase at the national level, data cleaning and weighting, calculation of indicators, and data delivery.
The national research teams are chosen and funded by the participating national ministries. The national research teams are responsible for implementing a national student survey, delivering the data to the EUROSTUDENT VI data team in accordance with EUROSTUDENT conventions, and providing national interpretations of the delivered data. The delivered data are checked in a series of
(153) For more details on the EU-LFS, see: http://ec.europa.eu/eurostat/statistics-explained/index.php/EU_labour_force_survey
[Accessed 8 March 2018].

300
feedback loops for accuracy and comparability and are validated for publication by the national research team.
EUROSTUDENT conventions are the instruments used to ensure the comparability and quality of the data collected. Since the 1st round of EUROSTUDENT, these conventions have been continuously developed further and are the result of productive discussions during several project meetings, intensive seminars, and workshops which were organised by the EUROSTUDENT consortium. They are documented in several handbooks which are provided to all EUROSTUDENT partners as well as the interested public.
The EUROSTUDENT core questionnaire details the items, responses, and instructions to be used in the national surveys. The questionnaire handbook provides in-depth explanations of the purpose of each question and instructions on adapting it, if necessary, to the national context.
The EUROSTUDENT VI questionnaire handbook is available on the EUROSTUDENT website.
The questionnaire handbook also provides guidelines for the preparation and execution of the survey at the national level. It provides information on the EUROSTUDENT standard target group, sampling guidelines, as well as information on the survey organisation and method.
Target group:
The EUROSTUDENT target group includes all students who are – at the time of observation (usually: semester) – enrolled in any national study programme regarded to be higher education in a country. Usually that corresponds to ISCED levels 5, 6, and 7.
This means all students should be included regardless of:
Nationality – National and foreign students should be included, as long as they are studying for a full degree in the country of observation (and are not only obtaining a limited number of credits, e.g. as an Erasmus student).
Full-time/part-time status – Full-time, part-time, and/or correspondence students should be included as long as the study programmes the students are enrolled in offer a minimum of physical face-to-face interaction in lectures/classes (not only exams).
Character of the higher education institution (HEI) or study programme – General as well as professional orientations of HEIs and study programmes should be included, as long as the programmes and institutions are considered to be higher education in the national context.
Legal character of the HEI – Public and private institutions should be included, as long as private institutions are considered to be a regular part of the higher education system in the national context.
Excluded from the EUROSTUDENT target group are:
Students on (temporary) leave, i.e. students who have officially or non-officially interrupted their studies at the time of observation for whatever reason.
Students on credit mobility, short-term mobile students (e.g. Erasmus students), i.e. students who are currently studying in the country of observation (incoming) or who have currently left the country of observation (outgoing) for a short time period (e.g. one or two semesters) with the purpose of gaining only a relatively small number of credits.
Students in ISCED 8 study programmes (PhD – and doctoral programmes).

301
Students in distance learning study programmes which do not offer any physical face-to-face lecture period at all, but are solely based on written/online interaction (apart from exams).
Students at very specialised HEIs, e.g. military or police academies, or HEIs directly affiliated with one company. This might also include programmes providing training only for public administration.
Students in programmes classified as ISCED (2011) levels 5 or 6 which are not regarded to be higher education in the national context. This could encompass, for example, further vocational training programmes for Master crafts(wo)men, or upper secondary schools or post-secondary programmes not regarded as higher education.
EU-Statistics on Income and Living Conditions (EU-SILC)
The EU statistics on income and living conditions, abbreviated as EU-SILC, is the reference source for comparative statistics on income distribution and social inclusion in the European Union (EU). It is used for policy monitoring within the 'Open method of coordination (OMC)'.
EU-SILC was launched in 2003 on the basis of a gentlemen's agreement between Eurostat and six Member States (Austria, Belgium, Denmark, Greece, Ireland and Luxembourg) and Norway. It was formally launched in 2004 in fifteen countries and expanded in 2005 to cover all of the then EU-25 Member States, together with Norway and Iceland. Bulgaria launched EU-SILC in 2006 while Romania, Switzerland and Turkey introduced the survey in 2007. EU-SILC provides two types of annual data:
• cross-sectional data pertaining to a given time or a certain time period with variables on income, poverty, social exclusion and other living conditions;
• longitudinal data pertaining to individual-level changes over time, observed periodically over a four-year period.
EU-SILC is a multi-purpose instrument which focuses mainly on income. Detailed data are collected on income components, mostly on personal income, although a few household income components are included. However, information on social exclusion, housing conditions, labour, education and health information is also obtained.
EU-SILC is based on the idea of a common 'framework' and no longer a common 'survey'. The common framework defines
• the harmonised lists of target primary (annual) and secondary (every four years or less frequently) variables to be transmitted to Eurostat;
• common guidelines and procedures;
• common concepts (household and income) and classifications aimed at maximising comparability of the information produced.
The reference population in EU-SILC includes all private households and their current members residing in the territory of the countries at the time of data collection. Persons living in collective households and in institutions are generally excluded from the target population. Some small parts of the national territory amounting to no more than 2 % of the national population and the national territories may be excluded from EU-SILC. All household members are surveyed, but only those aged 16 and more are interviewed (154).
(154) For more details on the EU-SILC, see: http://ec.europa.eu/eurostat/statistics-
explained/index.php/EU_statistics_on_income_and_living_conditions_(EU-SILC)_methodology_-

302
Trends 2018 (European University Association) Reference year: 2017
Coverage: 303 h igher educa t ion ins t i tu t ions f rom 43 h igher educa t ion sys tems
Descr ipt ion:
The Trends series has been published by the European University Association (EUA) and its predecessor organisation since the signing of the Bologna Declaration in 1999, with Trends 2018 presenting the eighth edition.
Trends provide an institutional perspective on higher education policy and institutional developments in Europe. Over the years, the focus of TRENDS has been changing. Whereas previous reports analysed mainly how the Bologna reforms have been implemented at the European universities, Trends 2015 discussed, amongst other themes, also developments in learning and teaching (L&T).
Trends 2018 research continues and further enhances this focus, and explores recent European policy developments and institutional strategies and practice on L&T.
UOE data collection on education and training systems (UOE)
The UNESCO Institute for Statistics (UIS-UNESCO), the Organisation for Economic Co-operation and Development (OECD) and the Statistical Office of the European Union (Eurostat) jointly provide internationally comparable data on key aspects of education and training systems through the annual UOE data collection.
For tertiary education the collection covers entrants (input), enrolments (stock) and graduates (output). Data on education expenditure and personnel is also provided. The data are broken down by educational level (using the ISCED classification), as well as by sex, age, sector and field of education. Separate tables provide information on mobile and foreign students and graduates by country of origin (as well as by level, sex and field of education).
Within the UOE data collection, Eurostat collects and disseminates data from the EU Member States, candidate countries and EFTA countries. The OECD collects data from other OECD countries (such as Australia, Canada, Japan and the United States), while the UIS-UNESCO collects data from other participating countries. The validated data are used by the three organisations (155).
V. Notes on figures Chapter 1
Figure 1.1: Number of students enrolled in tertiary education by ISCED level, 2014/15 Belgium: Data on 'Independent private institutions' not included, except at ISCED 6 and 7. Bosnia and Herzegovina, Bulgaria, Finland Greece, Liechtenstein, Lithuania, Montenegro, Romania and Serbia: ISCED 5: not applicable. Greece: ISCED levels are estimated. Estonia and the former Yugoslav Republic of Macedonia: ISCED 5: not applicable according to Eurostat database. Figure 1.2: Change in the total number of students enrolled in tertiary education between 2009/10 and 2011/12 and between 2012/13 and 2014/15
_introduction#Main_characteristics_of_EU-SILC [Accessed 8 March 2018]. (155) For more details on the UOE data collection, see: http://ec.europa.eu/eurostat/statistics-
explained/index.php/UNESCO_OECD_Eurostat_(UOE)_joint_data_collection_%E2%80%93_methodology#Introduction [Accessed 8 March 2018].

303
Belgium: 2013-2015 - Data on 'Independent private institutions' not included, except at ISCED 6 and 7. 2010-2012 - Data exclude the German-speaking Community. Data exclude students in private independent institutions. Bosnia and Herzegovina, Bulgaria, Finland, Greece, Liechtenstein, Lithuania, Montenegro, Romania and Serbia: 2013-2015 ISCED 5: not applicable. Cyprus: 2010-2012 - Due to 2 years compulsory military service for men aged 18-20, some of them are not in education. Greece: 2013-2015 ISCED levels are estimated. Liechtenstein and Romania: 2010-2012 - ISCED 5B: not applicable. Russia is not included in the analysis. Missing data for Bosnia and Herzegovina and Luxembourg for the 2009-2012 period. Figure 1.3: Enrolment rates in tertiary education for the 18-34 years old (% of the total population aged 18-34), 2008/09, 2011/12, 2014/15
Germany: 2009: exclude ISCED 6. Romania: 2010: Changes in classification at tertiary level. Missing data for Montenegro (2012) and Albania, Andorra, Bosnia and Herzegovina, Greece, Kazakhstan, Luxembourg and Montenegro (2009).
Figure 1.6: Percentage change in the total number of academic staff between 2000 and 2016 Data referring to 2000, 2005 and 2010 covers academic staff at ISCED 1997 levels 5-6. Data referring to 2016 covers academic staff at ISCED 2011 levels 5-8. All data covers all types of higher education institutions (i.e. public, private government dependent and private government independent). Belgium, the Czech Republic, Estonia, Germany, Italy, Latvia, the former Yugoslav Republic of Macedonia, Norway, Poland, Slovakia, Slovenia, Spain, Sweden and the United Kingdom are represented by 2015 data.
Figure 1.7: Academic staff by age groups (%), 2015 Data refers to academic staff at ISCED 2011 levels 5-8. It covers all types of higher education institutions (i.e. public, private government dependent and private government independent).
Greece and Turkey are represented by 2014 data.
Figure 1.8: Female academic staff (%), 2000 and 2016 Data refers to academic staff at ISCED 2011 levels 5-8. Belgium, Croatia, Denmark, Estonia, France, Germany, Italy, Latvia, Luxembourg, the former Yugoslav Republic of Macedonia, Norway, Poland, Portugal, Serbia, Slovakia, Slovenia, Spain, Sweden, Switzerland and the United Kingdom are represented by 2015 data. Greece and Turkey are represented by 2014 data.
Figure 1.9: Annual public expenditure on tertiary education as a % of GDP, total with R&D and total without R&D, 2014
Belgium: Expenditure in independent private institutions is not included Countries not in the analysis: Andorra, Azerbaijan, Belarus, Bosnia and Herzegovina, Croatia, Greece, Liechtenstein, the former Yugoslav Republic of Macedonia and Montenegro.
Figure 1.10: Annual public expenditure on tertiary education as a % of total public expenditure, 2008, 2011, 2014 EHEA is the EHEA median. Countries are sorted by the share of annual public expenditure on tertiary education in 2014. Countries not in the analysis: Andorra, Azerbaijan, Belarus, Bosnia and Herzegovina, Croatia, Finland, Greece, Holy See, Kazakhstan, Liechtenstein, the former Yugoslav Republic of Macedonia, Moldova, Montenegro, Russia, Serbia, Turkey, and Ukraine. Missing data for Albania and Luxembourg in 2011 and 2008. The numbers from 2015 report for 2011-2012 do not match the numbers for 2011-2012 in this report.
Figure 1.11: Yearly changes in real public expenditure on tertiary education between year 2011 and year 2015 (price index 2010=100) Countries not in the analysis – Bosnia and Herzegovina, Holy See, Liechtenstein, the former Yugoslav Republic of Macedonia, Moldova, Montenegro, Russia and Turkey. Missing data for Iceland (2011-2013), Albania, Andorra, Armenia, Azerbaijan, Georgia, Kazakhstan, Serbia, Ukraine (2014-2015).
Figure 1.12: Annual public and private expenditure on public and private tertiary education institutions, per full-time equivalent student in PPS, 2008, 2011, 2014 Austria: 2008: Payments from private entities other than households to public educational institutions are not available. Belgium: Expenditure exclude independent private institutions for all years and the German-speaking Community for years 2008 and 2011. 2014 - Expenditure in independent private institutions is not included Croatia: 2008: Capital expenditure from private educational institutions is not available. 2008: Expenditure for compensation of personnel in private educational institutions is not available. 2008 and 2011: Payments from international agencies and other foreign sources to independent private educational institutions are not available. 2008: Expenditure for independent private

304
educational institutions is not available. Denmark: Expenditure of post-secondary non-tertiary level of education is partially included in tertiary level of education. R&D expenditure is not available. 2011: Payments from other private entities to educational institutions are not available. Poland: Payments from other private entities to educational institutions are not available. 2008: Payments from international agencies and other foreign sources to educational institutions are not available. Portugal: Expenditure at local level of government is not available. 2008 and 2011: Expenditure of post-secondary non-tertiary level of education is partially included in upper secondary and tertiary level of education. 2008: Imputed retirement expenditure is not available; Payments from international agencies and other foreign sources to educational institutions are not available. Slovakia: Expenditure of ISCED 5B is not included. 2008: Expenditure for independent private educational institutions is not available. Payments from international agencies and other foreign sources to private educational institutions are not available. Slovenia: 2008: Capital expenditure from private educational institutions is not available. Spain: 2008: Expenditure for ancillary services is not available. United Kingdom: 2008-2011: Adjustment of educational expenditure of financial year that is running from 1 April to 31 March, to the calendar year. Countries not in the analysis – Albania, Andorra, Armenia, Azerbaijan, Bosnia and Herzegovina, Belarus, Georgia, Greece, Kazakhstan, Liechtenstein, the former Yugoslav Republic of Macedonia, Moldova, Montenegro, Russia, Switzerland and Ukraine. Missing data for Denmark (2014), Hungary, Ireland, Luxembourg, Serbia (2011), and Hungary, Ireland, Luxembourg, Turkey, Romania and Serbia (2008).
Figure 1.13: Annual public expenditure on public and private tertiary education institutions per full-time equivalent student in euro, 2014 Countries not included in the analysis – Albania, Andorra, Armenia, Azerbaijan, Belarus, Bosnia and Herzegovina, Croatia, Russia, Georgia, Greece, Kazakhstan, Liechtenstein, the former Yugoslav Republic of Macedonia, Moldova, Montenegro and Ukraine.
Figure 1.14: Annual public and private expenditure on public and private education institutions on tertiary education per full-time equivalent student in PPS relative to the GDP per inhabitant in PPS, 2008, 2011 and 2014 Austria: 2008: Payments from private entities other than households to public educational institutions are not available. Belgium: Expenditure exclude independent private institutions for all years and the German-speaking Community for years 2008 and 2011. Croatia: 2008: Capital expenditure from private educational institutions is not available. 2008: Expenditure for compensation of personnel in private educational institutions is not available. 2008 and 2011: Payments from international agencies and other foreign sources to independent private educational institutions are not available. 2008: Expenditure for independent private educational institutions is not available. Denmark: Expenditure of post-secondary non-tertiary level of education is partially included in tertiary level of education. R&D expenditure is not available. 2011: Payments from other private entities to educational institutions are not available. Iceland: 2008: Expenditure for ancillary services, payments from other private entities to educational institutions and payments from international agencies and other foreign sources to educational institutions are not available. 2008: Capital expenditure from private educational institutions is not available. 2011: R&D expenditure is not available. Norway: 2008: Payments from other private entities to educational institutions are not available. Payments from international agencies and other foreign sources to educational institutions are not available. Poland: Payments from other private entities to educational institutions are not available. 2008: Payments from international agencies and other foreign sources to educational institutions are not available. Portugal: Expenditure at local level of government is not available. 2008 and 2011: Expenditure of post-secondary non-tertiary level of education is partially included in upper secondary and tertiary level of education. 2008: Imputed retirement expenditure is not available; Payments from international agencies and other foreign sources to educational institutions are not available. Slovakia: Expenditure of ISCED 5B is not included. 2008: Expenditure for independent private educational institutions is not available. Payments from international agencies and other foreign sources to private educational institutions are not available. Slovenia: 2008: Capital expenditure from private educational institutions is not available. Spain: 2008: Expenditure for ancillary services is not available. United Kingdom: 2008-2011: Adjustment of educational expenditure of financial year, that is running from 1st of April to 31 March, to the calendar year. Countries missing in the analysis: for 2008 – Albania, Andorra, Armenia, Azerbaijan, Belarus, Bosnia and Herzegovina, Georgia, Greece, Hungary, Ireland, Kazakhstan, Liechtenstein, Luxembourg, the former Yugoslav Republic of Macedonia, Moldova, Montenegro, Romania, Russia, Serbia, Switzerland, Turkey and Ukraine; for 2011 – Albania, Andorra, Armenia, Azerbaijan, Belarus, Bosnia and Herzegovina, Georgia, Greece, Hungary, Ireland, Kazakhstan, Liechtenstein, Luxembourg, the former Yugoslav Republic of Macedonia, Moldova, Montenegro, Russia, Serbia, Switzerland, Turkey and Ukraine; for 2014 – Albania, Andorra, Armenia, Azerbaijan, Belarus, Bosnia and Herzegovina, Denmark, Georgia, Greece, Kazakhstan, Liechtenstein, the former Yugoslav Republic of Macedonia, Moldova, Montenegro, Russia, Switzerland, Turkey and Ukraine.

305
Chapter 2
Figure 2.1: Expectations towards higher education institutions specified in national learning and teaching strategies (% of institutions reporting that there is a national strategy in place), 2017 Data source: Trends 2018 (European University Association) Question: Q.8.1: What does this national strategy imply? Higher education institutions are expected… Coverage: The question was only answered by those institutions that reported the presence of a national learning and teaching strategy, or a national higher education strategy, which includes learning and teaching among other matters (234 institutions out of 301 institutions that replied to the question).
Figure 2.2: Elements included in institutional learning and teaching strategies (% of institutions reporting that there is an institutional strategy in place), 2017 Data source: Trends 2018 (European University Association) Question: Q.9.1: What elements does your institutional L&T strategy/policy address or include? Coverage: The question was only answered by those institutions that indicated the presence of an institutional strategy on teaching and learning, including respondents referring to strategies at faculty/department level (260 institutions out of 303 institutions that replied to the question).
Figure 2.8: Impact of the learning outcomes approach in higher education institutions (% of institutions), 2017 Data source: Trends 2018 (European University Association) Question: Q.22.1: What effect on the institution has the introduction of learning outcomes had so far? Coverage: The figure was calculated on a basis of replies from 264 higher education institutions. It shows the percentage of institutions that answered 'Yes, this is the case' or 'Yes, to some extent' to specific items in this question. Answers 'No impact' and 'Don’t know/No opinion' are not shown in the figure.
Figure 2.11: Training for higher education teaching staff in developing learning outcomes (% of institutions), 2017 Data source: Trends 2018 (European University Association) Question: Q.39: Please indicate how teachers receive training in developing learning outcomes. Coverage: The figure was calculated on a basis of replies from 285 higher education institutions.
Figure 2.14: Use of ECTS for credit accumulation and transfer by all higher education institutions, first- and second-cycle programmes, students' perspective, 2016/17 Data source: ESU data collection (Bologna with Student Eyes 2018 (European Students’ Union)) Question: 2.2. In first and second cycle programmes, in your country, ECTS is used as a ... ‘credit accumulation system within higher education institutions’; ‘credit transfer system for student learning outcomes acquired in another institution in the country’, ‘credit transfer system for periods of study abroad’.
Figure 2.15: Elements used for the calculation of ECTS points in public higher education institutions, students' perspective, 2016/17 Data source: ESU data collection (Bologna with Student Eyes 2018 (European Students’ Union)) Question: 2.1. Which elements are used in the calculation of ECTS points in your country?
Figure 2.17: Provision of part-time programmes or other alternative study forms by higher education institutions, 2016/17 Albania: According to the new Law on Higher Education (October 2015), higher education institutions can offer only 'full-time' study programmes. However, they can offer 'extended form of study', but only for short-cycle study programmes (post-secondary), Professional Master and Executive Master. According to the higher education law, extended form of study means that the duration of studies does not exceed the double normal time of the respective study programme. At present, Albania is in a transitory phase: higher education institutions are reorganising their study programmes as foreseen in the abovementioned law, while students enrolled before 2015 will finish their studies with the same status they entered in. Thus some phasing out students with part-time status could be found among the majority of full-time students.
Figure 2.21: Median of country percentages of students enrolled as part-timers in tertiary education, by age, 2014/15 Data source: Eurostat, [specific extraction from Eurobase: file 'ENRL3_AGE&P'] and additional collection for the other EHEA countries. Albania, Azerbaijan, Kazakhstan, Moldova and Ukraine: data are missing for ages 45+. Belgium: Data on 'Independent private institutions' not included, except at ISCED 6 and 7. Greece: ISCED levels are estimated.

306
Coverage: Albania, Andorra, Azerbaijan, Belgium, Bosnia and Herzegovina, Bulgaria, Croatia, Denmark, Estonia, Finland, Germany, Hungary, Kazakhstan, Iceland, Ireland, Latvia, Liechtenstein, Lithuania, Luxembourg, the former Yugoslav Republic of Macedonia, Malta, Moldova, the Netherlands, Norway, Poland, Portugal, Romania, Russia, Slovakia, Slovenia, Spain, Sweden, Switzerland, Ukraine, the United Kingdom.
Figure 2.22: Students enrolled as part-timers in tertiary education, by country and by age (%), 2014/15 Data source: Eurostat, [specific extraction from Eurobase: file 'ENRL3_AGE&P'] and additional collection for the other EHEA countries. Albania: Missing values for ISCED 5. Austria, Greece, Italy, Serbia and Turkey: Not applicable. Belgium: Data on 'Independent private institutions' not included, except at ISCED 6 and 7. Cyprus, Czech Republic and France: Not available. Kazakhstan: Data cover ISCED level 6.
Figure 2.23: 25, 50 and 75 percentile of countries according to the percentage of students enrolled as part-timers in tertiary education, by year, 2005-2015 Data source: Eurostat, [educ_enrl1ad] and [educ_uoe_enrt01] and additional collection for the other EHEA countries. Belgium: Data on 'Independent private institutions' not included, except at ISCED 6 and 7. Coverage: Albania, Andorra, Armenia, Azerbaijan, Belarus, Belgium, Bulgaria, Croatia, Cyprus, the Czech Republic, Denmark, Estonia, Finland, Germany, Hungary, Iceland, Ireland, Kazakhstan, Latvia, Liechtenstein, Lithuania, the former Yugoslav Republic of Macedonia, Malta, Moldova, the Netherlands, Norway, Poland, Romania, Russia, Slovakia, Slovenia, Spain, Sweden, Switzerland, Ukraine, the United Kingdom.
Figure 2.24: Students qualifying themselves as full-timers (%), 2016/17 Data source: EUROSTUDENT VI, C.5. Countries in which no formal part-time status exists: Austria, Denmark, France, Georgia, Serbia and Turkey. Countries which did not include part-time students in sample: Albania and Latvia. No data: Italy. EUROSTUDENT question(s): 1.5 What is your current formal status as a student? Deviations from EUROSTUDENT conventions: the Czech Republic, Italy, Romania and Switzerland. Deviations from EUROSTUDENT standard target group: Albania, Germany, Ireland, Italy, Latvia and Serbia. Comments from national research teams on EUROSTUDENT data on part-time students: Albania: According to the new Law on Higher Education (October 2015), higher education institutions can offer only 'full-time' study programmes. However, they can offer 'extended form of study', but only for short-cycle study programmes (post-secondary), Professional Master and Executive Master. According to the higher education law, extended form of study means that the duration of studies does not exceed the double normal time of the respective study programme. At present, Albania is in a transitory phase: higher education institutions are reorganising their study programmes as foreseen in the abovementioned law, while students enrolled before 2015 will finish their studies with the same status they entered in. Thus some phasing out students with part-time status could be found among the majority of full-time students. Czech Republic: We assume part-time students as those who are studying during the weekend etc. Full-time students go to school on daily basis. Slovenia: Part-time students, unlike full-time students in 1st and 2nd cycle studies, have to pay (higher) tuition fees. Regarding the part-time studies, Article 37 of Higher Education Act states, that '…the organisation and schedule of lectures, seminars and practical exercises may be adapted to the possibilities of students (e.g. part-time studies)'. This shall be done in the manner and under the procedure laid down by the statute. Full-time study in Slovenia is study with a full load, i.e. 60 ECTS per year. It can be payable or unpayable. In case of 'part-time stud' the organization and schedule of lectures, seminars and exercises may be adapted to the possibilities of students – however, 'part-time study' still leads to 60 ECTS per year and is payable. Students, irrespective of whether the study is provided full-time or part-time, have the right to health care and other benefits and rights (e.g. food, transport, grants) in accordance with special regulations provided they are not in full-time employment or registered job seekers. Sweden: The students course registrations defines if the student is a full-time student or not. The study pace is stated as a percentage of average credits per week throughout the course period. 1,5 ECTS credits per week = 100 % (and 30 credits per semester). A course comprising of 15 credits over a given term corresponds to a study pace of 50 % on this specific course. If the students are registered to more than one course during the same period, the total course registration credits for the period will define if the student is a full-time student or not. In Sweden distance studies and on-campus studies are also registered in the study administrative system. Of the students that only studied distance courses in the academic year 2015/2016, more than 71 percent studied free-standing courses. For students studying on campus the relationship was the reverse, 76 percent were programme students. Turkey: In Turkey there are 'İkinci Öğretim Programı' in Turkish in higher education ('Evening Education Programme' in English) within the framework of the law 3843. According to this Law, Evening Education is defined as the formal education when the normal formal education (daytime education) has been completed in higher education institutions. There is no difference between Formal Education and Evening Education in terms of period of study, study guidelines for associate’s degree and bachelor’s degree levels, attendance, number of mid-term examinations, contribution to the success grade, implementation and make-up examination conditions, and other issues regarding education and training [these fall under the category 'other'].

307
Figure 2.25: Part-time students according to their study intensity (self-reported) as % of students in different study intensity groups, 2016/17 Data source: EUROSTUDENT VI, C.5. Countries in which no formal part-time status exists: Austria, Denmark, France, Georgia, Serbia and Turkey. Countries which did not include part-time students in sample: Albania and Latvia. No data: Italy. EUROSTUDENT question(s): 1.5 What is your current formal status as a student? Deviations from EUROSTUDENT conventions: the Czech Republic, Italy, Romania and Switzerland. Deviations from EUROSTUDENT standard target group: Albania, Germany, Ireland, Italy, Latvia and Serbia.
Figure 2.33: Trends in higher education institutions regarding digital learning, last three years (% of institutions), 2017 Data source: Trends 2018 (European University Association) Question: Q.25: What are the main trends at your institution regarding digital learning in the last three years? Coverage: The figure was calculated on a basis of replies from 293 higher education institutions. The figure shows the percentage of institutions that answered 'Yes, this is the case' or 'Yes, to some extent' to specific items in this question. Answers 'No' and 'Information unavailable' are not shown in the figure.
Figure 2.34: Formal or most common requirements for holding higher education positions with teaching responsibilities (% of institutions), 2017 Data source: Trends 2018 (European University Association) Question: Q.34: In your institution, what formal or most common requirements are needed for holding one of the positions below with teaching responsibilities? Coverage: The figure was calculated on a basis of replies from 303 higher education institutions.
Figure 2.36: Measures to promote and develop teaching skills of academics (% of institutions), 2017 Data source: Trends 2018 (European University Association) Question: Q.38: Has there been a systematic effort to establish the following at your institution? Coverage: The figure was calculated on a basis of replies from 287 higher education institutions. The figure shows the percentage of institutions that answered 'Yes' to specific items in this question. Answers 'No, but we are planning to do this', 'No'' and 'Information unavailable' are not shown in the figure.
Figure 2.37: Means of assessment/enhancement of teaching in place throughout the institution (% of institutions), 2017 Data source: Trends 2018 (European University Association) Question: Q.36: Which of the following means and criteria are used for the assessment of teaching? Coverage: The figure was calculated on a basis of replies from 289 higher education institutions. The figure shows the percentage of institutions that answered 'Yes, throughout the institution' to specific items in this question. Answers 'Yes, in some parts of the institution', 'No, but we are planning to do it' and 'No, we do not use this' are not shown in the figure.
Figure 2.38: Students' satisfied with quality of teaching in their current study programme (%), 2016/17 Data source: EUROSTUDENT VI, J.29. No data: Austria, Germany, Italy, Switzerland and Turkey. EUROSTUDENT Question(s): 1.9 How satisfied are you regarding the following aspects of your current (main) study programme? Deviations from EUROSTUDENT standard target group: Albania, Germany, Ireland, Italy, Latvia and Serbia.
Figure 2.39: Students agreeing with the statement that their teachers inspire them (%), 2016/17 Data source: EUROSTUDENT VI, J.15. No data: Austria, France, Germany, Italy, Switzerland and Turkey. EUROSTUDENT Question(s): 1.13 To what extent do you agree with the following statements? - My teachers inspire me. Deviations from EUROSTUDENT standard target group: Albania, Germany, Ireland, Italy, Latvia and Serbia.

308
Chapter 3
Figure 3.1: Distribution of students enrolled in ISCED 5-8 programmes, 2014/15 Data source: Eurostat, [educ_uoe_enrt02] and additional collection for the other EHEA countries. Belgium: Data on 'Independent private institutions' not included, except at ISCED 6 and 7. Bosnia and Herzegovina, Bulgaria, Finland Greece, Liechtenstein, Lithuania, Montenegro, Romania and Serbia: ISCED 5: not applicable. Estonia and the former Yugoslav Republic of Macedonia: ISCED 5: not applicable according to Eurostat database. Greece: ISCED levels are estimated.
Figure 3.2: Share of first cycle-programmes with a workload of 180, 210, 240 or another number of ECTS credits, 2016/17 Coverage: No data for the United Kingdom (England, Wales and Northern Ireland).
Figure 3.3: Share of second-cycle programmes with a workload of 60-75, 90, 120 or another number of ECTS credits, 2016/17 Coverage: No data for Greece and the United Kingdom (England, Wales and Northern Ireland).
Chapter 4 Figure 4.5: European Student Unions perception of student participation in external quality assurance, 2016/17 Data source: ESU data collection (Bologna with Student Eyes 2018 (European Students’ Union)) Questions: 3.2. Is there a requirement that students are involved in external quality assurance review teams?
Figure 4.11: Scorecard indicator n°7: Level of openness to cross border quality assurance of EQAR registered agencies, 2016/17
Data source: EQAR/Eurydice survey to BFUG members, 2017.
Chapter 5 Figure 5.1: Relationship between the educational background of first-cycle new entrants (ISCED 6) and the educational attainment of their parents' cohort (population aged 45-64), 2016/17 Data source: Eurostat, EU-LFS (Population by educational attainment level, sex and age: edat_lfse_03). Luxembourg: Data not reliable for proportions of the population aged 45-64 with different educational attainment levels.
Figure 5.2: Percentage of delayed transition students among students with/without higher education background, 2016/17 Data source: EUROSTUDENT VI, B.4. No data: Malta. EUROSTUDENT Question(s): 2.3 How long after leaving the #regular school system for the first time did you enter higher education for the first time? Deviations from EUROSTUDENT survey conventions: Austria: Only national students. France: Delay calculated using the moment of graduation from high school and the first entering into an higher education institution. Germany: Delay calculated based on month and year of obtaining #matura or foreign equivalent. Hungary: Delay calculated using additional questions about the high school type, year of maturation and starting year of higher education studies. Switzerland: Information from national register of students (Swiss University Information System); duration of transition into higher education is approximated. Deviations from EUROSTUDENT standard target group: Albania, Germany, Ireland, Italy, Latvia and Serbia.
Figure 5.3: Percentage of women among new entrants in tertiary education in 2004/05 and 2014/15 Data source: Eurostat, [educ_entr2tl] and [educ_uoe_ent01] and additional collection for the other EHEA countries. Albania and Estonia: 2015 - ISCED 5 not available Belgium, Ireland and Poland: 2005 - ISCED 6 not included. Belgium and Malta: 2015 - ISCED 8 not available Bosnia and Herzegovina, Bulgaria, Finland, Greece, Liechtenstein, Lithuania, Montenegro, Romania and Serbia: 2015 - ISCED 5: not applicable.

309
Croatia: 2005 – not significant data. Finland: 2005 - ISCED 5B not applicable. Finland and the Netherlands: 2005 ISCED 6 not included. France: 2005 – missing data. 2015 - ISCED 5, 6 and 7 are not available Germany: 2005 ISCED 6 not included. Italy: 2005: ISCED 5B not significant. Luxembourg, Latvia and Portugal: 2005 – missing data. The Netherlands: 2005 - ISCED 5B not applicable.
Figure 5.4: Percentage of women among new entrants in tertiary education by level of education, 2014/15 Data source: Eurostat, [educ_uoe_ent01] and additional collection for the other EHEA countries. Albania and Estonia: ISCED 5 not available Belgium and Malta: ISCED 8 not available Bosnia and Herzegovina, Bulgaria, Finland, Greece, Liechtenstein, Lithuania, Montenegro, Romania and Serbia: ISCED 5: not applicable. France: ISCED 5, 6 and 7 are not available
Figure 5.5: Median percentage of women among enrolled students in Bologna structures by field of education and level of Bologna structure (first and second cycle, ISCED 6 and 7), 2014/15 Data source: Eurostat, [educ_uoe_enrt03] and additional collection for the other EHEA countries. Country coverage ISCED 6: Education: Albania, Austria, Azerbaijan, Belgium, Bosnia and Herzegovina, Bulgaria, Croatia, Cyprus, the Czech Republic, Denmark, Estonia, Finland, France, Georgia, Germany, Hungary, Iceland, Italy, Kazakhstan, Latvia, Lithuania, Luxembourg, the former Yugoslav Republic of Macedonia, Malta, Moldova, the Netherlands, Norway, Poland, Portugal, Romania, Russia, Serbia, Slovakia, Slovenia, Sweden, Turkey, the United Kingdom, Spain, Switzerland, Ukraine. Arts and humanities: Albania, Austria, Azerbaijan, Belgium, Bosnia and Herzegovina, Bulgaria, Croatia, Cyprus, the Czech Republic, Denmark, Estonia, Finland, France, Germany, Hungary, Iceland, Italy, Kazakhstan, Latvia, Lithuania, Luxembourg, the former Yugoslav Republic of Macedonia, Malta, Moldova, Georgia, the Netherlands, Norway, Poland, Portugal, Romania, Russia, Serbia, Slovenia, Slovakia, Spain, Sweden, Switzerland, Turkey, Ukraine, the United Kingdom. Social sciences, journalism and information: Albania, Austria, Azerbaijan, Belgium, Bosnia and Herzegovina, Bulgaria, Croatia, Cyprus, the Czech Republic, Denmark, Estonia, Finland, France, Georgia, Germany, Hungary, Iceland, Italy, Latvia, Lithuania, Luxembourg, the former Yugoslav Republic of Macedonia, Malta Moldova, the Netherlands, Norway, Poland, Portugal, Romania, Russia, Serbia, Slovakia, Slovenia, Sweden, Spain, Switzerland, Turkey, Ukraine, the United Kingdom. Business, administration and law: Albania, Austria, Azerbaijan, Belgium, Bosnia and Herzegovina, Bulgaria, Croatia, Cyprus, the Czech Republic, Denmark, Estonia, Spain, Finland, France, Georgia, Germany, Hungary, Iceland, Italy, Kazakhstan, Latvia, Lithuania, Luxembourg, the former Yugoslav Republic of Macedonia, Malta, Moldova, the Netherlands, Norway, Poland, Portugal, Romania, Russia, Slovakia, Slovenia, Serbia, Sweden, Switzerland, Turkey, the United Kingdom, Ukraine. Natural sciences, mathematics and statistics: Albania, Austria, Azerbaijan, Belgium, Bosnia and Herzegovina, Bulgaria, Croatia, Cyprus, the Czech Republic, Denmark, Estonia, Finland, France, Georgia, Germany, Hungary, Iceland, Italy, Kazakhstan, Latvia, Lithuania, Luxembourg, the former Yugoslav Republic of Macedonia, Malta, Moldova, the Netherlands, Norway, Poland, Portugal, Romania, Russia, Serbia, Slovakia, Slovenia, Spain, Sweden, Switzerland, Turkey, Ukraine, the United Kingdom. Information and communication technologies: Albania, Austria, Azerbaijan, Belgium, Bosnia and Herzegovina, Bulgaria, Croatia, Cyprus, the Czech Republic, Denmark, Estonia, Finland, France, Georgia, Germany, Hungary, Iceland, Italy, Latvia, Lithuania, Luxembourg, the former Yugoslav Republic of Macedonia, Malta, Moldova, the Netherlands, Norway, Poland, Portugal, Romania, Russia, Serbia, Slovakia, Slovenia, Spain, Sweden, Switzerland, Turkey, Ukraine, the United Kingdom. Engineering, manufacturing and construction: Albania, Austria, Azerbaijan, Belgium, Bosnia and Herzegovina, Bulgaria, Croatia, Cyprus, the Czech Republic, Denmark, Estonia, Finland, France, Georgia, Germany, Hungary, Iceland, Italy, Kazakhstan, Latvia, Lithuania, Luxembourg, the former Yugoslav Republic of Macedonia, Malta, Moldova, the Netherlands, Norway, Poland, Portugal, Romania, Russia, Serbia, Slovakia, Slovenia, Spain, Sweden, Switzerland, Turkey, Ukraine, the United Kingdom. Agriculture, forestry, fisheries and veterinary: Albania, Austria, Azerbaijan, Belgium, Bosnia and Herzegovina, Bulgaria, Croatia, Cyprus, the Czech Republic, Georgia, Germany, Denmark, Estonia, Finland, France, Hungary, Kazakhstan, Iceland, Italy, Latvia, Lithuania, the former Yugoslav Republic of Macedonia, Malta, Moldova, the Netherlands, Norway, Poland, Portugal, Romania, Russia, Serbia, Slovakia, Slovenia, Spain, Sweden, Switzerland, Turkey, Ukraine, the United Kingdom. Health and welfare: Albania, Austria, Azerbaijan, Belgium, Bosnia and Herzegovina, Bulgaria, Croatia, Cyprus, the Czech Republic, Denmark, Estonia, Finland, France, Germany, Georgia, Hungary, Iceland, Italy, Kazakhstan, Latvia, Lithuania, Luxembourg, the former Yugoslav Republic of Macedonia, Malta, Moldova, the Netherlands, Norway, Poland, Portugal, Romania, Russia, Serbia, Slovakia, Slovenia, Spain, Sweden, Switzerland, Turkey, Ukraine, the United Kingdom. Services: Albania, Austria, Azerbaijan, Belgium, Bosnia and Herzegovina, Bulgaria, Croatia, Cyprus, the Czech Republic, Denmark, Estonia, Finland, France, Georgia, Germany, Hungary, Iceland, Kazakhstan, Latvia, Lithuania, the former Yugoslav Republic of Macedonia, Malta, Moldova, the Netherlands, Norway, Poland, Portugal, Romania, Russia, Serbia, Slovakia, Slovenia, Spain, Sweden, Switzerland, Turkey, the United Kingdom. Country coverage ISCED 7: Education: Albania, Austria, Azerbaijan, Belgium, Bosnia and Herzegovina, Bulgaria, Croatia, Cyprus, the Czech Republic, Denmark, Estonia, Finland, France, Georgia, Germany, Hungary, Iceland, Italy, Kazakhstan, Latvia, Lithuania, Luxembourg, the former Yugoslav Republic of Macedonia, Malta, Moldova the Netherlands, Norway, Poland, Portugal, Romania, Russia, Serbia,

310
Slovakia, Slovenia, Spain, Sweden, Switzerland, Turkey, Ukraine, the United Kingdom. Arts and humanities: Albania, Austria, Azerbaijan, Belgium, Bosnia and Herzegovina, Bulgaria, Croatia, Cyprus, the Czech Republic, Denmark, Estonia, Finland, France, Germany, Georgia, Hungary, Iceland, Italy, Kazakhstan, Lithuania, Luxembourg, Latvia, the former Yugoslav Republic of Macedonia, Malta, Moldova the Netherlands, Norway, Poland, Portugal, Romania, Russia, Serbia, Slovakia, Slovenia, Spain, Sweden, Switzerland, Turkey, Ukraine, the United Kingdom. Social sciences, journalism and information: Austria, Albania, Azerbaijan, Belgium, Bosnia and Herzegovina, Bulgaria, Croatia, Cyprus, the Czech Republic, Denmark, Estonia, Finland, France, Georgia, Germany, Hungary, Iceland, Italy, Latvia, Lithuania, Luxembourg, the former Yugoslav Republic of Macedonia, Malta, Moldova, the Netherlands, Norway, Poland, Portugal, Romania, Russia, Serbia, Slovenia, Slovakia, Spain, Sweden, Switzerland, Turkey, Ukraine, the United Kingdom. Business, administration and law: Albania, Austria, Azerbaijan, Belgium, Bosnia and Herzegovina, Bulgaria, Croatia, Cyprus, the Czech Republic, Denmark, Estonia, Finland, France, Georgia, Germany, Hungary, Iceland, Italy, Kazakhstan, Latvia, Lithuania, Luxembourg, the former Yugoslav Republic of Macedonia, Malta, Moldova the Netherlands, Norway, Poland, Portugal, Romania, Russia, Serbia, Slovakia, Slovenia, Spain, Sweden, Switzerland, Turkey, Ukraine, the United Kingdom. Natural sciences, mathematics and statistics: Albania, Austria, Azerbaijan, Belgium, Bosnia and Herzegovina, Bulgaria, Croatia, Cyprus, the Czech Republic, Denmark, Estonia, Finland, France, Georgia, Germany, Hungary, Iceland, Italy, Kazakhstan, Latvia, Lithuania, Luxembourg, the former Yugoslav Republic of Macedonia, Malta, Moldova, the Netherlands, Norway, Poland, Portugal, Romania, Russia, Serbia, Slovakia, Slovenia, Spain, Sweden, Switzerland, Turkey, Ukraine, the United Kingdom. Information and communication technologies: Albania, Austria, Azerbaijan, Belgium, Bosnia and Herzegovina, Bulgaria, Croatia, Cyprus, the Czech Republic, Denmark, Estonia, Finland, France, Georgia, Germany, Hungary, Iceland, Italy, Latvia, Lithuania, Luxembourg, the former Yugoslav Republic of Macedonia, Malta, the Netherlands, Norway, Poland, Portugal, Romania, Russia, Serbia, Slovakia, Slovenia, Spain, Sweden, Switzerland, Turkey, Ukraine, the United Kingdom. Engineering, manufacturing and construction: Albania, Austria, Azerbaijan, Belgium, Bosnia and Herzegovina, Bulgaria, Croatia, Cyprus, the Czech Republic, Denmark, Estonia, Finland, France, Georgia, Germany, Hungary, Iceland, Italy, Kazakhstan, Latvia, Lithuania, Luxembourg, the former Yugoslav Republic of Macedonia, Malta Moldova, the Netherlands, Norway, Poland, Portugal, Romania, Russia, Serbia, Slovakia, Slovenia, Spain, Sweden, Switzerland, Turkey, the United Kingdom, Ukraine. Agriculture, forestry, fisheries and veterinary: Albania, Austria, Azerbaijan, Belgium, Bosnia and Herzegovina, Bulgaria, Croatia, Cyprus, the Czech Republic, Denmark, Estonia, Finland, France, Georgia, Germany, Hungary, Iceland, Italy Kazakhstan, Latvia,, Lithuania, Luxembourg, the former Yugoslav Republic of Macedonia, Moldova, the Netherlands, Norway, Poland, Portugal, Romania, Russia, Serbia, Slovakia, Slovenia, Spain, Sweden, Switzerland, Turkey, Ukraine, the United Kingdom. Health and welfare: Albania, Austria, Azerbaijan, Belgium, Bosnia and Herzegovina, Bulgaria, Croatia, Cyprus, the Czech Republic, Denmark, Estonia, Finland, France, Georgia, Germany, Hungary, Iceland, Italy, Latvia, Lithuania, Luxembourg, Kazakhstan, the former Yugoslav Republic of Macedonia, Malta, Moldova, the Netherlands, Norway, Poland, Portugal, Romania, Russia, Serbia, Slovakia, Slovenia, Sweden, Spain, Switzerland, Turkey, Ukraine, the United Kingdom. Services: Austria, Albania, Azerbaijan, Belgium, Bulgaria, Bosnia and Herzegovina, Croatia, Cyprus, the Czech Republic, Denmark, Estonia, Finland, France Georgia,, Germany, Hungary, Iceland, Kazakhstan, Latvia, Lithuania, the former Yugoslav Republic of Macedonia, Malta, Moldova, the Netherlands, Norway, Poland, Portugal, Romania, Russia, Serbia, Slovakia, Slovenia, Spain, Sweden, Switzerland, Ukraine, the United Kingdom.
Figure 5.6: Composition of students by migration background (%), 2016/17 Data source: EUROSTUDENT VI, A.4. No data: Italy and Romania. International students: Germany. EUROSTUDENT Question(s): 5.3 In which country were you and your parents (or those who raised you) born? 2.0 Do you have a standard entrance qualification or foreign equivalent? 2.2 [only students without Matura] Where did you last attend the regular school system Notes: Sum of categories may deviate from 100 due to rounding. Deviations from EUROSTUDENT survey conventions: Germany: no international students included in sample. Deviations from EUROSTUDENT standard target group: Albania, Germany, Ireland, Italy, Latvia and Serbia.
Figure 5.7: Participation rates in tertiary education among persons aged 18-29, foreign-born, native-born and total population (%), 2016 Data source: Eurostat, EU-LFS. Bulgaria, Estonia, Lithuania, Malta, Romania and Slovakia: Not reliable and not publishable for foreign born. Croatia, Latvia, the former Yugoslav Republic of Macedonia, Poland and Slovenia: Not reliable for foreign born.
Figure 5.8: Percentage of students enrolled in tertiary education, 30 or more years old, in 2011/12 and 2014/15 Data source: Eurostat, [educ_enrl1tl] and [educ_uoe_enrt02] and additional collection for the other EHEA countries. Belgium: 2013-2015 - Data on 'Independent private institutions' not included, except at ISCED 6 and 7. 2010-2012 - Data exclude the German-speaking Community. Data exclude students in private independent institutions. Bosnia and Herzegovina, Bulgaria, Finland, Greece, Liechtenstein, Lithuania, Montenegro, Romania and Serbia: 2013-2015 ISCED 5: not applicable. Cyprus: 2010-2012 - Due to 2 years compulsory military service for men aged 18-20, some of them are not in education. Greece: 2013-2015 ISCED levels are estimated. Liechtenstein and Romania: 2010-2012 - ISCED 5B: not applicable.

311
Figure 5.9: Percentage of delayed transition students among respondents 30 or more years old, 2016/17 and 2013/14 Data source: EUROSTUDENT VI, B.4. No data: Malta. Too few cases: Albania. EUROSTUDENT Question(s): 2.3 How long after leaving the #regular school system for the first time did you enter higher education for the first time? Deviations from EUROSTUDENT survey conventions: Austria: Only national students. France: Delay calculated using the moment of graduation from high school and the first entering into an higher education institution. Germany: Delay calculated based on month and year of obtaining #matura or foreign equivalent. Hungary: Delay calculated using additional questions about the high school type, year of maturation and starting year of higher education studies. Switzerland: Information from national register of students (Swiss University Information System); duration of transition into higher education is approximated. Deviations from EUROSTUDENT standard target group: Albania, Germany, Ireland, Italy, Latvia and Serbia.
Figure 5.16: Percentage of students entering higher education through standard and alternative routes, 2016/17 Data source: EUROSTUDENT VI, B.5 & B.9. No data: Finland, Italy and Turkey. Too few cases: Slovakia (for delayed and alternative access routes). EUROSTUDENT Question(s): 2.0 Do you have a #general precondition for HE access [named country-specific] or foreign equivalent? 2.1. [only students with country specific standard qualification] Did you obtain your #general precondition or foreign equivalent in direct relations (within 6 months) of leaving the #regular school [adapted nationally] system for the first time? 2.2 [only students without #general precondition for HE access] Where did you last attend the regular school system? Deviations from EUROSTUDENT conventions: Austria: All international students coded to have standard entry qualification, as the information was not asked. Estonia: Entry into higher education without #Matura not possible in Estonia, so response option ‘no, I do not have a #Matura’ was not offered. Hungary: Question 2.0 was asked in the English questionnaire only used by international students and not in the Hungarian version because regulations in Hungary only allow to apply for higher education studies for those having a matura. Questions 2.1 (Did you obtain your #Matura or foreign equivalent in direct relation (within 6 month) of leaving #regular school system for the first time?) & 2.2 (Where did you last attend the #regular school system?) were slightly altered in the Hungarian version as in most cases, finishing the high school in Hungary concurs with obtaining a matura. However, this combination of altered questions is unreliable when identifying students with a delayed transition or alternative access route. Thus, additional questions from the Hungarian questionnaire about the high school type, year of maturation and starting year of higher education studies were also employed during data cleaning process for calculating EUROSTUDENT-compatible indicators. Switzerland: Information from national register of students (Swiss University Information System). Deviations from EUROSTUDENT standard target group: Albania, Germany, Ireland, Italy, Latvia and Serbia.
Figure 5.18: Percentage of first-cycle students who pay fees, 2016/17 Data source: EUROSTUDENT VI, F.171. No data: Italy. EUROSTUDENT Question: What are your average expenses for the following items during the current lecture period? Notes: Fees include tuition fees, registration fees, examination fees, and administrative fees. Social welfare contributions to HEIs/student associations, learning materials, field trips should be excluded, but may have influenced students' perception. Deviations from EUROSTUDENT standard target group: Albania, Germany, Ireland, Italy, Latvia and Serbia.
Figure 5.20: Most common amount of yearly fees for full-time home students as a percentage of GDP per capita, 2016/17 Data source: Authors' calculation based on Student Fee and Support Systems in Europe 2016/17 (European Commission/ EACEA/Eurydice, 2016a), the BFUG questionnaire and World Bank. NY.GDP.PCAP.CN, Data from database: World Development Indicators, Last Updated: 09/18/2017 No data: Andorra, Bulgaria, Croatia, Cyprus (second cycle), Estonia, France, Germany, Greece (second cycle), Holy See, Latvia, Liechtenstein, Lithuania, the former Yugoslav Republic of Macedonia, Moldova, Poland, Russia, Slovakia, Slovenia and Turkey Notes: Fees are understood as all fees charged – whether for tuition, enrolment, certification or other administrative costs, except contributions to student organisations. There are no fees: in the first cycle - Cyprus, Greece, Malta and the United Kingdom – Scotland; in the first and second cycles: Denmark, Finland, Norway and Sweden
Figure 5.21: Support to students enrolled at tertiary education level as a percentage of public expenditure on tertiary education, 2008, 2011, 2014 Data source: Eurostat, [educ_fiaid] and [educ_uoe_fina01]. Belgium: 2011: Expenditure exclude independent private institutions and the German-speaking Community. 2014 - Expenditure in independent private institutions is not included. Bulgaria, Czech Republic and Estonia: 2008: Student loans from public sources are not applicable. Croatia: 2008: Public transfers to private entities other than households are not available. 2011: Public transfers to private

312
entities at local level of government are not available. Cyprus: 2008 - 2011: Including financial aid to students studying abroad. Denmark: Expenditure of post-secondary non-tertiary level of education is partially included in tertiary level of education. Hungary: 2008 - Student loans from public sources are not available. Iceland: Expenditure for ancillary services is not available. Ireland: Expenditure for ancillary services is not available. Portugal: 2008 - Expenditure at local level of government is not available. Imputed retirement expenditure is not available. Expenditure of post-secondary non-tertiary level of education is partially included in tertiary level of education. 2008 – 2011 – Student loans from public sources are not available. 2011 - Expenditure at local level of government is not available, except for tertiary institutions. Romania: 2008: data not available. The data published in the 2015 Bologna Implementation Report has been removed from the Eurostat database. Slovakia: 2008-2011 - Expenditure at ISC 5B is included under upper secondary level of education. Spain: 2008: Expenditure for ancillary services is not available. United Kingdom: 2011: data is different from the data in the 2015 Bologna Implementation Report due to the revision of the UK data for the reference year 2011.
Figure 5.25: Percentage of fee-payers among recipients and non-recipients of public support, 2016/17 Data source: EUROSTUDENT VI, G.44. No data: Finland. EUROSTUDENT Questions: 3.3 What is the average monthly amount at your disposal from the following sources during the current lecture period? 3.4 What are your average expenses for the following items during the current lecture period? Notes: Public support includes grants, loans, and scholarships from national public sources. Fees include tuition fees, registration fees, examination fees, and administrative fees. Social welfare contributions to HEIs/student associations, learning materials, field trips should be excluded, but may have influenced students' perception. Deviations from EUROSTUDENT standard target group: Albania, Germany, Ireland, Italy, Latvia and Serbia.
Figure 5.27: Percentage of persons with tertiary education, by age group, 2013 and 2016 Data source: Eurostat, [edat_lfs_9903] and additional collection for the other EHEA countries.
Figure 5.28: Completion rates in ISCED 6 (first-cycle) programmes (%), 2014 Data source: OECD, Education at a Glance 2016, Table A9.2: Distribution of full-time students who entered a given educational level, by theoretical duration (N) and theoretical duration plus three years (N+3) (2014). Belgium (Flemish Community): Data for 'Had not graduated and were not in education' refer to students who were not enrolled in either bachelor's or master's degrees or equivalent programmes. They could still be enrolled at other levels or in adult education. Czech Republic: N+3 corresponds to N+2. France: Data provided using a longitudinal survey and excludes international students. Netherlands: In the Netherlands, a few students enter bachelor's or equivalent programmes and graduate from a long first degree within the theoretical duration of the original bachelor's or equivalent programme. They represent les than 0.001% of total new entrants and are included with 'Graduated from a long first degree' by N+3.
Figure 5.29: Attainment by gender: odds ratios of men over women to attain higher education, 2006-2016 Data source: Eurostat, [edat_lfs_9903] and additional collection for the other EHEA countries. Country coverage: Austria, Azerbaijan, Belgium, Bulgaria, Croatia, Cyprus, the Czech Republic, Denmark, Estonia, Finland, France, Georgia, Germany, Greece, Hungary, Iceland, Ireland, Italy, Latvia, Lithuania, Luxembourg, the former Yugoslav Republic of Macedonia, Malta, Moldova, Montenegro, the Netherlands, Norway, Poland, Portugal, Romania, Serbia, Slovenia, Slovakia, Spain, Sweden, Switzerland, Turkey and the United Kingdom.
Figure 5.30: Percentage of female graduates in tertiary education programmes by level of education, 2014/15 Data source: Calculated based on Eurostat, [educ_uoe_grad03].
Figure 5.31: Tertiary education attainment of 25 to 34-year-olds by country of birth: odds ratio of native-born over foreign-born population to complete tertiary education, 2013 and 2016 Data source: Eurostat, EU-LFS and additional collection for the other EHEA countries. Bulgaria, Romania and Slovakia: Not reliable and not publishable. Georgia: Reference year is 2014 instead of 2016. Lithuania and Poland: Not reliable.
Figure 5.32: Adults (30-64) who attained their tertiary education degree during adulthood (aged 30-64) as a percentage of all adults (30-64), 2013 and 2016 Data source: Eurostat, EU-LFS and additional collection for the other EHEA countries. Georgia: Reference year is 2014 instead of 2016.
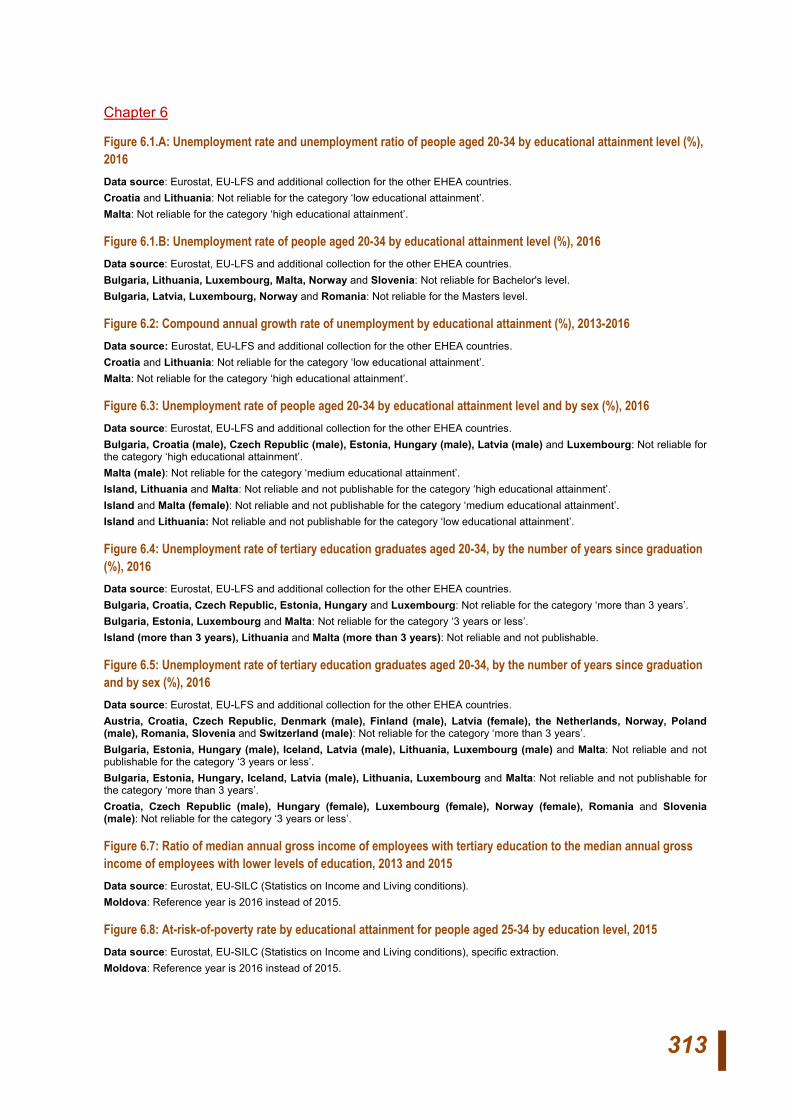
313
Chapter 6
Figure 6.1.A: Unemployment rate and unemployment ratio of people aged 20-34 by educational attainment level (%), 2016 Data source: Eurostat, EU-LFS and additional collection for the other EHEA countries. Croatia and Lithuania: Not reliable for the category ‘low educational attainment’. Malta: Not reliable for the category ‘high educational attainment’.
Figure 6.1.B: Unemployment rate of people aged 20-34 by educational attainment level (%), 2016 Data source: Eurostat, EU-LFS and additional collection for the other EHEA countries. Bulgaria, Lithuania, Luxembourg, Malta, Norway and Slovenia: Not reliable for Bachelor's level. Bulgaria, Latvia, Luxembourg, Norway and Romania: Not reliable for the Masters level.
Figure 6.2: Compound annual growth rate of unemployment by educational attainment (%), 2013-2016 Data source: Eurostat, EU-LFS and additional collection for the other EHEA countries. Croatia and Lithuania: Not reliable for the category ‘low educational attainment’. Malta: Not reliable for the category ‘high educational attainment’.
Figure 6.3: Unemployment rate of people aged 20-34 by educational attainment level and by sex (%), 2016 Data source: Eurostat, EU-LFS and additional collection for the other EHEA countries. Bulgaria, Croatia (male), Czech Republic (male), Estonia, Hungary (male), Latvia (male) and Luxembourg: Not reliable for the category ‘high educational attainment’. Malta (male): Not reliable for the category ‘medium educational attainment’. Island, Lithuania and Malta: Not reliable and not publishable for the category ‘high educational attainment’. Island and Malta (female): Not reliable and not publishable for the category ‘medium educational attainment’. Island and Lithuania: Not reliable and not publishable for the category ‘low educational attainment’.
Figure 6.4: Unemployment rate of tertiary education graduates aged 20-34, by the number of years since graduation (%), 2016 Data source: Eurostat, EU-LFS and additional collection for the other EHEA countries. Bulgaria, Croatia, Czech Republic, Estonia, Hungary and Luxembourg: Not reliable for the category ‘more than 3 years’. Bulgaria, Estonia, Luxembourg and Malta: Not reliable for the category ‘3 years or less’. Island (more than 3 years), Lithuania and Malta (more than 3 years): Not reliable and not publishable.
Figure 6.5: Unemployment rate of tertiary education graduates aged 20-34, by the number of years since graduation and by sex (%), 2016 Data source: Eurostat, EU-LFS and additional collection for the other EHEA countries. Austria, Croatia, Czech Republic, Denmark (male), Finland (male), Latvia (female), the Netherlands, Norway, Poland (male), Romania, Slovenia and Switzerland (male): Not reliable for the category ‘more than 3 years’. Bulgaria, Estonia, Hungary (male), Iceland, Latvia (male), Lithuania, Luxembourg (male) and Malta: Not reliable and not publishable for the category ‘3 years or less’. Bulgaria, Estonia, Hungary, Iceland, Latvia (male), Lithuania, Luxembourg and Malta: Not reliable and not publishable for the category ‘more than 3 years’. Croatia, Czech Republic (male), Hungary (female), Luxembourg (female), Norway (female), Romania and Slovenia (male): Not reliable for the category ‘3 years or less’.
Figure 6.7: Ratio of median annual gross income of employees with tertiary education to the median annual gross income of employees with lower levels of education, 2013 and 2015 Data source: Eurostat, EU-SILC (Statistics on Income and Living conditions). Moldova: Reference year is 2016 instead of 2015.
Figure 6.8: At-risk-of-poverty rate by educational attainment for people aged 25-34 by education level, 2015 Data source: Eurostat, EU-SILC (Statistics on Income and Living conditions), specific extraction. Moldova: Reference year is 2016 instead of 2015.

314
Figure 6.11: Distribution of people with tertiary education (ISCED 5-6) aged 25-34 and employed in ISCO 1 or 2 (legislators, senior officials, managers and professionals), in ISCO 3 (technicians and associate professionals) and in ISCO 4-9, by sex (%) Data source: Eurostat, EU-LFS and additional collection for the other EHEA countries. Croatia (female): Not reliable for the category ‘ISCO 3’. Luxembourg (female): Not reliable for the category ‘ISCO 4-9’.
Figure 6.12: Percentage of people aged 25-34 with tertiary education (ISCED 5-6) who are vertically mismatched (in ISCO 4-9) by field of study, 2016 Data source: Eurostat, EU-LFS and additional collection for the other EHEA countries. Country coverage: Education: Austria, Belgium, Croatia, Cyprus, the Czech Republic, Denmark, Germany, Greece, Hungary, Italy, the former Yugoslav Republic of Macedonia, the Netherlands, Norway, Poland, Portugal, Slovakia, Slovenia, Sweden, Spain, Switzerland, Turkey, the United Kingdom. Arts and humanities: Austria, Belgium, Croatia, Cyprus, the Czech Republic, Germany, Denmark, Finland, France, Greece, Hungary, Iceland, Ireland, Italy, the former Yugoslav Republic of Macedonia, the Netherlands, Norway, Poland, Portugal, Romania, Slovakia, Slovenia, Spain, Sweden, Switzerland, Turkey, the United Kingdom. Social sciences, journalism and information: Austria, Belgium, Bulgaria, Croatia, Cyprus, the Czech Republic, Denmark, Estonia, Finland, France, Germany, Greece, Hungary, Italy, Latvia, Lithuania, the former Yugoslav Republic of Macedonia, Malta, the Netherlands, Norway, Poland, Portugal, Romania, Slovakia, Slovenia, Spain, Sweden, Switzerland, Turkey, the United Kingdom. Business, administration and law: Austria, Belgium, Bulgaria, Croatia, Cyprus, Czech Republic, Denmark, Estonia, Germany, Finland, France, Greece, Hungary, Ireland, Iceland, Italy, Latvia, Lithuania, Luxembourg, the former Yugoslav Republic of Macedonia, Malta, the Netherlands, Norway, Poland, Portugal, Romania, Slovakia, Slovenia, Spain, Sweden, Switzerland, Turkey, the United Kingdom. Natural sciences, mathematics and statistics: Belgium, Cyprus, Czech Republic, Germany, Greece, Italy, the former Yugoslav Republic of Macedonia, the Netherlands, Norway, Poland, Romania, Slovakia, Slovenia, Spain, Sweden, Switzerland, Turkey, the United Kingdom. Information and Communication Technologies: Belgium, Cyprus, Germany, France, Greece, Hungary, Ireland, Italy, the former Yugoslav Republic of Macedonia, Poland, Spain, Sweden, Switzerland, Turkey, the United Kingdom. Engineering, manufacturing and construction: Austria, Belgium, Bulgaria, Switzerland, Cyprus, Czech Republic, Germany, Denmark, Estonia, Spain, Finland, France, Greece, Croatia, Hungary, Ireland, Italy, Lithuania, Latvia, the former Yugoslav Republic of Macedonia, the Netherlands, Norway, Poland, Portugal, Romania, Sweden, Slovenia, Slovakia, Turkey, the United Kingdom. Agriculture, forestry, fisheries and veterinary: Austria, Belgium, Czech Republic, France, Germany, Greece, Hungary, Italy, the former Yugoslav Republic of Macedonia, the Netherlands, Poland, Slovakia, Slovenia, Spain, Sweden, Switzerland, Turkey, the United Kingdom. Health and welfare: Belgium, Cyprus, Czech Republic, Denmark, Finland, France, Germany, Greece, Hungary, Ireland, Italy, the former Yugoslav Republic of Macedonia, the Netherlands, Norway, Poland, Portugal, Slovakia, Slovenia, Spain, Sweden, Switzerland, Turkey, the United Kingdom. Services: Austria, Belgium, Croatia, Cyprus, Czech Republic, Denmark, Estonia, Finland, France, Germany, Greece, Hungary, Ireland, Italy, Latvia, the former Yugoslav Republic of Macedonia, the Netherlands, Norway, Poland, Portugal, Romania, Slovakia, Slovenia, Spain, Sweden, Switzerland, Turkey, the United Kingdom.
Figure 6.13: Students’ self-assessment of their chances on the national and international labour market based on the competences gained during studies (for all students and/or different focus groups), 2017 Data source: EUROSTUDENT VI, J.3 No data: Germany, Italy, Switzerland, Turkey EUROSTUDENT Question(s): 1.12 Regarding the competences gained during your current study programme: How well do you think you are prepared for the labour market after graduating? Notes: Students responded on a five-point scale ranging from 'very well' to 'very poorly'. Values shown are aggregated across categories 1 + 2 (very) well
Chapter 7 EHEA countries use multiple definitions to identify and report mobile students. Before 2013 the UOE data collection defined mobile students as foreign students (non-citizens of the country in which they study) who have crossed a national border and moved to another country to study. Starting from 2013 reference year the UOE definition is based on the country of origin understood as the country where the upper secondary diploma was awarded (or the best national estimate) and not the country of citizenship. Twenty countries in the EHEA still use the foreign citizenship/nationality as criteria to define mobile students. For the inward mobility to the EHEA from countries outside the EHEA information from all declaring countries in the world was considered. For the outward mobility from the EHEA towards countries outside the EHEA only the questionnaires from Australia, Canada, the United States, Japan and New Zealand were considered due to issues with data availability and quality.

315
Figure 7.10: Incoming degree mobility rate – tertiary education mobile students from the EHEA and from outside the EHEA studying in the country as a percentage of the total number of students enrolled, by country of destination, 2014/15 Albania, Andorra, Armenia, Azerbaijan, Bosnia and Herzegovina, Bulgaria, the Czech Republic, Greece, France, Hungary, Italy, Kazakhstan, Luxembourg, Malta, Moldova, Montenegro, Russia Serbia, Slovakia, Turkey and Ukraine: The criteria used to define mobile students is the citizenship. Germany and Spain: ISCED 8 is not included in the tertiary mobile students. Greece, Liechtenstein, Montenegro and Turkey: Missing data. Norway: Change in the definition of mobile student since UOE 2014 (2012/13).
Figure 7.11: Number of incoming degree tertiary education mobile students from inside and outside the EHEA, by country of destination, 2014/15 Albania, Andorra, Armenia, Azerbaijan, Bulgaria, Bosnia and Herzegovina, the Czech Republic, France, Greece, Hungary, Italy, Kazakhstan, Luxembourg, Malta, Moldova, Montenegro, Russia, Serbia, Slovakia, Turkey and Ukraine: The criteria used to define mobile students is the citizenship. Germany and Spain: ISCED 8 is not included in the tertiary mobile students. Greece Liechtenstein, Montenegro and Turkey: Missing data. Norway: Change in the definition of mobile student since UOE 2014 (2012/13).
Figure 7.12: Number of outward degree tertiary education students inside and outside the EHEA by country of origin, 2014/15 Albania, Andorra, Armenia, Azerbaijan, Bosnia and Herzegovina, Bulgaria, the Czech Republic, France, Greece, Hungary, Italy, Kazakhstan, Luxembourg, Malta, Moldova, Montenegro, Russia, Serbia, Slovakia, Turkey and Ukraine: The criteria used to define mobile students is the citizenship. Germany and Spain: ISCED 8 is not included in the tertiary mobile students. Greece, Liechtenstein, Montenegro and Turkey: Missing data.
Figure 7.13: Outward degree mobility rate – mobile tertiary education graduates within the EHEA as a percentage of all graduates of the same country of origin, by country of origin, 2014/15 Albania, Andorra, Armenia, Azerbaijan, Bosnia and Herzegovina, Bulgaria, the Czech Republic, France, Greece, Hungary, Italy, Kazakhstan, Luxembourg, Malta, Moldova, Montenegro, Russia, Serbia, Slovakia, Turkey and Ukraine: The criteria used to define mobile graduated students is the citizenship. Andorra, France, Greece, Iceland, Slovakia and Georgia: Missing data. Poland: ISCED 8 is not included in the graduated students. Spain: Only including value from ISCED 6 and 7.
Figure 7.14: Share of degree mobile graduates from abroad by education level, sex and country of origin, 2014/15 Albania, Andorra, Armenia, Azerbaijan, Bosnia and Herzegovina, Bulgaria, the Czech Republic, France, Greece, Hungary, Italy, Kazakhstan, Luxembourg, Malta, Moldova, Montenegro, Russia, Serbia, Slovakia, Turkey and Ukraine: The criteria used to define mobile graduated students is the citizenship. Albania Andorra, Armenia, Azerbaijan, Bosnia and Herzegovina, Belarus, France, Georgia, Greece, Iceland and Kazakhstan, Liechtenstein, Moldova, Montenegro, Russia and Ukraine: Missing data. Poland: ISCED 8 is not included in the graduated students. Spain: Only including value from ISCED 6 and 7.
Figure 7.15: Share of tertiary students enrolled abroad (degree mobility), by country of origin, 2014/15 Albania, Andorra, Armenia, Azerbaijan, Bosnia and Herzegovina, Bulgaria, the Czech Republic, France, Greece, Hungary, Italy, Kazakhstan, Luxembourg, Malta, Moldova, Montenegro, Russia, Serbia, Slovakia, Turkey and Ukraine: The criteria used to define mobile students is the citizenship. Germany and Spain: ISCED 8 is not included in the tertiary mobile students. Greece, Liechtenstein, Montenegro and Turkey: Missing data.
Figure 7.16: Outward degree mobility rate – tertiary education students studying abroad outside the EHEA as a percentage of the total number of students of the same country of origin, 2014/15 Albania, Andorra, Armenia, Azerbaijan, Bosnia and Herzegovina, Bulgaria, the Czech Republic, France, Greece, Hungary, Italy, Kazakhstan, Luxembourg, Malta, Moldova, Montenegro, Russia, Serbia, Slovakia, Turkey and Ukraine: The criteria used to define mobile students is the citizenship. Germany and Spain: ISCED 8 is not included in the tertiary mobile students. Greece, Liechtenstein, Montenegro and Turkey: Missing data.

316
Figure 7.17: Mobility balance: Incoming/outgoing tertiary students ratio within the EHEA, 2014/15 Albania, Andorra, Armenia, Azerbaijan, Bosnia and Herzegovina, Bulgaria, the Czech Republic, France, Greece, Italy, Kazakhstan, Luxembourg, Hungary, Malta, Moldova, Montenegro, Russia, Serbia, Slovakia, Turkey and Ukraine: The criteria used to define mobile students is the citizenship. Germany and Spain: ISCED 8 is not included in the tertiary mobile students. Greece, Liechtenstein, Montenegro and Turkey: Missing data. Norway: Change in the definition of mobile student since UOE 2014 (2012/13).
Figure 7.18: Mobility balance: Incoming/outgoing tertiary students ratio within and outside the EHEA, 2014/15 Albania, Andorra, Armenia, Azerbaijan, Bosnia and Herzegovina, Bulgaria, the Czech Republic, France, Greece, Hungary, Italy, Kazakhstan, Luxembourg, Malta, Moldova, Montenegro, Russia, Serbia, Slovakia, Turkey and Ukraine: The criteria used to define mobile students is the citizenship. Germany and Spain: ISCED 8 is not included in the tertiary mobile students. Greece, Liechtenstein, Montenegro and Turkey: Missing data.
Figure 7.19: Balance as a measure of the attractiveness of the education system of the country at tertiary education level (mobility flows within and outside EHEA), 2014/15 Albania, Andorra, Armenia, Azerbaijan, Bosnia and Herzegovina, Bulgaria, the Czech Republic, France, Greece, Hungary, Italy, Kazakhstan, Luxembourg, Malta, Moldova, Montenegro, Russia, Serbia, Slovakia, Turkey and Ukraine: The criteria used to define mobile students is the citizenship. Germany and Spain: ISCED 8 is not included in the tertiary mobile students. Greece, Liechtenstein, Montenegro and Turkey: Missing data.
Figure 7.20: Student mobility flows: Top three countries of origin (inward) in %, 2014/15 Albania, Andorra, Armenia, Azerbaijan, Bosnia and Herzegovina, Bulgaria, the Czech Republic, France, Greece, Hungary, Kazakhstan, Italy, Luxembourg, Malta, Serbia, Slovakia, Turkey, Moldova, Montenegro, Russia and Ukraine: The criteria used to define mobile students is the citizenship. Germany and Spain: ISCED 8 is not included in the tertiary mobile students.
Figure 7.21: Student mobility flows: Top three countries of destination (outward) in %, 2014/15 Albania, Andorra, Armenia, Azerbaijan, Bosnia and Herzegovina, Bulgaria, the Czech Republic, France, Greece, Hungary, Italy, Kazakhstan, Luxembourg, Malta, Moldova, Montenegro, Russia, Serbia, Slovakia, Turkey and Ukraine: The criteria used to define mobile students is the citizenship. Germany and Spain: ISCED 8 is not included in the tertiary mobile students.
Figure 7.22: Outward mobility versus diversity of destination countries (mobility flows within and outside EHEA) 2014/15, Albania, Andorra, Armenia, Azerbaijan, Bosnia and Herzegovina, Bulgaria, the Czech Republic, France, Greece, Hungary, Italy, Kazakhstan, Luxembourg, Malta, Moldova, Montenegro, Russia, Serbia, Slovakia, Turkey and Ukraine: The criteria used to define mobile students is the citizenship. Germany and Spain: ISCED 8 is not included in the tertiary mobile students.
Figure 7.23: Recognition of credits gained during (most recent) enrolment abroad – Share of students who have been enrolled abroad (in %), 2016/17 Data source: EUROSTUDENT VI, I.7. No data: Germany: Partial recognition/no credits gained/no plans for recognition, Switzerland: no plans for recognition. EUROSTUDENT Question: 4.4. [only students who have been enrolled abroad] Were the credits (ECTS, certificates) you gained for your enrolment abroad recognised by your home institution? Deviations from EUROSTUDENT survey conventions: Austria, France, Germany, Ireland and Switzerland: Response option 'did not plan to get credits recognised' not offered. Germany: Fewer response options offered Deviations from EUROSTUDENT standard target group: Albania, Germany, Ireland, Italy, Latvia and Serbia. Germany: fewer response options: no distinction between 'full' and 'partial' recognition possible.

317
REFERENCES ACA (Academic Cooperation Association), 2013. Mapping “mobility windows” in European higher education. Examples from selected countries –MOWIN. [pdf] Available at: http://eacea.ec.europa.eu/LLp/project_reports/documents/erasmus/ESMO/eras_esmo_517968_fr.pdf [Accessed 14 March 2018].
Andersson, R. and Olsson, A-K., 1999. Fields of Education and Training. Manual. Luxembourg: Eurostat.
BMWFW (Bundesministerium für Wissenschaft, Forschung und Wirtschaft) [Austrian Federal Ministry for Science, Research and Economy], 2017. Nationale Strategie zur sozialen Dimension in der Hochschulbildung [National Strategies in the Social Dimension of Higher Education]. [pdf] Available at: http://www.sozialerhebung.at/sozdim/strategiepapier/Strategie_2017.pdf [Accessed 13 November 2017].
Bourner, T. and Millican, J., 2011. Student-community engagement and graduate employability. Widening Participation and Lifelong Learning, 13(2), pp. 68-85.
Cedefop, 2010. The skill matching challenge. Analysing skill mismatch and policy implications. Luxembourg: Publications Office of the European Union.
Cedefop. 2016. Briefing Note. Qualifications Frameworks in Europe. [pdf] Available at http://www.cedefop.europa.eu/en/publications-and-resources/publications/9117 [Accessed 22 November 2017].
Council of the Magna Charta Observatory. 25 July 2016. Statement concerning universities in Turkey. [Online] Available at http://www.magna-charta.org/publications-and-documents/observatory-publications/statement-concerning-universities-in-turkey [Accessed 20 February 2018].
DZHW (German Centre for Higher Education Research and Science Studies) ed., 2018. Social and Economic Conditions of Student Life in Europe. EUROSTUDENT VI 2016-2018 Synopsis of Indicators. [pdf] https://khrono.no/files/2018/03/06/EUROSTUDENT_VI_Synopsis_of_Indicators%20(2).pdf [Accessed 22 February 2018].
EHEA Pathfinder Group on Automatic Recognition, 2014. Report by the EHEA Pathfinder Group on Automatic Recognition. To present to Ministers of the European Area of Higher Education for the Bologna Ministerial Conference, 14-15 May 2015, Yerevan, Armenia. [pdf] Available at: http://media.ehea.info/file/2015_Yerevan/72/3/EHEA_Pathfinder_Group_on_Automatic_Recognition_January_2015_613723.pdf [Accessed 9 July 2016].
ESU (European Students’ Union), 2015. Overview on Student-Centred Learning in Higher Education in Europe. Research Study. [pdf] Available at: https://www.esu-online.org/wp-content/uploads/2016/07/Overview-on-Student-Centred-Learning-in-Higher-Education-in-Europe.pdf [Accessed 29 November 2017].
EUA (European University Association), 2007. Trends V: Universities shaping the European Higher Education Area. [pdf] Available at http://www.eua.be/Libraries/publications-homepage-list/eua_trends_v_for_web1b9364ca84b96a879ce5ff00009465c7.pdf?sfvrsn=0 [Accessed 28 February 2018].
318
EUA, 2010. Salzburg II Recommendations. European universities' achievements since 2005 in implementing the Salzburg Principles. [pdf] Available at: http://www.eua.be/Libraries/publications-homepage-list/Salzburg_II_Recommendations [Accessed 26 March 2018].
European Commission, 2011. Towards a European Framework for research Careers. [pdf] Available at: https://era.gv.at/object/document/1509/attach/Towards_a_European_Framework_for_Research_Careers_final.pdf [Accessed 11 July 2016].
European Commission, 2012. Europeans and their Languages. Special Eurobarometer 386. Report. [pdf] Available at: http://ec.europa.eu/commfrontoffice/publicopinion/archives/ebs/ebs_386_en.pdf [Accessed 11 October 2017].
European Commission, 2013. Communication from the Commission to the European Parliament, the Council, the European Economic and Social Committee and the Committee of the Regions. European higher education in the world. COM(2013) 499 final.
European Commission. 2014. Report to the European Commission on new modes of learning and teaching in higher education. Luxembourg: Publications Office of the European Union.
European Commission, 2015. ECTS Users' Guide. Luxembourg: Publications Office of the European Union. Luxembourg: Publications Office of the European Union.
European Commission, 2017a. Study to support the revision of the diploma supplement and analyse the feasibility of its digitalisation at European level. Luxembourg: Publications Office of the European Union.
European Commission, 2017b. Communication from the Commission to the European Parliament, the Council, the European Economic and Social Committee and the Committee of the Regions: Strengthening. European Identity through Education and Culture. COM(2017) 673 final.
European Commission, 2017c. Erasmus + Annual report 2016. Enriching lives, opening minds. Luxembourg: Publications Office of the European Union.
European Commission, 2017d. Progress report on a Learning Mobility Benchmark. COM (2017)148 final.
European Commission/EACEA/Eurydice, 2011. Modernisation of Higher Education in Europe: Funding and Social Dimension. Eurydice Report. Luxembourg: Publications Office of the European Union.
European Commission/EACEA/Eurydice, 2014. Modernisation of Higher Education in Europe: Access, Retention and Employability. Eurydice Report. Luxembourg: Publications Office of the European Union.
European Commission/EACEA/Eurydice/Cedefop, 2014. Tackling Early Leaving from Education and Training in Europe: Strategies, Policies and Measures. Eurydice and Cedefop Report. Luxembourg: Publications Office of the European Union.
European Commission/EACEA/Eurydice, 2015. The European Higher Education Area in 2015: Bologna Process Implementation Report. Luxembourg: Publications Office of the European Union.
European Commission/EACEA/Eurydice, 2016a. National Student Fee and Support Systems in European Higher Education 2015/16. Eurydice - Fact and Figures. Luxembourg: Publications Office of the European Union.

319
European Commission/EACEA/Eurydice, 2016b. Mobility Scoreboard: Higher Education Background Report. Eurydice Report. Luxembourg: Publications Office of the European Union.
European Commission/EACEA/Eurydice, 2017a. Modernisation of Higher Education in Europe: Academic Staff – 2017. Eurydice Report. Luxembourg: Publications Office of the European Union.
European Commission/EACEA/Eurydice, 2017b. National Student Fee and Support Systems in European Higher Education 2016/17. Eurydice - Fact and Figures. Luxembourg: Publications Office of the European Union.
European Commission/EACEA/Eurydice, Eurostat and Eurostudent, 2012. The European Higher Education Area in 2012: Bologna Process Implementation Report. Luxembourg: Publications Office of the European Union.
Eurostat, 2018a. Glossary: At-risk-of-poverty rate. [Online] Available at: http://ec.europa.eu/eurostat/statistics-explained/index.php/Glossary:At-risk-of-poverty_threshold [Accessed 15 January 2018].
Eurostat, 2018b. Glossary: Equivalised disposable income. [Online] Available at: http://ec.europa.eu/eurostat/statistics-explained/index.php/Glossary:Equivalised_disposable_income [Accessed 15 January 2018].
Eurostat, 2018c. Glossary: Median. [Online] Available at: http://ec.europa.eu/eurostat/statistics-explained/index.php/Glossary:Median [Accessed 15 January 2018].
Eurostat, 2018d. Glossary: Unemployment [Online] Available at: http://ec.europa.eu/eurostat/statistics-explained/index.php/Glossary:Unemployment_rate [Accessed 20 March 2018].
Eurostat and Eurostudent, 2009. The Bologna Process in Higher Education in Europe. Key indicators on the social dimension and mobility. Luxembourg: Office for Official Publications of the European Communities.
Government of Flanders/Department of Education and Training, 2013. Brains on the Move! Action plan for mobility 2013 [pdf] Available at: http://www.ond.vlaanderen.be/hogeronderwijs/beleid/ActieplanMobiliteit/actieplan2013_english.pdf [Accessed 18 January 2016].
Griga, D. and Hadjar, A., 2014. Migrant Background and Higher Education Participation in Europe: The Effect of the Educational Systems. In: European Sociological Review 30(3), pp. 275-286.
Hauschildt, K. et al., 2015. Social and Economic Conditions of Student Life in Europe. Synopsis of Indicators, EUROSTUDENT V 2012-2015. Bielefeld: W. Bertelsmann Verlag.
HEFCE (Higher Education Funding Council for England), 2016. National collaborative outreach programme: Invitation to submit proposals for funding. [pdf] Available at: http://www.hefce.ac.uk/pubs/year/2016/201606/ [Accessed 13 November 2017].
Higgins, S., Xiao Z., Katsipataki M., 2012. The Impact of Digital Technology on Learning. A Summary for the Education Endowment Foundation. Full Report. Durham University. [pdf] Available at: https://educationendowmentfoundation.org.uk/public/files/Publications/The_Impact_of_Digital_Technologies_on_Learning_(2012).pdf [Accessed 20 February 2018].
King, R., Findlay, A. and Ahrens, J., 2010. International student mobility literature review. Report to HEFCE, and co-funded by the British Council, UK National Agency for Erasmus. [pdf] Available at: https://www.ucl.ac.uk/basc/documents/hefce-report [Accessed 15 February 2016].

320
Ministère de lʼEnseignement supérieur, de la Recherche et de lʼInnovation [French Ministry of Higher Education, Research and Innovation], 2015. Pour une société apprenante - propositions pour une stratégie nationale de l'enseignement supérieur [For a learning society – proposals for a national higher education strategy]. [pdf] Available at: http://cache.media.enseignementsup-recherche.gouv.fr/file/STRANES/12/2/STRANES_entier_bd_461122.pdf [Accessed 18 January 2018].
MSMT (Ministerstva školství, mládeže a tělovýchovy) [Czech Ministry of Education, Youth and Sports], 2015. Strategic Plan for Higher Education Institutions 2016-2020. [Online] Available at: http://www.msmt.cz/areas-of-work/tertiary-education/strategic-plan-for-higher-education-institutions-2016-2020?lang=2 [Accessed 18 January 2018].
OECD (Organisation for Economic Co-operation and Development), 2012. Equity and Quality in Education: Supporting Disadvantaged Students and Schools. Paris: OECD Publishing. [Online] Available at: http://dx.doi.org/10.1787/9789264130852-en [Accessed 13 November 2017].
OECD, 2017. Table D6.1: Use of limits on number of students entering fields of study and institutions within countries with open and selective systems [Online] Available at: http://dx.doi.org/10.1787/eag-2017-34-en [Accessed 13 November 2017].
Orr, D. et al., 2017. Study on the impact of admission systems on higher education outcomes. Volume I: Comparative report. Luxembourg: Publications Office of the European Union.
Quinn, J., 2013. Drop-out and Completion in Higher Education in Europe among students from under-represented groups. NESET report. [pdf] Available at: http://nesetweb.eu/wp-content/uploads/2015/09/2013-Drop-out-and-Completion-in-Higher-Education-in-Europe-among-students-from-under-represented-groups.pdf [Accessed 3 October 2017].
Report by the Bologna Working Party on Qualifications Frameworks submitted to the conference of Ministers of Education of the Bologna Process, London, May 2007. [pdf] Available at: http://media.ehea.info/file/WG_Qualifications_frameworks/40/0/QualificationsFrameworks_report2007_581400.pdf [Accessed 13 February 2018].
Salmi, J. and Hauptman, A.M., 2006. Innovations in Tertiary Education Financing: A Comparative Evaluation of Allocation Mechanisms. Education Working Paper Series, Number 4. Washington: Human Development Network, Education Sector World Bank Group. [pdf] Available at: http://siteresources.worldbank.org/EDUCATION/Resources/278200-1099079877269/547664-1099079956815/Innovations_TertiaryEd_Financing.pdf [Accessed 13 November 2017].
Scholars at Risk. 26 July 2016. 15 Universities Shut Down in Connection with State of Emergency. [Online] Available at https://www.scholarsatrisk.org/2016/07/15-universities-shut-connection-state-emergency/ [Accessed 20 February 2018].
Scholars at Risk Network. 20 March 2017. Academic Freedom Monitor. [Online] Available at http://monitoring.academicfreedom.info/reports/2017-03-20-european-university-st-petersburg [Accessed 20 February 2018].
Scholars at Risk Network. 10 April 2017. Academic Freedom Monitor. [Online] Available at http://monitoring.academicfreedom.info/reports/2017-04-10-central-european-university [Accessed 20 February 2018].
321
Scottish Funding Council, 2016. Guidance for the development of University Outcome Agreements: 2017-18 to 2019-20. [pdf] Available at: http://www.sfc.ac.uk/web/FILES/GUI_SFCGD222016_UniversityOAGuidance1718/SFC_GD_22_2016_University_OA_guidance_2017-18.pdf [Accessed 13 November 2017].
Souto Otero, M., 2008. The socio-economic background of Erasmus students: a trend towards wider inclusion? International Review of Education, 54(2), pp. 135-154.
Swedish Council for Higher Education, 2016. Can excellence be achieved in homogeneous student groups? [pdf] Available at: https://www.uhr.se/globalassets/_uhr.se/publikationer/2016/uhr-can-excellence-be-achieved-in-homogeneous-student-groups.pdf [Accessed 13 November 2017].
Teichler, U., 2011. Bologna – Motor or Stumbling Block for the Mobility and Employability of Graduates? In: H. Schomburg and U. Teichler, eds. Employability and Mobility of Bachelor Graduates in Europe. Key Results of the Bologna Process. Rotterdam: Sense Publishers, pp. 3-41.
Turkish Council of Ministers, 2016. Decree with Force of Law: Decree on Measures to be Taken Under State of Emergency KHK/667. [Online] Available at: http://www.resmigazete.gov.tr/eskiler/2016/07/20160723-8.htm [Accessed 20 February 2018].
UNESCO (United Nations Educational, Scientific and Cultural Organization), 1997a. Recommendation concerning the Status of Higher-Education Teaching Personnel. 11 November 1997. [pdf] Available at http://unesdoc.unesco.org/images/0011/001132/113234mb.pdf [Accessed 5 February 2018].
UNESCO, 1997b. International Standard Classification of Education ISCED 1997. November 1997. [pdf] Available at: http://unesdoc.unesco.org/images/0011/001113/111387eo.pdf [Accessed 5 February 2018].
UNESCO and Council of Europe, 2016. Monitoring the Implementation of the Lisbon Recognition Convention. [pdf] Available at: http://www.enicnaric.net/fileusers/Monitoring_the_Implementation_of_the_Lisbon_Recognition_Convention_2016.pdf [ Accessed 28 March 2018].
UNESCO-UIS (UNESCO Institute for Statistics), 2012. International Standard Classification of Education ISCED 2011. [pdf] Available at: http://uis.unesco.org/sites/default/files/documents/international-standard-classification-of-education-isced-2011-en.pdf [Accessed 5 February 2018].
UNESCO-UIS, 2015. International Standard Classification of Education. Fields of education and training 2013 (ISCED-F 2013) – Detailed field descriptions. [pdf] Available at: http://unesdoc.unesco.org/images/0023/002350/235049e.pdf [Accessed 5 February 2018].
UNESCO-UIS, OECD and Eurostat, 2015. ISCED 2011 Operational Manual. Guidelines for Classifying National Education Programmes and Related Qualifications. [pdf] Available at: http://unesdoc.unesco.org/images/0023/002323/232343e.pdf [Accessed 6 October 2017].
UNESCO-UIS, OECD and Eurostat, 2016. UOE data collection on formal education. Manual on concepts, definitions and classifications. Version of 11th of July 2016. [pdf] Available at: http://uis.unesco.org/sites/default/files/documents/uoe2016manual_11072016_0.pdf [Accessed 27 March 2018].

322
Vincent-Lancrin, S., 2008. What is the Impact of Demography on Higher Education Systems? A Forward-looking Approach for OECD Countries. In: Higher Education to 2030 – Volume 1: Demography. Paris: OECD, pp. 41-103.
Witthaus, G. et al., 2017. Validation of Non-formal MOOC-based Learning: An Analysis of Assessment and Recognition Practices in Europe (OpenCred). JRC Science for Policy Report. [pdf] Available at: http://bookshop.europa.eu/en/validation-of-non-formal-mooc-based-learning-pbLFNA27660/?CatalogCategoryID=QN4KABste0YAAAEjFZEY4e5L [Accessed 28 February 2018].
World Bank, 2016. World Development Indicators database. [Online] Available at: https://data.worldbank.org/indicator/NY.GDP.PCAP.PP.CD [Accessed 13 November 2017].

323
ACKNOWLEDGEMENTS
BFUG Reporting Working Group Co-Chairs
Tone Flood Strøm Andrejs Rauhvargers
David Crosier
Authors
David Crosier, Ralitsa Donkova, Anna Horvath, Daniela Kocanova, Anita Kremo, Teodora Parveva,
Jari Riiheläinen, with the contribution of
Benedikte Custers and Cornelia Racké
Layout and graphics
Patrice Brel
Editing
Gisèle De Lel
324
BFUG CONTACTS
Albania Linda Pustina
Andorra Mar Martínez
Armenia Gayane Harutyunyan
Austria Gottfried Bacher Stephan Dulmovits
Azerbaijan Shahin Bayramov
Belarus Igor Titovich
Belgium/Flemish Community Magalie Soenen Noel Vercruysse
Belgium/French Community Caroline Hollela
Bosnia and Herzegovina Aida Duric
Petar Marić
Bulgaria Ivana Radonova
Business Europe Irene Seling
Croatia Ana Tecilazić Goršić
Cyprus Andreas Papoulas
Czech Republic
Zuzana Poláková
Denmark Jonas Husum Johannesen
Estonia Janne Pukk
Education International Andreas Keller
European Commission Klara Engels-Perenyi
European Association for Quality Assurance in Higher Education (ENQA) Maria Kelo
European Quality Assurance Register (EQAR) Colin Tück
European Students Union (ESU) Caroline Sundberg
European University Association (EUA) Michael Gaebel Henriette Stoebe
European Association of Institutions in Higher Education (EURASHE) Michal Karpisek
Sogeti Florian Pallaro
EUROSTUDENT Kristina Hauschildt
Finland Maija Innola
The former Yugoslav Republic of Macedonia Borcho Aleksov
France Hélène Lagier
Georgia Tamar Sanikidze Maia Margvelashvili
Germany
Peter Greisler
Greece Panagiota Dionysopoulou
Holy See Friedrich Bechina
Hungary János Görföl Ernö Keszei
Iceland Una Vidarsdottir
Ireland Joseph Gleeson
Italy Paola Castellucci
Kazakhstan Yekaterina Boiko
Latvia Daiga Ivsina Andrejs Rauhvargers
Liechtenstein Daniel Miescher
Lithuania Eglė Remeisienė Laura Stračinskienė
Luxembourg Corinne Kox
Malta Tanya Sammut-Bonnici
Moldova Nadejda Velisco
Montenegro Mubera Kurpejović
Biljana Mišović
The Netherlands Tessa Bijvank
Norway Tone Flood Strøm
Poland Bartlomiej Banaszak
Portugal Ana Mateus
Romania Cezar Haj Antonela Toma Cristina Ghițulică
Russian Federation Nadezda Kamynina
Serbia Katarina Jocic
Slovak Republic Jozef Jurkovič
Slovenia Erika Rustja

325
Spain Margarita de Lezcano-Mújica Sweden Martin Persson
Switzerland Silvia Studinger Muriel Meister-Gampert
Turkey Hasan Mandal
Ukraine Oleh Sharov Anna Novosad Serhiy Shkabko
United Kingdom – England, Wales and Northern Ireland Ann Miller Pamela Wilkinson
United Kingdom – Scotland Ed Thomson
MEMBERS OF BFUG WORKING GROUP 1
Albania Linda Pustina
Armenia Lusine Fljyan
Austria Helga Posset
Cyprus Andreas Orphanides
Czech Republic Tomas.Fliegl
France Hélène Lagier
Germany Barbara Lüddeke Frank Petrikowski
Latvia Andrejs Rauhvargers
Lithuania Laura Strcinskiene
Luxembourg Elisa Mazzucato
Italy Paola Castellucci
Norway Tone Flood Strøm (Co Chair)
Education International Rob Copeland
European Association for Quality Assurance in Higher Education (ENQA) Maria Kelo
European Quality Assurance Register (EQAR) Melinda Szabo
European Students Union (ESU) Adam Gajek
European University Association (EUA) Michael Gaebel
European Association of Institutions in Higher Education (EURASHE) Michal Karpisek
Sogeti Dominic Orr Florian Pallaro
EUROSTUDENT Kristina Hauschild
EACEA/Eurydice David Crosier (Co Chair)
BOLOGNA SECRETARIAT
Gayane Harutyunyan


The European Higher Education Area in 2018: Bologna Process Im
plementation Report
Bologna Process Implementation Report
The European Higher Education
Area in 2018
Education and TrainingEN
ECEC-02-15-185-EN
-C-01-18-252-EN
-N
ISBN 978-92-9492-740-8
Cover_imprimerie_tranche_300pages.indd 1Cover_imprimerie_tranche_300pages.indd 1 10/04/2018 12:04:0110/04/2018 12:04:01