chapter 2 get ready to take notes!. ch. 2 motion and speed
TRANSCRIPT

CHAPTER 2
Get ready to take notes!

Ch. 2 Motion and Speed

Motion – when an object changes position relative to a reference point

Distance - how far an object moves
Displacement - distance and direction relative to an object’s starting position

Distance = _____ m
Displacement = _____ m
12
0

Speed - distance an object travels per unit of time
speed = distancetime
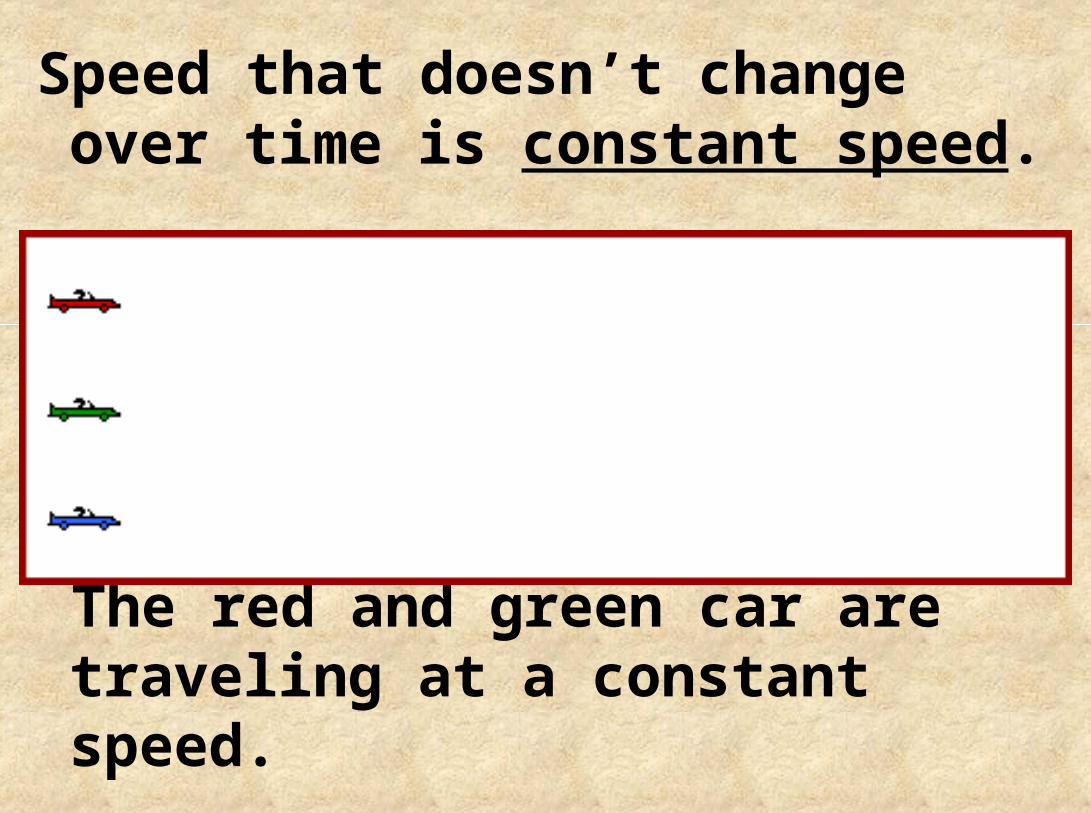
Speed that doesn’t change over time is constant speed.
The red and green car are traveling at a constant speed.

In real life, speed is usually not constant; most objects have changing speed.

Average speed - speed of motion when speed changes
Average speed is used to describe everyday motion.

Avg. speed = total distance total travel
time
= ____ m = ____ m/hr hr
5
0.2
25

(Hint: Each burst of motion happens in 1 second. Count the number of movements.)
red car = ____ m = ___ m/s s
blue car = ____ m = ___ m/s s
12010
1060 6
12

Velocity - speed and direction relative to starting position.

Determine the average speed and the average velocity of the skier during the 3 minutes.

average speed =
m = m/min min
average velocity =
m, = m , min min
420
3140
140
346.7right right

Instantaneous speed - speed at any given point in time.
Your speedometer shows instantaneous speed.

Acceleration – change in speed or direction or both.
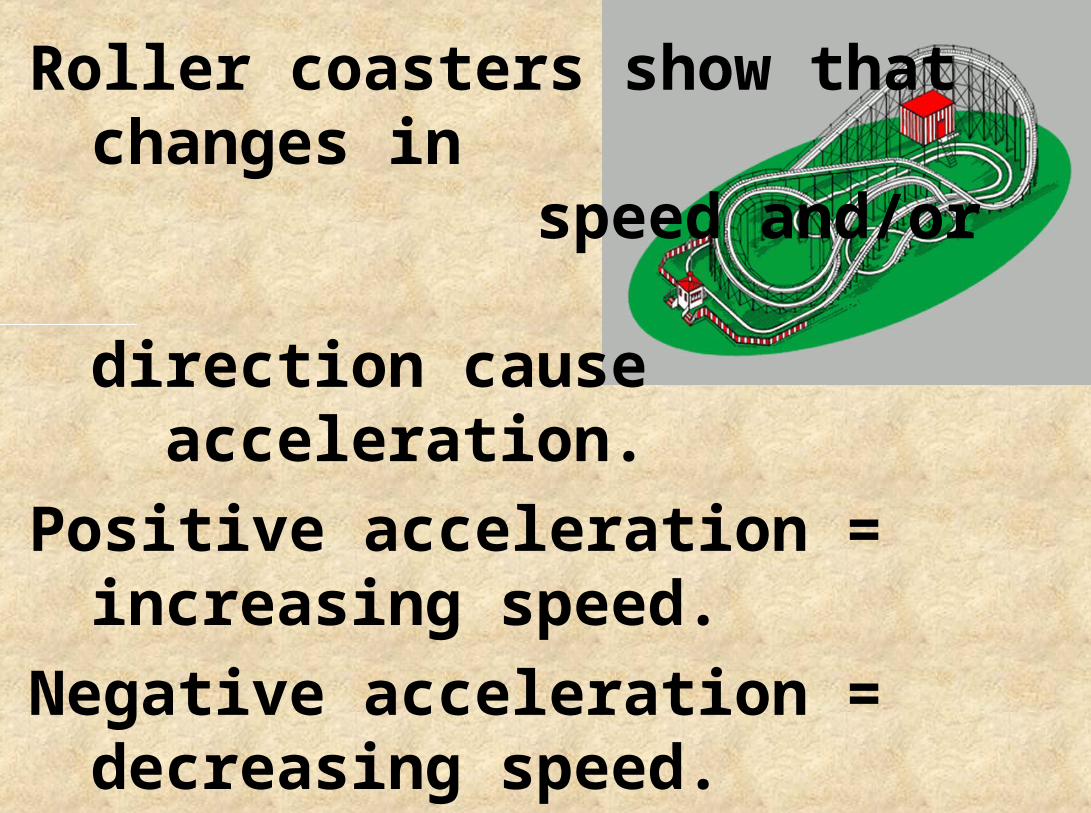
Roller coasters show that changes in speed and/or direction cause acceleration.
Positive acceleration = increasing speed.
Negative acceleration = decreasing speed.


Acceleration =
change in velocity time
Change in velocity = final velocity – initial velocity
Unit - meters per second squared (m/s2)

Graphing Motion

A distance-time graph displays motion of an object over time.
Plot: • distance on the y-axis • time on the x-axis.

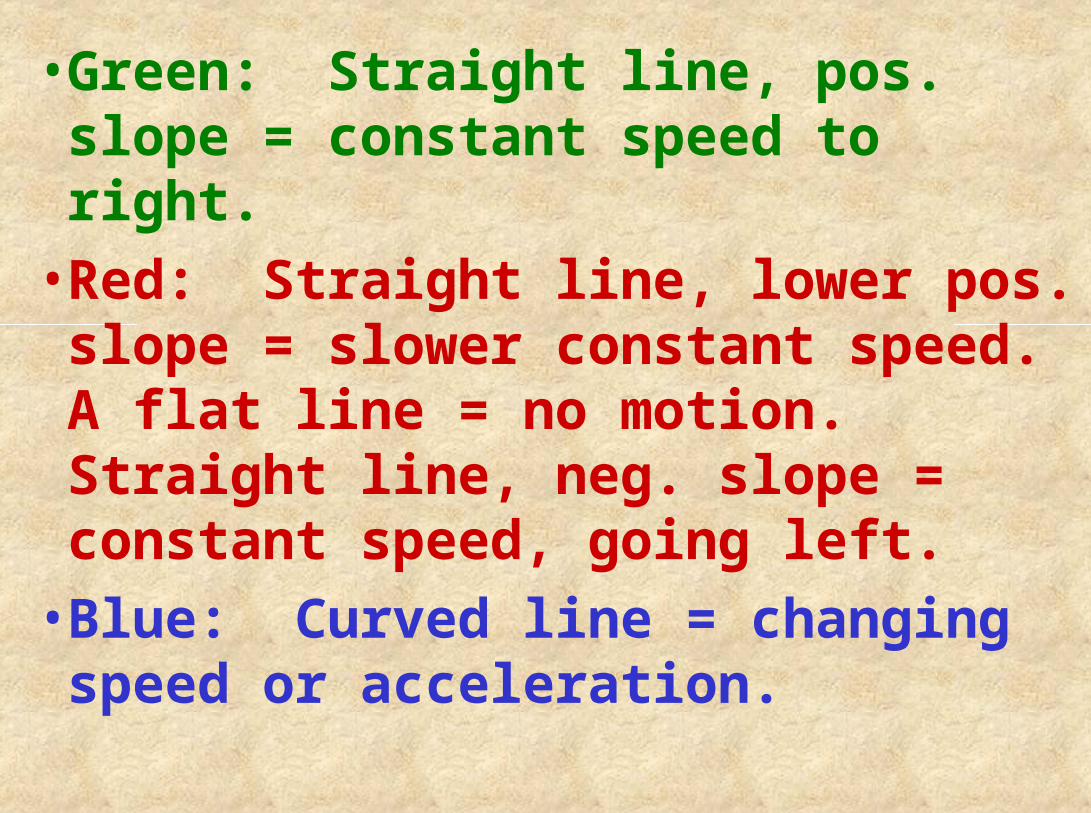
•Green: Straight line, pos. slope = constant speed to right.•Red: Straight line, lower pos. slope = slower constant speed. A flat line = no motion. Straight line, neg. slope = constant speed, going left.•Blue: Curved line = changing speed or acceleration.


Albert runs faster and faster (accelerates) steadily.
Bob is also accelerating but at slower speeds than Albert.
Charlie travels: • at a constant speed of about 6 m/s for 8 s, • stops for 5 s,• accelerates for 5 s more.

Who won the race?
Albert, because he ran the distance in the least time.

Fast, Constant, Left
Slow, Constant,
Left Slow, Constant, Right
Fast, Constant, Right
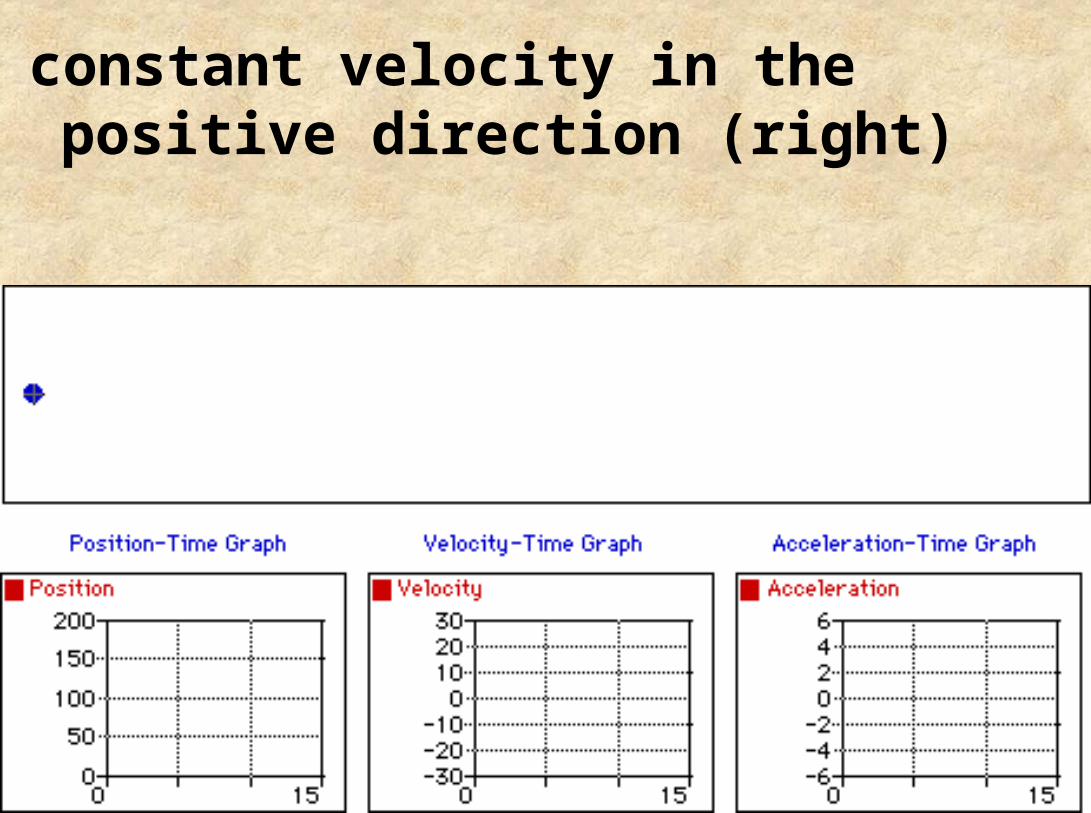
constant velocity in the positive direction (right)

constant velocity in the negative direction (left)


The blue car starts ahead of the red car (to the left of the screen). Since the red car is moving faster, it catches up with and passes the blue car.


Observe the velocity-time graphs. Each car's motion is represented by a horizontal line (constant velocity).

Observe that even though the cars pass each other, the lines on the velocity-time graphs do not intersect. Since the cars never have the same velocity, the lines on the velocity-time graph never cross.

The lines would intersect for a position vs. time graph; the red car passing the blue car means that there is an instant when they occupy the same position (at 7 s); yet they never have the same velocity at any instant in time.

A velocity-time graph displays speed of an object over time.
Plot: • velocity on the y-axis • time on the x-axis.

Positive Velocity, Zero Acceleration
Positive Velocity,Positive Acceleration

Negative Velocity,Negative Acceleration
Negative Velocity, Zero Acceleration

•dist.-time graph - up curve •vel.-time graph - pos. slope•acc.-time graph - above zero
Positive acceleration

•dist.-time graph - down curve •vel.-time graph - neg. slope•acc.-time graph - below zero
Negative Acceleration

Motion and Forces
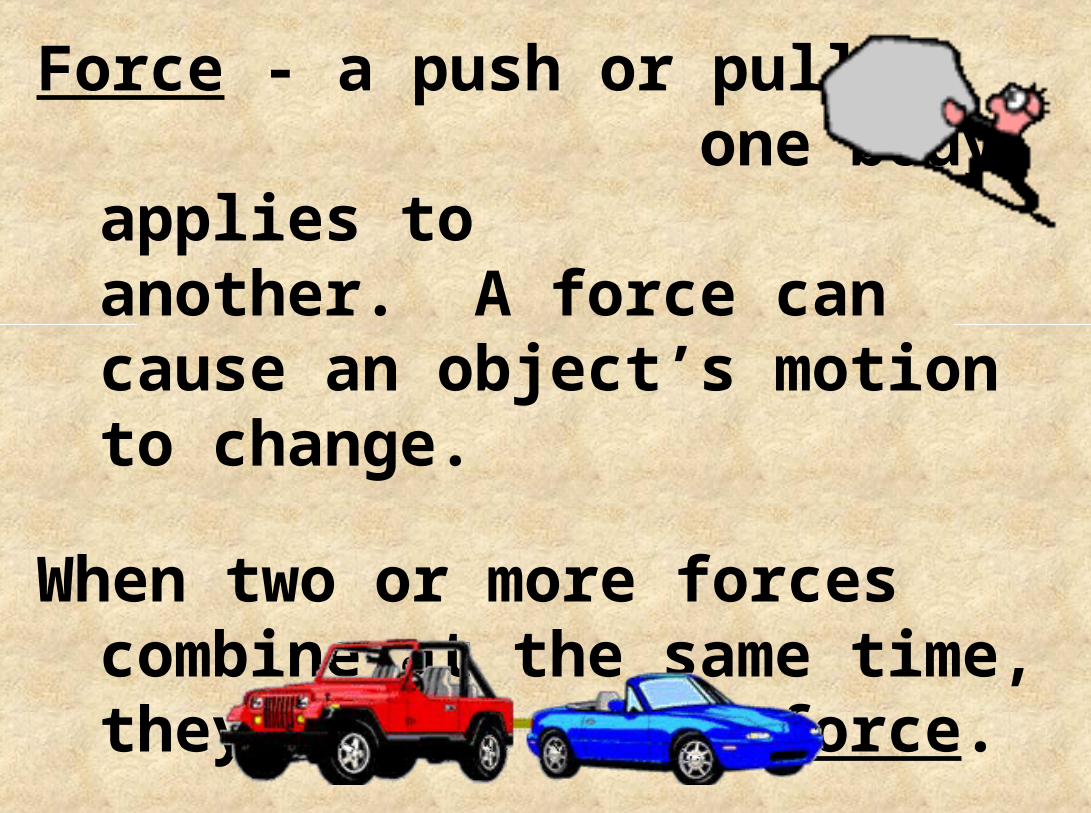
Force - a push or pull one body applies to another. A force can cause an object’s motion to change.
When two or more forces combine at the same time, they create a net force.

Balanced forces are equal in size and opposite in direction.
Unbalanced forces are unequal in size and/or not in the same direction.

Inertia and Mass

Inertia - an object’s resistance to any change in motion.
Objects with greater mass have greater inertia.

Newton’s 1st law of motion - an object moving at a constant velocity keeps moving at that velocity unless a net force acts on it; an object at rest will stay at rest unless a net force acts on it.

Auto crash - inertia at work
Passengers not wearing a seat belt continue forward at that speed even after the car stops.

Passengers wearing a seat belt slow down as the car slows down.

THE END