chapter 2. ecology of shellfish in rhode island waters 21 · draft rhode island shellfish...
TRANSCRIPT
DRAFT Rhode Island Shellfish Management Plan
SEPTEMBER 30, 2014 TABLE OF CONTENTS PAGE 1 OF 308
TABLE OF CONTENTS
Ecology of Shellfish in Rhode Island Waters ................................................ 21 CHAPTER 2.Section 200. General Introduction .......................................................................................................... 21 Section 210. Issues As Identified By Stakeholders ................................................................................. 23 Section 220. General Ecology—Bivalves ............................................................................................... 24
220.1. Hard clam (Mercenaria mercenaria) ....................................................................................... 28 220.2. Eastern oyster (Crassostrea virginica) .................................................................................... 34 220.3. Blue mussel (Mytilus edulis) .................................................................................................... 42 220.4. Soft-shell clam (Mya arenaria) ................................................................................................ 43 220.5. Bay scallop (Argopectin irradians) .......................................................................................... 46
Section 230. General Ecology—Gastropods .......................................................................................... 47 230.1. Channeled whelk (Busycotypus canaliculatus) ........................................................................ 48 230.2. Knobbed whelk (Busycon carica) ............................................................................................ 50
Section 240. Ecosystem Services Provision ........................................................................................... 50 240.1. Nutrient Reduction/Water Quality Improvement .................................................................... 51 240.2. Habitat Provision ...................................................................................................................... 53 240.3. Spawning Sanctuary ................................................................................................................. 53
Section 250. Ecological Carrying Capacity ............................................................................................ 56 Section 260. Fished vs. Non-fished Populations ..................................................................................... 56 Section 270. Future Ecological Change .................................................................................................. 57
270.1. Warming Waters ...................................................................................................................... 57 270.2. Changing Predators .................................................................................................................. 59 270.3. Changing Competitors ............................................................................................................. 59 270.4. Increased Precipitation ............................................................................................................. 59 270.5. Disease ..................................................................................................................................... 60 270.6. Ocean Acidification ................................................................................................................. 60 270.7. Nutrients ................................................................................................................................... 62 270.8. Harmful Algal Blooms ............................................................................................................. 62
Section 280. Recommendations .............................................................................................................. 63 Section 290. References (Chapter 2) ....................................................................................................... 65
CHAPTER 2 FIGURES Figure 2.1. Trends in dissolved inorganic nitrogen levels in the Providence River in relation to USEPA’s Coastal Condition thresholds. (Narragansett Bay Commission 2014). .....................................................................................23 Figure 2.2. Some popular recreational harvest locations in the state. .........................................................................27 Figure 2.3. Hard clam wild harvest landings in Narragansett Bay (a), outside of Narragansett Bay (b), and the south shore salt ponds (c), 2007–2013 (Atlantic Coastal Cooperative Statistics Program 2013). ..............................30 Figure 2.4. Distribution of legal-sized hard clams in Narragansett Bay (RIDEM 2013). ...........................................32 Figure 2.5. Rhode Island Department of Environmental Management Shellfish Harvest Areas. ................................33 Figure 2.6. Eastern oyster wild harvest landings for Rhode Island (a), and the salt ponds (b), 2007–2013 (Atlantic Coastal Cooperative Statistics Program 2013). ...........................................................................................................36 Figure 2.7. Distribution of habitat suitable for the Eastern oyster in the Narrow River (top) and southern Narrow River (bottom) (from Brown et al. 2013). .....................................................................................................................38 Figure 2.8. Distribution of habitat suitable for the Eastern oyster in Point Judith Pond (top) and Potter Pond (bottom) (from Brown et al. 2013). ...............................................................................................................................39 Figure 2.9. Distribution of habitat suitable for the Eastern oyster in the Ninigret Pond (top) and Green Hill Pond bottom) (from Brown et al. 2013). ................................................................................................................................40 Figure 2.10. Distribution of habitat suitable for the Eastern oyster in Quonochontaug Pond (from Brown et al. 2013). ............................................................................................................................................................................41 Figure 2.11. Distribution of habitat suitable for the Eastern oyster in Winnipaug Pond (from Brown et al. 2013). ..41

DRAFT Rhode Island Shellfish Management Plan
PAGE 2 OF 308 TABLE OF CONTENTS SEPTEMBER 30, 2014
Figure 2.12. Blue mussel wild harvest landings for Rhode Island, 2007–2013 (Atlantic Coastal Cooperative Statistics Program 2013). .............................................................................................................................................43 Figure 2.13. Wild harvest soft-shell clam landings for Narragansett Bay (a), areas outside of Narragansett Bay (b), and the south shore salt ponds (c), 2007–2013 (Atlantic Coastal Cooperative Statistics Program 2013). .................45 Figure 2.14. Wild harvest bay scallop landings for Rhode Island, 2007–2013 (Atlantic Coastal Cooperative Statistics Program 2013). .............................................................................................................................................47 Figure 2.15. Wild harvest channeled whelk landings for Rhode Island (a) and within Narragansett Bay (b), 2007–2013 (Atlantic Coastal Cooperative Statistics Program 2013). ...................................................................................49 Figure 2.16. Wild harvest knobbed whelk landings for Narragansett Bay, 2007–2013 (Atlantic Coastal Cooperative Statistics Program 2013). .............................................................................................................................................50 Figure 2.17. Location of aquaculture operations in Narragansett Bay (a) and Salt Ponds (b). ..................................55
CHAPTER 2 TABLES Chapter 2 does not include any tables. CHAPTER 2 APPENDICES (Not included)
Appendix 2.1 – Rhode Island’s Shellfish Heritage: An Ecological History Appendix 2.2 – List of all issues identified by stakeholders

DRAFT Rhode Island Shellfish Management Plan!
PAGE 18 OF 308 CHAPTER 2: ECOLOGY SEPTEMBER 29, 2014
Ecology of Shellfish in Rhode Island Waters CHAPTER 2.By Alan Desbonnet, Rhode Island Sea Grant
Section 200. General Introduction 1. The focus of this chapter is the ecology of Rhode Island’s most common recreational and
commercially important molluscan bivalve (clams, oysters, mussels, scallops) and gastropod (whelks) species. The intent is to summarize the existing body of ecological knowledge for these species in order to provide for enhanced understanding that can lead to improved management from species to ecosystem-based scales1 in Rhode Island waters. A treatment of basic biology of bivalves is provided in Chapter 3 of this document.
2. Despite the importance of shellfish as both commercial and recreational species, the existing body of knowledge regarding their overall abundance and distribution in Rhode Island waters is relatively sparse. The hard clam, or quahog, possesses the richest set of available data, followed by the Eastern oyster. For other species data are generally either too sparse and/or too intermittent to allow the development of more than a casual description of their ecological role in Rhode Island’s coastal ecosystems.
3. Bivalves provide ecosystem services in four major areas: (1) cultural—recreation and tourism, historical and educational experiences, (2) provisional—fisheries and aquaculture, fertilizer, jewelry, (3) regulating—water quality maintenance, shoreline protection, sediment trapping, and (4) supportive—nutrient cycling, biodiversity and habitat construction (Dame 2012). These services are further described in this chapter.
4. Bivalve filter feeders are intimately involved in the transfer of materials from water column, to sediments, to water column; these circular networks undertake intense recycling processes, and bivalves are a major component of these critically important ecological networks (Asmus and Asmus 1993; Coen and Grizzle 2007; Dame 2012; Higgins et al. 2013).
5. Water quality is a critical component of healthy ecosystems, particularly with regard to filter feeding organisms. Industrialization brought widespread degradation of Narragansett Bay water quality, but Desbonnet and Lee (1991) report significant improvement in water quality in Narragansett Bay since the early 1900s, a trend that has continued to present times. Leavitt et al. (2013) suggest that with the Narragansett Bay Commission Combined Sewage Overflow tunnel going into operation, water quality may improve enough to open previously closed for harvest shellfish resources. Nutrient reduction programs now underway are bringing further improvement and may reduce the threat of macroalgal blooms and summer hypoxia in bottom waters. The net result is that water quality has improved dramatically in Narragansett Bay in recent decades, and further improvement is underway on a continuing basis.
6. Rhode Island has a long history of shellfish harvesting. Rice et al. (2000) note three phases for shellfisheries in the state: (1) pre-colonial/colonial times of Native American harvests, (2) oyster aquaculture until its collapse in the late 1930s, and (3) hand tonging and then bullraking for hard clams. Shellfish harvesting has the potential to impact the ecology of shellfish populations and the surrounding ecological community, though the potential for impacts is largely dependent upon harvesting methodologies and resource management practices. Ecological change resulting from shellfish harvesting practices is considered later in this chapter. For a full accounting of the history of
1 An ecosystem as defined by Odum (1983) is: “… any unit that includes all organisms that function together in a given area interacting with the physical environment so that the flow of energy leads to clearly defined biotic structure and cycling of materials between living and non-living parts.”

DRAFT Rhode Island Shellfish Management Plan!
SEPTEMBER 29, 2014 CHAPTER 2: ECOLOGY PAGE 19 OF 308
shellfish harvest in Rhode Island, see Rhode Island’s Shellfish Heritage: An Ecological History at www.rismp.org.
7. Water quality, with regard to shellfish, has three major facets for consideration:
a. Coliform bacteria concentrations are of concern from a public health and safety perspective because contaminated shellfish can lead to sickness, and in extreme cases death, of humans who consume them. From an ecological perspective, coliform bacteria are a food source for bivalves and do not cause sickness or harm to the filter feeding organism. For this reason coliform bacteria are not considered further in this chapter. See Chapter 6 of this document for issues regarding public health and safety related to shellfish.
b. Metals, petroleum by-products, and organotoxins such as PCBs and DDT, are of concern from both public health and ecological perspectives as related to shellfish. A 35-year history of improved wastewater treatment technologies, improvements in surface water runoff management and treatment, the banning of many contaminants of concern, and changes in Rhode Island’s economic and industrial foundations, have all led to major water quality improvements in Rhode Island’s coastal waters (RIDEM 2000).
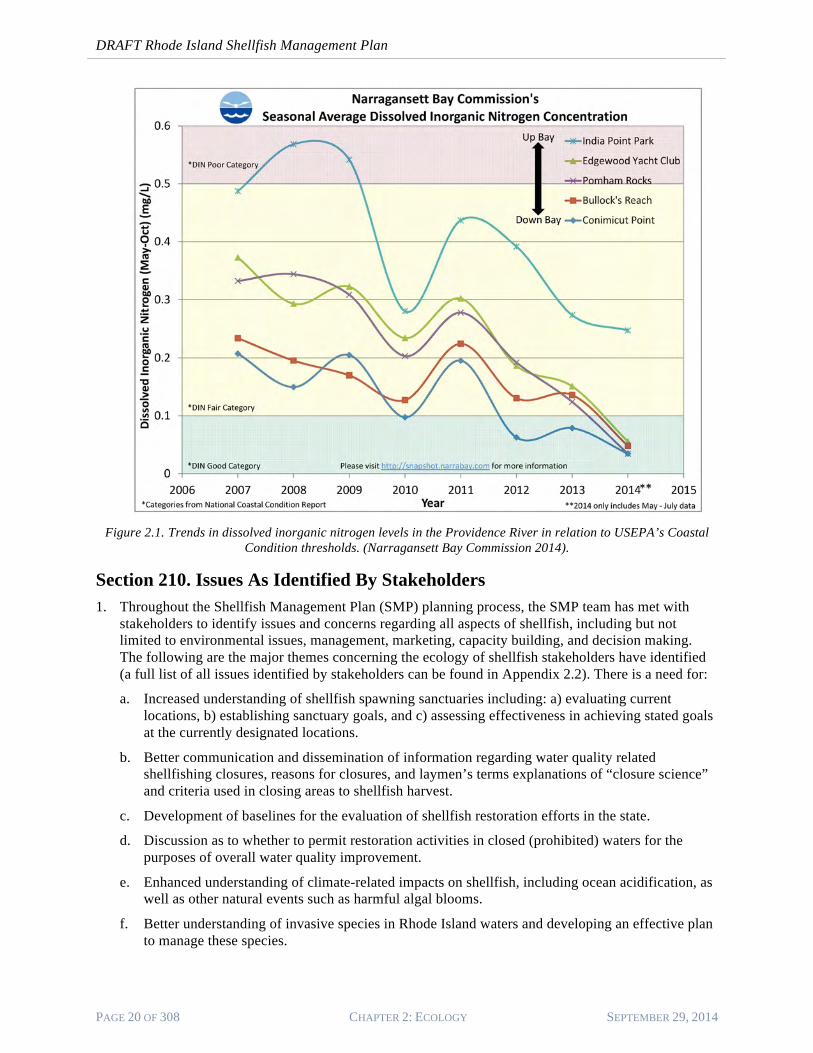
c. Nutrients are of concern regarding the ecology of shellfish. When present in excess quantities, nutrients can lead to algal blooms, which along with other environmental variables can lead to low dissolved oxygen concentrations in the water column—particularly in bottom waters—fish kills, and other nuisance and/or degraded environmental conditions. Improvements to sewage treatment have reduced nutrient inputs to Narragansett Bay significantly since the 1970s (Desbonnet and Lee 1991), and newly implemented biological nutrient removal is reducing nutrient inputs to Narragansett Bay even more significantly. Figure 2.1 shows nutrient removal trends over time in the Providence River, with 80% of stations now falling within the “good condition” category for an estuary as defined by the US Environmental Protection Agency National Coastal Condition program III (USEPA 2008). Nutrients however, are fertilizer for phytoplankton, which are a primary food source for bivalves, and the ecology of Narragansett Bay has acclimated to high nutrient levels over the past century and more. It is unclear if current nutrient reduction plans have the potential to reduce the primary productivity of Narragansett Bay to the point that it becomes food-limiting for consumers such as shellfish.
DRAFT Rhode Island Shellfish Management Plan!
PAGE 20 OF 308 CHAPTER 2: ECOLOGY SEPTEMBER 29, 2014
Figure 2.1. Trends in dissolved inorganic nitrogen levels in the Providence River in relation to USEPA’s Coastal
Condition thresholds. (Narragansett Bay Commission 2014).
Section 210. Issues As Identified By Stakeholders 1. Throughout the Shellfish Management Plan (SMP) planning process, the SMP team has met with
stakeholders to identify issues and concerns regarding all aspects of shellfish, including but not limited to environmental issues, management, marketing, capacity building, and decision making. The following are the major themes concerning the ecology of shellfish stakeholders have identified (a full list of all issues identified by stakeholders can be found in Appendix 2.2). There is a need for:
a. Increased understanding of shellfish spawning sanctuaries including: a) evaluating current locations, b) establishing sanctuary goals, and c) assessing effectiveness in achieving stated goals at the currently designated locations.
b. Better communication and dissemination of information regarding water quality related shellfishing closures, reasons for closures, and laymen’s terms explanations of “closure science” and criteria used in closing areas to shellfish harvest.
c. Development of baselines for the evaluation of shellfish restoration efforts in the state.
d. Discussion as to whether to permit restoration activities in closed (prohibited) waters for the purposes of overall water quality improvement.
e. Enhanced understanding of climate-related impacts on shellfish, including ocean acidification, as well as other natural events such as harmful algal blooms.
f. Better understanding of invasive species in Rhode Island waters and developing an effective plan to manage these species.

DRAFT Rhode Island Shellfish Management Plan!
SEPTEMBER 29, 2014 CHAPTER 2: ECOLOGY PAGE 21 OF 308
g. More research to understand how the strategy of time released sewage treatment discharge and combined sewage overflow (CSO) effluents will effect shellfish populations.
Section 220. General Ecology—Bivalves 1. Dame (2012), in a summary of bivalve physical environmental interactions, notes there are two basic
life styles for bivalves—deposit feeding or filter feeding. Deposit feeders, typically found in fine sediments in low velocity environments, rework and ingest bottom sediment, while (non-reef building) filter feeders strain particles from the water column and are often found in coarse sediments in higher velocity environments. As they prefer differing environments, buried filter feeding and deposit feeding bivalves are most often not found living together.
2. Predation is considered the most significant source of mortality to bivalves, and the dominant factor controlling recruitment success. Crabs, gastropods, and sea stars are the most important predator groups, while ctenophores and jellyfishes, as well as adult bivalves, are significant predators of larval forms (Dame 2012; Bricelj 1992). Oystercatchers can be a significant bivalve predator intertidally, sea ducks in waters less than 25 feet deep, and gulls opportunistically at low tide (Meire 1993).
3. Mortality during the larval phase of growth, and during metamorphosis to a benthic lifestyle, can be intense—natural mortality can be as high as 95% (Rice and Goncalo 1995). Kremer (1979) reports that Mnemiopsis leidyi, a common ctenophore of Narragansett Bay and voracious consumer of molluscan larvae, is abundant July through October, with a peak from mid-August to early September. However, as water temperatures have warmed over time, Mnemiopsis is arriving earlier—as early as May/June in warmer years—creating direct overlap with time of larval abundances of many bivalve species (Sullivan et al. 2001). It is also expected that larval mortality due to predation may escalate as a result of ocean acidification, as larvae spend a longer time in the plankton while calcifying shell material and/or have a thinner, less predator-proof shell upon metamorphosis (Talmage and Gobler 2009).
4. In many bivalve species, predation is size mediated (Seed 1993). For instance, for the hard clam a size of 30 mm shell length provides a refuge to most predation, and 40 mm is a refuge to nearly all predation except that of large gastropods (e.g., whelk; Arnold 1984; Bricelj 1992). Clam density can also provide a refuge to predation (Malinowski 1985), with low density providing protection through decreased predator feeding efficiency.
5. Substrate complexity influences predation—as the substrate becomes more complex, for instance ranging from all sand to a mix of sand, gravel, cobble, and/or crushed shell or seagrass, predator efficiency in seeking buried bivalves is reduced (Arnold 1984; Bricelj 1992; Sponaugle and Lawton 1990). The distribution of sediment types on the sea floor is a result of the interactions and dynamics of water flow, settling rates of various sediment types, and reworking of the sediments by benthic organisms (Bertness 2007). Some species, such as the mud crab (Dyspanopeus sayi), a common northern species, are very effective predators of juvenile clams even in mixed substrates such as a shell/cobble blend (Day and Lawton 1988; Bricelj 1992). In such cases, shell size or shell shape will be more important than sediment type as predator protection.
6. Shell height, thickness, and gape all impact predator effectiveness (Boulding 1984; Seed 1993). Clams with permanent gapes (e.g., soft-shell clams) are most vulnerable, while thick, tightly closed, high arched shells (e.g., hard clam) give optimal protection (from crustaceans such as crabs).
7. Hard clams produce thicker shells in the presence of predators, but generally at a cost of reduced tissue and gamete production (Nakaoka 2000). Smee and Weissburg (2006a, 2006b), Griffiths and Richardson (2006), and Leonard et al. (1999) report deeper burial by Macoma balthica in the presence of predator chemical cues, a trait that is shared by other bivalves (Griffiths and Richardson 2006; Flynn and Smee 2010). While much research points to slower growth when bivalves put extra energy into predator defense (Griffiths and Richardson 2006), Leonard et al. (1999) found that for mussels at a study site in the Damariscotta River (Maine), no reduction in tissue growth was noted for

DRAFT Rhode Island Shellfish Management Plan!
PAGE 22 OF 308 CHAPTER 2: ECOLOGY SEPTEMBER 29, 2014
mussels secreting thicker shells and more robust byssal threads in response to predator abundance; the cause of this conflicting growth pattern was not known.
8. Burrowing is effective predator protection for some species of shellfish, though deep burrowing, while offering more predator protection, has a cost of reduced feeding efficiency (Boulding 1984; Griffiths and Richardson 2006). Flynn and Smee (2010) found that soft-shell clams burrow 15% deeper in the presence of predator chemical cues, while Griffiths and Richardson (2006) found that species with short siphons did not burrow deeper, as they would then not be able to feed efficiently. Siphon nipping—a technique employed by some crabs and fish—may result in burrowing clams having to relocate closer to the sediment surface, reducing the effectiveness of burrowing protection (Seed 1993; Dame 2012). Steimle et al. (2000) reports winter flounder as a major siphon nipper of the hard clam—siphons made up 14% of winter flounder stomach contents in their study.
9. Algae is the main source of suspension feeding bivalve nutrition, with bacteria and organic detrital material providing additional sustenance (Dame 2012); dissolved organic matter and free amino acids also provide a nutritional source (Rice 1999). As filter feeders, bivalves will consume larval forms of other bivalve species, as well as of their own species, when growing in dense concentrations.
10. Some bivalves, such as hard clams, regulate filtering rate according to the amount of suspended matter in the water column, (Newell 2004; Newell et al. 2005), or according to species of plankton, such as mussels (Asmus and Asmus 1993). Others, like oysters (Newell 2004; Newell et al. 2005) continue to filter at a given rate, but produce more pseudofeces.2
11. Not all phytoplankton are created equal as a food source for bivalves (Shumway 1990). Brown tides for instance—the last major Rhode Island outbreak was in 1985/86—are a poor nutrition source, and bivalves literally starve despite an abundance of food, as the brown tide organisms are too small to be filtered effectively. Tracey (1988) found starvation in blue mussels during brown tide outbreaks, with mortality being as high as 95% (Tracey 1985).
12. Food availability and food type can be important factors in bivalve growth. Greenfield et al. (2005) found that hard clams on the north shore of Long Island (New York) had significantly better growth than those on the south shore. The authors attributed this to a predominance of pennate diatoms on the south shore that have been found to reduce clearance rates3 in hard clams, and hence reduce clam growth rates.
13. There is some evidence that bivalve larvae actively swim to position themselves in the water column in search of desirable salinities (Deshieneks et al. 1996). Wood and Hargis (1971) found that oyster larvae sink as salinity decreases (ebb tide) and swim upwards as salinity increases (flood tide). The net result of this behavior is that oyster larvae appear to position themselves in the water column for net up estuary movement to preferred environmental conditions. A model used by Leavitt et al. (2013) to simulate hard clam larval disbursement in Narragansett Bay employs larval behavior where larvae swim upwards for the first seven days of the model run, then downwards for the remainder of the modeled time interval4.
2 Pseudofeces, produced when there is “too much food” or too high a concentration of suspended particulate matter, are conglomerations of organic and inorganic material that are concentrated by bivalves as they filter the water column but are unable to biologically assimilate the total amount of particulate matter filtered (Dame 2012). Feces and pseudofeces, once settled on the sea floor, are termed biodeposits. 3 Clearance rate is the volume of water completely cleared of particles per unit time; in general, the clearance rate is decreased as the concentration of particles in the water increases (Dame 2012). 4 Including larval behavior in the model makes a significant difference in outcomes. Leavitt et al. (2013) report that with larval behavior included, 53% of the larvae are lost to the coastal ocean since they tend to stay in the surface layer of estuarine flow moving to the ocean; without larval behavior included, only 20% of the larvae are lost to the ocean.
DRAFT Rhode Island Shellfish Management Plan!
SEPTEMBER 29, 2014 CHAPTER 2: ECOLOGY PAGE 23 OF 308
14. Distribution of bivalves is largely dependent upon the environmental influences experienced during the pelagic larval phase of development, and circulation dynamics are a major influence (Bowen and Hunt 2009; Dame 2012). Green et al. (2013) note that it is well accepted that metamorphosing bivalves use a suite of chemical cures to select an appropriate settlement site. The authors found a positive correlation between pH and larval site selection, suggesting that pH at the sediment-water interface is a major selection criteria for at least soft-shell and hard clams. Once settled, mortality incurred through predation and competition is major factors in shaping adult abundance patterns (Rice and Goncalo 1995).
15. Bivalves that form reefs, middens, windrows, or dense aggregates are considered ecosystem engineers in that they create, modify and maintain habitat that would not exist in their absence (Jones et al. 1994, 1997; Gutierrez et al. 2003; Borthagaray and Carranza 2007). For instance, on soft bottoms, shell aggregates provide attachment sites where none existed, and in rocky habitat the number of attachment sites is increased; in both cases increased diversity is promoted. While bivalve aggregates have the benefit of creating habitat and increasing recruitment, negative aspects may be predator attraction and decreased individual growth from crowding (Gutierrez et al. 2003; Alteiri and Witman 2006).
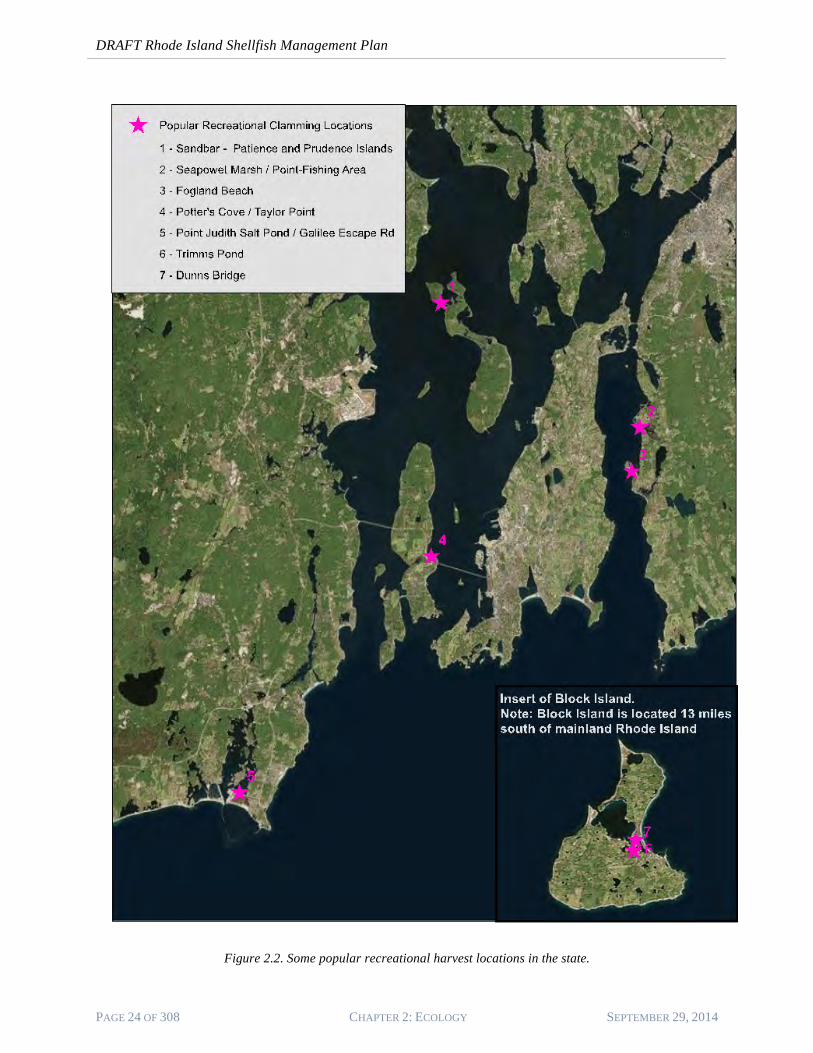
16. Figure 2.2 show the location of some of the more popular areas used by recreational shellfishers in Rhode Island waters. While not specific enough at a species scale to add ecological detail, the maps provide a generalized view of where shellfish exist in areas readily accessible to the public. While presenting a view that is admittedly biased (e.g., having ready public access), the maps do note the locations of presumed important shellfish habitat areas.
DRAFT Rhode Island Shellfish Management Plan!
PAGE 24 OF 308 CHAPTER 2: ECOLOGY SEPTEMBER 29, 2014
Figure 2.2. Some popular recreational harvest locations in the state.

DRAFT Rhode Island Shellfish Management Plan!
SEPTEMBER 29, 2014 CHAPTER 2: ECOLOGY PAGE 25 OF 308
220.1. Hard clam (Mercenaria mercenaria)
220.1.1. Ecology 1. The hard clam, or Northern quahog, is Rhode Island’s iconic bivalve species. Used as a food source,
and the shell as a form of money by Native Americans, the hard clam now makes up the largest wild fishery for shellfish in Rhode Island. See Figure 2.4 for wild harvest landings of clams throughout Rhode Island waters. Smaller sizes are raw bar delicacies, while large sizes are a major ingredient in “stuffies”—a buttered breadcrumb and clam mixture baked in a quahog shell—and the state’s unique clear broth clam chowder. See Rhode Island’s Shellfish Heritage: An Ecological History at www.rismp.org for more detail regarding the history of this species.
2. The range of the hard clam is New Brunswick (Canada) to central Florida, in estuaries and bays where salinity is greater than 15 parts per thousand (ppt), and that have good tidal exchange (MacKenzie et al. 2002). The hard clam is slow growing but long-lived (23-46 years), with one spawning event per year in the northeast (Bricelj 1992). Jones et al. (1989) found a median age for hard clams in Narragansett Bay (from 10 scattered stations) to be 14 years, with 83% of the clams sampled being at least 10 years old; a 25.4 mm (1-inch) size was attained in Year 3, and 38 mm (1.5 inch) in Year 4. The approximate growing season in Narragansett Bay is April to mid-November (Jones et al. 1989). Pratt (1988) reported good concentrations of juvenile hard clams in upper Narragansett Bay, but noted they appeared stunted in their growth, possibly due to overcrowding.
3. Hard clams have been found to prefer sediments that are coarse yet firm, with complex surface topography that may include shell fragments—sandy areas with mixed shell fragments, for instance (Kassner et al. 1991; Murphy and Erkan 2006). Muddy sediments are less preferable—the authors found as much as a seven-fold increase in clam abundance between muddy and sandy (with shell fragments) sediments. Kassner et al. (1991), in a study of hard clam populations on Long Island (New York), found highest clam abundances in sediments that were coarse yet firm, not highly reworked (by other benthic organisms), had complex surface topography with a high degree of shell fragments; lowest clam abundance was found in clay/mud sediments. Hard clams are not uniformly distributed throughout Narragansett Bay, showing a pattern of decreasing abundance from north to south (Pratt 1988; Butet 1997) and patchiness throughout the Bay (Rice 1992).
4. Peak abundance of hard clam larvae was found to occur mid to late June, with more larvae found on neap rather than spring tides (Butet 1997; Leavitt et al. 2013); Landers (1954) found maximum larvae in the water column from June to August. As with adult clam densities, larval density decreased along a north-south bay transect. Butet (1997) reports 80-99% mortality for hard clam larvae in Narragansett Bay.
5. Optimal growth for hard clams is 20°C, with no growth occurring below 9°C or above 31°C (Ansell 1968). In the northern part of its range, growth is restricted to summer months, which may be extended as waters continue to warm. Jones et al. (1989) found a growth gradient for adult hard clams—slowest growth at the mouth of Narragansett Bay and highest in the upper bay, though less in the Providence River, possibly due to overcrowding.
6. A close relationship between current speed and hard clam growth was described by Grizzle and Morin (1989)—at high current speeds growth was inhibited, as it was at high water column particulate concentrations. At moderate speeds and/or moderate particulate concentrations however, growth was enhanced (relative to low or no current). Hard clam growth has been reported to be improved in sand, a sediment type indicative of higher flow velocities, which is indicative of a more rapid resupply of food (Rice and Pechenick 1992).
7. Hard clams reach a refuge from predation as they grow. Arnold (1984) found that only large (blue) crabs could open hard clams of 25 mm shell length and that at 50 mm no crab predation was found. The author suggests a 40 mm size class as having attained a refuge from predation. Bricelj (1992) and Carriker (1951) report similarly, adding that large whelks are able to prey upon hard clams 40 mm and larger, but at very low rates.

DRAFT Rhode Island Shellfish Management Plan!
PAGE 26 OF 308 CHAPTER 2: ECOLOGY SEPTEMBER 29, 2014
8. Recruitment can be highly limited into existing populations dominated by old clams. Malinowski (1992) reports that significant recruitment occurred only twice in 15 years in a population studied on Fishers Island (New York). Keck et al. (1974) found that sandy areas treated with clam liquor were most attractive to settling larvae, suggesting that the presence of conspecifics may be an important factor in settlement site selection, though based on Malinowski’s findings, perhaps to some potential upper limit of adult density.
9. Hard clams have been found to exist at densities far below the maximum that could be sustained based on available food and space, and with little indication of intraspecific competition (Malinowski 1992); the author concludes that predation is likely a controlling factor for hard clam populations (at a study site at Fishers Island, New York). Bricelj (1992) reports that predation is a controlling factor in hard clam mortality and recruitment success, particularly under 20 mm shell length.
10. Figure 2.4 (a) shows wild harvest hard clam landings for Narragansett Bay, 2007–20135, which dwarf clam landings from all other Rhode Island areas, and has seen an increase in recent years. Figure 2.4 (b) shows landings for all other portions of Rhode Island (note change in scale). Landings from Greenwich Bay dwarf landings from all other areas, while landings from Point Judith Pond dwarf landings coming from the salt ponds (Figure 2.4 (c) note change in scale). Discernable patterns or trends are not readily apparent in these time series data.
5 Hard clam landings data for Narragansett Bay includes Upper Narragansett Bay, Conditional Area A and B, West Passage, East Passage, Conimicut Triangle, Mill Gut Management Area, Potowomut Management Area A and C, and Bissel Cove/Fox Island Management Area. Greenwich Bay landings includes those for Greenwich Bay and Greenwich Bay Management Sub Area 1, 2, and 3. Sakonnet River landings include those for Sakonnet River, Sakonnet River Management Area, Bristol Harbor Transplant Area, Kickemuit Management Area, and Mount Hope Bay. Salt Ponds landings reflect those for Ninigret Pond, Point Judith Pond, Quonochontaug Pond, and Winnipaug Pond; Not all areas listed reported landings in each year, inserting considerable inconsistency in the data across years. See Figure 2.5 for location of various harvest areas.

DRAFT Rhode Island Shellfish Management Plan!
SEPTEMBER 29, 2014 CHAPTER 2: ECOLOGY PAGE 27 OF 308
Figure 2.3. Hard clam wild harvest landings in Narragansett Bay (a), outside of Narragansett Bay (b), and the
south shore salt ponds (c), 2007–2013 (Atlantic Coastal Cooperative Statistics Program 2013).
0 5
10 15 20 25 30 35
2007 2008 2009 2010 2011 2012 2013
Mill
ions
of C
lam
s
Year
Narragansett Bay (a)
0
1
2
3
4
5
6
7
2007 2008 2009 2010 2011 2012 2013
Mill
ions
of C
lam
s
Year
Other Areas
Greenwich Bay
Sakonnet River
Salt Ponds
(b)
0 0.1 0.2 0.3 0.4 0.5 0.6 0.7 0.8 0.9
2007 2008 2009 2010 2011 2012 2013
Mill
ions
of C
lam
s
Year
Salt Ponds
Ninigret
Point Judith
Quonochontaug
Winnipaug
(c)

DRAFT Rhode Island Shellfish Management Plan!
PAGE 28 OF 308 CHAPTER 2: ECOLOGY SEPTEMBER 29, 2014
220.1.2. Distribution 1. Figure 2.5 shows the distribution of legal-sized hard clams in Narragansett Bay6, and Figure 2.6
shows the location of various shellfish harvest and tagging areas as managed by Rhode Island Department of Environmental Management. Highest hard clam densities tend to coincide with closed and/or seasonally open areas in upper Narragansett Bay and the Providence River, as well as in Greenwich Bay. Other high density areas fall into Conditional Areas A and B, and outside the mouth of Greenwich Bay. Clam density tends to show an overall trend towards lower density with distance down bay, and overall higher densities in the East vs. the West Passage. The West Passage is reported to contain 25.9% of the Narragansett Bay legal-sized hard clam population (Mercer 2013), with an average hard clam density of 46 clams m-2 (Rice et al. 1989). The East Passage is reported to contain 11.9% of the legal-sized Narragansett Bay hard clam population; the Sakonnet River 0.6% of the Narragansett Bay legal-sized hard clam population (Mercer 2013). Murphy and Erkan (2006) also reported low densities of hard clams for the Sakonnet River. Mount Hope Bay is reported to contain 0.6% of the Narragansett Bay legal-sized hard clam population (Mercer 2013). A bimodal distribution of mature vs. young hard clam age classes have been reported for Mount Hope Bay (Pratt et al. 1992), which according to the authors indicates an extended period of reduced larval recruitment.
2. Based on dispersion patterns, Butet (1997) concluded that the Providence River is likely the dominant source of hard clam larvae for Narragansett Bay. This finding adds support to the concept of closed-to-harvest waters in the Upper Bay acting as spawning sanctuaries.
3. Hard clam Condition Index7 in the Providence River has been found to be low (Marroquin-Mora and Rice 2008); the authors note that the area containing clams with the lowest Condition Index coincides with the area that experiences frequent hypoxic8 conditions.
4. Conditional Areas A and B contain 44.5% of the hard clams estimated to exist in Narragansett Bay, at an average clam density of 5.2 clams m-2 (Mercer 2013). Rice et al. (2000) and Rice (1999) found average hard clam densities in the Providence River ranging from 9.1 clams m-2 to 12.5 clams m-2.
5. From a survey of hard clams in Greenwich Bay, Lazar et al. (1994) report a broad range of hard clam sizes, with some areas showing signs of poor recruitment years as evidenced by adults of different ages spanned by years with no representative age classes. The authors found that areas closed to harvest had high densities of clams (0–17.9 m-2 in open areas vs. 0.2–33.9 m-2 in closed), and suggest that Greenwich Cove, Warwick Cove, Brushneck Cove, and Apponaug Cove provide the broodstock for the Greenwich Bay hard clam population.
6. Greenwich Bay is reported as having 14.4% of the hard clam population of Narragansett Bay (Mercer 2013). Mercer (2013, based on densities reported in Lazar et al. 1994) reports Greenwich Cove as having a hard clam density of 12 clams m-2, Warwick Cove 30 m-2, Apponaug Cove 16 m-2, and Greenwich Bay proper 4 m-2. Rice et al. (1989) report hard clam densities of 190 clams m-2 in Greenwich Cove (mean width 61 mm), and 78 clams m-2 in Greenwich Bay (mean width 31 mm).
6 Rhode Island Department of Environmental Management undertakes transplants of hard clams, often off limits to harvest in closed areas, and moves them to other areas, which may open to harvest according to applicable rules and regulations. Because clams are moved around, the distribution of clams reflects these transplant activities, and not necessarily natural abundance patterns. 7 Condition Index of bivalves relates the proportion of the shell cavity that is occupied by soft body tissue, and are often used to follow seasonal change in nutrient reserves or meat quality (Dame 2012). Low Condition Index (e.g., less meat inside the shell), indicates some stressor(s) that are causing the shellfish to not grow to its fullest potential. Predator presence, lack of food, or presence of pollutants, for instance, could be mechanisms that reduce growth and lead to reduced bivalve Condition Index. 8 When experiencing hypoxic conditions, most bivalves “clam up,” shutting the shell tightly with a cessation of pumping water and filter feeding (Dame 2012). Since the bivalve is no longer actively feeding and respiring, stress sets in and overall growth and condition is reduced.

DRAFT Rhode Island Shellfish Management Plan!
SEPTEMBER 29, 2014 CHAPTER 2: ECOLOGY PAGE 29 OF 308
Figure 2.4. Distribution of legal-sized hard clams in Narragansett Bay (RIDEM 2013).

DRAFT Rhode Island Shellfish Management Plan!
PAGE 30 OF 308 CHAPTER 2: ECOLOGY SEPTEMBER 29, 2014
Figure 2.5. Rhode Island Department of Environmental Management Shellfish Harvest Areas.

DRAFT Rhode Island Shellfish Management Plan!
SEPTEMBER 29, 2014 CHAPTER 2: ECOLOGY PAGE 31 OF 308
7. Due to its warming sooner than other waters, Greenwich Cove is reported as being the first area to see hard clam spawn (Marroquin-Mora and Rice 2008). Butet (1997) similarly noted that warm water coves saw hard clam spawn sooner than cool water coves.
8. Based on modeling efforts to simulate the transport and distribution of hard clam larvae throughout Narragansett Bay, Leavitt et al. (2013) identify the following key findings:
a. Larval transport from the Providence River area showed wide disbursement throughout Narragansett Bay, with more larvae ending up in the West Passage than the East Passage; 20–34% of larvae were transported out of the bay to the open ocean.
b. Larvae produced in the spawning sanctuary at the mouth of Greenwich Bay tended to remain in Greenwich Bay, but with significant numbers moving into the West Passage; 45–51% of larvae were transported out of the bay to the open ocean.
c. Most of the larvae released in Greenwich Cove were retained in Greenwich Bay, but with significant transport into the West Passage; 11–21% of larvae were transported out of the bay to the open ocean.
d. Rome Point larvae were largely transported out of Narragansett Bay to the open ocean (95–96%), with small numbers remaining in the lower East and West Passages.
e. Larvae released at Hog Island saw wide distribution throughout Narragansett Bay, with large numbers moving into the East Passage and into Mount Hope Bay, and significant numbers remaining in the upper Bay and West Passage; 35–46% of larvae were transported out of the bay to the open ocean.
f. Larvae released at Rocky Point were predominantly found in the West Passage, with small numbers on the west side of the East Passage; 34–43% of larvae were transported out of the bay to the open ocean.
9. The coastal ponds are reported to contain 0.8% of the Rhode Island legal-sized hard clam population (Mercer 2013), and 46% of the aquaculture taking place in Rhode Island (in 2011; Brown et al. 2013).
10. Hard clams were found by Campbell (1961) to be the predominant bivalve in Great Salt Pond on Block Island, with greatest densities found in the southwest region. Russell et al. (1973) reported hard clams south of Harris Point, in Cormorant Cove and along the north shore of Great Salt Pond. Ganz (1978; 1983; 1992) and Ganz et al. (2000) all report the hard clam to be the most abundant bivalve in Great Salt Pond.
220.2. Eastern oyster (Crassostrea virginica)
220.2.1. Ecology 1. The range of the Eastern oyster is from the Gulf of St. Lawrence (Canada) south to Key Biscayne
(Florida) and into the West Indies, in estuarine waters intertidally to 30 m (Coen and Grizzle 2007).
2. The Eastern oyster was an important food source for Native Americans and early settlers to Rhode Island. Goode (1887) notes that oysters were overfished in Narragansett Bay by the late 1880s, and natural harvest gave way to broad scale oyster aquaculture (Desbonnet and Lee 1991). A more detailed history can be found in Rhode Island’s Shellfish Heritage: An Ecological History at www.rismp.org. Wild harvest of oysters today is sporadic, though a robust aquaculture industry for oysters is present, particularly in the south shore coastal lagoon ecosystems.
3. Oysters have been commercially extinct in Narragansett Bay for decades, and those few wild populations that were observed in the 1990s appear to have succumbed to disease and/or over exploitation (Oviatt et al. 2003). Oysters once were common in the south shore lagoon ecosystems as well. Lee (1980) ties the loss of oysters in the salt ponds to the installation of permanent breachways, and Pfeiffer-Hebert (2007) notes that oysters have since been replaced by hard clams. More recently,

DRAFT Rhode Island Shellfish Management Plan!
PAGE 32 OF 308 CHAPTER 2: ECOLOGY SEPTEMBER 29, 2014
native oysters were found in Green Hill, Ninigret and Winnipaug Ponds (1960s and 1970s), but now are only found near freshwater sources in Green Hill Pond and Point Judith Pond (Pfeiffer-Hebert 2007).
4. Oyster reefs provide valuable ecosystem services, which have been summarized as: (1) oyster production, (2) water filtration and biodeposits concentration, (3) habitat provision, (4) carbon sequestration, (5) fishing resource augmentation, (6) stabilization of benthic and intertidal habitat, and (7) increased landscape diversity (Coen et al. 2007; Grabowski and Peterson 2007). zu Ermgassen et al. (2013) estimate a 64% decline in non-aquaculture oyster extent and an 88% loss of non-aquaculture oyster biomass in the United States between the early 1900s and the early 2000s, noting that this loss can be linked to observed water quality and/or habitat degradation.
5. The oyster is a reef building species, and reef structure influences local ecological conditions. A correlation between height of an oyster reef above bottom and oyster growth rate has been reported (Schulte et al. 2009). Flow rates are increased at height, replenishing food and rapidly removing wastes, resulting in increased oyster growth.
6. Figure 2.6 (a) shows the total wild harvest landings in Rhode Island for 2007–2013 for Eastern oysters9. There appears to be a decline in oyster landings in Narragansett Bay waters since 2007; variability in 2012–2013 landings however, makes any overall trend difficult to determine. Landings of oysters in the Sakonnet River and in the salt ponds both appear to be on the increase in recent years, with these areas providing more oysters recently than Narragansett Bay. Figure 2.6 (b) shows that for the salt ponds, Ninigret Pond is a dominant supplier of oysters, particularly in recent years.
9 Eastern oyster landing data for Narragansett Bay includes Upper Narragansett Bay, Conditional Area A and B, West Passage, East Passage, and High Banks. Greenwich Bay landings includes those for Greenwich Bay and Greenwich Bay Management Sub Area 1, 2, and 3. Sakonnet River landings include those for Sakonnet River, Sakonnet River Management Area, Bristol Harbor Transplant Area, Kickemuit Management Area, and Mount Hope Bay. Salt Ponds landings reflect those for Ninigret Pond, Point Judith Pond, Quonochontaug Pond, and Winnipaug Pond. Not all areas listed reported landings in each year, inserting considerable inconsistency in the data across years. See Figure 2.5 for location of various harvest areas.

DRAFT Rhode Island Shellfish Management Plan!
SEPTEMBER 29, 2014 CHAPTER 2: ECOLOGY PAGE 33 OF 308
Figure 2.6. Eastern oyster wild harvest landings for Rhode Island (a), and the salt ponds (b), 2007–2013 (Atlantic
Coastal Cooperative Statistics Program 2013).
220.2.2. Distribution 1. From a comparison of water quality data 1998–2007, Nau (2007) found that 95% of the ideal habitat
for oysters in Rhode Island waters was degraded and not suitable for oyster restoration. “Ideal” oyster habitat in Rhode Island waters is defined by Hines and Brown (2012) as having a salinity of 12–28 ppt, dissolved oxygen concentrations of 4–6 mg l-1, water temperature of 14–28°C, water depth of 0.5–3 meters, substrate consisting of sand, gravel and rock, and a sedimentary environment that has low depositional qualities, and is stable.
2. Oyster larvae have been reported in the water column from late June through September, with a peak in late August; larval settlement was found to be most intense mid-August to mid-September (Brown et al. 2013). The authors suggest that reestablishment of natural oyster populations from oyster aquaculture operations located in the salt ponds is both possible and probable.
3. Brown et al. (2013) report 56 acres of high quality habitat for oyster restoration in the northern reaches of the Narrow River ecosystem. Figure 2.8 shows the distribution of habitat suitable for the Eastern oyster in the Narrow River; highest quality oyster habitat10 is located at the very northern
10 The oyster habitat described by Brown et al. (2013) is with regard to habitat suitable for sustaining existing, or establishing new, wild populations of Eastern oyster, and should confused with suitability as sites for aquaculture.
0
50
100
150
200
250
2007 2008 2009 2010 2011 2012 2013
Tho
usan
ds o
f Oys
ters
Year
Oyster Landings - Rhode Island
Narragansett Bay
Greenwich Bay
Sakonnet River
Block Island
Salt Ponds
(a)
0
50
100
150
200
2007 2008 2009 2010 2011 2012 2013
Tho
usan
ds o
f Oys
ters
Year
Oyster Landings - Salt Ponds
Point Judith
Ninigret
Quonochontaug
Winnipaug
(b)

DRAFT Rhode Island Shellfish Management Plan!
PAGE 34 OF 308 CHAPTER 2: ECOLOGY SEPTEMBER 29, 2014
portion of the estuarine ecosystem. Currently the Narrow River is closed to all shellfish harvest activities.
4. For Point Judith Pond, Brown et al. (2013) found overall that the quality of habitat for oyster restoration was low. Figure 2.9 shows the distribution of habitat suitable for the Eastern oyster in the Point Judith Pond ecosystem; highest quality oyster habitat is located intermittently throughout the ecosystem, though mainly in the northern extent, on the south side of Ram Island, and in Potter Pond near the designated spawning sanctuary.
5. Within the shellfish sanctuary in Ninigret Pond, Brown et al. (2013) found higher oyster densities in the southern portion of the sanctuary, but note it could have been due to initial sanctuary stocking densities. They also note higher oyster survival in the southern portion of the pond, likely due to a higher abundance of potential predators (mud crab, blue crab, flatworms) in the northern pond, and the tendency for Gracilaria to bloom in the northern region and cause low dissolved oxygen conditions. Evidence of natural oyster recruitment was noted.
6. Figure 2.9 shows habitat quality for Eastern oysters in Ninigret Pond and Green Hill Pond. Overall, Brown et al. (2013) report poor quality habitat for oyster restoration in Ninigret Pond, with intermittent, sparse areas of moderately good habitat along the northern shore in the mid section of the pond; habitat quality in the spawning sanctuary is poor, with some moderate habitat quality along the northern shore of the sanctuary. For Green Hill Pond Brown et al. (2013) found that, despite no sanctuary in the pond, there is a large area of high quality habitat suitable to oyster restoration, most of it located along the southwest shoreline; pockets of good to very good habitat are found intermittently along the southern and eastern shorelines of Green Hill Pond.
7. Brown et al. (2013) report 24 acres of medium-high quality habitat for oyster restoration in the western section of the shellfish sanctuary in Quonochontaug Pond, and 6 acres in the eastern portion. Figure 2.11 shows the distribution of habitat quality in the pond, as noted above.
8. Brown et al. (2013) report 21 acres of medium-high to high quality habitat for oyster restoration in Winnipaug Pond. Figure 2.12 shows the distribution of habitat quality for Eastern oysters in the pond, showing that the northwestern shoreline contains the bulk of the highest quality habitat, and that the best habitat quality overlaps with that area designated as a spawning sanctuary.
9. The distribution of oysters were noted to be scattered in Great Salt Pond on Block Island (Ganz 1978, 1983, 1992; Ganz et al. 2000).

DRAFT Rhode Island Shellfish Management Plan!
SEPTEMBER 29, 2014 CHAPTER 2: ECOLOGY PAGE 35 OF 308
Figure 2.7. Distribution of habitat suitable for the Eastern oyster in the Narrow River (top) and southern Narrow River (bottom) (from Brown et al. 2013).

DRAFT Rhode Island Shellfish Management Plan!
PAGE 36 OF 308 CHAPTER 2: ECOLOGY SEPTEMBER 29, 2014
Figure 2.8. Distribution of habitat suitable for the Eastern oyster in Point Judith Pond (top) and Potter Pond
(bottom) (from Brown et al. 2013).

DRAFT Rhode Island Shellfish Management Plan!
SEPTEMBER 29, 2014 CHAPTER 2: ECOLOGY PAGE 37 OF 308
Figure 2.9. Distribution of habitat suitable for the Eastern oyster in the Ninigret Pond (top) and Green Hill Pond
bottom) (from Brown et al. 2013).

DRAFT Rhode Island Shellfish Management Plan!
PAGE 38 OF 308 CHAPTER 2: ECOLOGY SEPTEMBER 29, 2014
Figure 2.10. Distribution of habitat suitable for the Eastern oyster in Quonochontaug Pond (from Brown et al.
2013).
Figure 2.11. Distribution of habitat suitable for the Eastern oyster in Winnipaug Pond (from Brown et al. 2013).

DRAFT Rhode Island Shellfish Management Plan!
SEPTEMBER 29, 2014 CHAPTER 2: ECOLOGY PAGE 39 OF 308
220.3. Blue mussel (Mytilus edulis)
220.3.1. Ecology 1. The blue mussel is a common intertidal and subtidal bivalve that forms dense beds and provides
ecosystem services similar to those described for oyster reefs. Wild mussel harvest is inconsistent in Rhode Island waters, but mussel culture is a growing industry in Narragansett Bay; see Chapter 4 for more detail on mussel aquaculture.
2. The blue mussel ranges from Labrador (Canada) to Cape Hatteras (North Carolina), occurring in large mats that can become unstable and be uprooted during storms (Dame 2012). Major predators have been reported to be sea stars, large crustaceans, tautog, eider, and scoter (Newell 1989; Dame 2012). The dogwhelk (Nucella spp.) has been known to selectively feed on mussels and therefore can be a significant predator; sea stars can be a significant predatory force during times of population outbreaks (Seed 1993).
3. Blue mussels predominate in areas of good water flow that replenishes food supplies often. Mussels have been found to process higher volumes of water at low particle concentrations, then reducing feeding rates as food content of filtered water increases; optimal growth occurs at water temperatures between 10ºC and 25ºC (Brenko and Calabrese 1969).
4. The blue mussel hosts a commensal crustacean, the pea crab (Pinnotheres maculatus), which is most common in mussel populations south of Cape Cod (Massachusetts; Newell 1989). Bierbaum and Ferson (1986) found 69% of mussels in waters off Martha’s Vineyard were infected with pea crabs; in less optimal growing conditions, pea crab infected mussels exhibited slower rates of growth. The presence of pea crabs in mussels destined for consumption is a detriment, often reducing market value or making them unmarketable.
5. Because of their relatively small size, mussels can only keep their shells closed for up to 96 hours (Newell 1989); this may be a factor in the mortality seen in Narragansett Bay mussel populations during hypoxic events reported by Altieri (2008). Altieri and Witman (2006) report reduced mussel growth in Narragansett Bay hypoxia prone areas.
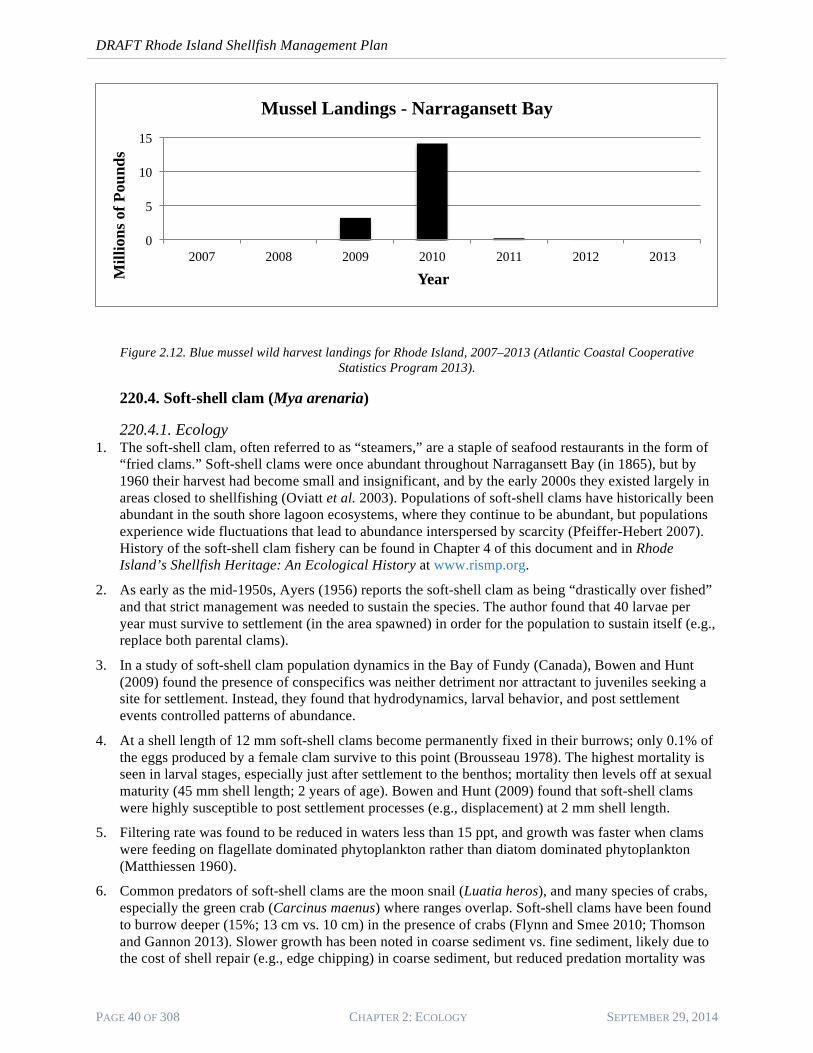
6. Figure 2.13 shows total wild harvest landings of blue mussels in Narragansett Bay for 2007–201311. Too little data are available for this species to determine trends over time; approximately 80 pounds of mussels were harvested in the salt ponds (2011 and 2012) and are not included in the Narragansett Bay data presented.
7. Mussels were reported as scarce in Great Salt Pond on Block Island (Russel et al., 1973; Ganz 1978).
11 Blue mussel landing data for Narragansett Bay includes Upper Narragansett Bay, West Passage, East Passage, and Potowomut Management Area. See Figure 2.5 for location of various harvest areas.
DRAFT Rhode Island Shellfish Management Plan!
PAGE 40 OF 308 CHAPTER 2: ECOLOGY SEPTEMBER 29, 2014
Figure 2.12. Blue mussel wild harvest landings for Rhode Island, 2007–2013 (Atlantic Coastal Cooperative Statistics Program 2013).
220.4. Soft-shell clam (Mya arenaria)
220.4.1. Ecology 1. The soft-shell clam, often referred to as “steamers,” are a staple of seafood restaurants in the form of
“fried clams.” Soft-shell clams were once abundant throughout Narragansett Bay (in 1865), but by 1960 their harvest had become small and insignificant, and by the early 2000s they existed largely in areas closed to shellfishing (Oviatt et al. 2003). Populations of soft-shell clams have historically been abundant in the south shore lagoon ecosystems, where they continue to be abundant, but populations experience wide fluctuations that lead to abundance interspersed by scarcity (Pfeiffer-Hebert 2007). History of the soft-shell clam fishery can be found in Chapter 4 of this document and in Rhode Island’s Shellfish Heritage: An Ecological History at www.rismp.org.
2. As early as the mid-1950s, Ayers (1956) reports the soft-shell clam as being “drastically over fished” and that strict management was needed to sustain the species. The author found that 40 larvae per year must survive to settlement (in the area spawned) in order for the population to sustain itself (e.g., replace both parental clams).
3. In a study of soft-shell clam population dynamics in the Bay of Fundy (Canada), Bowen and Hunt (2009) found the presence of conspecifics was neither detriment nor attractant to juveniles seeking a site for settlement. Instead, they found that hydrodynamics, larval behavior, and post settlement events controlled patterns of abundance.
4. At a shell length of 12 mm soft-shell clams become permanently fixed in their burrows; only 0.1% of the eggs produced by a female clam survive to this point (Brousseau 1978). The highest mortality is seen in larval stages, especially just after settlement to the benthos; mortality then levels off at sexual maturity (45 mm shell length; 2 years of age). Bowen and Hunt (2009) found that soft-shell clams were highly susceptible to post settlement processes (e.g., displacement) at 2 mm shell length.
5. Filtering rate was found to be reduced in waters less than 15 ppt, and growth was faster when clams were feeding on flagellate dominated phytoplankton rather than diatom dominated phytoplankton (Matthiessen 1960).
6. Common predators of soft-shell clams are the moon snail (Luatia heros), and many species of crabs, especially the green crab (Carcinus maenus) where ranges overlap. Soft-shell clams have been found to burrow deeper (15%; 13 cm vs. 10 cm) in the presence of crabs (Flynn and Smee 2010; Thomson and Gannon 2013). Slower growth has been noted in coarse sediment vs. fine sediment, likely due to the cost of shell repair (e.g., edge chipping) in coarse sediment, but reduced predation mortality was
0
5
10
15
2007 2008 2009 2010 2011 2012 2013
Mill
ions
of P
ound
s
Year
Mussel Landings - Narragansett Bay

DRAFT Rhode Island Shellfish Management Plan!
SEPTEMBER 29, 2014 CHAPTER 2: ECOLOGY PAGE 41 OF 308
significant for clams burrowing in coarse sediments (Thomson and Gannon 2013). Boulding (1984) reported no refuge from predation based on clam size.
7. Figure 2.14 (a) shows wild harvest landings for 2007–2013 for soft-shell clams taken in Narragansett Bay12 (note change in scale among graphs). Harvest from Narragansett Bay has dominated landings, but has seen a near continuous decline. Harvest from the salt ponds dominate landings from other areas (Figure 2.14 (b)), and have increased in recent years; Winnipaug Pond provides the dominant share, followed by Point Judith Pond (Figure 2.14 (c)).
8. Soft-shell clams were reported as scarce in Great Salt Pond on Block Island (Russell et al., 1973; Ganz 1978), and as scarce or absent by Campbell (1961).
12 Soft-shell clam landing data for Narragansett Bay includes Upper Narragansett Bay, Conditional Area A and B, West Passage, East Passage, Conimicut Triangle, Potowotmut Management Area A and Area C, Bissel Cove/Fox Island Management Area, and High Banks. Greenwich Bay landings includes those for Greenwich Bay and Greenwich Bay Management Sub Area 1, and 2. Sakonnet River landings include those for Sakonnet River, Sakonnet River Management Area, and Kickemuit Management Area. Salt Ponds landings reflect those for Ninigret Pond, Point Judith Pond, Quonochontaug Pond, and Winnipaug Pond. Not all areas listed reported landings in each year, inserting considerable inconsistency in the data across years. See Figure 2.5 for location of various harvest areas.

DRAFT Rhode Island Shellfish Management Plan!
PAGE 42 OF 308 CHAPTER 2: ECOLOGY SEPTEMBER 29, 2014
Figure 2.13. Wild harvest soft-shell clam landings for Narragansett Bay (a), areas outside of Narragansett Bay (b),
and the south shore salt ponds (c), 2007–2013 (Atlantic Coastal Cooperative Statistics Program 2013).
0 0.2 0.4 0.6 0.8
1 1.2 1.4
2007 2008 2009 2010 2011 2012 2013
Mill
ions
of P
ound
s
Year
Soft-shell Clam Landings - Narragansett Bay (a)
0 5
10 15 20 25 30 35 40
2007 2008 2009 2010 2011 2012 2013 Tho
usan
ds o
f Pou
nds
Year
Soft-shell Clam Landings - Other Areas
Greenwich Bay
Sakonnet River
Block Island
Salt Ponds
(b)
0
5
10
15
20
25
2007 2008 2009 2010 2011 2012 2013 Tho
usan
ds o
f Pou
nds
Year
Soft-shell Clam Landings - Salt Ponds
Point Judith
Ninigret
Quonochontaug
Winnipaug
(c)
DRAFT Rhode Island Shellfish Management Plan!
SEPTEMBER 29, 2014 CHAPTER 2: ECOLOGY PAGE 43 OF 308
220.5. Bay scallop (Argopectin irradians)
220.5.1. Ecology 1. The bay scallop has been historically abundant in Narragansett Bay, the Sakonnet River, and the
south shore salt ponds (Brown 1991). MacKenzie (2008) reports that in the late 1800s there existed a 90 boat scallop fleet in Rhode Island waters, with Greenwich Bay and Cowesett Bay being prime harvesting areas. Oviatt et al. (2003) note scallops as having been most abundant in Greenwich Bay in 1865, but that essentially no bay scallops have been taken in decades, suggesting the loss of eelgrass as a major factor. Scallops however, are considered to have been largely eliminated from Rhode Island waters as a result of brown tide events in 1985 and 1986 (Brown 1991; Coen and Grizzle 2007; Carroll et al. 2010), as well as from habitat loss associated with nutrient loading and changing ecological community make up (Carroll et al. 2010).
2. In a review of scallop ecology by MacKenzie (2008), it is noted that scallops prefer shallow water (3–10 ft) with firm bottom, preferentially with eelgrass, which enhances juvenile settlement and provides an above bottom attachment site as a partial refuge from predation; 60% mortality on eelgrass fronds vs. 90% on the sediment interface. The range of the bay scallop is Cape Cod (Massachusetts) to the Carolinas (Fay et al. 1983).
3. The health of bay scallop populations is often tied to the presence or absence of eelgrass (Zostera marina), with studies finding that increased seagrass abundance equals increased bivalve settlement (Bologna and Heck 2000; Carroll et al. 2010). These authors suggest that seagrass presence reduces flow velocity, and promotes epiphytic growth that again reduces flow velocity, which enhances bivalve larval settlement. Shriver et al. (2002) however, found that epibiont growth on scallop shell, which was correlated to increased nutrient availability (e.g., eutrophic conditions), reduced both scallop growth and Condition Index.
4. Scallop restoration success appears to be linked to eelgrass—presence improves scallop survival (Carrol et al. 2010). The authors note that Codium fragile, an introduced algae, can provide similar attributes to eelgrass for restoration, with no differences seen in scallop population recovery (on Long Island, New York) between eelgrass only and Codium only sites. The authors do however state that it is unclear whether or not Codium plays the same ecological role as eelgrass over the long term with regard to predator protection, or how hypoxia, which is common in Codium dominated waters, impacts scallop survival.
5. The green crab and blue crab (Callinectes sapidus) are the two most important predators of bay scallops in shallow waters, while sea stars are important in deeper waters, and gulls on a tidally mediated basis (Fay et al. 1983). MacKenzie (2008) reports oyster drill, knobbed whelk, mud crab, tautog, scup, and eider as predators of scallops. Cow-nosed rays are noted to be an important predator to the south, and may become important in New England waters as warming continues as a result of changing climate.
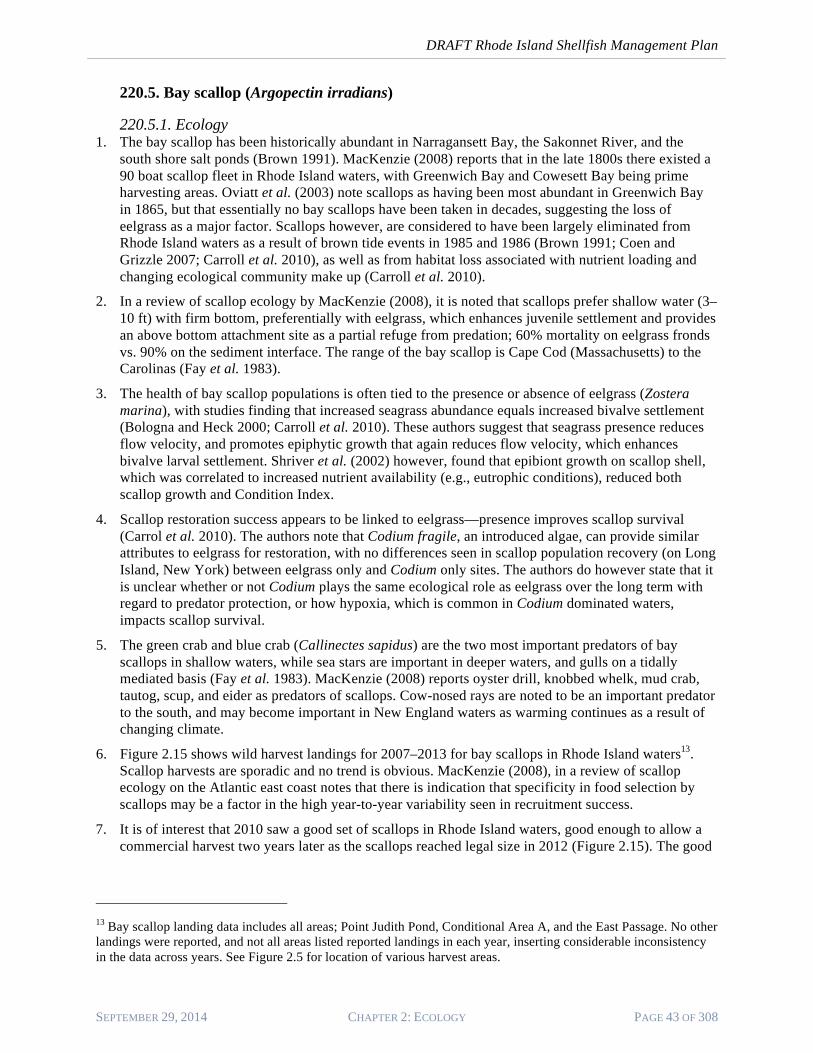
6. Figure 2.15 shows wild harvest landings for 2007–2013 for bay scallops in Rhode Island waters13. Scallop harvests are sporadic and no trend is obvious. MacKenzie (2008), in a review of scallop ecology on the Atlantic east coast notes that there is indication that specificity in food selection by scallops may be a factor in the high year-to-year variability seen in recruitment success.
7. It is of interest that 2010 saw a good set of scallops in Rhode Island waters, good enough to allow a commercial harvest two years later as the scallops reached legal size in 2012 (Figure 2.15). The good
13 Bay scallop landing data includes all areas; Point Judith Pond, Conditional Area A, and the East Passage. No other landings were reported, and not all areas listed reported landings in each year, inserting considerable inconsistency in the data across years. See Figure 2.5 for location of various harvest areas.

DRAFT Rhode Island Shellfish Management Plan!
PAGE 44 OF 308 CHAPTER 2: ECOLOGY SEPTEMBER 29, 2014
scallop set in 2010 is coincident with intense spring flooding, though any cause and effect is not readily known.
8. Scallops were reported to be found on Block Island in Cormorant Cove and Trim’s Pond (Russell et al. 1973), scattered in Great Salt Pond (Ganz 1978), and scarce or absent in the pond by Campbell (1961).
Figure 2.14. Wild harvest bay scallop landings for Rhode Island, 2007–2013 (Atlantic Coastal Cooperative
Statistics Program 2013).
Section 230. General Ecology—Gastropods 1. Whelks, often referred to as conchs, are gastropod molluscs that live in a coiled shell and resemble
large snails. Unlike bivalves, they are highly mobile, moving along by using a muscular foot that can be extended beyond the shell opening. Whelks have only recently become an important commercial consumer commodity, most often in the form of “snail salad” or “conch fritters,” though they have historically been harvested and consumed on a recreational basis. Further history of the whelk fishery can be found in Chapter 4 of this document.
2. There are two major species of whelk found in Rhode Island waters: knobbed whelk (Busycon carica) and the channeled whelk (Busycotypus canaliculatus). Both exhibit a range from Cape Cod to central Florida (Power et al. 2009). Magalhaes (1948) however, notes the channeled whelk to be as much as 5 to 6 times more common than the knobbed whelk in the Woods Hole area (based upon data reported for 1911 by Sumner, Osburn and Cole), and that knobbed whelk appear to prefer shallower, warmer waters; channeled whelk deeper, cooler waters.
3. Whelks tend to grow episodically, undergoing long periods of no growth, which makes management relying upon average annual rates of growth potentially misleading (Kraeuter et al. 1989). Power et al. (2009) report that whelk populations exhibit boom-and-bust cycles of abundance.
4. The largest whelks can be significant predators on bivalves, and have the ability to open the largest hard clams (Carriker 1951). Magalhaes (1948) reports crabs and gulls as common predators of whelks.
5. Whelk tend to be sedentary, spending long periods immobile, interspersed with active times where average travel distance per day was found to be 18 m, for those that did move at all (Magalhaes 1948). No evidence was found for migration of either whelk species to offshore waters (in North Carolina).
0
50
100
150
200
250
300
2007 2008 2009 2010 2011 2012 2013
Mea
t Pou
nds
Year
Bay Scallop Landings - Rhode Island

DRAFT Rhode Island Shellfish Management Plan!
SEPTEMBER 29, 2014 CHAPTER 2: ECOLOGY PAGE 45 OF 308
230.1. Channeled whelk (Busycotypus canaliculatus) 1. Channeled whelk tend to bury in sediment by day, and become more active at night and/or on cloudy,
overcast days (Bruce 2006). Whelk were found to spend on average 65% of their time buried in bottom sediments, making them less vulnerable to harvest by dredge or trawl (Carriker 1951); channeled whelk are primarily harvested by trap or pot gear (Bruce 2006).
2. Channeled whelk density in Nantucket Sound (Massachusetts) was found to be less than 5 whelks per 1,000 m2 in both 1978 and 1981 (Davis and Sisson 1988). Sisson (1972) estimated a whelk density of about 10 whelks per 1,000 m2 for Narragansett Bay, while Wood (1979) found whelk densities from 11.49 to 17.42 per 1,000 m2 for Narragansett Bay.
3. Because of their low reproductive potential and slow growth, management concerns for channeled whelk are significant (Harding 2011; Peemoeller and Stevens 2013). With females being larger (than males), they tend to be targeted for harvest which will lead to a female-only harvest, leaving behind males and sexually immature females, which will not lead to sustainable populations (Power et al. 2009; Peemoeller and Stevens 2013).
4. In Buzzards Bay (Massachusetts), channeled whelk reached sexual maturity at a shell width of 89.7 mm, which is 20 mm greater than minimum legal harvest size (Peemoeller and Stevens 2013); the authors conclude that since females are harvested before they reproduce, the fishery is likely in jeopardy.
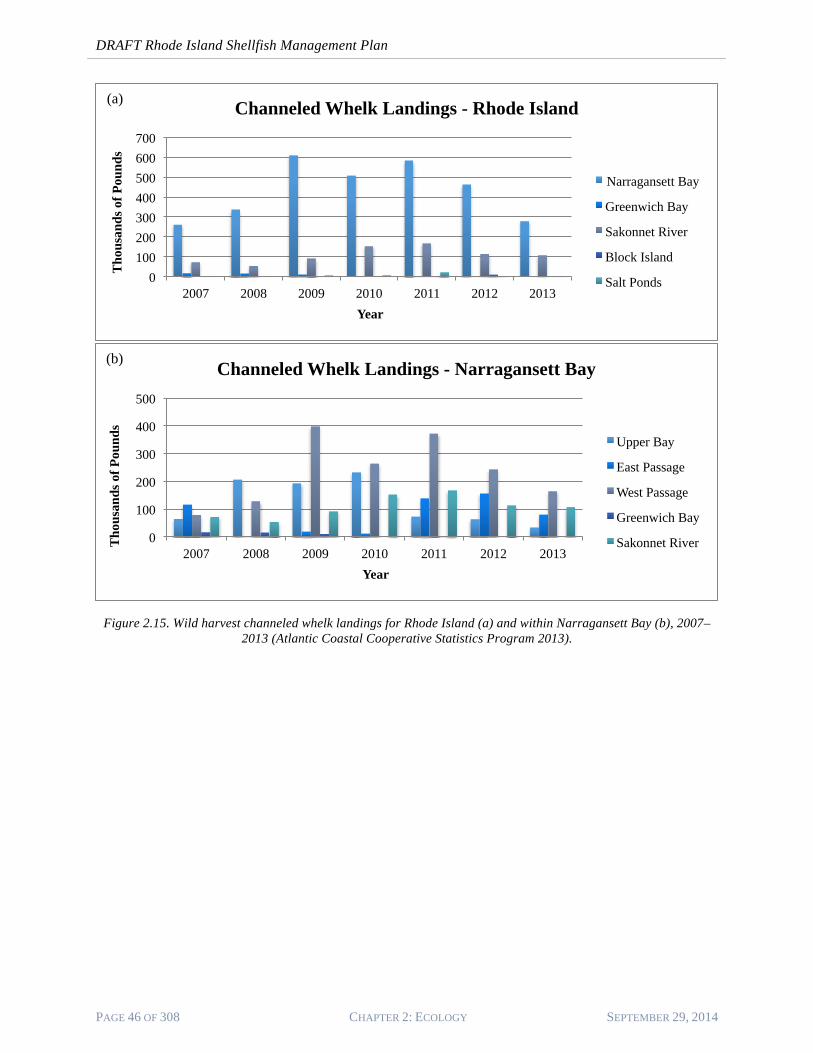
5. Figure 2.16 (a) shows wild harvest landings for channeled whelk in Rhode Island waters14. Narragansett Bay is the largest supplier of channeled whelk, followed by the Sakonnet River. Within Narragansett Bay (Figure 2.16 (b), the West Passage, Upper Bay, and Sakonnet River supply the majority of channeled whelk. Landings show a declining trend since 2011 in all areas.
14 Channeled whelk landing data for Narragansett Bay includes Upper Narragansett Bay, Conditional Area A and B, West Passage, East Passage, Conimicut Triangle, Potowotmut Management Area A and Area C, Bissel Cove/Fox Island Management Area, and High Banks. Greenwich Bay landings includes those for Greenwich Bay and Greenwich Bay Management Sub Area 1, 2, and 3. Sakonnet River landings include those for Sakonnet River, Sakonnet River Management Area, Kickemuit Management Area, Bristol Harbor and Mount Hope Bay. Salt Ponds landings reflect those for Ninigret Pond, Point Judith Pond, Quonochontaug Pond, and Winnipaug Pond. Upper Bay landing data are for Upper Narragansett Bay, Conditional Area A and Area B. West Passage landing data are for the West Passage, Conimicut Triangle, Potowomut Management Area A and Area C, Bissel Cove/Fox Island, and High Banks. Not all areas listed reported landings in each year, inserting considerable inconsistency in the data across years. See Figure 2.5 for location of various harvest areas.
DRAFT Rhode Island Shellfish Management Plan!
PAGE 46 OF 308 CHAPTER 2: ECOLOGY SEPTEMBER 29, 2014
Figure 2.15. Wild harvest channeled whelk landings for Rhode Island (a) and within Narragansett Bay (b), 2007–
2013 (Atlantic Coastal Cooperative Statistics Program 2013).
0 100 200 300 400 500 600 700
2007 2008 2009 2010 2011 2012 2013
Tho
usan
ds o
f Pou
nds
Year
Channeled Whelk Landings - Rhode Island
Narragansett Bay
Greenwich Bay
Sakonnet River
Block Island
Salt Ponds
(a)
0
100
200
300
400
500
2007 2008 2009 2010 2011 2012 2013
Tho
usan
ds o
f Pou
nds
Year
Channeled Whelk Landings - Narragansett Bay
Upper Bay
East Passage
West Passage
Greenwich Bay
Sakonnet River
(b)

DRAFT Rhode Island Shellfish Management Plan!
SEPTEMBER 29, 2014 CHAPTER 2: ECOLOGY PAGE 47 OF 308
230.2. Knobbed whelk (Busycon carica) 1. Knobbed whelk tend to associate with mud and sand bottoms, and prefer live prey over carrion/bait
(Bruce 2006), which may explain why they are less likely to enter whelk traps or pots.
2. Knobbed whelk are very adept at finding prey through chemically mediated cues, even at flow speeds as high as 15 cm sec-1 (Ferner and Weissburg 2005). Their slow moving nature may assist in chemical cue tracking.
3. Work done by Eversole et al. (2008) on knobbed whelk found that 95% of the individuals marked and recaptured over a one-month time span showed no shell growth, and that 47% showed negative shell growth due to shell loss from shell chipping, which is a common occurrence in whelk feeding on heavy-shelled bivalves such as hard clams.
4. Due to their low reproductive potential, limited movement, slow growth, and large size at maturity, knobbed whelk are highly susceptible to over harvesting (Castagna and Kraeuter 1994; Walker et al. 2004; Eversole et al. 2008).
5. Figure 2.17 shows wild harvest landings of knobbed whelk in Narragansett Bay waters15. Landings are sporadic with no trends apparent, though 2013 landings show a significant increase, especially in the West and East Passages of Narragansett Bay.
Figure 2.16. Wild harvest knobbed whelk landings for Narragansett Bay, 2007–2013 (Atlantic Coastal Cooperative
Statistics Program 2013).
Section 240. Ecosystem Services Provision 1. Ecosystem services are processes through which ecosystems and the species that make them up
sustain and fulfill human life, providing essential life support services without which human civilization would cease to thrive (Dame 2012). Filter feeding bivalves, by the processes involved in filtering water during feeding, for instance, provide a water quality service by removing particulates
15 Knobbed whelk landing data for Upper Narragansett Bay includes Upper Narragansett Bay, and Conditional Area A and Area B. West Passage data include the West Passage and Conimicut Triangle. East Passage data are for the East Passage only. Greenwich Bay landings are for Greenwich Bay only. Sakonnet River landings include those for Sakonnet River and Mount Hope Bay. Salt Ponds landings reflect those for Ninigret Pond, Point Judith Pond, Quonochontaug Pond, and Winnipaug Pond. Not all areas listed reported landings in each year, inserting considerable inconsistency in the data across years. See Figure 2.5 for location of various harvest areas.
0
5000
10000
15000
20000
2007 2008 2009 2010 2011 2012 2013 Year
Knobbed Whelk Landings - Narragansett Bay
Upper Bay
East Passage
West Passage
Greenwich Bay
Sakonnet River

DRAFT Rhode Island Shellfish Management Plan!
PAGE 48 OF 308 CHAPTER 2: ECOLOGY SEPTEMBER 29, 2014
in the water column. Reef building bivalves, such as mussels and oysters, provide shoreline protection services by reducing wave strength hitting the shore and thereby slowing erosional processes. The following provides a description of some of the known important ecosystem services provided by filter feeding bivalve populations.
240.1. Nutrient Reduction/Water Quality Improvement 1. Shellfish restoration, particularly for reef building species such as mussels and oysters, increases an
estuaries ability to improve water quality through filtration (Needles et al. 2013). Asmus and Asmus (1993) conclude: “The interaction between mussel beds and phytoplankton is a key process within the material exchange between benthic and pelagic species.” As major consumers of phytoplankton, a loss of filter feeder concentrations (e.g., oyster reefs, mussel beds, hard clam aggregations) in eutrophic systems provides a positive feedback mechanism for hypoxia as phytoplankton are no longer heavily consumed by the bivalves (Altieri and Witman 2006).
2. Ecosystem services provided by oyster reefs has been summarized as: (1) production of oysters, (2) water filtration and concentration of pseudofeces, (3) provision of habitat for epibenthic invertebrates, (4) carbon sequestion, (5) augmented fish production, (6) stabilization of adjacent habitats and shoreline, and (7) diversification of the landscape and ecosystem (Grabowski and Peterson 2007; Coen et al. 2007). The National Research Council (2005) suggests a similar listing of ecosystem services, but includes enhanced water clarity improvement and alteration of hydrography in shallow water ecosystems.
3. Bivalves, as filter feeders, remove plankton and particulates from the water column—an adult soft-shell clam can filter 4 liters of water per hour, and an adult Eastern oyster can filter as much as 14 liters of water per hour (Bertness 2007; Rice 2001). For the Providence River, Rice et al. (2000) calculated a filtering capacity of 2 x 10⁷ m3 (5.3 billion gallons) per day (in August) by the hard clam population. Newell (1988) calculated a 3.3 day clearance time16 for the Chesapeake Bay in the late 1800s, but 325 days in 2007 due to the dramatic decline in oyster reef extent. Dame (2012) estimates that Narragansett Bay has a bivalve clearance time of 25 days.
4. Dense aggregates of bivalves can exert a controlling effect on phytoplankton abundance, resulting in improved water clarity and general eutrophication control (Alpine and Cloern 1992; Asmus and Asmus 1993; Dame 2012). As such, filter feeding bivalves serve as a critical link between primary production in the water column and the benthic ecosystem (Bertness 2007; Higgins et al. 2011, 2013), particularly since they do so on a consistent, long-term basis as permanent residents of the ecosystem, though impact on water quality may vary seasonally (Dame 2012). Loss of this ecosystem service in the Chesapeake Bay has been credited to have resulted in increased suspended sediments and decreased water clarity, and with those, a loss of eelgrass beds (Newell 1988; Carmichael et al. 2012).
5. Bivalve aggregations—oyster reefs and mussel beds for instance—are significant elements of nutrient recycling between benthos and water column (Asmus and Asmus 1993; Coen and Grizzle 2007; Dame 2012; Grabowski and Peterson 2007; Prins et al. 1998; Sisson et al., 2011; Smaal and Prins 1993). Particulate organic matter is removed during filter feeding and returned to bottom sediments as feces and pseudofeces. Nitrogen is then recycled by sediment microbes where it is nitrified17 for reuse by phytoplankton, or denitrified18 and released to the atmosphere (Giles and Pilditch 2006; Sisson et al., 2011; Higgins et al. 2013). Sisson et al. (2011) found that 21% of the organic N underwent
16 Clearance time is the theoretical time needed for the total bivalve-suspension feeder biomass within an ecosystem to filter all particles from the entire volume of water in the aquatic ecosystem in question (Dame 2012). 17 Nitrification is a naturally occurring process carried out by nitrifying bacteria in which ammonia, produced by the breakdown of organic materials, is converted to nitrites and nitrates which become available for use by aquatic plants. 18 Denitrification is a naturally occurring process, performed by denitrifying bacteria, that converts nitrates back into nitrogen gas which can then be released back into the atmosphere.

DRAFT Rhode Island Shellfish Management Plan!
SEPTEMBER 29, 2014 CHAPTER 2: ECOLOGY PAGE 49 OF 308
nitrification, and 12% underwent denitrification, being released back to the environment for biological uptake, at an oyster reef in the Chesapeake Bay. The authors do note however, that rate of nitrogen use and conversion were very seasonal (September for their work) as well as site specific, and some caution should be applied in transferring those rates to other places or times. Urine excretion by bivalves (as ammonia) is rapidly taken up in the water column by phytoplankton for growth (Giles and Pilditch 2006; Newell 2004). In this way bivalve aggregates help control eutrophication while at the same time rapidly recycling nutrients to promote continued phytoplankton growth that sustains the bivalve community. Newell (2004) notes that the biggest impact to benthic-pelagic coupling will come from those species that maintain high clearance rates and produce excess pseudofeces. Smaal and Prins (1993) sum the process of benthic-pelagic coupling in shellfish aggregates as: (1) filtration of large quantities of material from the water column, (2) reduction of phytoplankton (with possible local depletion), (3) biodeposition of high quality organic material, (4) remineralization of biodeposits, (5) inorganic nutrient release to the water column, and (6) increased availability of dissolved nutrients.
6. Work by Cerco and Noel (2007) on eutrophication control by oysters in Chesapeake Bay found that improvements to water clarity, while site specific, ranged from 25–100% increases in submerged aquatic vegetation biomass. Based on their model, a ten-fold increase in oyster biomass in the Chesapeake Bay would account roughly for the nitrogen added by atmospheric deposition. The authors note that while not a solution to eutrophication, increased oyster biomass can be part of an overall ecosystem-based approach to nutrient management. Newell (2004) however, points out that increased water clarity could result in increased macroalgal growth, which in turn could promote hypoxia as it dies and decays. As part of a global assessment of oyster reefs, Beck et al. (2009) suggest that oyster reefs should be managed for their provision of ecosystem services, not just as a harvestable commodity as is current practice.
7. Shellfish remove nutrients from the water column, and tie them up in shell and tissue. Nutrient removal however, may only be partial if harvested shellfish are consumed locally and wastes returned to the ecosystem. Net removal of nutrients only becomes reality when shellfish are harvested and then transported out of the ecosystem (Dumbauld et al. 2009).
8. Evidence presented by Higgins et al. (2011) suggests that cultured oysters, which tend to be thinner shelled than wild oysters, will result in less nitrogen removal than that originally calculated by Newell (2004; 0.52 g N and 0.16 g P for a 7.6 cm oyster—3 to 4 years old—with a 150 g shell and 1 g dry tissue). Kellogg et al. (2011) give a value of 0.21% (of dry weight) for shell and 9.27% for tissue, as nitrogen content for oysters, and Sisson et al. (2011) give 0.15% (of dry weight) for shell and 5.96% for tissue, for hard clams. Rice (2001) estimates that 5,600 oysters harvested are the equivalent of removing the nitrogen produced by one individual human in one year, and Sisson et al. (2011) give a first order estimate for nitrogen removal through denitrification by oyster reefs as 103 lbs. per acre per year.
9. Shellfish aquaculture, or very dense bivalve beds, have the potential to over fertilize the benthos and reduce dissolved oxygen content (Prins et al. 1998), but only when found at very high densities. It is also possible that increased water column nutrient availability could result, enhancing phytoplankton growth and reducing water clarity (Dumbauld et al. 2009).
10. There is no clear consensus on whether or not bivalve aggregations promote nitrogen sequestration in marine sediments. Rice et al. (2000) note that in areas where dense bivalve aggregates exist and there is no harvest, biodeposits, such as pseudofeces, accumulate in the sediments and may increase denitrification rates and/or burial of nitrogen in benthic sediments. However, based on their findings that nitrogen is rapidly recycled in the sediments, largely as ammonia which is readily taken up by phytoplankton for growth, Higgins et al. (2013), and Newell (2004), conclude that oyster aquaculture does not increase, or decrease, nitrogen removal from the sediments and therefore does not provide a significant management option for storage of nitrogen in coastal sediments.
DRAFT Rhode Island Shellfish Management Plan!
PAGE 50 OF 308 CHAPTER 2: ECOLOGY SEPTEMBER 29, 2014
11. Based on work conducted in the Chesapeake Bay, Gerritsen et al. (1994) found that suspension feeders (e.g., oysters) located in shallow water had a greater impact on the control of phytoplankton than those in deeper waters, concluding that often times nutrient control is already at maximum in those areas where control is possible, and that restoration (of oyster reefs) needs to be well planned to have any significant nutrient control impacts.
240.2. Habitat Provision 1. Shellfish create four kinds of habitats: (1) reefs—oysters and mussels, (2) aggregations—surf clams,
hard clams, (3) shell accumulations—surf clams, hard clams, and (4) aquaculture grounds (Coen and Grizzle 2007).
2. Mussel beds and oyster reefs provide a refuge from predation for infaunal organisms and influence the characteristics of the predator community, provide a refuge from physical stressors by modifying flow patterns, and modify the benthos through the delivery of particulates (Altieri and Witman 2006; Bertness 2007; Borthagaray and Carranza 2007; Coen and Grizzle 2007; Grabowski and Peterson 2007).
3. Because they create new and/or increase available niche space, species richness (e.g., biodiversity) has been found to be significantly higher at mussel bed sites versus sites without mussel beds, regardless of exposure or tidal patterns; species richness declined as size of the mussel bed declined (Borthagaray and Carranza 2007). Rodney and Paynter (2006) found that sites with restored oyster reefs had higher species diversity for fish species and benthic macrofauna than non-restored sites.
4. Oyster reefs were found (relative to areas with no oyster reef) to have enhanced 19 species of fish—10 by enhancing recruitment and 9 by enhancing growth; pelagic bait-fish and small demersal fishes were the most enhanced species (Peterson et al. 2003).
240.3. Spawning Sanctuary 1. There is no clear consensus on the utility and/or effectiveness of spawning sanctuaries for bivalve
population maintenance and sustainability in Narragansett Bay and the south shore lagoon ecosystems.
2. Based on anecdotal information from clam harvesters, there is a strong belief, based on existing high adult clam densities, that the Providence River, the spawning sanctuary at the mouth of Greenwich Bay, Greenwich Cove, Rome Point, Hog Island, and Rocky Point, are significant sources of larvae to Narragansett Bay hard clam populations (Lazar et al. 1994; Leavitt et al. 2013). The entire Providence River area, historically closed to shellfishing, has been considered a spawning sanctuary that supplies much of Narragansett Bay with hard clam larvae, and is anecdotally considered by many to be an important element of a sustainable hard clam fishery. Mercer (2013) suggests that Closed Areas may contribute as much as half the effective reproductive potential of the Bay. As water quality continues to improve, particularly in upper Narragansett Bay, previously closed areas may be opened to harvest, raising concern that larval supplies (of hard clam) may be reduced (Leavitt et al. 2013).
3. Modeled runs of larval releases from various sites throughout Narragansett Bay were found to show significant variability regarding larval retention, suggesting that high adult densities do not necessarily equate to importance as a larval source in sustaining the population (Leavitt et al. 2013; see 220.1.2.8. for details).
4. Rice et al. (1989) found higher juvenile hard clam densities in areas of lower adult clam densities, suggesting that spawning sanctuaries may have greatest ecological impact in reseeding areas maintained at low adults densities through harvesting, or for reseeding new or naturally low adult density habitats.
5. In a study of hard clam spawning sanctuary effectiveness in Great South Bay on Long Island (New York), Doall et al. (2008) reported that spawning sanctuary contribution to the population was

DRAFT Rhode Island Shellfish Management Plan!
SEPTEMBER 29, 2014 CHAPTER 2: ECOLOGY PAGE 51 OF 308
greatest in the first year post transplant into the sanctuary, then variable afterwards (the authors note that poor clam Condition Index during transplant may be partially responsible for results).
6. Adult hard clams consume conspecifics when filter feeding (Bricelj 1992; Marroquin-Mora and Rice 2008), therefore dense concentrations of feeding adults, such as those found in spawning sanctuaries, have the potential to negatively impact larval settlement.
7. Based on a comparison of hard clam reproduction in fished vs. non-fished populations, Marroquin-Mora and Rice (2008), found that in dense populations of bivalves, such as those typical in spawning sanctuaries/closed areas, competition for food resulted in lower Condition Index, reduced gonad development and reproductive output, both of which limit contribution to recruitment. The authors conclude that Closed Areas (e.g., spawning sanctuaries) may have only limited value, if any, as significant larval sources to Narragansett Bay because of the reduced Condition Index associated with high density clam populations.
8. Aquaculture sites have the potential to act as sources of larvae that could assist in sustaining natural populations of shellfish or for establishing new populations.19 Figures 2.18 (a) Narragansett Bay and (b) Salt Ponds, show the location of existing aquaculture operations in Rhode Island waters, and which may contribute larvae for establishment and/or maintenance of bivalve populations.
19 Those operations raising triploids will not provide larval contributions as triploids are sterile.

DRAFT Rhode Island Shellfish Management Plan!
PAGE 52 OF 308 CHAPTER 2: ECOLOGY SEPTEMBER 29, 2014
Figure 2.17. Location of aquaculture operations in Narragansett Bay (a) and Salt Ponds (b).
(b)
(a)

DRAFT Rhode Island Shellfish Management Plan!
SEPTEMBER 29, 2014 CHAPTER 2: ECOLOGY PAGE 53 OF 308
Section 250. Ecological Carrying Capacity 1. Webster’s Dictionary defines ecological carrying capacity as the maximum population size of a
species that can be sustained on a perpetual basis without deterioration. An understanding of ecological carrying capacity can be used to estimate limitations of ecosystems for management purposes.
2. Current levels of oyster aquaculture are considered to be having no negative impact on the Narragansett Bay ecosystem (Byron et al. 2011a). In fact, the authors develop a model that when applied to Narragansett Bay, calculates that it could undergo an increase in oyster aquaculture of 625% (e.g., 0.0095 g DW m-2 to 5.93 g DW m-2; 0.47 t km-2 to 297 t km-2) before it would exceed the Bay’s ecological carrying capacity. At it’s calculated ecological carrying capacity, approximately 26% of the Bay’s surface area (1,121 t km-2) would be under aquaculture use. As a point of reference, historic peak oyster biomass, which occurred in 1911, would have covered 21% of the Bay’s surface if current production standards were applied (Byron et al. 2011a); 5% is currently the maximum allowable by state regulation (Byron et al. 2011c).
3. Based on modeled ecological carrying capacity, Byron et al. (2011b) estimate that oyster biomass could be increased by 62 times above current levels in the south shore coastal lagoon ecosystems (0.233 g DW m-2 to 14.5 g DW m-2; 11.65 t km-2 to 722 t km-2); this is approximately 46% of total pond surface area (1,561 t km-2; Byron et al. 2011b,c). The authors however, suggest that a target of 50% of ecological carrying capacity is a reasonable management target for the salt ponds.
4. Rhode Island currently manages aquaculture according to surface area under production, which may be misleading because changes in aquaculture technologies and methodologies may not be accounted for adequately. For instance, growers will seek to maximize their production per unit area, and if successful, can potentially exceed ecological carrying capacity that is calculated based solely upon surface area under production.
Section 260. Fished vs. Non-fished Populations 1. Oyster reefs have been referred to as “one of the most imperiled marine habitats on earth,”—an 85%
reduction in oyster reefs globally (from historic levels), largely as a result of destructive fishing practices and disease, has been calculated (Beck et al. 2009). The decline in oysters from overharvesting (and disease) in Chesapeake Bay led to species shifts, and an ecosystem shift from suspension feeder/benthic processing domination to pelagic grazer dominated (Newell 1988; Newell et al. 2005).
2. Harvesting individuals from populations has impacts, both positive and negative. Shellfish populations have been harvested in Rhode Island waters since human habitation, and by the late 1880s Goode (1881) reports on the over harvesting of oysters in Narragansett Bay. Hard clams, which became the dominant shellfish species of economic importance after collapse of the oyster industry, remained as a wild fishery. Due to water quality issues keeping large areas out of the fishery, hard clam populations did not rapidly come to the same endpoint, and in 1954 the Rhode Island Department of Environmental Management began a transplant program to move hard clams from closed waters to conditionally harvested waters (Rice et al. 2000).
3. Hard clams in Conditionally Harvested areas in Narragansett Bay were found to mature earlier, and spawned early relative to closed areas (e.g., Providence River, Greenwich Cove; Marroquin-Mora and Rice 2008). The authors further found that highest Condition Index was associated with Conditionally Harvested Areas, and that these areas had a clam density of about 5 clams m-2, which is in agreement with optimal clam density reported by Kraeuter et al. (2005). Sparsis et al. (1992) note that bivalves in fished populations are consistently smaller and younger than those in non-fished populations; Walker (1989) concludes similarly for hard clams.
4. In a comparison of dredged vs. non-dredged clam beds, Goldberg et al. (2012) found that dredged beds (left fallow 3-5 years post dredging) vs. non-dredged were not significantly different with regard
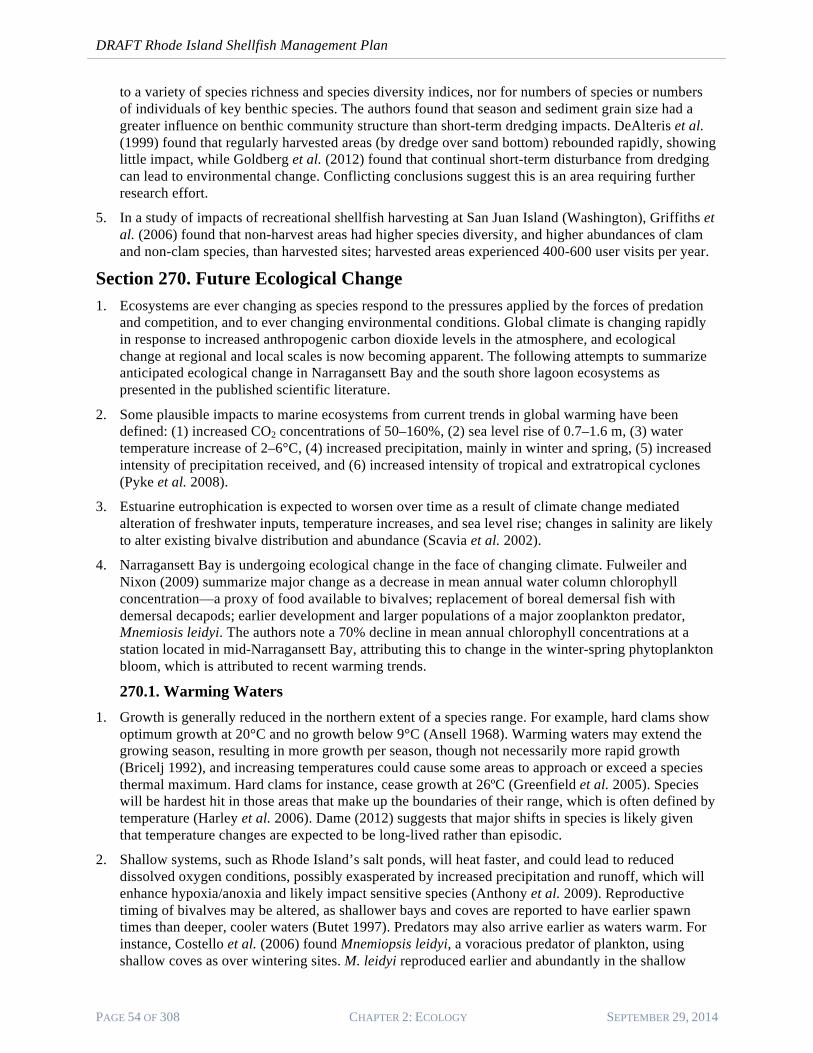
DRAFT Rhode Island Shellfish Management Plan!
PAGE 54 OF 308 CHAPTER 2: ECOLOGY SEPTEMBER 29, 2014
to a variety of species richness and species diversity indices, nor for numbers of species or numbers of individuals of key benthic species. The authors found that season and sediment grain size had a greater influence on benthic community structure than short-term dredging impacts. DeAlteris et al. (1999) found that regularly harvested areas (by dredge over sand bottom) rebounded rapidly, showing little impact, while Goldberg et al. (2012) found that continual short-term disturbance from dredging can lead to environmental change. Conflicting conclusions suggest this is an area requiring further research effort.
5. In a study of impacts of recreational shellfish harvesting at San Juan Island (Washington), Griffiths et al. (2006) found that non-harvest areas had higher species diversity, and higher abundances of clam and non-clam species, than harvested sites; harvested areas experienced 400-600 user visits per year.
Section 270. Future Ecological Change 1. Ecosystems are ever changing as species respond to the pressures applied by the forces of predation
and competition, and to ever changing environmental conditions. Global climate is changing rapidly in response to increased anthropogenic carbon dioxide levels in the atmosphere, and ecological change at regional and local scales is now becoming apparent. The following attempts to summarize anticipated ecological change in Narragansett Bay and the south shore lagoon ecosystems as presented in the published scientific literature.
2. Some plausible impacts to marine ecosystems from current trends in global warming have been defined: (1) increased CO2 concentrations of 50–160%, (2) sea level rise of 0.7–1.6 m, (3) water temperature increase of 2–6°C, (4) increased precipitation, mainly in winter and spring, (5) increased intensity of precipitation received, and (6) increased intensity of tropical and extratropical cyclones (Pyke et al. 2008).
3. Estuarine eutrophication is expected to worsen over time as a result of climate change mediated alteration of freshwater inputs, temperature increases, and sea level rise; changes in salinity are likely to alter existing bivalve distribution and abundance (Scavia et al. 2002).
4. Narragansett Bay is undergoing ecological change in the face of changing climate. Fulweiler and Nixon (2009) summarize major change as a decrease in mean annual water column chlorophyll concentration—a proxy of food available to bivalves; replacement of boreal demersal fish with demersal decapods; earlier development and larger populations of a major zooplankton predator, Mnemiosis leidyi. The authors note a 70% decline in mean annual chlorophyll concentrations at a station located in mid-Narragansett Bay, attributing this to change in the winter-spring phytoplankton bloom, which is attributed to recent warming trends.
270.1. Warming Waters 1. Growth is generally reduced in the northern extent of a species range. For example, hard clams show
optimum growth at 20°C and no growth below 9°C (Ansell 1968). Warming waters may extend the growing season, resulting in more growth per season, though not necessarily more rapid growth (Bricelj 1992), and increasing temperatures could cause some areas to approach or exceed a species thermal maximum. Hard clams for instance, cease growth at 26ºC (Greenfield et al. 2005). Species will be hardest hit in those areas that make up the boundaries of their range, which is often defined by temperature (Harley et al. 2006). Dame (2012) suggests that major shifts in species is likely given that temperature changes are expected to be long-lived rather than episodic.
2. Shallow systems, such as Rhode Island’s salt ponds, will heat faster, and could lead to reduced dissolved oxygen conditions, possibly exasperated by increased precipitation and runoff, which will enhance hypoxia/anoxia and likely impact sensitive species (Anthony et al. 2009). Reproductive timing of bivalves may be altered, as shallower bays and coves are reported to have earlier spawn times than deeper, cooler waters (Butet 1997). Predators may also arrive earlier as waters warm. For instance, Costello et al. (2006) found Mnemiopsis leidyi, a voracious predator of plankton, using shallow coves as over wintering sites. M. leidyi reproduced earlier and abundantly in the shallow

DRAFT Rhode Island Shellfish Management Plan!
SEPTEMBER 29, 2014 CHAPTER 2: ECOLOGY PAGE 55 OF 308
coves (e.g., Greenwich Cove in Greenwich Bay), which then acted as a “source population” for a rapid population expansion of this ctenophore species throughout Narragansett Bay.
3. The Rhode Island coastal lagoons are predicted to see an air temperature increase of 1.9–6.9°C by 2100, sea level rise will cause increased incidence of barrier breaching and erosion, and extensive loss of coastal wetlands; storms will hasten and worsen these impacts (Anthony et al. 2009). Seagrass will be impacted by temperature increases, increased water depth, and salinity changes, and seagrass dependent species will be impacted with resultant species shifts. Lagoon species have been found to respond to increased temperature physiologically, such as through altered feeding rates, metabolic and growth rate changes, while coastal species largely respond with changes in reproductive conditioning (Vania et al. 2014).
4. Larval stages, and during reproduction, are when bivalves are most sensitive to temperature, but the broad seasonal thermal shifts of temperate zones have resulted in bivalves that have broad thermal tolerance (Dame 2012). Each species however, has thermal thresholds that once approached or exceeded, because of changing climatic conditions for instance, has high potential to result in species replacement; these changes will be most evident at the northern and southern limits of a species existing range (Harley et al. 2006).
5. Spawning sanctuaries in Narragansett Bay—Greenwich Cove, Warwick Cove, Providence River—all experience frequent hypoxic conditions, creating stress that results in lower clam Condition Index (Marroquin-Mora and Rice 2008). Increasing water temperatures will likely exacerbate hypoxia occurrence, further increasing stress.
6. In a study of hard clam shell growth in Narragansett Bay, Henry and Cerrato (2007) found that in the 1960s to early 1970s shell growth was rapid in spring, summer and fall; slow shell growth only occurred during winter months. In the mid 1970s to early 1980s they found a shift to slower growth in summer, and by the mid 1980s slow growth was occurring frequently in summer, fall, and winter, with rapid growth only occurring in spring months. Clams collected in 2005/2006 were found to have the same shell growth patterns as hard clams collected in the late 1980s in New Jersey waters (Grizzle and Lutz 1989). The authors suggest that the 1.5°C increase in water temperature observed in Narragansett Bay causes summer water temperatures to frequently exceed 20°C, the upper limit for optimal growth of hard clams, this causing the trend for decreased shell growth over time. The authors do note that change in phytoplankton dynamics—change in timing and intensity of the winter-spring bloom, and phytoplankton species shifts—may have some role in changed shell growth patterns.
7. Hard clam growth rate was found to be correlated to warming water temperatures, but not to chlorophyll concentrations, suggesting that change in hard clam shell growth may be temperature driven (Henry and Cerrato 2007; Henry and Nixon 2008). The authors found that hard clams that settled in the 1980s and 1990s took six months longer to reach legal size (33.12 mm) than those that had settled between 1960 and 1970. The authors found reduced shell growth only in clams aged 2 years or less, and a more rapid rate of shell growth for clams 3–10 years old. The authors conclude that a shift in species dominance in the phytoplankton community may be causing the observed patterns in hard clam growth rate, but that further research is needed to show if nutritional differences between phytoplankton species exists, and if that could be the driver of these changes.
8. In a study of bivalves in the Wadden Sea (Northwestern Europe), Philippart et al. (2003) found that warming waters decreased reproductive output and moved the spawning season earlier (for Macoma balthica). The authors did not find a corresponding shift in the timing of seasonal phytoplankton blooms, and so less food was available to bivalves, particularly to pelagic phase larvae. They also observed earlier spawning of a major predatory shrimp species, which would imply great predation pressure on already stressed juveniles as they settle to the benthos. The authors predict a decline in abundance of Macoma as a result of warming waters, noting that this could have impact upon bird populations that feed heavily on this species. Beukema and Dekker (2205) in a similar study in the Wadden Sea found a 15-year trend in milder winters was responsible for early predation by shrimp,

DRAFT Rhode Island Shellfish Management Plan!
PAGE 56 OF 308 CHAPTER 2: ECOLOGY SEPTEMBER 29, 2014
and attributed this as a major factor in the cockle population crash. Given that New England is trending towards milder winters, similar forms of ecosystem change are possible, if not likely.
270.2. Changing Predators 1. Green crabs (Carcinus maenus) and mud crabs (Panopeus spp.) are significant bivalve predators in
New England waters; the blue crab (Callinectes sapidus), while a more significant predator to the south, is a seasonally important predator (Bertness 2007) that will become more abundant, and therefore more significant as it expands its range northward as waters continue to warm (Pratt et al. 1992).
2. In the Wadden Sea (Netherlands) Beukema and Dekker (2005) found that a 15-year trend of mild winters has increased shrimp abundance, a major predator of commercially valuable bivalves. As a result, continuing years of poor recruitment has occurred, harming the fishery for cockles significantly.
3. Henry and Nixon (2008) note that a change in Narragansett Bay from demersal fish dominance to demersal decapod dominance may play a role in observed trends in reduced hard clam shell growth rates; predator preference has been shown to reduce feeding which results in reduced rates of growth in bivalves (Nakaoka 2000).
270.3. Changing Competitors 1. Long-lived, successional climax species may be challenged by short-lived, opportunistic species,
especially invasive species, as changing climate mediates rapid environmental change in nearshore waters (Harley et al. 2006).
2. A strong correlation has been found between the successful recruitment of introduced species (e.g., ascidians) and increased mean winter temperature, and a negative correlation between increased winter water temperature and the success of native species recruitment (Stachowitcz et al. 2002). Given that community composition is often a result of “who gets there first in the greatest numbers,” introduced species have a distinct advantage; the authors found recruitment of introduced species was three times greater than native species (at Avery Point, Groton, Connecticut) after the warmest winter, while native species recruitment was five times higher after the coldest winter (the difference between warmest and coldest winter was 3°C). It is important to note that correlations were not evident through the observation of mean annual temperatures, indicating the importance of seasonality. The authors also found more rapid growth of introduced species in warmer waters, and they conclude that it is likely to see an increase in invasive species in the future, with a resultant decline in native species as waters continue to warm.
270.4. Increased Precipitation 1. Uncertainty exists around changes in regional patterns, but there is agreement on increased extreme
rainfall events and drought-flood cycles, which could impact salinity regimes and hypoxia onset, depending upon timing and extent (Anthony et al. 2009).
2. Hard clams find a refuge to predation in waters undergoing hypoxic conditions, suggesting that clams are more hypoxia tolerant than their major predators found in Narragansett Bay (Altieri 2008). However, the improvement in survivorship is small, and the relationship does not necessarily hold for other species of bivalves. For instance, Altieri and Witman (2006) report mass mortality and local extinction of mussels in Narragansett Bay due to severe hypoxia.
3. Ocean circulation patterns may change as wind patterns shift with changing climate; this could alter distribution patterns of species that have planktonic larvae (Harley et al. 2006).
4. In a study of larval transport in Narragansett Bay, Leavitt et al. (2013) note the importance of the spring freshet in driving estuarine circulation. As climate change brings altercations in timing, type, and volume of precipitation to New England, circulation patterns in Narragansett Bay may change, and in so doing, alter the patterns of hard clam (and other marine organisms) larval distribution.

DRAFT Rhode Island Shellfish Management Plan!
SEPTEMBER 29, 2014 CHAPTER 2: ECOLOGY PAGE 57 OF 308
Pilson (2008) predicts changing wind patterns over Narragansett Bay as a result of warming climate, which will also likely effect circulation and larval drift.
5. Surface water runoff events to coastal waters, which carry carbonic acid from organic decomposition, have been correlated with episodic reduced pH events, which create suboptimal conditions for shell growth in bivalves (Salisbury et al. 2008). The authors note that increased precipitation could promote poor growth conditions for bivalves in coastal waters.
270.5. Disease 1. Haplosporidium nelsoni (MSX) and Perkinsus marinus (Dermo), two key oyster parasites of concern
that at present are found in low concentrations in Rhode Island waters, have both shown recent northward expansion (Andamari et al. 1996; Hoffman et al. 2001). Both parasites affect oysters maximally during summer months (June to October), generally by reducing feeding rate and growth, though extreme infection can lead to mortality (Barber et al. 1988).
2. Dermo has been noted to be making a steady northward progression while MSX is moving northward in an irregular and patchy fashion (Hoffman et al. 2001). The authors suggest this pattern may be a result of Dermo’s being transmitted oyster-to-oyster while MSX is though some as yet to be identified intermediate host. The authors further note a positive correlation between MSX abundance and preceding winter temperatures; given that New England winters are warming faster than summers, MSX may find favorable conditions for spreading in this region.
3. Vibrio are naturally occurring estuarine bacteria that are capable of impacting human health. To date Rhode Island outbreaks have been rare (e.g., 1981; Cox and Gomez-Chiarri 2013), but Vibrio abundance has been found to be correlated to water temperature (Cox and Gomez-Chiarri 2012). As water temperatures continue to rise as a result of climate warming, increased incidence of Vibrio may follow.
4. Rhode Island took a proactive stance against Vibrio in 2014; through collaboration between the aquaculture industry, state and federal agancies, Universities, and facilitated by CRC, the state created the first Vibrio Control Plan for oysters (See Appendix 6.1)
270.6. Ocean Acidification 1. While there is great uncertainty regarding the effects of ocean acidification on coastal ecosystems
(Royal Society 2005), pH has declined by 0.1 units20 since 1760, and is expected to decrease another 0.1–0.5 units, or by 0.3–0.4 units in this century (Orr et al. 2005; Miller et al. 2009; Waldbusser et al. 2010). Estuaries and shallow coastal waters will be most susceptible to pH changes (Miller et al. 2009), and higher latitudes will see the greatest changes in pH (Pelejero et al. 2010). Pelejero et al. (2010) make note that surface pH is already more acidic than it has been in the past 20 million years, and that by the end of the century pH conditions that have not been experienced in the past 40 million years are likely. Talmage and Gobler (2009) report that some coastal areas (e.g., Shinnecock Bay, Long Island, New York) are already experiencing conditions that experiments on increased ocean acidification show are detrimental to bivalve prosperity. Impacts to bivalves are being reported as occurring at pH values as high 7.8 (Clements and Hunt 2014); the authors suggest that such conditions are more common than considered and likely play a role in globally decreasing bivalve
20 pH is a measure of the acidity (or basicity) of a solution; a pH less than 7 is acid, more than 7 is alkaline, and 7 is neutral. pH is measured on a logarithmic scale, meaning that an increase in pH of 1 is a ten-fold increase in concentration; an increase of 2 pH units is a 100-fold increase, and 3 pH units the equivalent of a 1,000-fold increase. Because of this, even small changes in pH equate to large changes in acidity (or alkalinity).

DRAFT Rhode Island Shellfish Management Plan!
PAGE 58 OF 308 CHAPTER 2: ECOLOGY SEPTEMBER 29, 2014
populations. Green et al. (2013) report similarly, finding conditions in South Portland Harbor (Maine) that promote shell dissolution21.
2. Impacts of reduced pH in coastal waters for organisms that use calcium carbonate (CaCO3) to secrete shells will be that the process of calcification will be impeded as pH decreases (Royal Society 2005). Furthermore, as ocean water acidifies (e.g., pH decreases), secreted shell material becomes more susceptible to dissolution. If shell secretion takes greater energy input, and maintenance of shell becomes more onerous as dissolution increases, then it can be expected that bivalves may see reduced growth and/or reduced reproductive output because of these energy diversions. These impacts may be felt the greatest by bivalve larvae (Talmage and Gobler 2010, 2009), which are highly susceptible to ocean acidification, particularly at the point where they take up a benthic life style where mortality can already reach as high as 98% (Royal Society 2005). Clements and Hunt (2014) found that soft-shell clam juveniles were less enticed to burrow into sediments with a reduced pH (e.g., 6.8–7.8), and that dispersal rates (via bedload transport) were increased. This suggests that changing pH in shallow water marine sediments will play a role, perhaps major, in bivalve distribution patterns.
3. Shell dissolution mortality is size dependent for hard clams—clams of 0.2 mm size saw 90% mortality from shell dissolution while other size classes saw 50% mortality when tested under acidification conditions likely to be experienced in shallow, New England coastal waters (Green et al. 2009). The authors note that they found shell dissolution at 2 sites in Casco Bay (ME), and that surface sediments where juvenile bivalves settle after metamorphosis is exactly where pH concentrations in the sediments were lowest (Green et al. 2013). Waldbusser et al. (2010) found that all size classes of hard clams tested (0.39–2.90 mm shell height) were effected by increased CO2/reduced pH, but that smallest sized clams were the most impacted. Smallest sized clams for instance, were unable to secrete new shell and some saw shell dissolution. Beniash et al. (2010) found that at pH levels around 7.5 juvenile Eastern oysters exhibited increased mortality rates, and that shell structure was reduced in hardness and was more prone to fracturing (than oysters kept at pH 8.5).
4. In a study conducted in Rhode Island waters, Still and Stolt (in review) found that despite high variability in subaqueous soil pH (e.g., 7.35 in highly organic soils to 7.97 in sandy soils), some areas already have pH soil conditions that can induce physiological stress, shell dissolution and mortality on recently set juvenile bivalves. The authors recorded subaqueous soil pH values (from pooled samples taken in the upper 5 cm) of 7.20–7.95 in Greenwich Bay, 7.33–8.10 in Ninigret Pond, 7.08–7.82 in Quonochontaug Pond, and 7.03–7.78 in Wickford Harbor. At one site in Ninigret Pond that was a site of groundwater input to the pond, the authors measured a pH of 6.42 in the upper 2 cm, and they noted a 10-fold increase in shell loss (e.g., shell dissolution) at this site when compared to shell loss in sandy subaqueous soils. pH measurements during this study were taken during summer months, a time that coincides with bivalve settling times in Rhode Island waters.
5. While such conditions are not predicted over the next few centuries, Kurihara et al. (2008) found that CO2 levels elevated to 2,000 ppm (approximately 380 ppm today; 1,000 ppm by 2100; Royal Society 2005) had significant impacts on larval development of mussels; only 0.2% developed into normal D-shaped larvae. Gazeau et al. (2007) found a 25% decrease in mussel calcification rate at the 740 ppm CO2 concentration predicted for 2100, and found that mussel shell dissolved at 1,800 ppm. Kurihara et al. (2007) found that only 4–5% of oyster embryos developed into normal larvae when exposed to CO2 levels expected by 2300.
6. Increased mortality of hard clams and bay scallops was observed at increased levels of CO2 approximating future conditions (950–1,500 ppm; Talmage and Gobler 2010). Decreased shell thickness, altered shell hinge structure, and shell pockmarking with holes and/or actual shell
21 Shell dissolution is the process of the calcium carbonate, which makes up bivalve shell material, dissolving as a result of being in a corrosive environment, such as that created at the sediment water interface as pH decreases.

DRAFT Rhode Island Shellfish Management Plan!
SEPTEMBER 29, 2014 CHAPTER 2: ECOLOGY PAGE 59 OF 308
dissolution was also observed. The bay scallop was more susceptible to increasing ocean acidification than was the hard clam, and both were more susceptible than the Eastern oyster (Talmage and Gobler 2009).
7. Susceptibility to increased CO2/reduced pH may be at least partially mediated by genetics. Waldbusser et al. (2010) found differing abilities of hard clams taken from differing sources to calcify shell. This may be an important consideration for restoration and/or aquaculture of this species.
270.7. Nutrients 1. Lagoon ecosystems will be particularly vulnerable to eutrophication impacts of climate change due to
the restricted nature of their openings and how tidal exchange is limited (Lloret et al. 2008). The authors postulate that as water depth increases (from sea level rise) and turbidity increases (from increased runoff) that photic depth will decrease and dominant macroalgae will decline, converting the ecosystem to one that is plankton dominated.
2. Based on nitrogen enrichment patterns in hard clams, Oczkowski et al. (2008) suggested that Narragansett Bay clams feed upon phytoplankton grown in the upper bay on anthropogenic nitrogen, and therefore the majority of their food is from sewage derived nitrogen. The authors note that planned nitrogen reductions of 50% will likely not lead to a 25% reduction in clam productivity, but will likely show some decline in Narragansett Bay secondary production.
3. Those ecosystems most likely to show favorable conditions for eutrophication control will be shallow in depth, have an abundant nutrient supply, no critical light, temperature or turbidity limitations, be poorly flushed, and have a dense filter feeding community comprised of small animals (Officer et al. 1982).
270.8. Harmful Algal Blooms 1. Paralytic shellfish poisoning (PSP), diarrhetic shellfish poisoning (DSP), neurotoxic shellfish
poisoning (NSP), and amnesic shellfish poisoning (ASP), are all associated with various harmful algal blooms that impact shellfish populations (Shumway 1990). While the toxins associated with bloom organisms do not directly (or rarely) effect the bivalves ingesting them, the algal species may be of poor food quality (Shumay 1990) and/or may elicit a reduced feeding response (Tracey 1988), either of which stresses bivalves.
2. Alexandrium species are the most common PSP organisms found in Rhode Island waters, but have not yet increased to bloom proportions, though outbreaks are becoming both more common and more severe in the New York Bight region (Borkman et al. 2012). Borkman et al. (2012) report the presence of a new species, Alexandrium peruvianum, which could be a public health threat as it produces fast acting toxins, and favors near shore, low salinity, high nutrient habitats.
3. Brown tide events in 1985 and 1986 had severe impacts on scallop abundance, and Brown (1991) reports these events to be the cause of elimination of bay scallop populations in Rhode Island in all but a few isolated areas.
4. Although present, Diarrhetic Shellfish Poisoning (DSP) was not found to be a significant problem in Narragansett Bay waters (Maranda and Shimizu 1987).
DRAFT Rhode Island Shellfish Management Plan!
PAGE 60 OF 308 CHAPTER 2: ECOLOGY SEPTEMBER 29, 2014
Section 280. Recommendations The following is a comprehensive, non-prioritized list of recommendations developed by the Technical Advisory Committee (TAC) for this chapter based on the extensive list of issues identified by stakeholders throughout the SMP process (Appendix 2.2). The TAC coordinators were Azure Cygler, CRC/URI and Alan Desbonnet, RISG. The TAC for this chapter had six members:
Candice Oviat, GSO/URI Carrie Byron, UNE
Tom Uva, NBC Alan Desbonnet, RISG Robbie Hudson, STB
David Ullman, GSO/URI
Decisions to include any recommendation put forth by the TAC was made by consensus then discussed through the SMP Coordinating Team.
The list of recommendations represent the initial steps to identify actions necessary to improve the way the shellfish resource and associated activities are managed in Rhode Island for the benefit of all. As such, every stakeholder group – including management agencies, industry, civic and environmental organization, and citizens – is responsible for accomplishing the listed recommendations. The recommendations do not discuss logistical items (i.e. funding, lead person/group); these items will be addressed in the SMP implementation plan and research agenda that will follow the SMP document.
While these recommendations are all considered important and can benefit the shellfish resources/industry in many ways, it is important to note that the state agencies will need to prioritize these recommendations due to strained resources. In addition, 2015 will mark changes in administration due to the 2014 elections, which will bring new priorities which are a challenge to foresee and plan for. Therefore, while it is the hope and intention of the SMP that these recommendations will be implemented, it is likely that challenges such as funding sources, shifting government leadership, etc. will lead to prioritization of these recommendations.
1. Borkman et al. (2012) suggest monitoring for biotoxins, which while still found only locally at present, are becoming more widespread and severe in recent years. Shumway (1990) suggests the use of satellite imagery to monitor and track algal blooms. A dialog should be started to further define the need and the positives and negatives of monitoring harmful algal blooms in Rhode Island waters. This dialog should also consider dovetailing harmful algal bloom monitoring efforts, if warranted, with ongoing monitoring for bivalve disease organisms such as MSX, Dermo, and others, so that a comprehensive monitoring program is in place that neither overlaps nor conflicts with other programs and efforts.
2. Higgins et al. (2011) suggest using oyster aquaculture as part of a nutrient trading program, and provide some values for nitrogen and phosphorus removal typical of oysters raised in aquaculture settings (e.g., Chesapeake Bay). A dialog should be started to explore shellfish nutrient trading programs in existence, and the potential for development of nutrient trading systems using cultured shellfish in Rhode Island.
3. Planting of shell cultch has been suggested as a mechanism to buffer pH change in sediments (Green et al., 2009, 2013), and numerous references note improved settlement of various bivalves species in the presence of shell material (Kassner 1995; Carriker 1961). Given the potential multiple benefits of planting shell cultch, further effort should be expended to better define the benefits of planting cultch, barriers to cultch use (e.g., USACE “fill” definition issues), and the potential for using cultch in Rhode Island waters. Green et al. (2013) go so far as to say that shell planting is an important shellfish management tool.
4. Continue to improve the Leavitt et al. (2013) model for larval disbursal so that it can be used to simulate future precipitation scenarios that are likely given changing climate, and to then use that

DRAFT Rhode Island Shellfish Management Plan!
SEPTEMBER 29, 2014 CHAPTER 2: ECOLOGY PAGE 61 OF 308
information for management of spawning sanctuaries. Existing model runs suggest that wind, and perhaps tidal phase at larval release time, may be significant components of larval dispersal and should be investigated more thoroughly and incorporated into the model as appropriate.
5. Research of larval behavior in settlement site selection is needed as it is poorly defined at present in the scientific literature, yet appears to be a critical element defining the abundance and distribution of adult populations. Impacts of subaqueous soil pH change should be a consideration for study as it relates to bivalve larval settlement.
6. Hines and Brown (2012) note that a Site Suitability Index model developed by North et al. (2010) is particularly robust, and would be a useful tool for Rhode Island if the proper data were available. Assess the degree of difficulty and cost of data collection relative to the value of being able to identify oyster habitat, and develop a plan to collect the needed data, if warranted.
7. Discussion of the likely outcomes and impacts of changing climate on bivalve populations and the ecological community they are a part of should be undertaken, and mitigation and adaptation strategies developed around them so that the shellfish industry is better prepared for future conditions.
8. Habitat improvement recommendations for oyster reefs and soft-shell clams should be developed, and sites for restoration and improvement identified.
9. Production per unit area will vary by grower, based on their management regime to maintain and/or improve shellfish production; this needs to be considered in any ecosystem-based management scheme for shellfish in Rhode Island, and for considering the ecological carrying capacity of ecosystems for shellfish aquaculture. This will need some research to better define production per unit area based on farm management techniques.
10. A holistic approach to shellfish management should be taken, and as such, care should be taken to implement recommendations and to conduct management in ways that multiple outcomes and/or benefits are considered. This holistic approach needs to incorporate both ecological as well as sociological issues, research, and findings.
11. There is a need for research to better quantify the correlation between eelgrass and aquaculture (e.g., improved light penetration/reduced turbidity) so that an ecosystem-based approach to planning aquaculture and eelgrass restoration can be pursued. These efforts should be aware of and point out the potential “Catch-22” of eelgrass presence limiting the expansion/use of bottom for aquaculture; growers should not be “punished” for providing the conditions that lead to increased eelgrass health and its resulting expansion.
12. There should be a discussion around the creations of an “available for aquaculture” or “best sites for aquaculture” map and/or database for use in promoting the growth of aquaculture in Rhode Island. This should be done in a way that will reduce conflict and improve permitting and decision-making efficiency. Such a map should show ecological parameters that promote good shellfish growth, and descriptions of use of waters (e.g., boating, fishing, etc.) to best avoid conflicting uses.
13. Adaptive shellfish management should be the norm for Rhode Island, evaluating management regimes every few years so that new research, new techniques and technologies, and new understanding of coastal ecosystems, particularly in light of changing climatic conditions, can be amended into management and planning.
14. A dialog should be started that addresses the need to not excessively reduce nutrient inputs to Narragansett Bay during winter months so that sufficient nutrients are available to primary producers to fuel critical winter-spring phytoplankton blooms. There may be research needed to define what a “critical level” of nutrients is, specifically for Narragansett Bay, and should include need for research on nitrogen reduction leading to bivalve food limitation.
15. A program should be developed to evaluate spawning sanctuaries, their use overall in Rhode Island, and their effectiveness in promoting and sustaining bivalve populations. This should include a clear

DRAFT Rhode Island Shellfish Management Plan!
PAGE 62 OF 308 CHAPTER 2: ECOLOGY SEPTEMBER 29, 2014
definition of what is meant by “effectiveness” of a spawning sanctuary as there is some contention that they serve little purpose because in dense concentrations adults have lower reproductive output. Questions such as: Is that better than no output? How much better is it? and Is that enough to justify designating and managing areas as spawning sanctuaries? need to be asked and answered.
16. Pea crabs are a barrier to successful, inshore mussel aquaculture in Rhode Island; there is a need for research into mechanisms that can lead to the elimination of pea crabs from mussels grown in Rhode Island coastal waters.
17. Henry and Nixon (2008) suggest research be conducted on the nutritional values of the differing Skeletonema species of Narragansett Bay, and to relate these findings to reported changes in hard clam shell growth rates to determine any cause-and-effect. Such information may have implications for shellfish management.
18. There is a need for research into the role of Codium fragile, and other species that have been reported, or have the potential, to act as replacement (for eelgrass) settlement substrate. This research must consider the long-term roles replacement species play in the ecology of scallop populations. Special emphasis should be placed on how replacement species act as settlement substrate regarding habitat enhancement and predator protection in areas where eelgrass has been lost.
19. Research on Mercenaria genotypes and for increased ability to calcify under conditions of increased CO2/reduced pH should be undertaken. This information may be useful in managing this species sustainably as ocean acidification progresses.
20. Further research is needed to more clearly define the impacts, or lack thereof, of harvesting on shellfish populations, particularly using dredge harvest techniques.
21. Information is needed on the role of shellfish as potential eutrophication mitigation mechanisms in Rhode Island waters. Specifically, storage of nitrogen in shellfish and the amount removed and exported from the ecosystem under various harvesting and consumption schemes, and on long-term storage of nitrogen in sediments, if any, in bivalve communities.
22. Scientific research needs must be prioritized, time frames for needed research information developed, and possible funding mechanisms identified and where possible secured.
23. There is the need for integration of contemporary understanding about shellfish ecology, fishery economics, and social science implications in Rhode Island into a holistic framework, so that this can be applied to resource management initiatives.
24. Research suggests that whelk populations are likely to be over harvested due to pressure on the population from an excessive taking of females because of their larger size. Better information on size–age structure of whelk populations in Rhode Island waters is needed, and needs to form the basis for management to ensure sustainability.
Section 290. References (Chapter 2) Alpine, A.E. and J.E. Cloern. 1992. Trophic interactions and direct physical effects control phytoplankton
biomass and production in an estuary. Limnology and Oceanography 37(5):946-955.
Altieri, A. H. 2008. Dead zones enhance key fisheries species by providing predation refuge. Ecology 89(10):2808-2818.
Altieri, A.H. and J.D. Witman. 2006. Local extinction of a foundation species in a hypoxic estuary: integrating individuals to ecosystem. Ecology 87:717-730.
Andamari, R., M.A. Rice and P.P. Yevich. 1996. A survey of disease in the oyster Crassostrea virginica (Gmelin, 1791) in Rhode Island coastal estuaries. The Wasnmann Journal of Biology 51(1-2): 39-54.
Ansell, A.D. 1968. The rate of growth of the hard clam Mercenaria mercenaria throughout the geographical range. Journal du Conseil International pour l’Exloration de la Mer 31:364-409.

DRAFT Rhode Island Shellfish Management Plan!
SEPTEMBER 29, 2014 CHAPTER 2: ECOLOGY PAGE 63 OF 308
Anthony, A., J. Atwood, P. August, C. Byron, S. Cobb, C. Foster, C. Fry, A. Gold, K. Hagos, L. Heffner, D.Q. Kellogg, K. Lellis-Dibble, J. Opaluch, C. Oviatt, A. Pfeiffer-Herbert, N. Rohr, L. Smith, T. Smythe, J. Swift and N. Vinhateiro. 2009. Coastal lagoons and climate change: ecological and social ramifications in U.S. Atlantic and Gulf Coast ecosystems. Ecology and Society 14(1):8 online: www.ecologyandsociety.org/vol14/iss1/art8/
Arnold, W.S. 1984. The effects of prey size, predator size, and sediment composition on the rate of predation of the blue crab, Callinectes sapidus Rathbun, on the hard clam, Mercenaria mercenaria (Linne). Journal of Experimental Marine Biology and Ecology 80:207-219.
Asmus, H. and R.M. Asmus. 1993. Phytoplankton-mussel bed interactions in intertidal ecosystems. In: Bivalve Filter Feeders in Estuarine and Coastal Ecosystem Processes, R.F. Dame (ed.), Springer-Verlag, Berlin. pp. 57-84.
Atlantic Coastal Cooperative Statistics Program. 2013. Rhode Island Shellfish Landings. Accessed May 9, 2014; generated by John Lake using ACCSP Data Warehouse, Arlington, VA. www.accsp.org.
Ayers, J. 1956. Population dynamics of the marine clam, Mya arenaria. Limnology and Oceanography 1(1):26-34.
Barber, B.J., S.E. Ford and H.H. Haskin. 1988. Effects of the parasite MSX (Haplosproridium nelsoni) on oyster (Crassostrea virginica) energy metabolism: I. Condition index and relative fecundity. Journal of Shellfish Research 7:25-31.
Beck, M.W., R.D. Brumbaugh, L. Airoldi, A. Carranza, L.D. Coen, C. Crawford, O. Defeo, G.J. Edgar, B. Hancock, M. Kay, H. Lenihan, M.W. Luckenbach, C.L. Toropova and G. Zhang. 2009. Shellfish reefs at risk: a global analysis of problems and solutions. The Nature Conservancy, Arlington, VA. 52 pp.
Beniash, E., A. Ivanina, N. Lieb, I. Kurochkin and I. Sokolava. 2010. Elevated level of carbon dioxide affects metabolism and shell formation in oysters Crassostrea virginica (Gmelin). Marine Ecology Progress Series 419:95-108.
Bertness, M.D. 2007. Atlantic Shorelines: Natural History and Ecology. Princeton University Press, NJ. 431 pp.
Beukema, J.J. and R. Dekker. 2005. Decline of recruitment success in cockles and other bivalves in the Wadden Sea: possible role of climate change, predation on postlarvae and fisheries. Marine Ecology Progress Series 287:149-167.
Bierbaum, R.M. and S. Ferson. 1986. Do symbiotic pea crabs decrease growth rate in mussels? Biological Bulletin 170:51-61.
Bologna, P.A.X. and K.L. Heck. 2000. Impacts of seagrass habitat architecture on bivalve settlement. Estuaries 23(4):449-457.
Borkman, D.G., T.J. Smayda, C.R. Tomas, R. York, W. Strangman and J.L.C. Wright. 2012. Toxic Alexandrium peruvianum (Balech and de Mendiola) Balech and Tangen in Narragansett Bay, Rhode Island (USA). Harmful Algae 19:92-100.
Borthagaray, A. and A. Carranza. 2007. Mussels as ecosystem engineers: their contribution to species richness in a rocky littoral community. Acta Oecologica 31:243-250.
Boulding, E.G. 1984. Crab-resistant features of shells of burrowing bivalves: decreasing vulnerability by increasing handling time. Journal of Experimental Marine Biology and Ecology 76:201-223.
Bowen, J. and J. Hunt. 2009. Settlement and recruitment patterns of the soft-shell clam, Mya arenaria, on the northern shore of Bay of Fundy, Canada. Estuaries and Coasts 32:758-772.
Brenko, M.H. and A. Calabrese. 1969. The combined effects of salinity and temperature on larvae of the mussel, Mytilus edulis. Marine Biology 4:224-226.

DRAFT Rhode Island Shellfish Management Plan!
PAGE 64 OF 308 CHAPTER 2: ECOLOGY SEPTEMBER 29, 2014
Bricelj, V.M. 1992. Aspects of the biology of the northern quahog, Mercenaria mercenaria, with emphasis on growth and survival during early life history. In: Proceedings of the Second Rhode Island Shellfish Industry Conference, Rice, M.A. and D. Grossman-Garber (eds.), Rhode Island Sea Grant RIU-W-92-002, Narragansett, RI. pp. 29-48.
Brousseau, D.J. 1978. Population dynamics of the soft-shell clam Mya arenaria. Marine Biology 50:63-71.
Brown, S.B., K. Ruddock, J. O’Brien, G. Casabona and J.A. Bachand. 2013. Environmental Quality Incentives Program (EQIP)—Oyster Restoration: Final Programmatic Report. USDA Natural Resource Conservation Service, Conservation Technical Assistance Program,
Brown, W.G. 1991. The Rhode Island Scallop Restoration Program. In: Proceedings of the First Rhode Island Shellfisheries Conference, Rice, M.A., M. Grady and M.L. Schwartz (eds.), Rhode Island Sea Grant RIU-W-90-003, Narragansett, RI. pp. 89-91.
Bruce, D.G. 2006. The whelk dredge fishery of Delaware. Journal of Shellfish Research 25(1):1-13.
Butet, N.A. 1997. Distribution of quahog larvae along a north-south transect in Narragansett Bay. Master of Science Thesis, University of Rhode Island, Kingston, RI. 85 pp.
Byron, C., J. Link, B. Costa-Pierce, and D. Bengtson. 2011a. Calculating ecological carrying capacity of shellfish aquaculture using mass-balance modeling: Narragansett Bay, Rhode Island. Ecological Modeling 1743-1755.
Byron, C., J. Link, B. Costa-Pierce and D. Bengtson. 2011b. Modeling ecological carry capacity of shellfish aquaculture in highly flushed temperate lagoons. Aquaculture 314:87-99.
Byron, C., D. Bengtson, B. Costa-Pierce and J. Calanni. 2011c. Integrating science into management: ecological carrying capacity of bivalve shellfish aquaculture. Marine Policy 35:363-370.
Campbell, R. 1961. Report of the shellfish survey of Block Island, Rhode Island 1961. Leaflet No. 9., Division of Fish and Game, Rhode Island Department of Agriculture and Conservation
Carmichael, R.H., A.C. Shriver and I. Valiela. 2012. Bivalve response to estuarine eutrophication: the balance between enhanced food supply and habitat alterations. Journal of Shellfish Research 31(1):1-11.
Carriker, M.R. 1961. Interrelation of functional morphology, behavior, and autecology in early stages of the bivalve Mercenaria mercenaria. Journal of the Elisha Mitchell Scientific Society 77:168-241.
Carriker, M.R. 1951. Observations on the penetration of tightly closing bivalves by Busycon and other predators. Ecology 32:73-83.
Carrol, J.M., B.J. Peterson, D. Bonal, A. Weinstock, C.F. Smith and S.T. Tettelbach. 2010. Comparative survival of bay scallops in eelgrass and the introduced algae, Codium fragile, in a New York estuary. Marine Biology 157:249-259.
Castagna, M. and J.N. Kraeuter. 1994. Age, growth rate, sexual dimorphism, and fecundity of knobbed whelk Busycon carica (Gremlin, 1791) in a western mid-Atlantic lagoon system, Virginia. Journal of Shellfish Research 13:581-586.
Cerco, C.F. and M.R. Noel. 2007. Can oyster restoration reverse cultural eutrophication in Chesapeake Bay? Estuaries and Coasts 30:331-343.
Clements, J.C. and H.L. Hunt. 2014. Influence of sediment acidification and water flow on sediment acceptance and dispersal of juvenile soft-shell clams (Mya arenaria L.). Journal of Experimental Marine Biology and Ecology 453:62-69.
Coen, L.D. and R.E. Grizzle. 2007. The importance of habitat created by molluscan shellfish to managed species along the Atlantic coast of the United States. Atlantic States Marine Fisheries Commission, Habitat Management Series, Washington, DC. pp. 1-108.

DRAFT Rhode Island Shellfish Management Plan!
SEPTEMBER 29, 2014 CHAPTER 2: ECOLOGY PAGE 65 OF 308
Coen, L.D., R.D. Brumbaugh, D. Bushek, R. Grizzle, M.W. Luckenbach, M.H. Posey, S.P. Powers and S. Gregory Tolley. 2007. Ecosystem services related to oyster restoration. Marine Ecology Progress Series. 341:303-307.
Costello, J.H., B.K. Sullivan, D.J. Gifford, D. Van Keuren and L.J. Sullivan. 2006. Seasonal refugia, shoreward thermal amplification, and metapopulation dynamics of the ctenophore Mnemiopsis leidyi in Narragansett Bay, Rhode Island. Limnology and Oceanography 51(4):1819-1831.
Cox, A.M. and M. Gomez-Chiarri. 2013. Genetic diversity of Vibrio parahaemolyticus from Narragansett Bay and coastal ponds of Rhode Island. Journal of Shellfish Research 32(2):519-525.
Cox, A.M. and M. Gomez-Chiarri. 2012. Vibrio parahaemolyticus in Rhode Island coastal ponds and the estuarine environment of Narragansett Bay. Applied and Environmental Microbiology 78(8):2996-2999.
Dame, R.F. 2012. Ecology of Marine Bivalves: An Ecosystem Approach, 2nd Edition. CRC Press, Boca Raton, FL.
Davis, J.P. and R.T. Sisson. 1988. Aspects of the biology relating to the fisheries management of New England populations of the whelks, Busycotypus canaliculatus and Busycon carica. Journal of Shellfish Research 7(3):453-460.
Day, E.A. and P. Lawton. 1988. Mud crab (Crustacea: Brachyura: Xanthidae) substrate preference and activity. Journal of Shellfish Research 7:421-426.
DeAlteris, J., L. Skrobe and C. Lipsky. 1999. The significance of seafloor disturbance by mobile fishing gear relative to natural processes: a case study in Narragansett Bay, Rhode Island. In: Fish Habitat: Essential Fish Habitat and Rehabilitation, Benaka, L. (ed.), American Fisheries Society Symposium 22:224-237
Deshieneks, M.E., E.E. Hoffman, J.M. Klinck and E.N. Powell. 1996. Modeling the vertical distribution of oyster larvae in response to environmental conditions. Marine Ecology Progress Series 136:97-110.
Desbonnet, A. and V. Lee. 1991. Links between water quality and shellfisheries in Narragansett Bay, Rhode Island. In: Proceedings of the First Rhode Island Shellfisheries Conference, Rice, M.A., M. Grady and M.L. Schwartz (eds.), Rhode Island Sea Grant RIU-W-90-003, Narragansett, RI. pp. 11-18.
Doall, M.H., D.K. Padilla, C.P. Lobue, C. Clapp, A.R. Webb and J. Hornstein. 2008. Evaluating northern quahog (=hard clam, Mercenaria mercenaria L.) restoration: are transplanted clams spawning and reconditioning? Journal of Shellfish Research 27(5):1069-1080.
Dumbauld, B.R., J.L. Ruesink and S.S. Rumrill.2009. The ecological role of bivalve shellfish aquaculture in the estuarine environment: a review with application to oyster and clam culture in West Coast (USA) estuaries. Aquaculture 290:196-223.
Eversole, A.G., W.D. Anderson and J.J. Isely. 2008. Age and growth of the knobbed whelk Busycon carica (Gmelin 1791) in South Carolina subtidal waters. Journal of Shellfish Research 27(2):423-426.
Fay, C.W., R.J. Neves and G.B. Pardue. 1983. Species profiles: life histories and environmental requirements of coastal fishes and invertebrates (mid-Atlantic): bay scallop. United States Fish and Wildlife Service Biological Services Program FWS/OBS-82/11.12. 17 pp.
Ferner, M.C. and M.J. Weissburg. 2005. Slow-moving predatory gastropods track prey odors in fast and turbulent flow. Journal of Experimental Biology 208:809-819
Flynn, A.M. and D. L. Smee. 2010. Behavioral plasticity of the soft-shell clam, Mya arenaria (L.), in the presence of predators increases survival in the field. Fishery Bulletin 383:32-38.
DRAFT Rhode Island Shellfish Management Plan!
PAGE 66 OF 308 CHAPTER 2: ECOLOGY SEPTEMBER 29, 2014
Fulweiler, R.W. and S.W. Nixon. 2009. Responses of benthic-pelagic coupling to climate change in a temperate estuary. Hydrobiologia 629:147-156
Ganz, A.R. 1992. A shellfish dredge survey of Great Salt Pond, Block Island, Rhode Island, 1992. Division of Fish and Wildlife, Rhode Island Department of Natural Resources.
Ganz, A.R. 1983. A quahog survey of subtidal areas of Great Salt Pond, Block Island, 1983. Division of Fish and Wildlife, Rhode Island Department of Natural Resources.
Ganz, A.R. 1978. A shellfish survey of Great Salt Pond, Block Island, August, 1978. Leaflet No. 50. Division of Fish and Wildlife, Rhode Island Department of Natural Resources.
Ganz, A.R., C. Altimari and M. Congdon. 2000. Great Salt Pond, Block Island, shellfish dredge survey, spring 2000. Division of Fish and Wildlife, Rhode Island Department of Natural Resources.
Gazeau, F., C. Quiblier, J.M. Jansen, J-P. Gattuso, J.J. Middelburg and C.H.P. Heip. 2007. Impact of elevated CO2 on shellfish calcification. Geophysical Research Letters 34:L07605:1-5.
Gerritsen, J., A.F. Holland and D.E. Irvine. 1994. Suspension-feeding bivalves and the fate of primary production—an estuarine model applied to Chesapeake Bay. Estuaries 17:403-416.
Giles H. and C.A. Pilditch. 2006. Effects of mussel (Perna canaliculus) biodeposit decomposition on benthic respiration and nutrient fluxes. Marine Biology 150:261-271.
Golderg, R., R. Mercaldo-Allen, J.M. Rose, P. Clark, C. Kuropat, S. Meseck and J. Pereira. 2012. Effects of hydraulic shellfish dredging on the ecology of a cultivated clam bed. Aquaculture Environment Interactions 3:11-21.
Goode, G.B. 1887. The fisheries and fishery industry of the United States. U.S. Dept. of the Interior, Commission of Fish and Fisheries, Washington, DC.
Grabowski, J.H. and C.H. Peterson. 2007. Restoring oyster reefs to recover ecosystem services. In: Ecosystem Engineers—plants to protists, Cuddington, K., J.E. Byers, W.G. Wilson and A. Hastings (eds), Academic, Burlington. pp. 281-298.
Green, M.A., G.G. Waldbusser, L. Hubazc, E. Cathcart and J. Hall. 2013. Carbonate minteral saturation state as a recruitment cue for settling bivalves in marine muds. Estuaries and Coasts 36:18-27.
Green, M.A., G.G. Waldbusser, S.L. Reilly, K. Emerson and S. O’Donnell. 2009. Death by dissolution: sediment saturation state as a mortality factor for juvenile bivalves. Limnology and Oceanography 54:1037-1047.
Greenfield, D.I., D.J. Lonsdale and R.M. Cerrato. 2005. Linking phytoplankton community composition with juvenile-phase growth in the northern quahog Mercenaria mercenaria (L.). Estuaries 28:241-251.
Griffiths, C.L. and C.A. Richardson. 2006. Chemically induced predator avoidance in the burrowing bivalve Macoma balthica. Journal of Experimental Marine Biology and Ecology 331:91-98.
Grizzle, R.E. and R.A. Lutz. 1989. A statistical model relating horizontal seston fluxes and bottom sediment characteristics to growth of Mercenaria mercenaria. Marine Biology 101:95-105.
Grizzle, R.E. and P.J. Morin. 1989. Effects of tidal currents, seston, and bottom sediments on growth of Mercenaria mercenaria: results of a field experiment. Marine Biology 102:85-93.
Gutierrez, J.L., C.G. Jones, D.L. Strayer and O.O. Iribarne. 2003. Mollusks as ecosystem engineers: the role of shell production in aquatic habitats. Oikos 101:79-90.
Harding, J.M. 2011. Observations on the early life history and growth rates of juvenile channel whelks Busycotypus canaliculatus (Linnaeus, 1758). Journal of Shellfish Research 30(3):901-903.

DRAFT Rhode Island Shellfish Management Plan!
SEPTEMBER 29, 2014 CHAPTER 2: ECOLOGY PAGE 67 OF 308
Harley, C.D.G., A.R. Hughes, K.M. Hultgren, B.G. Miner, CJ.B. Sorte, C.S. Thornber, L.F. Rodriruez, L. Tomanek and S.L. Williams. 2006. The impacts of climate change in coastal marine systems. Ecology Letters 9:228-241.
Henry, K. and S.W. Nixon. 2008. A half century assessment of hard clam, Mercenaria mercenaria, growth in Narragansett Bay, Rhode Island. Estuaries and Coasts 31:755-766.
Henry, K.M. and R.M. Cerrato. 2007. The annual macroscopic growth pattern of the northern quahog [=hard clam, Mercenaria mercenaria (L.)], in Narragansett Bay, Rhode Island. Journal of Shellfish Research 26(4):985-993.
Higgins, C.B., C. Tobias, M.F. Piehler, A. Smyth, R.F. Dame, K. Stephenson and B.L. Brown. 2013. Effect of aquacultured oyster biodeposition on sediment N2 production in Chesapeake Bay. Marine Ecology Progress Series 473:7-27.
Higgins, C.B., K. Stephenson and B.L. Brown. 2011. Nutrient bioassimilation capacity of aquacultured oysters: quantification of an ecosystem service. Journal of Environmental Quality 40:271-277.
Hines, C.M. and D.S. Brown. 2012. Review of Habitat Suitability Indices for the Eastern oyster and its importance in coastal habitat restoration. USDA NRCS Technical Report: 65-1535-11-11.
Hofmann, E., S. Ford, E. Powell and J. Klinck. 2001. Modeling studies of the effect of climate variability on MSX disease in eastern oyster (Crassostrea virginica) populations. Hydrobiologia 460:195-212.
Jones, D.S., M.A. Arthur and D.J. Allard. 1989. Sclerochronolgical records of temperature and growth from shells of Mercenaria mercenaria from Narragansett Bay, Rhode Island. Marine Biology 102:225-234.
Jones, C.G., J.H. Lawton and M. Shackak. 1997. Positive and negative effects of organisms as physical ecosystem engineers. Ecology 78:1946-1957.
Jones, C.G., J.H. Lawton and M. Shackak. 1994. Organisms as ecosystem engineers. Oikos 69:373-386.
Kassner, J. 1995. Habitat enhancement as a means to increase the abundance of the northern quahog, Mercenaria mercenaria. In: Proceedings of the Third Rhode Island Shellfisheries Conference. RIU-W-94-001. Rhode Island Sea Grant, Narragansett, RI. pp. 51-56.
Kassner, J., R. Cerrato and T. Carrano. 1991. Toward understanding and improving the abundance of quahogs (Mercenaria mercenaria) in the Eastern Great South Bay, New York. In: Proceedings of the First Rhode Island Shellfisheries Conference, Rice, M.A., M. Grady and M.L. Schwartz (eds.), Rhode Island Sea Grant RIU-W-90-003, Narragansett, RI. pp. 69-78.
Keck, R., D. Maurer and R. Malouf. 1974. Factors influencing the settling behavior of larval hard clams, Mercenaria mercenaria. Proceedings of the National Shellfisheries Association 64:59-67.
Kellogg, M.L., J.C. Cornwell, K.T. Paynter and M.S. Owens. 2011. Nitrogen removal and sequestration capacity of a restored oyster reef: Chesapeake Bay experiemental studies. Final Report to the Oyster Recovery Partnership, Annapolis, MC. University of Maryland Center for Environmental Studies Technical Report Series TS-623-11. 65 pp.
Kraeuter, J.N., S. Buckner and E.N. Powell. 2005. A note on a spawner-recruitment relationship for a heavily exploited bivalve: the case of northern quahogs (hard clams), Mercnaria mercenaria in Great South Bay, New York. Journal of Shellfish Research 24:1043-1052.
Kraeuter, J.N., M. Castagna and R. Bisker. 1989. Growth rate estimates for Busycon carica (Gmelin, 1791) in Virginia. Journal of Shellfish Research 8(1):219-225.
Kremer, P. 1979. Predation by the ctenophore Mnemiopsis leidyi in Narragansett Bay, Rhode Island. Estuaries 2:97-105.
Kuirhara, H., T. Asai, S. Kato and A. Ishimatsu. 2008. Effects of elevated pCO2 on early development in the mussel Mytilus galloprovincialis. Aquatic Biology 4:225-233.

DRAFT Rhode Island Shellfish Management Plan!
PAGE 68 OF 308 CHAPTER 2: ECOLOGY SEPTEMBER 29, 2014
Kurihara, H., S. Kato and A. Ishimatsu. 2007. Effects of increased seawater pCO2 on early development of the oyster Crassostrea gigas. Aquatic Biology 1:91-98.
Landers, W.J. 1954. Notes on the predation of the hard clam, Venus mercenaria, by the mud crab, Neopanope texana. Ecology 35:422.
Lazar, N., A. Ganz and A. Valliere. 1994. Quahog stock assessment and implementation of an interim management plan in Greenwich Bay, Rhode Island. In: Proceedings of the Third Rhode Island Shellfish Industry Conference. M. Rice and Gibbs, E. (eds.), Rhode Island Sea Grant RIU-W-94-001. Narragansett, RI. pp. 5-29.
Leavitt, D., S. Rutherford, M. McGiveney, D. Erkan, J. Mercer, M. Gibson, T. Scott, C. Kincaid and D. Ullman. 2013. An assessment of quahog larval supply and distribution in the upper Narragansett Bay with a focus on spawning sanctuaries and alternative area management strategies. Final Report to the Commercial Fisheries Research Foundation, Kingston, RI, as part of the Southern New England Collaborative Research Initiative (SNECRI), supported by NOAA Award #NA08NMF4720595.
Lee, V. 1980. An elusive compromise: Rhode Island coastal ponds and their people. Marine Technical Report 73, University of Rhode Island Coastal Resources Center, Narragansett, RI.
Leonard, G.H., M.D. Bertness and P.O. Yund. 1999. Crab predation, waterborne cues, and inducible defenses in the blue mussel, Mytilus edulis. Ecology 80(1):1-4.
Lloret, J., A. Marin and L. Marin-Guirao. 2008. Is coastal lagoon eutrophication likely to be aggravated by global climate change? Estuarine, Coastal and Shelf Science 78(2):403-412.
MacKenzie, C.L. 2008. The bay scallop, Argopecten irradians, Massachusetts through North Carolina: it’s biology and the history of its habitats and fisheries. Marine Fisheries Review 70(3-4):6-79.
MacKenzie, C.L., A. Morrison, D.L. Taylor, V.G. Burrell, W.S. Arnold and A.T. Wakida-Kusunoki. 2002. Quahogs in eastern North America, Part I. Biology, ecology, and historical uses. Marine Fisheries Review 64:1-55.
Magalhaes, H. 1948. An ecological study of snails of the genus Busycon at Beaufort, North Carolina. Ecological Monographs 18(3): 377-409.
Malinowski, S.M. 1992. Effects of density on adult growth, survivorship, fecundity, and recruitment of northern quahogs. In: Proceedings of the Second Rhode Island Shellfish Industry Conference. M.A. Rice and Grossman-Garber, D. (eds.), RIU-W-92-002. Rhode Island Sea Grant, Narragansett, RI. pp. 79-90.
Malinowski, S.M. 1985. The population ecology of the hard clam, Mercenaria mercenaria, in eastern Long Island. PhD dissertation, University of Connecticut, Storrs, CT. 101 pp.
Maranda, L. and Y. Shimizu. 1987. Diarrhetic shellfish poisoning in Narragansett Bay. Estuaries 10(4):298-302.
Marroquin-Mora, D.C. and M.A. Rice. 2008. Gonadal cycle of northern quahogs, Mercenaria mercenaria (Linne, 1758), from fished and non-fished subpopulations in Narragansett Bay. Journal of Shellfish Research 27(4):643-652.
Mattiessen, G. 1960. Observations on the ecology of the soft clam, Mya arenaria, in a salt pond. Limnology and Oceanography 5:291-300.
Mercer, J. 2013. Following the quahog through time and space. 12th Annual Ronald C. Baird Sea Grant Science Symposium. November 2013. Rhode Island Sea Grant. http://seagrant.gso.uri.edu/baird/2013_shellfish/index.html
Meire, P.M. 1993. The impact of bird predation on marine and estuarine bivalve populations: a selective review of patterns and underlying causes. In: Bivalve Filter Feeders in Estuarine and Coastal Ecosystem Processes, R.F. Dame (ed.), Springer-Verlag, Berlin. pp. 198-243.
DRAFT Rhode Island Shellfish Management Plan!
SEPTEMBER 29, 2014 CHAPTER 2: ECOLOGY PAGE 69 OF 308
Miller, A.W., A.C. Reynolds, C. Sobrino and G.F. Riedel. 2009. Shellfish face uncertain future in CO2 world: influence of acidification on oyster larvae calcification and growth in estuaries. PLoS ONE 4, e5661.
Murphy, B.R. and D. Erkan. 2006. Survey of the northern quahog, Mercenaria mercenaria, in Narragansett Bay, Rhode Island. Rhode Island Department of Environmental Management, Division of Fish and Wildlife, Jamestown, RI. 54 pp.
Nakaoka, M. 2000. Nonlethal effects of predators on prey populations: predator mediated change in bivalve growth. Ecology 81(4):1031-1045.
Narragansett Bay Commission. 2014. Providence, RI.
National Research Council. 2004. Nonnative oysters in the Chesapeake Bay. Committee on Nonnative Oysters in the Chesapeake Bay, Ocean Studies Board, Division on Earth and Life Studies. National Academies Press, Washington, DC. 325 pp.
Nau, A. 2007. Potential habitat for restoration of eastern oysters (Crassostrea virginica) in Narragansett Bay, RI. GE132 Brown University. Poster.
Needles, L.A., S.E. Lester, R. Ambrose, A. Andren, M. Beyeler, M.S. Conor, J.E. Eckman, B.A. Costa-Pierce, S. D. Gaines, K.D. Lafferty, H.S. Lenihan, J. Parrish, M.S. Peterson, A.E. Scaroni, J.S. Weis and D.E. Wendt. 2013. Managing bay and estuarine ecosystems for multiple services. Estuaries and Coasts DOI: http://dx.doi.org/10.1007/s12237-013-9602-7.
Newell, R.I.E. 2004. Ecosystem influences of natural and cultivated populations of suspension-feeding bivalve molluscs: a review. Journal of Shellfish Research 23:51-61.
Newell, R.I.E. 1989. Species profiles: life histories and environmental requirements of coastal fishes and invertebrates (North and Mid-Atlantic) – Blue Mussel. U.S. Fish and Wildlife Service Biological Report 82(11.102); U.S. Army Corps of Engineers TR E1-82-4. 25 pp.
Newell, R.I.E. 1988. Ecological changes in Chesapeake Bay: are they the result of overharvesting the American oyster? In: Understanding the Estuary: Advances in Chesapeake Bay Research, Lynch, M.P. a d E.C. Krome (eds), Chesapeake Research Consortium, Solomons, MD. pp. 536-546.
Newell, R.I.E., T.R. Fisher, R.R. Holyoke and J.C. Cornwell. 2005. Influence of eastern oysters on nitrogen and phosphorus regeneration in Chesapeake Bay, USA. In: The Comparative Roles of Suspension-feeders in Ecosystems, Dame, R.F. and S. Olenin (eds). pp. 93-120.
North, E.W., D.M. King, J. Xu, R.R.Hood, R.I Newell, K. Paynter, M.L. Kellogg, M.K. Liddel and D.F. Boesch. 2010. Linking optimization and ecological models in a decision support tool for oyster restoration and management. Ecological Applications 20(3):851-866.
Oczkowski, A., S. Nixon, K. Henry, P. DiMilla, M. Pilson, S. Granger, B. Buckley, C. Thornber, R. McKinney and J. Chaves. 2008. Distribution and tropic importance of anthropogenic nitrogen in Narragansett Bay: an assessment using stable isotopes. Estuaries and Coasts 31:53-69.
Officer, C.B., T.J. Smayda and R. Mann. 1982. Benthic filter feeding: a natural eutrophication control. Marine Ecology Progress Series 9:203-210.
Orr, J.C., V.J. Fabry, O. Aumont, L. Bopp, S.C. Doney, R.A. Feely, A. Gnanadesikan, N. Gruber, A. Ishida, F. Joos, R.M. Key, K. Lindsay, E. Maier-Reimer, R. Matear, P. Monfray, A. Mouchet, R.G. Najjar, G-K. Plattnewr, K.B. Rodgers, C.L. Sabine, J.K. Sarmiento, R. Schlitzer, R.D. Slater, I.J. Totterdell, M-F. Weirig and A. Yamanaka. 2005. Anthropogenic ocean acidification over the twenty-first century and its impact on calcifying organisms. I 437:681-686.
Oviatt, C.A., S. Olsen, M. Andrews, J. Collie, T. Lynch and K. Raposa. 2003. A century of fishing and fish fluctuations in Narragansett Bay. Reviews in Fisheries Science 11:221-242.
DRAFT Rhode Island Shellfish Management Plan!
PAGE 70 OF 308 CHAPTER 2: ECOLOGY SEPTEMBER 29, 2014
Peemoeller, B-J. and B.G. Stevens. 2013. Age, size, and sexual maturity of channeled whelk (Busycotypus canaliculatus) in Buzzards Bay, Massachusetts. Fishery Bulletin 111:265-278.
Pelejero, C., E. Calvo and O. Hoegh-Guldbeerg. 2010. Paleo-perspectives on ocean acidification. Trends in Ecology and Evolution 25(6):332-344.
Peterson, C.H., J.H. Grabowski and S.P. Powers. 2003. Estimated enhancement of fish production resulting from restoring oyster reef habitat: quantitative valuation. Marine Ecology Progress Series 264:249-264.
Pfieiffer-Herbert, A. 2007. Coastal ponds of Rhode Island: a case study for combining terrestrial, freshwater, and marine conservation priorities. A white paper prepared for The Nature Conservancy, Coastal Institute IGERT Program, University of Rhode Island.
Philippart, C.J.M., H.M. van Aken, J.J. Beukema, O.C. Bos, G.C. Cadee and R. Dekker.l 2003. Climate-related changes in recruitment of bivalve Macoma balthica. Limnology and Oceanography 48(6):2171-2185.
Pilson, M.E.Q. 2008. Narragansett Bay amidst a globally changing climate. In: Science for Ecosystem-based Management: Narragansett Bay in the 21st Century. Desbonnet, A. and B. Costa-Pierce (eds). Springer Series on Environmental Management, Springer, NY. pp. 35-46.
Power, A.J., C.J. Sellars and R.L. Walker. 2009. Growth and sexual maturity of the knobbed whelk, Busycon carica (Gmelin, 1791), from a commercially harvested population in coastal Georgia. University of Georgia Marine Extension Service, Occasional Papers Vol 4. 24 pp.
Pratt, S.D. 1988. Status of the hard clam fishery in Narragansett Bay. Final Report to the Narragansett Bay Project, Providence, RI. 89 pp.
Pratt, S.D., A.R. Ganz and M.A. Rice. 1992. A species profile of the quahog in Rhode Island. RIU-T-92-001. Rhode Island Sea Grant, Narragansett, RI. 116 pp.
Prins, T.C., A.C. Smaal and R.F. Dame. 1998. A review of the feedbacks between bivalve grazing and ecosystem processes. Aquatic Ecology 31:349-359.
Pyke, C.R., R.G. Najjar, M.B. Adams, D. Breitburg, M. Kemp, C. Hershner, R. Howarth, M. Mulholland, M. Paolisso, D. Secor, K. Sellner, D. Wardrop and R. Wood. 2008. Climate change and the Chesapeake Bay: state-of-the-science review and recommendations. Chesapeake Bay Program Science and Technical Advisory Committee, STAC Publication #08-004, Annapolis, MD
Rhode Island Department of Environmental Management. 2014. Rhode Island shellfish harvest area tagging map. www.dem.ri.gov/programs/bnatres/fishwild/pdf/tagmap.pdf.
Rhode Island Department of Environmental Management. 2013. Quahog dredge survey unpublished data. Providence, RI.
Rhode Island Department of Environmental Management. 2000. Narragansett Bay Water Quality: Status and Trends 2000. A summary of water quality information. RI Dept. Environmental Management Narragansett Bay Estuary Program and Narragansett Bay Estuarine Research Reserve. Providence, RI. 35 pp.
Rice, M.A. 2001. Environmental impacts of shellfish aquaculture: filter feeding to control eutrophication. In: Tlusty, M., D. Bengtson, H.O. Halvorson, S. Oktay, J. Pearce and R. Rheault (eds), Marine Aquaculture and the Marine Environment: A Meeting for the Stakeholders of the Northeast, Cape Code Press, Falmouth, MA.
Rice, M.A. 1999. Uptake of dissolved free amino acids by northern quahogs, Mercenaria mercenaria and its relative importance to organic nitrogen deposition in Narragansett Bay, Rhode Island. Journal of Shellfish Research 18(2): 547-553.
DRAFT Rhode Island Shellfish Management Plan!
SEPTEMBER 29, 2014 CHAPTER 2: ECOLOGY PAGE 71 OF 308
Rice, M.A. 1992. Overview of quahog management studies in Narragansett Bay 1946-1992. In: Proceedings of the Second Rhode Island Shellfish Industry Conference. M.A. Rice and Grossman-Garber, D. (eds.), RIU-W-92-002. Rhode Island Sea Grant, Narragansett, RI. pp. 49-61.
Rice, M.A. and J. Goncalo. 1995. Results of a study of bivalve larval abundance in Greenwich Bay, Rhode Island, 1993. In: Proceedings of the Third Rhode Island Shellfisheries Conference. RIU-W-94-001. Rhode Island Sea Grant, Narragansett, RI. pp. 31-40.
Rice, M.A. and J.A. Pechenik. 1992. A review of factors influencing the growth of northern quahog, Mercenaria mercenaria (Linne, 1758). Journal of Shellfish Research 11:279-287.
Rice, M.A., A. Valliere and A. Caporelli. 2000. A review of shellfish restoration and management projects in Rhode Island. Journal of Shellfish Research 19(1):401-408.
Rice, M.A., C. Hickox and I. Zehra. 1989. Effects of intensive fishing effort on the population structure of quahogs, Mercenaria mercenaria (Linnaeus 1758) in Narragansett Bay. Journal of Shellfish Research 8:345-354.
Rodney, W.S. and K.T. Paynter. 2006. Comparisons of macrofaunal assemblages on restored and non-restored oyster reefs in mesohaline regions of Chesapeake Bay in Maryland. Journal of Experimental Marine Biology and Ecology 335:39-51.
Royal Society. 2005. Ocean acidification due to increasing atmospheric carbon dioxide. Royal Society Policy Document 12/05, London, UK. http://royalsociety.org/document.asp?id=3249.
Russell, H.J., R.T. Sisson and J.D. Karlsson. 1973. Shellfish survey of Great Salt Pond, Block Island, 1973. Leaflet No. 40. Division of Fish and Wildlife, Rhode Island Department of Natural Resources.
Salisbury, J., M. Green, C. Hunt and J. Campbell. 2008. Coastal acidification by rivers: a threat to shellfish? EOS 89(50):513-514.
Scavia, D., J.C. Field, D.F. Boesch, R.W. Buddemeier, B. Burkett, D.R. Cayan, M. Fogarty, M.A. Harwell, R.W. Howarth, C. Mason, D.J. Reed, T.C. Royer, A.H. Sallenger and J.G. Titus. 2002. Climate change impacts on US coastal and marine ecosystems. Estuaries 25:149-164.
Schulte, D.M., R.P. Burke and R.N. Lipcius. 2009. Unprecedented restoration of a native oyster metapopulation. Science 325:1124-1128.
Seed, R. 1993. Invertebrate predators and their role in structuring coastal and estuarine populations of filter feeding bivalves. In: Bivalve Filter Feeders in Estuarine and Coastal Ecosystem Processes, R.F. Dame (ed.), Springer-Verlag, Berlin. pp. 149-195.
Shriver, A.C., R.H. Carmichael and I. Valiela. 2002. Growth, condition, reproductive potential, and mortality of bay scallops, Argopecten irradians, in response to eutrophic-driven changes in food resources. Journal of Experimental Marine Biology and Ecology 279:21-40.
Shumway, S.E. 1990. A review of the effects of algal blooms on shellfish and aquaculture. Journal of the World Aquaculture Society 21(2)65-104.
Sisson, M., L. Kellogg, M. Luckenbach, R. Lipcius, A. Colden, J. Cornwell and M. Owens. 2011. Assessment of oyster reefs in Lynnhaven River as a Chesapeake Bay TMDL Best Management Practice. Special Report No. 429 In Applied Marine Science and Ocean Engineering, Virginia Institute of Marine Science, Gloucester Point, VA. 65 pp.
Sisson, R.T. 1972. Biological and commercial fisheries related research on the channeled whelk Busycon canaliculatum (Linne) in Narragansett Bay, Rhode Island. Master of Science, University of Rhode Island.
Smaal, A.C. and T.C. Prins. 1993. The uptake of organic matter and the release of inorganic nutrients by bivalve suspension feeder beds. In: Bivalve Filter Feeders in Estuarine and Coastal Ecosystem Processes, R.F. Dame (ed.), Springer-Verlag, Berlin. pp. 271-298.

DRAFT Rhode Island Shellfish Management Plan!
PAGE 72 OF 308 CHAPTER 2: ECOLOGY SEPTEMBER 29, 2014
Smee. D.L., and M.J. Weissburg. 2006a. Clamming up: environmental forces diminish the perceptive ability of bivalve prey. Ecology 87)6):1587-1598
Smee, D.L. and M.J. Weissburg. 2006b. Hard clams (Mercenaria mercenaria) evaluate predation risk using chemical signals from predators and injured conspecifics. Journal of Chemical Ecology 32(3):605-619.
Sparsis, M., J.T. DeAlteris and M.A. Rice. 1992. Effects of bottom cultivation on quahogs and other bottom invertebrates in Narragansett Bay. In: Proceedings of the Second Rhode Island Shellfish Industry Conference. M.A. Rice and Grossman-Garber, D. (eds.), RIU-W-92-002. Rhode Island Sea Grant, Narragansett, RI. pp. 63-78.
Sponaugle, S. and P. Lawton. 1990. Portunid crab predation on juvenile hard clams: effects of substrate type and prey density. Marine Ecology Progress Series 67:43-53.
Stachowicz, J.J., J.R. Terwin, R.B. Whitlatch and R.W. Osman. 2002. Linking climate change and biological invasions: ocean warming facilitates nonindigenous species invasions. Proceedings of the National Academy of Sciences 99(24):15497-15500.
Steimle, F.W., R. Pikanowski, D. McMillan and W. Wilk. 2000. Demersal fish and American lobster diets in Hudson-Raritan Bay, 1996-1997, as compared to their diets in other Middle Atlantic Bight estuaries. NOAA Technical Memo NMFS-NE-161, 106 pp.
Still, B.M. and M.H. Stolt. In Review. Subaqueous soils and coastal acidification: a hydropedology perspective. Submitted to Soil Science Society of America Journal.
Sullivan, B.K. D. VanKeuren and M. Clancy. 2001. Timing and size of blooms of the ctenophore Mnemiopsis leidyi in relation to temperature in Narragansett Bay, Rhode Island. Hydrobiologia 451:113-120.
Talmage, S.C. and C.J. Gobler. 2010. Effects of past, present, and future ocean carbon dioxide concentrations on the growth and survival of larval shellfish. Proceedings of the National Academy of Sciences 107(40):17246-17251.
Talmage, S.C. and C.J. Gobler. 2009. The effects of elevated carbon dioxide concentrations on the metamorphosis, size, and survival of larval hard clams (Mercenaria mercenaria), bay scallops (Argopecten irradians), and Eastern oysters (Crassostrea virginica). Limnology and Oceanography 54:2072-2080.
Thomson, E. and D.P. Gannon. 2013. Influence of sediment type on antipredator response of the softshell clam, Mya arenaria. Northeastern Naturalist 20(3):498-510.
Tracey, G.A. 1988. Feeding reduction, reproductive failure and mass mortality of mussels (Mytilus edulis) during the 1985 “brown tide” in Narragansett Bay, Rhode Island. Marine Ecology Progress Series 50:73-81.
Tracey, G.A. 1985. Picoplanktonic algal bloom causes a catastrophic mussel kill in Narragansett Bay, Rhode Island. EOS 66:1303.
U.S. Environmental Protection Agency. 2008. National Coastal Condition Report III. Office of Water, Washington, DC. EPA/842-R-08-002. 329 pp.
Vania, B., H. Ullah, C.M. Teixeira, P. Range, K. Erzini and F. Leitao. 2014. Influence of environmental variables and fishing pressure on bivalve fisheries in an inshore lagoon and adjacent nearshore coastal area. Estuaries and Coasts 37:191-205.
Waldbusser, G.G., H. Bergscheider and M.A. Green. 2010a. Size-dependent effect of pH on calcification in post-larval hard clam Mercenaria mercenaria. Marine Ecology Progress Series 417:171-182.
Walker, R.L. 1989. Exploited and unexploited hard clam Mercenaria mercenaria (L.) populations in Georgia. Contributions in Marine Science 31:61-75.

DRAFT Rhode Island Shellfish Management Plan!
SEPTEMBER 29, 2014 CHAPTER 2: ECOLOGY PAGE 73 OF 308
Walker, R.L., J.H. Smith and A.J. Power. 2004. Movement and behavioral patterns of whelks on intertidal flats in Wassaw Sound, Georgia. Marine Extension Bulletin 29. 18 pp.
Wood, R.S. 1979. Investigations on the conch fishery in Narragansett Bay, Rhode Island. Master of Science Thesis, University of Rhode Island.
Wood, L. and W.J. Hargis. 1971. Transport of bivalve larvae in a tidal estuary. In: Crisp, D.J. (ed), Proceedings of the Fourth European Marine Biology Symposium, Bangor, 1969. Cambridge University Press, Cambridge. pp. 29-44.
zu Ermgassen, P.S.E., M.D. Spaulding, R.E. Grizzle and R.D. Brumbaugh. 2013. Quantifying the loss of a marine ecosystem service: filtration by the Eastern oyster in US estuaries. Estuaries and Coasts 36:36-43.