chapter 2: collecting insights for an institutional
TRANSCRIPT

Collecting Insights for an Institutional Diagnostic of Development – Tanzania Institutional Diagnostic
© Economic Development & Institutions 1
TANZANIA INSTITUTIONAL DIAGNOSTIC WP18/TID02
CHAPTER 2:
COLLECTING
INSIGHTS FOR AN
INSTITUTIONAL
DIAGNOSTIC OF
DEVELOPMENT
Tanzania Institutional Diagnostic
François Bourguignon and
François Libois
Paris School of Economics
September 2018

Collecting Insights for an Institutional Diagnostic of Development – Tanzania Institutional Diagnostic
© Economic Development & Institutions 2
Introduction
Although many thinkers throughout history thought about societies as organisms with some
similarity with the human body, simple diagnostic tools that are available to detect human
diseases do not exist for societies and the institutions that govern them, even when
restricting the investigation to what may weaken their economic development. As a matter of
fact, economic development per se and its relationship with institutions are so complex that
only in-depth analyses can possibly deliver some light.
Simpler direct tools still have their place, however, if only to guide us in which direction to
search. This is what is done in the present chapter. It collects insights from different sources
in order to identify the areas where in-depth studies might be the most able to uncover those
institutional challenges that may be the most detrimental to economic development in
Tanzania. Four approaches are developed. Two of them consist of simply asking people
concerned with the issues. One is a questionnaire survey taken using a sample of various
types of decision makers and academics, while the other is a set of open-ended interviews
with top policymakers and decision makers. A third approach exploits the numerous
institutional indicators available in international databases to assess the way in which a
country, Tanzania in the present study, differs from a given set of comparators. The fourth
one exploits the results of ‘growth diagnostics’, meant to identify the binding economic
constraints to faster development, and seeks to relate them to specific institutional areas.
The results of these four investigations are discussed in turn.
1 The Country Institutional Survey (CIS): experts’ opinions on Tanzanian institutions1
The CIS is a sample survey tool developed as part of the institutional diagnostic activity of
the Economic Development and Institutions (EDI) programme. Its aim is to identify
institutional challenges as they are perceived by people in a country most likely to confront
them on a regular basis. These challenges will then be the subject of deeper scholarly
analysis. Being based on a broad sample of respondents, CIS intends to yield a more
diverse view of the country than the numerous institutional indicators that rely most often on
the opinion of a few experts.
The pilot CIS, carried out in Tanzania in early 2017, targeted individuals who are in, or have
been in, a top- or sub-top decision-making position where they interact with Tanzanian
institutions, and possibly also affect them as part of their functioning2. A priori, they have a
better knowledge of the country’s institutions and their strengths and weaknesses. The
exercise thus differs greatly from the standard opinion polls based on representative
samples of the population.
1 The authors would like to acknowledge the work of Policy Research for Development (REPOA). This section would not exist if REPOA had not trained enumerators, contacted respondents, and administered the survey. Abel Kinyondo provided detailed comments that greatly improved the analysis of the results, although he may not agree with all the interpretation of the section. Last but not least, Katie McIntosh has been dedicated to the project and the survey. Her close supervision and constant feedback made everything possible. 2 The results of existing public opinion or business surveys concerning institutional issues are briefly analysed later in this chapter.

Collecting Insights for an Institutional Diagnostic of Development – Tanzania Institutional Diagnostic
© Economic Development & Institutions 3
The remainder of this section is organised into five sub-sections. It first describes the design
of the questionnaire (sub-section 1.1)), before explaining how the survey was implemented
(sub-section 1.2)). Sub-section 1.3 discusses the most development-constraining
institutional areas as perceived by respondents, and the functioning of institutions is
analysed in sub-section 1.4. Sub-section 1.5 is more prospective. As the survey was taken
at the beginning of a new administration, it seemed of interest to ask respondents in an
open-ended way about the likely differences in the functioning of institutions introduced by
the new president. The last sub-section puts the survey in perspective and concludes.
1.1 The survey: design of the questionnaire
The questionnaire has four intertwined components: one section about the personal
characteristics of the respondent, one section on institutional areas seen as the most
constraining for the development of Tanzania, one long section on the perception of the
functioning of institutions, and a short section on current (at the time of the survey)
institutional developments in the country.
The first section, actually split into two parts, gathers information on respondents. The first
part initiates the discussion and asks general questions to each respondent on nationality,
gender, level of education, place of birth etc. The other part ends the questionnaire and
compiles more sensitive information on the past and present occupation of respondents as
well as on their political affinity. This section is crucial for putting the analysis into
perspective. Because it requires some degree of trust between the respondent, the
enumerator, and the survey sponsor, it was put at the end.
The second section of the questionnaire enumerates 10 broad institutional areas: ‘political
institutions’, ‘law and order, justice, and security’, ‘functioning of public administrations’,
‘ease of doing business’, ‘dealing with land rights’, ‘long-term and strategic planning’, ‘market
regulation’, ‘security of transactions and contracts’, ‘relating with the rest of the world’, and
‘social cohesion, social protection and solidarity’. Respondents could first read more details
on the topics under the preceding headings, as shown in the enclosed Table A2. They then
had to select the three institutional areas that, according to them, most constrain
development in Tanzania. Respondents then had to allocate 20 points among these three
areas – the higher the number of points, the more detrimental the area for development. The
chosen areas are important for the analysis but also for the subsequent part of the survey
since they determine the set of questions presented to the respondent in the main part of the
survey.
The core section of the CIS comprises 345 questions on the perception of institutions in
Tanzania. The collection of information relies on a Likert scale, ranging from ‘Not at all’ and
‘little’ to ‘moderately so’, ‘much’, and ‘very much’. Responses are then converted into
discrete numbers, ranging from one to five, for the analysis. This questionnaire is inspired by
the Institutional Profile Database (IPD), an expert survey conducted jointly by the Economic
Services of the French Embassies, the Centre for Prospective Studies and International
Information, and the University of Maastricht (Bertho, 2012). This survey covered 143
countries in 2012, with respondents belonging either to the Economic Services of the French
Embassies or country offices of the French Agency of Development. The CIS questionnaire
differs in several dimensions, mostly with the aim of making it as close as possible to the

Collecting Insights for an Institutional Diagnostic of Development – Tanzania Institutional Diagnostic
© Economic Development & Institutions 4
specific Tanzanian context. Overall, only about 40% of the CIS questions remain very similar
to the IPD questionnaire. This is very useful because it gives a basis for comparison with a
tool profiling the institutions of many countries.
The large spectrum of institutions and therefore the large number of questions has raised
concerns regarding the implementation of the survey. Covering all important institutional
issues in the country would have resulted in too long a survey. The questionnaire was thus
shortened in the following way. All the questions were associated with at least one of the 10
general institutional areas among which respondents made an initial choice, and potentially
with several of them. Respondents were then asked to answer only the questions related to
the three institutional areas they selected as well as questions related to a fourth area,
randomly chosen among the remaining ones. This fourth module is very important because it
is the only guarantee that all questions and all institutions are, at least, partly covered at the
end of the survey. Notice also that, given the overlap between institutional areas,
respondents had to answer only 50% of the original questions on average.
In terms of content, the main challenge of a survey like the CIS relates to the timeframe of
the study. By their essence, institutions are persistent and very few of them do change
suddenly and abruptly. On the other hand, human nature tends to react to the most recent
information available. Not only does it bias answers towards the present, but it overplays
fears and hopes in the perception of institutional trends. To reduce potential biases, we have
trained enumerators to stress that all answers should relate to the past five to 10 years and
not focus only on the recent past. This mattered for several reasons. First, since institutions
are persistent, it is necessary to avoid as much as possible respondents reporting short-run
changes in their views about institutions. Second, as mentioned earlier, the enumeration
took place one year after President Magufuli was elected and announced numerous reforms
that could affect institutions in Tanzania. At the time of the survey, however, those reforms
were at best ongoing and their final extent and depth was unclear. Last but not least, very
recent changes in institutions can hardly explain past economic trajectory, raising the
relevance of questions on the more stable part of institutions.
Recent evolutions are, however, important, and there is no reason to neglect them either.
The last section of the questionnaire asks whether respondents would have answered
differently to the previous questions if they had been about the recent past or the near future
of Tanzania. Combined with a question on important institutions that were not covered in the
survey, this last section is meant to guarantee that the coverage of the survey is broad
enough, both in terms of temporal frame and in terms of institutional diversity.
If questions are key in the design of a survey tool, they are nothing without a careful
sampling of respondents, in line with the objectives of the study. The survey aims to cover
the views of people involved in, or in close contact with, institutions. Given this choice,
targeted respondents had to hold first- or second-tier positions in the decision-making
structure of public and private organisations and influence groups of the country, such that
they were directly concerned with the functioning of the country’s institutions. As a
consequence, a pure random sampling in the overall population was not an option. The
selection of respondents had to be based on an arbitrary stratification of groups of expert
respondents to make sure various sectors, occupations, and individual profiles would be
present in the sample. This implies a strong selection bias with respect to the Tanzanian
population, but, of course, this was on purpose.

Collecting Insights for an Institutional Diagnostic of Development – Tanzania Institutional Diagnostic
© Economic Development & Institutions 5
1.2 Execution of the survey
The Tanzania CIS was conducted between the end of January and early February 2017 in a
collaborative effort between EDI researchers, Oxford Policy Management (OPM), and
REPOA, a Tanzanian think-tank. A total of 101 individuals were sampled in a purposively
stratified sample. The selection process followed two steps. First, researchers listed strata in
terms of occupation, position level, geographical constraints, and tentative gender balance.
By design, half of the sample were surveyed in Dar-es-Salaam, with the remaining half
divided between Dodoma, Morogoro, Mwanza, Mbeya, and Arusha.
Then, REPOA, in cooperation with OPM, determined a list of target respondents who
satisfied the occupational, geographical, and gender considerations. They then contacted
and interviewed these respondents. Table 1 reports the current occupation of targeted
respondents. It can be seen that the sample is divided into five sections. The three main
sections comprise 28 respondents in the economic sphere, 28 directly related to the political
sphere, including five retiree statesmen, and 25 from the civil society in a broad sense,
ranging from chief editors in the main Tanzanian media to academics and development non-
governmental organisation (NGO) staff members. The remaining two smaller sections
include 11 members of the donor community and diplomats as well as four persons related
to the police and the military and four working in relation with the judiciary. This distribution
across the different circles of decision and influence in Tanzania offers a broad coverage in
terms of knowledge of and views on all major institutions of the country. The current
occupations of respondents, however, reveal only a restricted picture of the coverage of our
sample. Many respondents have occupied other positions in the past, as reported in Table 2.
The main goal in the selection of respondents was to have a broad coverage of Tanzanian
viewpoints on institutions from persons operating within, or sometimes able to influence,
these institutions. It then makes sense that half of the sample are in their forties, that 80%
have at least a university degree and that 29 respondents studied abroad, 13 of them in the
United Kingdom. It is also important to point out that 18 respondents declared a political
affinity with the ruling party and 17 with the opposition; 45 respondents declared no political
affinity while 21 explicitly preferred not to answer the question. This relative balance seems
satisfactory as it avoids excessively laudatory or critical views in questions addressing
governance issues.

Collecting Insights for an Institutional Diagnostic of Development – Tanzania Institutional Diagnostic
© Economic Development & Institutions 6
Table 1: Stratification of the sample
Sphere of influence Occupation type Number of
respondents
Economics
Foreign companies 5
Trade unions 6
Farming representatives 6
Small entrepreneurs 5
Business leaders 6
Politics
Government executives & senior bureaucrats
15
Politicians 8
Retiree statesmen 5
Law and order enforcement
Police 2
Military 2
Justice 4
Civil society
Media, chief editors 4
Religious 4
Civil society organisations 4
Top academics 8
Development NGOs 5
International stakeholder
Donor community 8
Diplomats 3
In terms of geographical diversity, most respondents live in an urban area, even though more than half of them were born in rural areas. The fact that almost all respondents have settled close to urban centres is not unexpected since the survey did target the elite of the country, which tends to live in or close to cities. By construction of the sample and reflecting the fact that most Tanzanian public and private organisations are located in Dar-es-Salaam, the region around the economic capital is overrepresented, as show in the left chart of Figure 1. The concentration of respondents is, however, slightly less important when looking at their place of birth. The right panel of Figure 1 displays a much more diverse geographical pattern of birth districts, even though it remains biased towards the northern part of mainland Tanzania.

Collecting Insights for an Institutional Diagnostic of Development – Tanzania Institutional Diagnostic
© Economic Development & Institutions 7
Table 2: Composition of the sample
Respondents’ main characteristics (Number of respondents, except otherwise mentioned)
Occupation history (Number of respondents)
Male 83 Business 37
Single married 89 Teaching 30
Have children 92 National NGO 27
Average age in years (standard deviation)
46.8 (10.8)
Public administration 25
Live in urban areas 95 Military 17
Born in rural areas 53 Government executive 13
Education: university degree or above
80 International NGO 10
Studied abroad 29 Media 7
Studied in UK 13 Diplomat 6
Directly involved in politics 34 Judiciary 5
Political affinity with the ruling party 18 Legislative 3
Political affinity with the opposition parties
17 Unions 3
No declared political affinity 45 Religious organisation 2
No answer about political affinity 21 Total Number of respondents 101
Figure 1: Geographical origin of the respondents

Collecting Insights for an Institutional Diagnostic of Development – Tanzania Institutional Diagnostic
© Economic Development & Institutions 8
1.3 Most critical institutions for the development of Tanzania
According to the respondents, the most constraining institutional areas for the development
of Tanzania are the political institutions and public administration. The ranking of these two
areas depends on the measure chosen to aggregate individual opinions. However, it can be
seen in Figure 2 that they are very close to each other in number of occurrences or weighted
by the points awarded by respondents. Notice also that, conditionally on being chosen,
political institutions receive the highest number of points, with an average score of 7.8 out of
20, leaving only 12.2 points for the two other areas selected by these respondents.
Business-related institutions come in third position in the ranking of the most critical
institutional areas for Tanzanian development. On the other side of the spectrum, only four
people chose ‘security of transactions and contracts’ as one of the three most constraining
institutional hurdles in the development of Tanzania, possibly because this area was
considered to be more specific and technical than others.
It is not impossible that the observed ranking is partly driven by a framing bias, with the first
areas in the list appearing more often among the choices of respondents. This objection
does not seem relevant, as the allocation of points between the three selected areas among
respondents should be less sensitive to this framing bias, and yet it displays a similar pattern
to the choice of field itself. Also, the ranking in the survey matches closely the – almost as
numerous – qualitative insights collected in the preparation of the survey and described in
the next section.
Figure 2: Choice of institutional areas
The analysis of choices of area by the characteristics of respondents yields contrasting
stories. The sub-sample of females (18 respondents) give very little weight to political
institutions, as illustrated in the left chart of Figure 3. On the other hand, they consider that
social cohesion, social protection, and solidarity matter more than the males do. This is also
the case for the relations between Tanzania and the rest of the world. The right chart of
Figure 3 categorises the answers by declared political affinity. The respondents who
declared their affinity with the ruling party emphasise the importance of land rights as one of
the three major impediments to development. This is clearly not a major point for people
closer to the opposition parties, who stress political institutions and public administration as

Collecting Insights for an Institutional Diagnostic of Development – Tanzania Institutional Diagnostic
© Economic Development & Institutions 9
the first two constraints. Whether close or opposed to the ruling party, both types of
respondents put law and order, justice, and security in their top three constraints. It is also
interesting that those respondents who did not declare – or refused to declare – their political
affinity (half the sample) overall have much less pronounced views about the most critical
institutional areas in Tanzania.
Figure 3: Choice of institutional field by gender and by declared political affinity
The choice of the top three constraints to development, according to respondents’ opinions,
is a piece of information in itself, but it also determines the questions asked to each
respondent. Given the explicit choices made during the selection of institutional field, at least
46 people would answer detailed questions related to ‘political institutions’, 51 about ‘public
administration’, and only four about ‘security of transactions and contracts’. The fact that
respondents face questions about their top three and not about other areas raises a
concern. Some less important areas would be left out and there would be no information
about them. Indeed, they could work well and therefore end up being unreported. They could
also work poorly but be considered unimportant for economic development. For these two
reasons, it is important to gather information about all areas. It was thus decided to add a
randomly selected module among the seven remaining ones to the three areas selected by
respondents. The number of random allocations appears in the third column of Table 3.
Thanks to these allocations, even the less critical institutional field, namely ‘security of
transaction and contracts’, is covered by 18 respondents, almost one-fifth of the sample.
Other fields have at least 29 respondents, with on average 10 respondents who had not
actively selected the field.

Collecting Insights for an Institutional Diagnostic of Development – Tanzania Institutional Diagnostic
© Economic Development & Institutions 10
Table 3: Number of respondents by specific institutional area questionnaire
Institutional area Explicit choice Random allocation Total
Political institutions 46 7 53
Law and order, justice, and security 37 5 42
Public administration 51 9 60
Ease of doing business 42 14 56
Dealing with land rights 26 12 38
Long-term and strategic planning 31 12 43
Market regulation 27 7 34
Security of transactions and contracts 4 14 18
Relation with the rest of the world 21 10 31
Social cohesion and protection, solidarity 18 11 29
1.4 The perceived functioning of institutions in Tanzania
Within and across areas, the CIS aims to identify, as precisely as possible, which specific
institutions are perceived as constraining by respondents. The subsequent analysis first
evaluates questions by their mean response on a scale ranging from 1, ‘most negative’, to 5,
‘most positive’. For questions asked in a negative way, the Likert scale is inverted to make
sure that a higher value always means a better perception. Questions are then ranked
according to the top weaknesses and strengths of Tanzanian institutions. The last part of the
analysis explores the heterogeneity of answers across sub-samples and tries to determine
whether the perception of institutional weaknesses is correlated with some salient
characteristics of respondents.
Figure 4: Distribution of questions by average score
0.5
11
.52
Den
sity
1.5 2 2.5 3 3.5 4 4.5Average score
Distribution of questions by average score

Collecting Insights for an Institutional Diagnostic of Development – Tanzania Institutional Diagnostic
© Economic Development & Institutions 11
A first look at the results of the survey delivers a relatively pessimistic view on Tanzanian
institutions. The average score is 2.95, slightly below the mid-point of the Likert scale, lying
at 3. As in many opinion surveys, there is a huge mass of answers around this central
position, which may reflect the default choice of respondents. It is therefore more interesting
to look at the tails of the distribution, namely questions with clearly positive or negative
answers. Figure 4 plots the distribution of questions by average score. It shows that the left
tail (negative perception) is fatter than the right one (positive perception). A total of 46
questions have an average score below 2.5, while only 27 score above 3.5. The most
extreme values on the negative side are also further away from 3 than their counterpart on
the positive side. The negative skewness of the distribution ( = -0.19) confirms the visual
inspection.
The distribution of questions across areas shows that low scores come disproportionately
from questions dealing with land rights, public administration, and ease of doing business. At
the opposite of the spectrum, good scores are more often reported in the areas related to
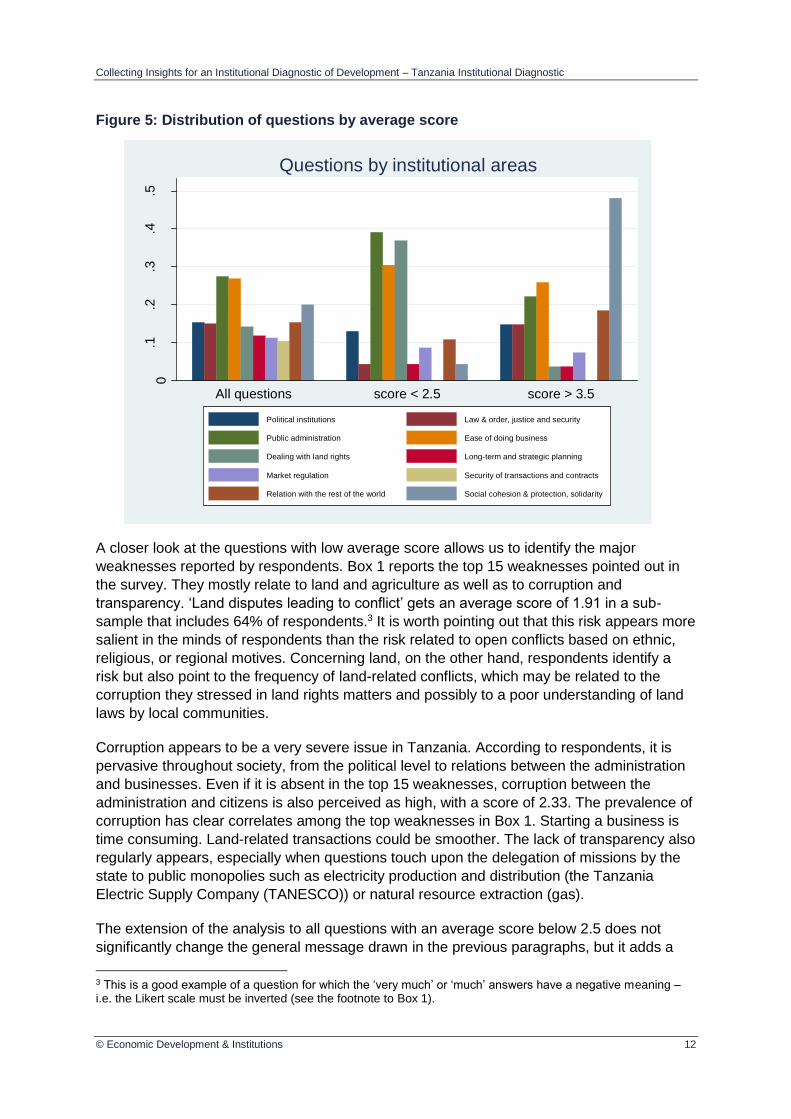
social cohesion, social protection, and solidarity. Figure 5 presents the relative frequency of
questions by institutional area.
The first part of the graph reports the distribution of all questions across the 10 areas. The
first bar in the first group shows in dark blue that 15% of the 345 questions of the CIS come
under the ‘political institutions’ heading. The dark blue bar in the second group of bars
reports that 13% of the 46 questions with a score below 2.5 are related to political
institutions. In the third group, which plots the distribution of questions with an average
response above 3.5, 14.8% of questions are part of the political institutions cluster. Not all
clusters have such a balanced pattern. ‘Public administration’, ‘ease of doing business’, and
‘land rights’ are largely overrepresented among low scores. Regarding ‘ease of doing
business’ and, to a lower extent, public administration, they sometimes record high scores
but in a lower number and proportion, something that we analyse later on. Matters related to
‘land rights’ are almost unanimously perceived as unsatisfactory. On the other side of the
spectrum, the ‘social cohesion, social protection, and solidarity’ area is addressed by 20% of
all questions, has only 4% of bad average scores and gathers 48% of questions with a large
average score.
Collecting Insights for an Institutional Diagnostic of Development – Tanzania Institutional Diagnostic
© Economic Development & Institutions 12
Figure 5: Distribution of questions by average score
A closer look at the questions with low average score allows us to identify the major
weaknesses reported by respondents. Box 1 reports the top 15 weaknesses pointed out in
the survey. They mostly relate to land and agriculture as well as to corruption and
transparency. ‘Land disputes leading to conflict’ gets an average score of 1.91 in a sub-
sample that includes 64% of respondents.3 It is worth pointing out that this risk appears more
salient in the minds of respondents than the risk related to open conflicts based on ethnic,
religious, or regional motives. Concerning land, on the other hand, respondents identify a
risk but also point to the frequency of land-related conflicts, which may be related to the
corruption they stressed in land rights matters and possibly to a poor understanding of land
laws by local communities.
Corruption appears to be a very severe issue in Tanzania. According to respondents, it is
pervasive throughout society, from the political level to relations between the administration
and businesses. Even if it is absent in the top 15 weaknesses, corruption between the
administration and citizens is also perceived as high, with a score of 2.33. The prevalence of
corruption has clear correlates among the top weaknesses in Box 1. Starting a business is
time consuming. Land-related transactions could be smoother. The lack of transparency also
regularly appears, especially when questions touch upon the delegation of missions by the
state to public monopolies such as electricity production and distribution (the Tanzania
Electric Supply Company (TANESCO)) or natural resource extraction (gas).
The extension of the analysis to all questions with an average score below 2.5 does not
significantly change the general message drawn in the previous paragraphs, but it adds a
3 This is a good example of a question for which the ‘very much’ or ‘much’ answers have a negative meaning – i.e. the Likert scale must be inverted (see the footnote to Box 1).
0.1
.2.3
.4.5
rela
tive fre
qu
en
cy o
f qu
estio
ns
All questions score < 2.5 score > 3.5
Questions by institutional areas
Political institutions Law & order, justice and security
Public administration Ease of doing business
Dealing with land rights Long-term and strategic planning
Market regulation Security of transactions and contracts
Relation with the rest of the world Social cohesion & protection, solidarity

Collecting Insights for an Institutional Diagnostic of Development – Tanzania Institutional Diagnostic
© Economic Development & Institutions 13
few more themes. The additional insights are very much related to regulation issues and the
intertwined relations between governmental actors and pressure groups. Regulation is
clearly viewed as a problem. For instance, in agriculture, access to financial input and price
volatility appears to be constraining. Information on the ownership of firms is seldom
available. Regarding utilities, regulation may reduce competition and prevent the emergence
of public–private partnerships, and, when privatisation occurs, it is far from obvious to
respondents that transfer prices reflected the market value of those firms. Respondents also
perceive that the decisions of the government could be more independent from external
influence. Foreign investors, donors, and international organisations do have a heavy –
perceived – weight in national decisions. Trade policies are seen as actively influenced by
lobbies and pressure groups. The government could give more autonomy to decentralised
actors and to the Tanzanian civil society. Local elected governments have little say in fiscal
affairs. There are few trade unions and they do not have a large autonomy with respect to
the ruling party. The broader analysis of the weaknesses also reinforces issues related to
land rights and the perception that land is a significant constraint for economic development:
land tenure insecurity hampers the development of the agricultural sector, local communities
and local bureaucracies have limited abilities to handle land operations with outside
investors, and the decisions they take are opaque. Transactions related to land leave scope
for corruption and regularly take place outside the legal system. No wonder that respondents
also point to corruption in this area.
Box 1: Top 15 major institutional weaknesses identified in the CIS
• To what extent do you feel that frequent land disputes might lead to open conflicts? (IS; 1.91; 64%)
• How large would you say is the degree of corruption in Tanzania at the following levels?
d) ‘Political level’ (e.g. vote buying, illegal and hidden campaign financing, bribery etc.)? (IS; 1.95; 81%)
b) between the administration and local businesses (IS; 2.08; 83%)
c) between the administration and foreign businesses (IS; 2.15; 85%)
• To what extent do land operations involve corruption:
b) in the relevant bureaucracy? (IS; 2.19; 78%)
• For small farmers, livestock rearers, and fishermen, how constraining for the development of their activities are:
d) price levels? (IS; 2.19; 36%)
• In your opinion, how likely is it that the creation of new trade unions will be affiliated to opposition parties ? (2.20; 49%)
• In the case of TANESCO, how much better would a private company do? (IS; 2.21; 51%)
• An intensive privatisation programme has been carried out since the 1990s. How well would you qualify the following aspects of this process:
a) transparency of privatisation procedures? (2.22; 83%)
• How well do you think local communities understand those aspects of the land law that are of concern to them? (2.22; 68%)
• In your opinion, to what extent is the slow development of utilities (electricity) due to an inefficient regulation of the sector that:
c) imposes unrealistic price caps? (IS; 2.22; 67%)
• How influential are the following foreign stakeholders in national economic policy?
b) donors and international organisations? (IS; 2.23; 93%)

Collecting Insights for an Institutional Diagnostic of Development – Tanzania Institutional Diagnostic
© Economic Development & Institutions 14
• How time consuming is it to start a business? (IS; 2.23; 86%)
• How frequent are land-related conflicts? (2.24; 54%)
• How transparent are public authorities in their strategy of the future exploitation of offshore natural gas reserves, including the role of foreign companies? (2.25; 57%)
For each question, we provide in parentheses: a) whether the Likert scale of the answer is inverted (IS means ‘much’ is bad, ‘little’ is good); b) the average score (between 1 and 5, with a lower score indicating a worse perception of institutions); and c) the share of the sample answering the question.
Strengths are also worth mentioning. If one question achieves consensus, it is the question
on the development of new technologies and their capacity to facilitate access to financial
services for a large part of the population. While this may have some institutional impact, it is
however a prospective question. Average scores go down as we look at more factual
questions. Respondents appreciate the limited discrimination based on geographical origin,
religion, and ethnicity. More generally, the sense of Tanzanian identity appears to be quite
strong. These positive statements should, however, be put into perspective. First, less than a
third of respondents were asked these questions. Second, the risk of internal conflict based
on regional differences, religion, or ethnic lines is nevertheless seen as moderately high,
with an average score of 2.31 and 42 respondents. The other very consistent feature in the
top 15 of institutional strengths (see Box 2) is the feeling of security. Respondents do
emphasise that people are free to form associations of a varying nature, violence against
political organisations is limited, and political authorities do have strong control over the
police.
An extension of the analysis to all responses with an average score above 3.5 corroborates
the perception that discrimination is fairly low in Tanzania, emphasises the importance of
foreign aid, and puts forward the role of social networks as insurance providers. On the first
element, namely discrimination, respondents find that access to public services such as
public schools or healthcare is not differentiated along ethnic, regional, or religious lines. On
the second element, the role of aid is widely recognised for its ability to provide funding for
infrastructure and improve health and education. Let us, however, put these two scores into
perspective. First, the only average score associated with aid that is below 3 indicates that
respondents perceive that aid might increase corruption. Second, respondents estimate, on
average, the proportion of aid in the budget of Tanzania at 36%, a number close to reality.
On the third and last element, respondents underline that traditional solidarity links (family,
neighbours, associations, religious organisations etc.) are well able to provide support to
those in need. Informal microfinance institutions provide rotating saving and credit
mechanisms. Respondents are quite confident that formal social protection mechanisms,
such as the Tanzania Social Action Fund, will act as a complement to informal systems,
without undermining them.
Box 2: Top 15 major institutional strengths identified in the CIS
• How confident are you in the fact that new technologies (smartphones) permit quick expansion of
the financial coverage of the population? (3.91; 81%)
• In your view, how frequent are cases of discrimination in employment or in income based on:
a) geographical origin? (IS; 3.82; 28%)
c) religion? (IS; 3.75; 28%)
b) ethnicity? (IS; 3.71; 28%)

Collecting Insights for an Institutional Diagnostic of Development – Tanzania Institutional Diagnostic
© Economic Development & Institutions 15
• How strong is the sense of national Tanzanian identity
b) in Zanzibar? (3.75; 28%)
a) in mainland Tanzania? (3.66; 29%)
• How frequent is the use of violence by underground political organisations? (IS; 3.73; 41%)
• How strong is the control of political authorities over the police? (3.71; 73%)
• How free do you think people actually are to form associations of a varying nature (religious,
ethnic, occupational, political parties)? (3.71; 85%)
• How important are academic qualifications to get positions in high public administration or in
formal firms’ management? (3.70; 91%)
• How secure do you feel Tanzania is for people? (3.61; 42%)
• How important are private joint ventures between Tanzanian firms and foreign partners in
domestic markets? (3.62; 63%)
• How strong would you say discrimination or segregation are in practice on grounds of
geographical origin, in the case of migrants? (IS; 3.61; 28%)
• To what extent is the presence of protected natural areas beneficial for the economy of Tanzania?
(3.61; 38%)
• How frequent are strikes in the public sector? (IS; 3.60; 98%)
For each question, we provide in parentheses: a) whether the Likert scale of the answer is inverted (IS means ‘much’ is bad, ‘little’ is good); b) the average score (between 1 and 5, with a lower score indicating a worse perception of institutions); and c) the share of the sample answering the question.
Relying on average answers to draw conclusions on institutions is informative but does not
exploit the richness of the CIS, in particular the heterogeneity in the respondents’ answers
according to their characteristics. Figure 6 represents the nine variables with the largest
statistical difference between male and female respondents.4 The perceptions of men and
women strongly differ about discrimination. Women considers that the Tanzanian state
discriminates along religious, ethnic, or regional lines. The top left graph in Figure 6 displays
the distribution of answers relative to the discrimination in access to justice. With an average
score of 2.29, men consider that there is little discrimination in the access to justice. Women,
on the other hand, have an average perception of 3.63, a score reflecting a situation where
there is much discrimination in the access to justice. This is a large difference. In the top
nine differences, discrimination appears four times: in access to justice, to public health care,
and to administrative authorisation, as well as generally against women. Women are also
much more worried about the social consequences of easier access to formal banking. The
remaining differences stress the influence of interest groups in the design of policies, women
considering it stronger than men.
4 By largest statistical difference, we mean the largest t-stat derived from two-sample t-tests of mean comparisons. Given the small number of respondents, this measure makes more sense than sorting questions by the absolute difference in their means, since a group could easily shrink to one individual.

Collecting Insights for an Institutional Diagnostic of Development – Tanzania Institutional Diagnostic
© Economic Development & Institutions 16
Figure 6: The nine questions with the largest statistical difference between male and Female respondents
Figure 7 repeats the exercise but for differences between respondents declaring a political
affinity with the ruling party compared with those declaring a political affinity with the
opposition party. It is not surprising that the opposition formulates more criticism in matters
that are directly influenced by the government. The judiciary system is depicted as very
independent by respondents close to the ruling party, while the opposition has the opposite
perception. The argument can be repeated for the army and the police. As a correlate, civil
liberties are said to be limited by respondents belonging to the opposition, while they are
described as satisfactory by respondents belonging to the ruling party. Respondents with no
declared affinity are, on average, in the middle of these two perceptions. With respect to
governance of natural resources, however, respondents with no declared affinity tend to tilt
their answers in the direction of the opposition.
Average scores have not been normalised. A high score does not necessarily mean that respondents have a positive feeling. Scores should be read together with the question they refer to.

Collecting Insights for an Institutional Diagnostic of Development – Tanzania Institutional Diagnostic
© Economic Development & Institutions 17
Figure 7: The nine questions with the largest statistical difference between declared political affinity with the ruling or the opposition party
Average scores have not been normalised. A high score does not necessarily mean that respondents have a positive
feeling. Scores should be read together with the question they refer to.
The same type of exercise can be repeated for all sub-groups in the survey. In the interest of
space, only the main insights from such an exercise are listed below.
On average, the 29 respondents who studied abroad, including the six foreign diplomats,
are more sensitive to matters related to trade and to the influence of foreign stakeholders
in national economic policies. They perceive Tanzania as being very exposed to
competition from foreign firms, whether from neighbouring countries, other developing
countries, or advanced economies. They are also concerned by the fact that foreign
firms and powers are an obstacle to the implementation of autonomous policies and
reforms.
Being involved in business activities raises the awareness that foreign firms have an
easier time establishing themselves in Tanzania and gaining access to funds from local
banks. Despite being active in the private sector, these respondents find that accessing
information on the structure of the ownership of large firms is quite difficult. Overall,
business leaders are rather pessimistic about the progress of the middle class and

Collecting Insights for an Institutional Diagnostic of Development – Tanzania Institutional Diagnostic
© Economic Development & Institutions 18
consider that networks are important for accessing top official positions, compared with
merit-based promotion.
1.5 From the perception of the past to a prospective assessment
Both for strengths and weaknesses, it should be kept in mind that the CIS intends to capture
the perception of institutions in the last five to 10 years before the survey took place. The
CIS came about one year after President Magufuli was sworn in. The timing of the survey is
therefore quite interesting for gaining some insights into what respondents anticipate about
the future evolution of institutions in Tanzania. At the end of the interview, respondents were
asked how Tanzanian institutions had recently evolved and whether their answers to the
questions on the core part of the CIS would have been different if reference had been made
to the recent past or the near future of Tanzania.
As many as 28 respondents explicitly mentioned the drop in corruption and increased
transparency and accountability as major recent changes in Tanzanian institutions. They
explained that civil servants abide by the law more. Side payments and bribes have
drastically been reduced according to the perception of more than a quarter of the sample. If
questions were about the recent past and not on a longer timeframe, most felt that corruption
would probably be less frequent among the major institutional weaknesses in Tanzania.
A corollary of the reduction in corruption is the increase in tax collection. Fifteen respondents
said that the recent surge in tax collection efficiency would have changed the way they
answered the core part of the survey. They felt that taxpayers had a harder time bypassing
their tax duties, and some of them were even put into financial trouble, according to a few
respondents. They also mentioned that some firms had to close business, that many of them
had liquidity constraints and that it had become harder to make money. On the public
spending side, more effective tax collection was viewed as raising the capacity of the state to
accomplish its mission. It was expected that, combined with greater accountability, this
would be a guarantee of better use of public resources. Eighteen respondents mentioned
that public service provision was improving, especially in the dimensions related to
education, health, and infrastructure. Five of them thought this was the result of a change in
the work spirit of civil servants and could eventually lead to more equal coverage of public
services, to less discrimination, and to less importance of social networks when applying for
a position in the public service. Clearly, however, these perspectives of a more equal and
meritocratic society are aspirations and hopes, rather than what respondents have already
experienced. A more profound comment made by some respondents addressed the depth
and sustainability of current changes, and whether they could alter the development path of
the country.
A critical juncture between hopes and effective long-term changes is probably reflected by
the weight that respondents put on the freedom of expression. More than 10% of the sample
explicitly pointed out that it was hard to express views challenging the government.
Respondents stressed that free press, free media, and even demonstrations were essential
for the accountability and transparency of public affairs. The independence of the judiciary
system was also mentioned as building up the credibility of the executive towards citizens
and firms. This perception was not limited to the opposition. In effect, the fear was

Collecting Insights for an Institutional Diagnostic of Development – Tanzania Institutional Diagnostic
© Economic Development & Institutions 19
sometimes expressed that the new administration could depart from these principles. The
risk of autocracy was mentioned in a few cases.
Another point deserving scrutiny is highlighted by five respondents, namely the fact that
land-related issues are finally receiving attention. They did not state which questions they
would have answered differently given potential new developments on land issues, nor did
they enter into greater details about the latter.
1.6 Discussion and conclusions
From the CIS, a broad consensus emerges pointing to the following institutional challenges.
As far as general institutional areas are concerned, the major concern is about political
institutions, public administration, and the ease of doing business. The justice system comes
just afterward. Other areas are further down, but, to a large extent, one may consider they
are included in the areas at the top – e.g. land rights management may be covered by public
administration and security of contracts by the judiciary. As a matter of fact, this overlap of
areas was quite explicit in the questionnaire, since individual questions most often appeared
under several headings.
Individual questions permitted us to go deeper into the perception of the respondents.
Putting them together leads to the following list of consensual institutional challenges that
surfaced:
The management of land rights
Corruption at the level of both the political game and the public administration
The regulation of the economy, in particular of infrastructure
The lack of transparency and accountability of the state
It can be seen that the four items cut across all the general areas mentioned earlier.
On the strength side, the survey again shows some consensus around the sense of national
identity and security, which implicitly seem to point to political stability.
The open-ended discussion with the respondents at the end of the interview allowed us to
check that the recommendation made to them to complete the questionnaire bearing in mind
the institutional Tanzanian context during the last five to 10 years had been well complied
with. This does not prevent optimistic expectations and hopes about the way the present
administration might address some of the preceding challenges.
Stepping back from the analysis, the CIS may look like just one more effort to collect
information on institutions or design broad governance indicators based on the opinion of a
few experts. This is only partly true. As a way of proof, use has been made of the fact that
many questions in the CIS overlap with the IPD questionnaire submitted to some French
diplomats posted in Tanzania. Based on common questions between the two
questionnaires, it is possible to measure the degree of correlation between the opinion of a
sample of 100 economic, administrative, or academic actors in Tanzania and that of a few
close foreign observers. There is some convergence between the two surveys, but it is very
partial.

Collecting Insights for an Institutional Diagnostic of Development – Tanzania Institutional Diagnostic
© Economic Development & Institutions 20
The correlation between comparable questions of the CIS and the IPD is only 0.3 for an
overlapping temporal window5. Combined with the significant differences between the
answers given by different sub-samples discussed in the previous section, this low value of
the coefficient of correlation shows the importance of the choice of respondents in such
surveys. Many studies rely on very few respondents per country, who often share a similar
position in the society. This is typically the case of the sample underlying the World
Economic Forum ranking comprising a few foreign business managers. For the IPD, French
diplomats complete the questionnaire. They have their own view of institutions, which may
not be shared by Tanzanian or even other foreign diplomats active in Tanzania. The
correlation between the average answers given by Tanzanians and the average answers
given by foreigners within the IPD is 0.58. Table 4 also shows that the correlation between
foreigners in the CIS and the IPD is only 0.22.
Table 4 : Correlation between the CIS and the IPD
Correlation based on the 130 questions comparable between the CIS and the IPD
By enlarging the sample of respondents, the CIS is innovative and offers a more diverse
view on institutions. Within broad areas, the CIS yields more precise answers on what goes
wrong and for whom. It allows us to analyse the diversity of perceptions across population
groups in the society, which is essential in interpreting sample averages. The sample could
even be larger, to cross-validate averages.
The most stringent limitation of the CIS is probably the systematic use of the Likert scale to
collect perceptions on institutions. Another strategy may be to rely on more factual questions
on actions or results that are influenced by institutions. For instance, the questions could be
on the number of times respondents had to pay bribes and their amount, rather than on their
perception of corruption. While the latter approach is also interesting, it requires a different
sampling, closer to the AfroBarometer. On the other side of the spectrum, long and repeated
interviews with a smaller sample, selected with great care from the first-tier of decision
makers, may allow us to collect deeper insights into Tanzanian institutions from the people
who had to made decisions about them and presumably knew more about the challenges
and possible solutions. The next section summarises the results from such an approach in
Tanzania.
5 The IPD was conducted in 2012 and asked questions on the prevailing institutional conditions at that time. The CIS was carried out in 2017 but covered institutions in the previous five to 10 years, creating a large overlap between the two surveys.
CIS CIS: without foreigners CIS: foreigners IPD
CIS 1.00
CIS: without foreigners 0.99 1.00
CIS: foreigners 0.58 0.49 1.00
IPD 0.30 0.29 0.22 1.00

Collecting Insights for an Institutional Diagnostic of Development – Tanzania Institutional Diagnostic
© Economic Development & Institutions 21
2 Open-ended interviews with top decision makers and policymakers
In addition to formally surveying a large number of private and public decision makers and
observers of the political, social, and economic life in Tanzania, several experts, some of
whom are at the highest level of responsibility in the country, were also interviewed on an
informal or open-ended basis. They were not asked to complete the questionnaire as part of
the systematic survey just discussed. They were simply asked what they thought were the
binding institutional constraints in Tanzania, but then other issues came up in the general
discussion. The main points drawn from these interviews from the perspective of an
institutional diagnostic of Tanzania are summarised below.
The experts who were interviewed are not representative of any specific population sub-
group. They are simply people who, because of the responsibility they have today, or had in
the past, as political leaders, top civil servants, business executives, NGO directors, or
researchers, have been led to deeply reflect on Tanzanian institutions, their potential role in
slowing down economic development, and possible directions for reform. Yet, in
approaching them, care was taken to indeed have as much diversity of viewpoints as
possible, either in terms of occupation – i.e. the various occupations listed above – or in
terms of perspectives on the Tanzanian economy – e.g. ruling party vs. opposition. One may
thus say that, taken together, the opinions of the personalities who were interviewed make
up a sample of the way the various components of the elite think about the nature of
Tanzanian institutions and their potential role in preventing faster development. It can be
seen from the list of people being interviewed in this chapter that they are fairly diverse, from
think-tank directors and academics, to leading business leaders, to personalities at the very
top of the state hierarchy, including two past presidents, the present Chief Justice and the
present Controller Auditor General.
The first question asked to all of them as an introduction to the discussion was: ‘In your
opinion, which kind of institution, formal or informal, is preventing economic development in
Tanzania from accelerating?’. Then an open, mostly informal and definitely ‘off the record’
discussion followed, very much led by the person being interviewed. The following
paragraphs offer a synthesis of what could be drawn from these very rich interviews for the
present study. They cannot do justice to the richness of about 50 fascinating hours of
discussion and the deep insights they provided for the pursuit of this institutional diagnostic
exercise.
The four areas most intensively discussed directly or indirectly have to do with the
management of the state and civil service. More precisely they are: a) the issue of
corruption; b) the functioning of civil service, including the issue of decentralisation; c) the
regulation of public and private firms; and d) the land use rights. All these areas are closely
related as it can be seen that corruption is the natural consequence, and at the same time
the cause, of a dysfunctional bureaucracy and/or badly coordinated regulations. Likewise, it
is the multiplicity of regulations and laws that makes civil service inefficient. Finally, the
management of land use rights, which is almost systematically cited as a major obstacle to
development – both in agriculture and in urban areas – may be taken as a good example of
the effect of weak capacity and corruption in some parts of the bureaucracy and a partial
understanding of a well-crafted but complex law.

Collecting Insights for an Institutional Diagnostic of Development – Tanzania Institutional Diagnostic
© Economic Development & Institutions 22
Three other general institutional areas have been stressed, but with less frequency and less
strength, by the personalities being interviewed. The first one is the issue of political checks
and balances, or more generally the actual functioning of the political system; the second
one is the mindset of the population, including that of the public bureaucracy; the final one is
the capacity and functioning of the judiciary system.
Corruption is uniformly seen as both a widespread evil and a fundamentally deleterious
factor for development in Tanzania, even though the point is sometimes made that Tanzania
is not necessarily worse than its neighbours in East Africa or even than better performing
countries in terms of economic growth (see above). As a matter of fact, corruption
undoubtedly plays an important role in the public opinion and is a central issue in election
times. As was explained in Chapter 1, it arose around the end of the socialist era and grew
more rapidly under President Mwinyi’s mandate at the time of the transition towards a
market economy. President Mkapa was elected on the basis of an anti-corruption platform
and commissioned Judge Warioba to produce a report on corruption, which revealed how
widespread it was and proposed some corrective measures. Yet major corruption scandals
have taken place during each presidential mandate ever since President Mwinyi. Recently,
President Magufuli was elected in large part on his reputation of high integrity and his anti-
corruption platform. The causes of petty and grand corruption may be different, but they are
seen as equally detrimental to development. Corruption is often attributed to the relatively
low level of income of politicians and civil servants in comparison with the private sector and,
for politicians, in view of the uncertainty of their position. Yet ‘needs’ is only one part of the
story. Greed and a mindset that does not consider paying or accepting bribes as dishonest
are the other part of the story. Also, the lack of coordination of regulations, administrative
rules, and laws offers numerous rent-seeking opportunities in the various layers of the
bureaucracy. Raising salaries – and, for high-level politicians, creating compensation that
facilitates life after leaving office – may be part of the solution to reduce corruption to a
tolerable level. Reforming the organisation of the state by coordinating laws and rules so as
to eliminate rent-seeking opportunities is equally important. Yet publicly identifying and
formally prosecuting those found guilty of corruption, whether as a corruptor or a person who
is corrupted, is central to any anti-corruption strategy.
Even though some of the personalities interviewed tended to minimise the consequences of
corruption, most stressed the development cost arising from the misallocation of resources
involved in grand corruption, the undermining of the profitability of some investments through
import smuggling (e.g. sugar, rice), bribes to acquire business licences, land use rights or
trade permits, and, most importantly, the loss of tax revenues leading to inefficient, and
ineffective, higher tax rates.
The inefficiency of the civil service, stressed by most interviewees, has very much to do with
corruption, but, as suggested above, both find their root cause in the way the state
bureaucracy functions. A weakness frequently pointed to is the multiplicity of regulatory
bodies, ministerial bureaus or public agencies that have their say in specific areas. One
expert mentioned that the production and commercialisation of a new food product would
require 22 authorisations from different administrations. Another reported that, overall, the
farming sector was administered through 15 different public entities. Others mentioned the
frequent discrepancy between local government decisions and rules enacted by the central
government. Of course, the problem may not be the number of public entities having a say
on some aspect of the economy, but the lack of coordination among them, leading to
Collecting Insights for an Institutional Diagnostic of Development – Tanzania Institutional Diagnostic
© Economic Development & Institutions 23
ineffectiveness and rent-seeking opportunities for bureaucrats having the power to shortcut
the whole system. A good example of a reform aimed at simplifying things was the creation
in 1995 of the Tax Revenue Authority, which centralised tax collection operations formerly
under the responsibility of various decentralised administrative entities. Another more recent
example of the need for coordination among public entities is the creation of the President’s
Delivery Bureau, in charge of coordinating efforts to reach the National Key Result Areas6
through the monitoring and evaluation of various administrations.
Another weakness of the civil service stressed by a number of experts is the low capacity of
the bureaucracy. This might be due as much to insufficient human capital at a higher level as
to excessive movements of bureaucrats caused by political cycles. There seemed to be a
consensus that it was at the local level that the bureaucracy was the least effective. In
particular, the point was made that the poor understanding of laws by the public gives undue
power to local bureaucrats, which they use for inefficient decisions and, often, their own
profit. More generally, the question was raised as to the efficiency of the way
decentralisation is being implemented.
The regulation of production activities is of utmost importance for economic growth as it
affects the competitiveness of the production apparatus and the investment climate. It is
judged to be deficient in Tanzania in several ways. First, companies that are still state-
owned, after the wave of privatisation that took place throughout the 1990s and early 2000s,
were reported by some experts as inefficiently managed or inefficiently regulated. The most
obvious case seems to be that of TANESCO, the public company responsible for the
distribution and the larger part of the production of electrical power – an area where
Tanzania appears to be lagging behind most African countries. It was reported that its
regulatory agency, the Energy and Water Utilities Regulatory Authority, maintains a cap on
the price of electricity, which essentially makes TANESCO unprofitable, increases its debt
burden, and prevents it from investing in a badly needed expansion of coverage. It was also
reported that several public–private partnerships in power generation failed because of
inadequate tariffs and uncertainty about potential nationalisation. A major reorganisation of
TANESCO has recently been confirmed, which consists of breaking the company into
various functional entities – i.e. unbundling – and issuing shares to the public. How
regulation will be modified is not yet clear. Other state-owned companies that were found to
be underperforming include the telephone company Tanzania Telecommunications
Company Ltd and the petroleum company Tanzania Petroleum Development Corporation.
It is worth stressing that interviewees with a deeper knowledge of the energy sector pointed
to a rather different diagnostic about the difficulties of the power sector. It was pointed out
that the agency, which had been operating for a relatively short period of time but enjoyed
international recognition for its professionalism, was making rigorous recommendations and
followed world best practice in this area. The interpretation was therefore that political
6 These areas correspond to the implementation of the BRN (Big Results Now) initiative by President Kikwete to accelerate progress towards the 2025 Tanzanian Development Vision, including the status of a middle-income country.

Collecting Insights for an Institutional Diagnostic of Development – Tanzania Institutional Diagnostic
© Economic Development & Institutions 24
pressure was often making their recommendations imperfectly and incompletely
implemented.7
With regard to state-owned companies, it was also fairly surprising to learn in one of the
interviews that many of the numerous privatised state-owned companies were no longer
functional. This suggests that those parastatals were indeed extremely inefficient and were
bought essentially for their equipment and buildings, rather than their activity. It is also
possible that the private management of these companies did not benefit from the same
competitive advantages as when they were state-owned.
Concerning the private sector, the complaint most often heard is that too many regulations
are a strong disincentive for investment, whether domestic or foreign. In natural resources,
the view is that capital, knowledge, and know-how are needed but that foreign investors still
fear the risk of nationalisation – despite a foreign direct investment act explicit in dismissing
that risk. In manufacturing, the opinion is that domestic firms prefer investing in trade than in
production, subject to more and heavier regulation. Foreign direct investments are more
oriented towards the exploration and extraction of natural resources, telecommunication
services, and tourism, all sectors where regulation is apparently also heavy.
The excessive number and the complexity of regulations are also mentioned as the main
reason small and medium enterprises (SMEs) do not formalise, although the actual gain, as
in many other developing countries, is not well established.
The management of land use rights is the best example of the consequences of an
inefficient and sometimes corrupt bureaucracy and a legislation that is complex and thus not
well known or understood by the public. The uncertainty on land rights is very often cited as
a real handicap in developing the agricultural and agro-industrial sector, and in some cases
even industrial projects in urban areas. As far as the latter are concerned, a frequently cited
example is that of the two to three years it took to get the land use right needed to construct
a liquefied gas terminal on Tanzania’s coast. In agriculture, everybody seems aware of the
long delays investors face in acquiring land rights and the bribes they end up offering to
shortcut cumbersome processes. Corruption involves not only local or regional bureaucrats
responsible for land operations, but also village chiefs. Land is the subject of the second
largest number of judicial cases, often with individual investors confronting the local or
regional authorities responsible for the allocation of land. Many disputes also arise from
farmers squatting or claiming back land allocated to investors but not fully utilised.
Land is property of the state in Tanzania and was actually collectivised during the socialist
era. After a long maturation process, a Land Act was passed in 1999 that codified the
operations on land use rights, in particular to facilitate investment. It is considered to be a
good law, but its implementation at lower government levels is said to be problematic
because of the lack of capacity of local bureaucracies and a poor understanding of the law
by villagers. There also seems to be little accountability of the civil servants responsible for
land operations with respect to both investors and the local population. Records of these
operations are also said to be badly managed.
7 As a matter of fact, the head of EWURA was replaced by the president a little after having recommended a tariff increase that followed agreed pre-defined rules. The tariff increase was not implemented. This occurred a few weeks after he was interviewed with his management for the present study.

Collecting Insights for an Institutional Diagnostic of Development – Tanzania Institutional Diagnostic
© Economic Development & Institutions 25
In a country where land is abundant, and agriculture has great potential, such ambiguity on
land use rights is unfortunate. It also has negative consequences in urban areas.
The functioning of the political system naturally came up in the interviews. The main issue
was the accountability of the government and the nature of checks and balances on the
executive. Emphasis was put in particular on the key role of the Controller Auditor General
and the need for the content of his annual report to be better publicised and publicly
debated, and for the auditing of public entities to go beyond official accounts. The view was
expressed that more space should be given in parliamentary debates to review the
government’s actions. This seemed to several experts all the more important in a country
where the president enjoys considerable power, and until recently was able to control the
entire bureaucracy, and to some extent the legislature. Things may be changing as the
opposition and political competition are rising. The relationship between the two members of
the Tanzanian Union – i.e. the mainland and Zanzibar – was also seen as a sensitive issue
which has now been discussed for some time in relation with a reform of the constitution.
The judicial system would seem to be the main instrument to fight corruption. The interviews
emphasised its lack of resources. At present 16% of the 180 districts do not have a court
and a third of the regions have no high (i.e. appeal) court. The judicial system is thus in a
constant state of congestion. Corruption is also present among the staff, due in no small part
to outdated information technology that generates frequent involuntary (or voluntary?) losses
of key pieces of evidence.
Although at the edge of institutional issues, the mindset of the population with respect to
specific issues was frequently mentioned in the interviews as being responsible for slowing
down economic development. Several experts indeed thought there was still a suspicion with
respect to the private sector in the civil service and possibly in public opinion, which
somehow acted as a brake on development. The lack of a true culture of business was also
emphasised, of which evidence may lie in the disproportionate number of non-indigenous
among entrepreneurs, the opposite being true in the political sphere.
3 Comparative analysis based on institutional indicators: how ‘different’ is Tanzania from other developing countries?
Since it has been realised that institutions matter for development, a conclusion that, in fact,
goes back to the early days of development economics, all sorts of country-level indicators
have been developed. They are meant to permit cross-country comparisons and to correlate
in a very rough way institutional quality with growth or development level on a cross-
sectional basis. Many international databases are now available that either focus on a
specific institutional area – democracy, corruption, ease of doing business – or cover a wide
range of features. The Quality of Government (QoG) metric that follows gathers the
information from all these datasets to provide a database as close as possible to exhaustive.
It comprises some 2,500 indicators for 140 countries.8
8 Of course, all 2,500 variables are not available for all countries and all time periods.

Collecting Insights for an Institutional Diagnostic of Development – Tanzania Institutional Diagnostic
© Economic Development & Institutions 26
A first contribution of this section is to propose an original methodology to summarise the
vast number of indicators related to institutions and apply it to Tanzania. The core part of the
section only presents the application to Tanzania, while the methodology is presented in the
appendix A2 at the end of this chapter. Facing such a large number of individual indicators,
or variables, the idea is to group together variables that are the closest to each other in
terms of informational content or, in the present context, the most correlated across
countries. The novelty is thus to bring variables together based on a pseudo-clustering of the
variables themselves and not of their labelling. In other words, the aggregation of individual
indicators in the database is done by looking at how close they are across countries, rather
than a priori on the basis of what they represent. Once this is done, a principal component
analysis is conducted for each group of variables to extract a unidimensional indicator that
explains the maximum share of the variance of the group. The method thus first defines
groups of variables by maximising the variance between them (and therefore minimising the
variance within groups) and then finds a single combination of the variables in each group
that maximises the share of the within-group variance represented by this combination.
Altogether, the method thus extracts the maximum information from the overall set of
individual indicators in the database through a small arbitrary number of aggregate
indicators.
This approach is similar to the one used by Kaufmann and Kraay (2002). In the construction
of the World Governance Indicators (WGIs), these authors first decided to create six
institutional subthemes: ‘Voice and accountability’, ‘Political stability and lack of violence’,
‘Government effectiveness’, ‘Regulatory quality’, ‘Rule of Law’, and ‘Control of corruption’.
Then they sort, in a discretionary way, questions of various cross-country surveys according
to their conceptual fit with the preceding categories. Their last step, as above, is to create a
unidimensional index for each of these categories. The alternative method described earlier
sets the discretion at a different stage. Variables are first grouped by their statistical similarity
in an algorithmic way. Once statistical closeness is computed, the number of groups is
chosen largely in a discretionary way. Then, each group is labelled according to the
variables it comprises and a unidimensional aggregate indicator is estimated for the group.
The main advantage of the latter procedure is to bypass the discretionary labelling of
questions, but its drawback is to make the labelling of the resulting aggregate indicator more
intricate. Indeed, the procedure allows the closeness in the informational content of
potentially very different questions to be detected. The drawback of grouping variables in an
agnostic way is to make the labelling of the resulting groups less intuitive. The labelling
method used in what follows simply consisted of imputing to each aggregate indicator the
institutional area most frequently associated with the individual variables in the
corresponding group.
3.1 Application to Tanzania
In the application of the method to Tanzania, we end up with six aggregate indicators,
presented in Table 5. The appendix A2 further explains the rationale behind this grouping.9
The first group contains 51 indicators. We label it as a group of indicators related to the
democratisation of countries. The second group mostly deals with indicators related to
9 For the sake of compactness, the full lists of indicators within each group are available upon request.

Collecting Insights for an Institutional Diagnostic of Development – Tanzania Institutional Diagnostic
© Economic Development & Institutions 27
human rights. The third group is clearly related to the administrative capacity of the state.
The fourth group relates to the equal implementation of the law and the control of corruption.
The fifth group gathers indicators related to conflict and violence, and the sixth group is a set
of indicators collected by the World Economic Forum on competitiveness in the private
sector.
Table 5: Description of the six groups of indicators
The next critical step in the analysis of Tanzanian institutions is the choice of countries with
which Tanzania could be compared. There exists no absolute benchmark of institutional
quality. There is no consensus on the characteristics of the optimal set of institutions that
could best favour a balanced development. The only way to proceed is therefore to compare
Tanzania with a priori relevant countries. We opt for two different restricted comparison
groups:
First, it is relevant to compare Tanzania with neighbouring countries, which may share
with it a common or close history, natural environment, comparative advantages, or
political and economic organisations. Are all these countries homogeneous in terms of
institutional quality, thus reflecting some strong regional common factor? Or do they
differ, especially Tanzania, and how?
Second, another natural set of comparators are those countries that were at the same
level of development, as measured by GDP per capita, as Tanzania 20 or 30 years ago
and have done better since, in other words, outperforming peer countries. After all,
Tanzania hopes to become a middle-income country as these countries did not too long
ago. How do they differ in terms of institutions?
The first group includes the East African community (Burundi, Kenya, Rwanda, Uganda), to
which three countries on the southern border of Tanzania (Malawi, Mozambique, and
Zambia) were added. 10 The second comparison group includes Bangladesh, Cambodia,
Laos, and Vietnam.
Figure 8 compares Tanzania with neighbouring countries along the six synthetic indicators
identified in the preceding section. Two outliers are readily apparent: Burundi, which
underperforms all other countries in all dimensions, and Rwanda, which largely outperforms
all other countries in competitiveness, administrative capacity, lack of conflict and violence,
and corruption, but underperforms in the dimension of democratisation and human rights.
10 South Sudan and Democratic Republic of Congo were not included due to lack of data.
Group Number of indicators
Label
Variance capture by the first principal
component within the group
G1 51 Democracy 69%
G2 18 Human rights 50%
G3 35 Administrative capacity 35%
G4 35 Rule of law and corruption 36%
G5 22 Conflict and violence 30%
G6 19 Competitiveness according to the
World Economic Forum 56%

Collecting Insights for an Institutional Diagnostic of Development – Tanzania Institutional Diagnostic
© Economic Development & Institutions 28
Figure 8: Synthetic indicators: Tanzania vs.
neighbouring countries
Figure 9: Synthetic indicators: Tanzania vs.
better performing developing countries
Abstracting from these two outliers, the countries are fairly homogeneous. Tanzania ranks at
the top or near the top in terms of democratisation, human rights, and the control of
corruption, and in the middle for lack of conflict and violence and competitiveness. Overall, it
is fair to say that Tanzania ranks in the upper part of the scale, never at the bottom, even
excluding Burundi, for all six indicators.
Figure 9 makes the comparison with outperforming peer countries. An important point to
stress, however, is that the comparison is made today rather than at some point during the
period over which comparator countries outperformed Tanzania. It is quite possible that the
quality of institutions substantially changed, both in Tanzania and in comparator countries,
so that differences or resemblances today may not reflect exactly differences 20 years ago.
Still, what is striking in Figure 9 is the fact that Tanzania ranks at the top or near the top of all countries according to the six indicators, except for competitiveness, where it ranks below Laos and Cambodia, but at the same level as Vietnam and above Bangladesh.
If the institutional indicators identified by the procedure described above are thought to play
a role in explaining the economic growth performances of a country, the similarity across
countries observed in Figure 9 is consistent with the similarity in the GDP rates of growth of
these countries today – slightly above 6% over the last five years, but with a faster rate of
demographic growth in Tanzania. The difference in growth performances over the last three
decades or so should thus come from institutional differences during that period, or
institutional changes that took place at a different point in time. Unfortunately, the existing
databases on institutions do not permit going back very far in time.
Figures 10 and 11 perform the same comparison as above using the WGIs instead of the
synthetic indicators constructed from the QoG database. The nature of the indicators is
somewhat different. Competitiveness, which actually stands largely for the investment
climate, is absent from the WGIs, although it is included together with other criteria in
‘regulatory quality’; ‘control of corruption’ and ‘rule of law’ are separate indicators, ‘political
stability’ may be more general than ‘lack of conflicts and violence’, and ‘administrative
capacity’ in the QoG synthetic indicators is now broken down into ‘government effectiveness’
and ‘regulatory quality’.

Collecting Insights for an Institutional Diagnostic of Development – Tanzania Institutional Diagnostic
© Economic Development & Institutions 29
The institutional diagnostic that results from the comparison of Tanzania with neighbouring
countries using the WGIs is similar to the conclusions drawn from the QoG synthetic
indicators. Burundi and Rwanda are still regional outliers and Tanzania never ranks at the
bottom of the scale for any of the indicators. It performed slightly better than other countries
in the QoG synthetic indicators. With the WGIs, there is no marked difference. One thing to
note, though, is the low performance of these countries in the control of corruption and
government effectiveness dimensions.
When the comparison is made with better performing countries, the same conclusion is
obtained as with the QoG-based indicators. Tanzania ranks high on the six indicators. As a
matter of fact, it strictly dominates Bangladesh, Cambodia, and Laos as it ranks higher in
each of the six dimensions. It is only outperformed by Vietnam in government effectiveness,
the control of corruption, and political stability.
3.2 Comparison with other countries, from the user point of view
The preceding aggregate indicators most often originate from experts who presumably have
inside knowledge about the way institutions work in a country and are able to make country
comparisons. Views may be different among firms and citizens, more concerned as users of
institutions with the practicalities of everyday life than with the aggregate efficiency of the
economy. For instance, grand corruption or the relationship between the executive and the
parliament may not particularly affect the operations of SMEs. Also, the perception that
ordinary citizens may have of institutional quality may differ from that of experts, but matters
politically as parties and candidates rely on it at election time. As a matter of fact, it may be
modified through this channel.
As a complement to the preceding analysis of aggregate indicators, this section compares
Tanzania with the same set of countries using two surveys representative of ‘users’ of
institutions: the World Bank Enterprise Survey and the AfroBarometer. The former is a firm-
level survey based on a representative sample of the private sector of each country
Figure 10: WGIs: Tanzania vs. neighbouring
countries
Figure 11: WGIs: Tanzania vs. better
performing developing countries

Collecting Insights for an Institutional Diagnostic of Development – Tanzania Institutional Diagnostic
© Economic Development & Institutions 30
analysed. The questionnaire is designed to collect the opinion of entrepreneurs on their work
conditions and facts on their daily experience. The AfroBarometer, also based on a
representative sample, is an effort to collect attitudes of African citizens towards democracy,
governance, living conditions, civil society, and related topics. Both the World Bank
Enterprise Survey and the AfroBarometer refer to the period 2012–13 for Tanzania. It is
quite similar to the time window of the QoG dataset.
3.2.1 World Bank Enterprise Survey
From the point of view of firms, the institutional context is very constraining. Compared with
neighbouring countries, it is only in Burundi that entrepreneurs feel more constrained in
some dimensions of their activity. Figure 12 shows that firms in Kenya, Mozambique, and
Uganda feel much less constrained than in Tanzania, since their radar chart is strictly within
the yellow curve depicting Tanzania, and by a large margin. If Tanzania is compared with
better performing countries, as in Figure 13, the difference is even more striking. Less than
15% of firms feel constrained in these countries (except in Bangladesh, where corruption
and electricity shortages appear as a major constraint for more than half of the firms).
It turns out that the perception of Tanzanian entrepreneurs may be more negative than their
actual experience. Indeed, when asked about factual questions, respondents are much less
pessimistic in Tanzania. If corruption is perceived as a major constraint by 47.2% of firms in
Tanzania, only 20.8% of firms effectively experience the payment of bribes, a value
substantially lower than the sub-Saharan average (24.2%) and lower than Burundi (30.3%),
Kenya (26.4%), Malawi (24.2%), or Uganda (22%). The dimension where Tanzania clearly
underperforms is in the share of firms that expect to give gifts to secure contracts with the
government. On this specific question, 66% of Tanzanian firms answer positively, much
more than in neighbouring countries but at a comparable level to Cambodia (87.5%), Laos
(74.3%), or Vietnam (56.9%). Overall, these figures thus suggest that, in some contexts,
corruption is institutionalised in such a way that firms fully internalise it and do not perceive it
as a constraint, while in other contexts corruption does not ‘grease the wheels’.
The relatively pessimistic perception of firms in Tanzania and the contrast with their practical
experience appear again when it comes to identifying the tax administration as a constraint.
Firms report that, on average, their senior management staff spend 2% of their time dealing
with the tax administration. This is below most of the comparison countries. Still, it translates
into the worst perception of the tax administration compared with all other countries. One
element that can explain this contradiction is the length of procedures. It may be the case
that interaction with public officials is not especially costly in monetary terms or in time, but
that things are not moving forward.

Collecting Insights for an Institutional Diagnostic of Development – Tanzania Institutional Diagnostic
© Economic Development & Institutions 31
3.2.2 AfroBarometer
The AfroBarometer is a sample survey managed by a network of think-tanks in Africa. It
presently covers 34 countries. Representative population samples comprise 1,200 or 2,400
individuals depending on the country. Questionnaires comprise around 100 questions on
various topics including economic conditions, politics, trust in political institutions, public
services, corruption, or crime.
When comparing the perception of the quality of institutions in Tanzania with neighbouring
countries (excluding Rwanda, which is not covered by the AfroBarometer), several striking
differences arise. Perhaps the most striking one is the relative lack of trust of Tanzanians
with respect to state institutions but also, surprisingly, a lack of trust of their friends and
relatives. The second most important general difference is the dissatisfaction of citizens with
the functioning of the democracy, which is much stronger than elsewhere.
Only 40% of Tanzanians declare that they trust their relatives ‘a lot’11, while 33% say that
they trust their relatives ‘not at all’ or ‘just a little’. This is strikingly lower than in neighbouring
countries where, on average, trust in relatives reaches 60%, with only 15% stating ‘not at all’
or ‘just a little’. This lack of trust extents to neighbours and other known people. Tanzanians
report no trust at all or just a little in their friends in 52% of cases, and 68% when referring to
‘other known’ people. In neighbouring countries, these figures reach only 34% and 54%.
If trust in political leaders is not as systematically different in Tanzania than in neighbouring
countries, Tanzanians are quite reluctant to trust formal state organisations, with the
exception of the courts. While 44% of Tanzanians do not trust their parliament more than ‘a
little’, this number is perceptibly lower in other countries (38% on average, except Burundi).
Also, Tanzania ranks last in terms of trust in the electoral commission, one before last for
11 All the AfroBarometer trust questions use a Likert scale with the following modalities: ‘Not at all’, ‘Just a little’, ‘Somewhat’, ‘A lot’.
Figure 12: World Bank enterprise survey:
Tanzania vs. neighbouring countries
Figure 13: World Bank enterprise survey: Tanzania vs. better performing developing
countries

Collecting Insights for an Institutional Diagnostic of Development – Tanzania Institutional Diagnostic
© Economic Development & Institutions 32
trust in the army, and just ahead of Burundi and Uganda when referring to the tax
administration and the police forces.
Their comparatively limited trust towards the state apparatus is surprisingly not related to
major differences in how Tanzanians evaluate the performance of their government. If
anything, Tanzanians are slightly more satisfied than their neighbours in terms of health,
education, and even water. In addition, 74% of Tanzanians think that the government does a
fairly good job to curb crime, while only 45% of people think so in the neighbouring countries.
One potential explanation of this apparent contradiction may be the higher level of
expectations of Tanzanians towards their government. Independently of other
considerations, it seems only natural to them that the government delivers in terms of public
services.12 For instance, 44% of Tanzanians think that the main feature to expect from a
democracy is the provision of a safety net by the government in the form of aid when people
are in need. This is surprisingly in stark contrast with neighbouring countries.
Another factor correlated to the low level of trust in Tanzania is probably the perceived
amount of high-level corruption. For example, 37% of survey respondents think that most
people in the office of the prime minister and the president are corrupt. This figure is only
16% in neighbouring countries, even accounting for the fact that Burundi pushes the
average upwards. For members of parliament and government officials, Tanzania is ranked
the highest in perception of corruption, with respectively 34% and 46% of the population
perceiving high levels of corruption. Only Burundi and Uganda achieve such bad figures.
Still, when people are asked about the actual corruption that they directly experience, the
picture is more nuanced. Mozambique and Kenya show a lower frequency of bribes than
Tanzania, whether it is to get documents, secure access to water, health, and education
services, or avoid trouble with the police. However, bribery is less frequent in Tanzania than
in Uganda, Malawi, and Burundi. One type of side payment is three times more frequent in
Tanzania than in neighbouring countries: compensatory gifts, including food and money, in
return for votes (27% vs. 9%).
Democracy and the way it is supposed to work is another set of issues about which
Tanzanians express quite different views from their neighbours. Tanzanians are quite
dissatisfied with the level of democracy in their country. For instance, 54% of Tanzanians
think that their country is not a democracy, or is a democracy with major problems, and they
are not satisfied with the way it works. Neighbouring countries have a much more satisfied
population, with that same proportion falling below 30%. Of course, these figures should be
read with caution because they reflect the perception of citizens about their institutions and
not the hard facts about how institutions work. Therefore, they depend a lot on respondents’
reference points and hopes for their country. Still, digging further, Tanzanians also complain
about not being able to say what they want (55% in Tanzania vs. 14% in neighbouring
countries) and not being free to join political organisations (69% vs. 10%).
Tanzania is also the country in the region where citizens are the most inclined (70%) to call
for a more accountable government, even at the cost of slower political decisions. A majority
of Tanzanians (83%) think that ‘parliament should ensure that the president explains to it on
a regular basis how his government spends taxpayers’ money’. Still, there are some
12 This is the interpretation given by a large majority of Tanzanians choosing statement b) from between the two following statements (question 21): a) The government is like a parent. It should decide what is good for us; b) The government is like our employee. We are the bosses and should tell government what to do.

Collecting Insights for an Institutional Diagnostic of Development – Tanzania Institutional Diagnostic
© Economic Development & Institutions 33
contradictions. Tanzania is a country where the largest share of respondents (34% vs. 14%
elsewhere) thinks that ‘the president should pass laws without worrying about what the
parliament thinks’. What is expected from the parliament is also not that obvious, since two-
thirds of Tanzanians consider that ‘political parties create division and confusion and it is not
necessary to have several political parties in the country’, and almost half of the population
says that ‘opposition parties should concentrate on cooperating with government and helping
it develop the country’. Neighbouring countries tend to show more political maturity among
respondents.
As an intermediary conclusion, it is important to put these perceptions in perspective. Among
the six countries between which the comparison is made, Tanzania ranks second in terms of
GDP per capita (purchasing power parity corrected). If Kenya is slightly above Tanzania, the
other four countries are way below. The growth rate of GDP per capita between 2011 and
2013 was also considerably above that of other countries, except Mozambique. Despite this
good relative performance, only 21% of Tanzanians assess the economic performance of
their country as fairly good or very good, while 35% of the neighbouring populations do. It is
therefore very important to keep in mind that Tanzanians may actually have a negative bias
in making judgements about their country. It does not necessarily reflect a worse institutional
situation, but it may be simply that the hopes and expectations of Tanzanians are higher.
Tanzanian society in 2012 may well have been demanding strong institutional improvements
and was ready to see changes happening.
3.3 Conclusion
The main conclusion from the comparisons undertaken in this section is that aggregate
indicators, such as the synthetic QoG indicators constructed for the present study, or the
widely used WGIs, do not show any clear specificity of Tanzania in terms of institutional
quality when obvious outlier comparators – i.e. Burundi and Rwanda, among neighbouring
countries – are ignored. This conclusion has several possible implications. One is that the
indicators used in the comparison are too aggregate to show how specific the institutional
landscape may be in a given country. More specific surveys could yield deeper insights, but,
by construction, they would show only one side, and possibly a limited side, of the
landscape. Another implication is that there are indeed few institutional differences between
Tanzania and its neighbours (outside Burundi and Rwanda), countries with which it shares a
common colonial legacy, especially from an institutional point of view. Concerning the
comparison with those countries that outperformed Tanzania’s growth, the difficulty is that
differences must be sought in the past dynamics of institutions rather than in the present
institutional landscape, and potentially in more subtle differences, which require tools other
than surveys designed for cross-country comparisons.
The detailed analysis of representative surveys conducted among users rather than those
people who interact more directly with institutions yields additional and more precise
insights. But, once again, the problem of a reference point emerges. It is not clear whether
differences between Tanzania and other countries are driven by intrinsic institutional
divergences or by distinct reference points among respondents living in different
environments. Both the World Bank Enterprise Survey and the AfroBarometer tend to
indicate that Tanzanians may be more demanding towards their formal institutions. This

Collecting Insights for an Institutional Diagnostic of Development – Tanzania Institutional Diagnostic
© Economic Development & Institutions 34
would seem to be a factor that is favourable to institutional reform, but which does not say
much about institutional obstacles to development.
A last remark is in order about the comparison exercise conducted in this section, in the
spirit of so many studies of this kind. As mentioned several times, the choice of comparator
countries is of course crucial. Observed differences may possibly reveal a particular
challenge in a country, which would then need to be analysed in more detail. In the present
case, however, care must be taken of the fact that comparator countries as well as Tanzania
have in common that their institutional context is of low quality. There may be no significant
differences between Tanzania and neighbouring countries or its outperforming peers in
government effectiveness. Yet the important point is that it is uniformly very low by
international standards and that government effectiveness may indeed be a serious obstacle
to development in Tanzania.
4 The institutional implications of ‘growth diagnostics’ and similar exercises
A logical way to explore the potential institutional bottlenecks for economic development in a
country is to first identify which are the binding economic constraints on development, and
then to reflect on the institutional weaknesses that might cause them. From that perspective,
the ‘growth diagnostics’ exercises undertaken in several countries on the basis of the
methodology proposed by Hausmann et al. (2005) is a very helpful entry point. Based on a
general model, where economic growth results from the accumulation of human and
physical capital and gains in total factor productivity, the idea is to examine the factors that
may block this accumulation process, by generating an inefficient allocation of existing
resources, discouraging investments, and/or misallocating them. Binding constraints would
be revealed by abnormally high prices or shadow prices of resources, in absolute terms or in
comparison with other countries. A comparatively high return to skilled labour would signal a
scarcity of that production factor and possible bottlenecks in the educational system.
Excessive energy bills would signal power supply constraints, possibly mitigated by costly
substitutes such as own electricity generators. High levels of side payments and bribes in
acquiring cultivation rights for land would signal market imperfections, etc.
Such an exercise was undertaken in 2010 in the case of Tanzania under the auspices of
both the Tanzanian and the US government, the latter as part of the Partnership for Growth
initiative (Tanzania Growth Diagnostics (Partnership for Growth), 2011). The resulting
document is a very thorough diagnostic of the Tanzanian economy, covering most aspects
of it. It subsequently influenced major documents about national development strategies,
including ‘Vision 2025’ and the ‘Long-Term Perspective Plan’.
A similar, although more focused, exercise was undertaken two years later by the
Organisation for Economic Co-operation and Development (OECD) as part of its ‘Investment
Policies Reviews’ aimed at recommending measures to improve the investment climate and
attract more investors, in particular from foreign countries (OECD, 2013).
The conclusions of the two exercises are convergent about which economic constraints
seem the most binding for investment and growth. They are listed below, and the possible
institutional failures behind them are then explored.

Collecting Insights for an Institutional Diagnostic of Development – Tanzania Institutional Diagnostic
© Economic Development & Institutions 35
4.1 Identified economic constraints for development in Tanzania
i. Lack of adequate infrastructure
Inadequate supply of electrical power is the most obvious case. Tanzania is among the
African countries with the lowest electricity consumption per capita and the outages in the
main cities are so frequent that most businesses need to have their own generator so that
work is not too badly disrupted. Infrastructure is also found to be deficient in the field of
transport: rural roads, rail, and ports.
The OECD report mentions that weaknesses in the infrastructure are actually of two types.
On the one hand, they limit economic growth. On the other hand, although infrastructure
could be attracting investments, in particular from abroad, this is not happening, mostly
because of administrative and legal constraints and complexity.
ii. Lack of appropriability of returns
Of particular importance under this heading is the difficulty of securing land rights for
investors outside the small-holding agricultural sector. Tax rates that are too high and
volatile are also mentioned as an investment disincentive.
iii. Lack of vocational, technical, and professional skills
iv. Lack of access to finance for SMEs and agriculture
v. Low-quality regulation of business and trade
Various deficiencies come under this general heading, which have to do with the lack of
coordination of the civil service and the multiplicity of public agencies intervening in the
creation and current operations of businesses.
4.2 Underlying institutional weaknesses
Some of the preceding constraints may be considered as inherent to the development
process itself and the corresponding structural lack of resources. Public infrastructure may
be insufficient and deficient, SMEs underfunded or vocational schooling underdeveloped
essentially because the public sector is short of the necessary funds. But things may be so
because of a misallocation of public and private resources due to market or government
failures resulting themselves from weak institutions. Bad regulation of public and private
companies operating in the infrastructure sector, rather than a structural lack of funds, may
be responsible for its slow growth and inefficiency. Uncoordinated government agencies may
also be responsible for discouraging private investments. An inappropriate regulation of
banks may be behind the lack of finance for SMEs. The absence of clear rules, as well as
rent-seeking behaviour by some civil servants, may explain the insecurity of land rights.
Taken together, the preceding economic constraints thus point to the following general
institutional weaknesses, duly recognised in the conclusion of the growth diagnostics
document.
i. Inefficient regulation of public and private firms

Collecting Insights for an Institutional Diagnostic of Development – Tanzania Institutional Diagnostic
© Economic Development & Institutions 36
A good example of apparently weak regulation is that of TANESCO, the state company
responsible for the distribution of electricity, often constrained to sell electricity under unit
cost and thus with no resources to invest in more capacity, and, of course, mounting debt.
This is made worse by the unattractiveness of the Tanzanian power sector to foreign
investors due to rigid constraints imposed by the government and the uncertainty of the
regulatory framework.
Another weakness of business regulation comes from the multiplicity of government actors
interacting with firm managers in an uncoordinated way, as reported in the World Bank
Enterprise Survey. Each actor may be pursuing a valuable goal, but these goals may be
inconsistent with each other and the overall system ends up being inefficient. The multiplicity
of actors and the lack of coordination among them are also a way of generating rent-seeking
opportunities.
ii. Efficiency and coordination of the civil service
A dysfunctional civil service is detrimental not only to the regulation of firms and markets but
also to the government action in general. The imprecise definition of land rights, for instance,
may be due as much to an excessive complexity of legal rules and partial understanding of
these rules by the main private actors and communities as to the incapacity of the civil
service to apply them rigorously. Also, a slack civil service may sometimes explain
incomplete or inconsistent implementation of government strategies.
iii. The implicit role of corruption
It is somewhat surprising that the growth diagnostics document does not make much
reference to corruption as a key factor behind some of the binding economic constraints to
growth. It is said several times in that report that corruption is not really a constraint, since
Transparency International ranks Tanzania at a slightly lower level of corruption than the
neighbouring countries Kenya and Uganda. As mentioned in the preceding section, this can
hardly be a good argument, as corruption may be as much a constraint on development in
these countries as it is in Tanzania.
The OECD document, on the contrary, insists on the role that corruption plays in
discouraging investments and misallocating resources. As seen above, corruption was
indeed among the top problems reported in the 2013 World Bank Enterprise Survey – just
after ‘access to financing’ and before ‘inadequate supply of infrastructure’ and ‘inefficient
government bureaucracy’. The OECD also stresses the link between corruption and the lack
of coordination of the civil service, which gives too much discretion to some decision makers
in the system and creates corruption opportunities.
Conclusion
It is striking to see that, altogether, the four types of investigations are convergent on the
likely institutional constraints to economic development in Tanzania, independently of the
capacity of the country to devote the resources necessary to key development functions. By
the very nature of the analysis, conclusions are less clear in the case of the institutional
indicators, in part because they combine many different dimensions of institutions and in part
because they result from a comparative exercise that is somewhat arbitrary – i.e.

Collecting Insights for an Institutional Diagnostic of Development – Tanzania Institutional Diagnostic
© Economic Development & Institutions 37
weaknesses may be the same in Tanzania as in the comparator countries, including the
highly performing ones. Even in that case, however, there clearly is some convergence in
the weaknesses derived from administrative capacity or government weaknesses and
regulatory quality.
What emerge more precisely from the two survey exercises as well as the growth diagnostic
are the following themes:
Land issues featured very clearly in the CIS survey, and the limitation due to the
uncertainty surrounding land use rights was the major constraint highlighted by the
growth diagnostic.
The regulation of firms, in particular the electricity company, TANESCO, was also
emphasised by both the CIS survey and the growth diagnostic.
Corruption was mentioned in practically all approaches, but, as mentioned above, corruption
is a symptom, the cause of which has to be found in the bad functioning of several
institutions. From that point of view, the open-ended interviews with top decision makers, as
well as the institutional indicators, unambiguously point to:
the organisation of the civil service; and
the coordination between state entities – in particular, the relationship between central
and local governments.
These various themes will now be analysed in-depth in the second part of this institutional
diagnostic. The objective of this analysis is to more clearly identify what is not working well in
these areas and the reasons for it, and to envisage possible directions for reform.
Collecting Insights for an Institutional Diagnostic of Development – Tanzania Institutional Diagnostic
© Economic Development & Institutions 38
References
Hausmann, R., Rodrik, D. and Velasco, A. (2005) ‘Growth Diagnostics’, The Growth Lab, Harvard University, https://growthlab.cid.harvard.edu/files/growthlab/files/growth-diagnostics.pdf.
OECD (2013) ‘OECD Investment Reviews: Tanzania’, OECD, Paris.
Tanzania Growth Diagnostics (Partnership for Growth) (2011) ‘A joint analysis for the Governments of the United Republic of Tanzania and the United States of America’.

Collecting Insights for an Institutional Diagnostic of Development – Tanzania Institutional Diagnostic
© Economic Development & Institutions 39
Appendix A1: List of institutional areas and sub-areas in the CIS
Collecting Insights for an Institutional Diagnostic of Development – Tanzania Institutional Diagnostic
© Economic Development & Institutions 40
Appendix A2: Synthetic institutional indicators: methodology
a) Data and methodology
Numerous databases with original or synthetic indicators describe the specificity and quality
of country institutions: WGIs, Transparency International, World Bank Doing Business, World
Economic Forum’s Competitiveness Index, Polity IV, Freedom House, Bertelsmann
Foundation, Heritage Foundation, etc. Most of them have been put together in the QoG
dataset managed by the University of Gothenburg (Dahlberg et al., 2016). The QoG
standard cross-sectional dataset gathers almost 2,500 variables from more than 100
sources. Many of these variables are directly or indirectly related to institutions. The target
year of the dataset is 2014, but when no data are available, information from the following or
preceding years are included. It means that these data may look old in one sense, especially
compared with the timing of the CIS. On the other hand, we tend to focus on slow-moving
factors and the CIS put a lot of effort into capturing the perception of institutions that
respondents had from the last five to 10 years, a timeframe that does cover the QoG years.
The QoG goes well beyond the analysis of institutions per se. For our purpose, we need to
prune the database in several ways. First, many variables are related to outcomes of
institutions and not to the characteristics of institutions per se. For instance, this is typically
the case of variables like life expectancy or literacy rates. It is clear that institutions may
affect these outcomes, but we prefer to restrict our analysis to determinants of institutions,
such as the quality of the education system, extrajudicial killing, political participation, or
corruption in the media. A second restriction is the recurrent lack of data on institutions for
many developing countries. A total of 506 variables are dropped because they have
information only on the members of the European Union or the OECD. Notice that many of
these variables are excluded anyway because of the first criteria. A selection of relevant
variables according to these two criteria leaves us with 181 variables from 27 sources
covering 44 countries13. This is a small share of the original dataset but still represents a lot
of information.
A straightforward approach to reduce this high-dimensionality problem is to list the variables
for which Tanzania deviates the most from other countries. A more sophisticated path is to
use principal component analysis and rank countries according to a combination of
variables. However, none of the above-mentioned methods is very satisfactory. Groups of
indicators from different sources are highly correlated. Sometimes it is by construction,
because one variable relies on other variables of the dataset. The most striking example of
this kind are the WGIs. They are constructed as an unobserved component of a set of
individual indicators (see Kaufmann and Kraay (2002) and Kaufmann et al. (1999) for more
details). Other indicators are related because respondents answer different questions from a
specific viewpoint. This is typically the case of the variables behind the Global
Competitiveness Report produced by the World Economic Forum, where answers are
13 The 44 countries are Armenia, Bangladesh, Benin, Bolivia, Burkina Faso, Burundi, Cambodia, Cameroon, Chad, Côte d’Ivoire, Egypt, El Salvador, Ethiopia, Ghana, Guatemala, Honduras, India, Indonesia, Kenya, Kyrgyzstan, Laos, Liberia, Madagascar, Malawi, Mali, Moldova, Mongolia, Morocco, Mozambique, Nepal, Nicaragua, Nigeria, Pakistan, Philippines, Rwanda, Senegal, Sri Lanka, Tajikistan, Tanzania, Tunisia, Uganda, Ukraine, Vietnam, and Zimbabwe.

Collecting Insights for an Institutional Diagnostic of Development – Tanzania Institutional Diagnostic
© Economic Development & Institutions 41
‘global-business’ oriented. The relation between variables may also be more genuine and
result from a similar framing of questions.
We therefore propose a two-step strategy where we first group variables containing similar
information. Then we extract the first component of each group using principal component
analysis. Finally, we map countries according to these new indices. We group the variables
by clustering them using the Ward density criterion. In other words, we recursively group
variables to minimise the intra-group variance and maximise the inter-group variance. In this
procedure, researcher discretion is key in the choice of the number of groups, and, of
course, in their labelling. Notice that variables are grouped together based on the similarity
of their variance. It is therefore the actual informational content used in statistical analysis
that drives the creation of groups and not the perceived similarity between question framing.
Compared to an ex-ante creation of groups, this choice is more satisfactory for a meta-
analysis, especially when there is only very limited knowledge on the actual execution of
surveys, on the choice of respondents, on the exact framing of questions in the field, and on
the intention of surveys’ sponsors.
b) Extracting a small number of synthetic indicators from a large database
By applying our two-step strategy to the 44 countries and the 181 observations for which the
matrix of information is complete, we decided to form six groups. The number of groups is
discretionary, but of course, the fewer the groups, the easier it will be to compare countries.
In Figure A1, the 40 most different groups of variables are graphed in a dendrogram, which
looks like a tree and can almost be interpreted as such. The length of branches represents
the statistical distance between two groups of variables. The longer a vertical bar, and the
higher a node, the more dissimilar the two groups are. If we opt for two groups only, then the
dissimilarity between the two groups is large and the informational content of variables
remains very diverse. The larger the number of groups, the lower the dissimilarity within
groups and the easier it will be to capture the joint informational content within each group.
Given Figure A1, six groups are a natural candidate, as are seven. We decided to work with
six groups, as presented in Figure A2. We present the six synthetic indicators and their
labels in the main text since it is critical for the application to Tanzania.

Collecting Insights for an Institutional Diagnostic of Development – Tanzania Institutional Diagnostic
© Economic Development & Institutions 42
Figure A1: Dendrogram of the 40 most different groups of variables, using Ward density cluster analysis
0
500
100
01
50
0
L2sq
ua
red
dis
sim
ilari
ty m
ea
sure
G1
(5
va
r)
G2
(1
8 v
ar)
G3
(1
0 v
ar)
G4
(1
2 v
ar)
G5
(6
va
r)
G6
(3
va
r)
G7
(4
va
r)
G8
(6
va
r)
G9
(5
va
r)
G1
0 (
8 v
ar)
G1
1 (
5 v
ar)
G1
2 (
2 v
ar)
G1
3 (
2 v
ar)
G1
4 (
2 v
ar)
G1
5 (
2 v
ar)
G1
6 (
5 v
ar)
G1
7 (
6 v
ar)
G1
8 (
3 v
ar)
G1
9 (
1 v
ar)
G2
0 (
2 v
ar)
G2
1 (
2 v
ar)
G2
2 (
1 v
ar)
G2
3 (
2 v
ar)
G2
4 (
1 v
ar)
G2
5 (
6 v
ar)
G2
6 (
2 v
ar)
G2
7 (
2 v
ar)
G2
8 (
8 v
ar)
G2
9 (
8 v
ar)
G3
0 (
1 v
ar)
G3
1 (
2 v
ar)
G3
2 (
8 v
ar)
G3
3 (
4 v
ar)
G3
4 (
1 v
ar)
G3
5 (
2 v
ar)
G3
6 (
2 v
ar)
G3
7 (
2 v
ar)
G3
8 (
6 v
ar)
G3
9 (
3 v
ar)
G4
0 (
10
va
r)
Dendrogram for warddens cluster analysis

Collecting Insights for an Institutional Diagnostic of Development – Tanzania Institutional Diagnostic
© Economic Development & Institutions 43
Figure A2: Dendrogram of the six most different groups of variables, using Ward density cluster analysis
0
500
100
01
50
0
L2sq
ua
red
dis
sim
ilarity
me
asu
re
G1n=51
G2n=18
G3n=35
G4n=35
G5n=22
G6n=19
Dendrogram for warddens cluster analysis