chapter 18 regional air quality - planning.nsw.gov.au
TRANSCRIPT

Chap
ter 18 – Regional air q
uality
Chapter 18Regional air quality


Parsons Brinckerhoff i
Contents
Page number
18. Regional air quality 18-1
18.1 Assessment approach 18-2
18.1.1 Cumulative assessment 18-318.2 Existing environment 18-3
18.3 Impact assessment 18-8
18.3.1 Construction impacts on regional air quality 18-818.3.2 Operational impacts (and benefits) on regional air quality 18-918.3.3 Consideration of cumulative assessment 18-1418.3.4 Management and mitigation 18-14
18.4 Summary of key findings 18-14
List of tablesPage number
Table 18.1 Relevant Commonwealth EIS Guidelines and NSW SEARs 18-1Table 18.2 Summary of results –traffic emissions (road only) 18-10Table 18.3 Summary of results – total emissions (road and rail) 18-11Table 18.4 Modelling predictions at NSW OEH monitoring sites 18-12Table 18.5 Summary of regional air quality impacts at Full Build 18-15
List of figuresPage number
Figure 18.1 Sydney’s total estimated annual emissions by source type 18-4Figure 18.2 Base case projected motor vehicle emission trends for Australian metropolitan areas 18-5Figure 18.3 Annual average PM10 concentrations at NSW EPA monitoring sites 18-6Figure 18.4 Annual average PM2.5 concentrations at NSW EPA monitoring sites 18-7Figure 18.5 Annual average NO2 concentrations at NSW EPA monitoring sites 18-8


Parsons Brinckerhoff 18-1
18. Regional air quality
This chapter provides an assessment of the existing regional air quality (i.e. air quality for the Sydneyregion as a whole or the Sydney basin) and the predicted regional air quality impacts resulting from theoperation of the Moorebank Intermodal Terminal (IMT) Project (the Project). This chapter summarises thedetailed regional air quality assessment prepared by Todoroski Air Sciences (refer to Technical Paper 8– Regional Air Quality Assessment in Volume 6 of this EIS). Local air quality is discussed inChapter 17 - Local air quality.
The assessment addresses the Commonwealth Department of the Environment (DoE)'s EnvironmentalImpact Statement (EIS) Guidelines and the Secretary for the NSW Department of Planning &Environment (NSW DP&E)’s Environmental Assessment Requirements (NSW SEARs) for the Projectlisted in Table 18.1.
Table 18.1 Relevant Commonwealth EIS Guidelines and NSW SEARs
Requirement Where addressed
Commonwealth EIS Guidelines under the Commonwealth Environment Protection andBiodiversity Conservation Act 1999 (EPBC Act)
Analyse and describe the changes to the local and regional air drainagebasin as a result of construction and operational phases of the action. Theanalysis must consider diurnal and seasonal variations in air pollution levelsand the influence of short term weather phenomena. The analysis mustprovide results for the following: hydrocarbons, suspended particulatematter, carbon monoxide, oxides of nitrogen, sulphur (sulphur) dioxide,ozone, reactive organic compounds, lead and air toxics.
Local air quality impacts areassessed in Chapter 17 – Localair quality.
This chapter covers regional airquality impacts only, with afocus on pollutants resultingfrom the operation of heavyvehicles and freight raillocomotives.
NSW SEARs under the NSW Environmental Planning and Assessment Act 1979 (EP&A Act)
A quantitative assessment of worst case predicted emission of air pollutants,including an assessment of potential air pollution sources (includingidentifying locomotive standards), dust deposition, total suspendedparticulates, PM10 PM2.5 and atmospheric pollutants of concern for local andregional air quality;
Section 18.3 of this chapter
Technical Paper 8 – RegionalAir Quality Assessment inVolume 6 (Todoroski AirSciences 2014)
Chapter 4 – Planning andstatutory requirements
Chapter 5 – Stakeholder andcommunity consultation
Chapter 7 – Project description

Parsons Brinckerhoff 18-2
18.1 Assessment approach
The regional air quality assessment (Technical Paper 8 – Regional Air Quality Assessment in Volume 6)considers the regional air quality impacts that are likely to result from the construction and operation ofthe Project. A high level qualitative discussion of construction impacts has also been included (seesection 18.3.1).
For the purposes of the assessment, ‘regional air quality’ is defined as air quality for the Sydney regionas a whole or the Sydney basin. The extent of this region is shown in Figure 6.2 in Technical Paper 8(which identifies the extent of the model boundary) and Table 7.3 in Technical Paper 8, which lists thelocal government areas covered by the assessment.
The assessment focused on the operational scenario of the Project at Full Build in 2030, as this wasconsidered likely to result in the most significant change to existing regional air conditions(i.e. it represents the worst case scenario in terms of regional air impacts). The focus of this assessmentwas to quantify the likely effects on air quality that would result from the expected change in thedistribution of heavy truck and rail traffic throughout the Sydney region, associated with the Projectoperation. The regional air quality impacts of the construction phases of the Project (including EarlyWorks) have not been assessed given that construction activities are unlikely to generate air qualityimpacts that would be significant at a regional level. The potential air quality impacts for the constructionphases have however been examined in the local air quality impact assessment in Chapter 17 – Localair quality.
Vehicle emissions include a number of pollutants that are known to be potentially harmful to humanhealth; therefore, these emissions were considered to be the key pollutants of concern for the regionalair quality assessment of the Project. The main pollutants of concern at a regional level are carbonmonoxide (CO), nitrogen oxides (NOX), various volatile organic compounds (VOCs) and particulatematter (PM10 – diameter of less than 10 µm and PM2.5 – particle diameter of less than 2.5 µm).
Only container transport within the Sydney region was considered. This included container freightdestined for locations beyond the Sydney region; however, the study only considered emissionsassociated with transport of these containers to the edge of the Sydney Basin. In addition, the Sydneyregional airshed is particularly sensitive to air quality impacts, due to the relatively high concentrations ofkey pollutants when compared with the non-urban airshed beyond the Sydney basin. The assessmentwas carried out using data at the local government area (LGA) scale and by suburb, using themethodology outlined below:
· The likely destinations of containers transported from Port Botany and the Project were determinedusing the Strategic Transport Modelling Report (Parsons Brinckerhoff 2012a); this was undertakenfor both ‘with the Project’ and ‘without the Project’ scenarios where relevant.
· The likely total distance travelled by diesel powered heavy vehicles associated with containertransport was determined for both scenarios (with and without the Project). The distance, known asvehicle kilometres travelled (VKT), was then used to calculate the potential traffic emissions (CO,NOX, VOCs and PM) using the methodology presented in the NSW Environment Protection Authority(EPA 2012) document, Air Emissions Inventory for the Greater Metropolitan Region in New SouthWales 2008 Calendar Year On-Road Mobile Emissions (2008 inventory). The 2008 inventoryprovides a detailed estimate of the sources of emissions in the Sydney basin, and also themethodology for estimating these emissions. A similar process was applied to calculate the likelyemissions from locomotives serving the Project site.

Parsons Brinckerhoff 18-3
· These emissions were then compared with the total emissions in the individual local areas and theregional airshed to see what effect the Project would have on regional air quality. Applicable airquality criteria are as per the local air quality assessment in Chapter 17 – Local air quality (refersection 17.1.1).
· A qualitative assessment of the change in traffic numbers, and a quantitative assessment ofregional air quality (using air dispersion modelling) were conducted, using a combination of theCALPUFF Gaussian dispersion modelling system and TAPM (The Air Pollution Model). TAPM wasused to generate an upper air data file for use in CALMET, a three dimensional meteorologicalmodel. CALMET considers the surface terrain, meteorological data and TAPM upper air data todevelop a three dimensionally varying wind field for the Sydney basin for each hour of a full year.The CALPUFF modelling was then used to introduce the traffic and rail pollutant emissions into theCALMET wind field in order to model how these emissions disperse throughout the Sydney regionmodelling domain. This was done for the worst case 2030 scenario (i.e. the Project at Full Build).
No regional air quality assessment of ozone emissions was undertaken as the Project would result inonly a small differential between the emissions that would occur with or without the Project. The changewould be too small to be modelled in regard to ozone chemistry (i.e. there is no model which is sensitiveenough to be capable of modelling any discernible effect arising from changes that may occur from theProject).
18.1.1 Cumulative assessment
In accordance with the NSW SEARs, this EIS includes a cumulative assessment of the regional airquality impacts of the Project in combination with development on the Sydney Intermodal TerminalAlliance (SIMTA) site and other planned developments within the surrounding region. The findings of thecumulative assessment are provided in Chapter 27 – Cumulative impacts.
18.2 Existing environment
Regional air quality in the Sydney basin is primarily influenced by emissions from major industries,commercial operations, motor vehicles and domestic activities such as wood heaters. The most recentAustralia State of the Environment Report (SoE report) (SEWPaC 2011) outlines the measured airpollutant levels and trends in pollutant levels that occur in NSW and in the Sydney region.
The SoE report notes that national ambient air quality standards are rarely exceeded for extendedperiods in the Sydney region, and exceedances are normally associated with particular events such asbushfires and dust storms.
Motor vehicles are one of the most significant sources of air pollutants in Sydney, accounting for around80% of CO emissions, 70% of NOX emissions and almost 40% of total VOC emissions. Figure 18.1below, from the SoE report, shows the proportion of total estimated emissions from a range of sourceswithin the Sydney region.

Parsons Brinckerhoff 18-4
Source: Australian State of the Environment Report 2011 (SEWPaC 2011)
Figure 18.1 Sydney’s total estimated annual emissions by source type
Australia is heavily reliant on motor vehicle transport, with total passenger kilometres travelled almostdoubling over the past 40 years. Given that the size of the Australian motor vehicle fleet has continued toincrease, it is likely that this trend will continue in the foreseeable future. As well as increasing motorvehicle registrations in recent years (averaging 2.9% annually between 2005 and 2010), VKT per vehiclehas also increased by a total of 6.8% between 2003 and 2007.
To manage this trend, emissions limits and standards have previously been introduced. Revised limitsare scheduled to be introduced by the Commonwealth Department of Infrastructure and RegionalDevelopment in the coming years, including Euro 5 and Euro 6 emission standards for light vehicles. Asa result of anticipated tighter emission controls and the implementation of technological improvements,reductions in motor vehicle emissions are expected, as shown in Figure 18.2 (Australian metropolitanareas).

Parsons Brinckerhoff 18-5
Source: Figure 4.4, Technical Paper 8 – Regional Air Quality Assessment (Volume 6)
Figure 18.2 Base case projected motor vehicle emission trends for Australian metropolitan areas
As part of the NSW Government's air quality management plan, ambient monitoring is conducted by theNSW Environmental Protection Agency (EPA). This monitoring data is posted on the EPA website, and isalso used in the SoE Report.
Figure 18.3 presents a summary of the measured annual average PM10 levels between 2005 and 2013from the NSW EPA monitoring stations. The figure shows that there has been a general reduction inannual average PM10 concentrations, although increases were observed at all locations during 2009when widespread regional dust storms occurred. The figure also shows that annual average PM10 levelswere below criteria at all monitoring sites. Additionally, a common trend in PM10 concentrations isobserved across the monitoring stations in the region, as shown in Figure 18.3. This demonstrates thatthe current air quality monitoring locations capture the air quality trends affecting the majority of thepopulation within the Sydney basin and are suitable for National Environmental Protection Measure(NEPM) compliance monitoring.

Parsons Brinckerhoff 18-6
Source: Figure 4.7, Technical Paper 8 – Regional Air Quality Assessment (Volume 6)
Notes: µg/m3 = micrograms per cubic metre; PM10 – Particulate matter ≤ 10 µm in aerodynamic diameter
Figure 18.3 Annual average PM10 concentrations at NSW EPA monitoring sites
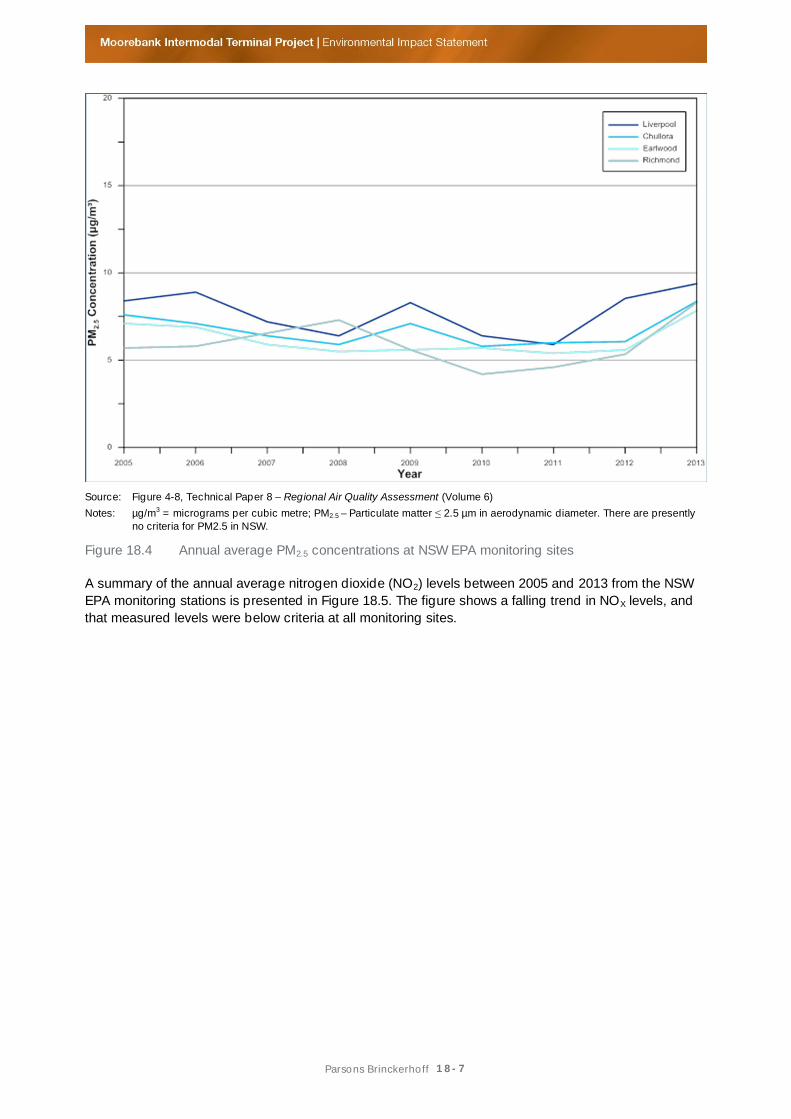
Figure 18.4 shows a summary of the annual average PM2.5 levels between 2005 and 2013 from the NSWEPA monitoring stations.
Figure 18.4 shows that the annual average PM2.5 levels follow a similar trend to the annual average PM10
levels, with a gradual reduction over time. There are presently no criteria for PM2.5 in NSW; however,there is a NEPM advisory reporting standard of 8 micrograms per cubic metre (µg/m3) annual average.This advisory reporting standard level was exceeded in 2006, 2009, 2012 and 2013, as shown in thefigure. These exceedances are likely to coincide with releases of PM into the atmosphere from duststorms, controlled burns and bushfires in these years. Chapter 17 – Local air quality presents furtherdiscussion of these events.
Parsons Brinckerhoff 18-7
Source: Figure 4-8, Technical Paper 8 – Regional Air Quality Assessment (Volume 6)
Notes: µg/m3 = micrograms per cubic metre; PM2.5 – Particulate matter ≤ 2.5 µm in aerodynamic diameter. There are presentlyno criteria for PM2.5 in NSW.
Figure 18.4 Annual average PM2.5 concentrations at NSW EPA monitoring sites
A summary of the annual average nitrogen dioxide (NO2) levels between 2005 and 2013 from the NSWEPA monitoring stations is presented in Figure 18.5. The figure shows a falling trend in NOX levels, andthat measured levels were below criteria at all monitoring sites.

Parsons Brinckerhoff 18-8
Source: Figure 4-9, Technical Paper 8 – Regional Air Quality Assessment (Volume 6), based on NSW OEH monitoring data
Notes: µg/m3 = micrograms per cubic metre; NO2 – nitrogen dioxide
Figure 18.5 Annual average NO2 concentrations at NSW EPA monitoring sites
18.3 Impact assessment
The regional air quality assessment conducted for the Project assessed the potential implications for airquality in the Sydney metropolitan region associated with the Project at Full Build in 2030. The operationof the Project would involve a change in the truck and diesel locomotive movement intensity along thesurrounding major road and rail corridors, in particular those between the Project site at Moorebank andPort Botany. Complex regional-scale dispersion modelling was conducted for 2030 with and without theProject to identify any changes in regional air quality. The modelling results highlighted that despite thesmall changes in emissions along the regional transportation corridors, only a negligible change inregional air quality would be experienced due to the operation of the Project.
18.3.1 Construction impacts on regional air quality
As noted in section 8.1, the air quality impacts during construction are not likely to be significant at aregional level and therefore have not been assessed in this chapter. Emissions generated during theconstruction phase of the Project (including from construction traffic) have been assessed in TechnicalPaper 7 – Local Air Quality Impact Assessment in Volume 6, and are discussed in Chapter 17 – Local airquality, with predicted air pollution concentrations shown to reduce with distance from the Project site.

Parsons Brinckerhoff 18-9
Early Works
The Early Works phase would involve various activities related to site establishment and buildingdemolition, which would include activities with the potential to generate air emissions, in particular dust.However, the dust generating activities would be localised in nature and would be confined to the 6-month construction period. Air emissions generated from the Early Works activities are unlikely to besignificant at a regional level, given the nature of the activities and assuming that appropriateoperational and physical mitigation measures would be utilised. In light of this, Early Works activitieshave not been assessed further in this regional air quality assessment.
Construction phases
Similarly to Early Works, the construction phases of the Project would be temporary in nature and are notlikely to result in impacts that would have a significant effect at the regional level.
In addition to onsite operations, the construction phase of the Project would involve the arrival anddeparture from the Project site of trucks associated with the delivery and removal of material. Thenumber of vehicle movements associated with the construction phase of the Project is substantiallylower than that associated with the operational phase. During the peak construction phase of the Project(Phases A and B), it is expected that there would be up to 1,940 truck movements a day, while duringthe full operation of the Project (in 2030) it is expected that there would be 8,088 truck movements a day(refer to Table 8.2 of Technical Paper 7 – Local Air Quality Impact Assessment in Volume 6). While theorigin and final destination of vehicle movements during the construction phase is unknown, the majorityof these trips are more likely to be local in nature and would not have a discernible impact on regionaltransportation routes. These movements would also only be temporary. Additionally, there are no trainmovements assumed to be associated with the construction phase of the Project.
Given that the number of construction vehicles moving into, out of and around the site would besignificantly lower than the number of operational vehicles, and that impacts associated with theconstruction phase of the Project would be temporary and confined to the local scale, regional air qualityimpacts from construction would be insignificant. Regional dispersion modelling for the constructionphase has therefore not been undertaken.
18.3.2 Operational impacts (and benefits) on regional air quality
Dispersion modelling results
To fully assess the Project’s overall impact on regional air emissions, the effects of vehicle and railactivities associated with the Project were considered both separately and in combination. All keycomponents of the Project were considered in the dispersion modelling for the Full Build (2030)operational scenario, by comparing the three modelled cases described below.
· heavy vehicle traffic emissions only, in the Full Build scenario (without locomotive emissions) (‘withthe Project’);
· emissions from heavy vehicle traffic within the Sydney region in 2030, should the Project notproceed (‘without the Project’); and
· heavy vehicle traffic and locomotive emissions, in the Full Build scenario.

Parsons Brinckerhoff 18-10
The three cases allow an assessment to be made of the individual contributions of vehicle and rail, andof their combined effect. A summary of the dispersion modelling results, comparing the heavy vehicleemissions in the Sydney region with and without the Project in 2030, is shown in Table 18.2.
Table 18.2 presents a breakdown of the major air pollutants as well as a summary of the existing (2012)regional air quality emissions in Sydney. The net reductions in emission concentrations as a result of theProject’s reduction in heavy VKT are also presented, as percentages of the existing 2012 emissions.
The table reveals that the Project would have a small effect in reducing emissions from heavy dieselvehicles across the Sydney basin. The largest effect of the Project, when comparing heavy vehiclesonly, is a predicted 0.67% reduction in NOX emissions, as shown in Table 18.2. This reduction is a directresult of the anticipated reduction in heavy vehicle VKT when the Project is in full operation.
Table 18.2 Summary of results –traffic emissions (road only)
Substance
Sydney region (EPA 2012)(tonnes/year)
Project (2030)(tonnes/year)
Change due to Project(% increase)
TotalSydney
Motorvehicles
Heavyvehicle
WithProject
HV
WithoutProject
HV
TotalSydney
Motorvehicles
HeavyVehicles
Carbonmonoxide (CO) 246,692 123,712 4,081 335.1 346.5 0.00% -0.01% -0.28%
Oxides ofnitrogen (NOX)
74,722 45,392 14,423 2837.7 2934.6 -0.13% -0.21% -0.67%
Particulatematter (PM10)
20,443 2,110 592 42.2 43.7 -0.01% -0.07% -0.24%
Particulatematter (PM2.5)
11,728 1,553 574 41.0 42.4 -0.01% -0.09% -0.24%
Total VOCs 131,356 23,512 866 34.9 36.1 0.00% -0.01% -0.14%
1,3 Butadiene 142 3.49 0.1 0.1 0.00% -0.14%
Acetaldehyde 101 33 1.3 1.4 -0.05% -0.14%
Benzene 624 9.23 0.4 0.4 0.00% -0.14%
Formaldehyde 266 85.3 3.4 3.6 -0.04% -0.14%
Isomers ofxylene 979 3.32 0.1 0.1 0.00% -0.14%
Lead andcompounds 2.82 0.106 0.01 0.01 -0.01% -0.24%
Toluene 1,315 4.06 0.2 0.2 0.00% -0.14%
TSP 2,737 598 42.7 44.1 -0.05% -0.24%
PAH 23.3 2.9 3.0 -0.42%
Source: Technical Paper 8 – Regional Air Quality Assessment (Volume 6)
Notes: HV = heavy vehicles; PAH = Polycyclic aromatic hydrocarbon
As the Project would also result in additional rail transport, emissions from both heavy vehicles and raillocomotives need to be considered.
A summary showing the predicted change in regional air emissions for the Sydney basin as a result ofthe Project (road and rail combined), is presented in Table 18.3. The table shows a comparison betweenthe total emissions predicted for the Sydney basin in accordance with the EPA (2012), the predictedemissions from the operation of the Project under the Full Build 2030 scenario, and the percentagechange in regional air emissions as a result of the Project.

Parsons Brinckerhoff 18-11
Table 18.3 Summary of results – total emissions (road and rail)
Substance
Sydney region (EPA 2012)(tonnes/year)
Project (2031)(tonnes/year)
Change due to Project(% increase)
Tota
lS
yd
ne
y
Moto
rve
hic
les
an
dlo
co
moti
ve
s
HV
an
dlo
com
oti
ves
Wit
hP
roje
ct
(HV
+lo
co)
Wit
ho
ut
Pro
ject
HV
Tota
lS
yd
ne
y
Moto
rve
hic
les
an
dlo
co
moti
ve
s
HV
an
dlo
com
oti
ves
Carbon monoxide(CO) 246,692 123,728 4,097 351.3 346.5 0.00% 0.00% 0.12%
Oxides of nitrogen(NOX)
74,722 45,465 14,496 2,911.5 2934.6 -0.03% -0.05% -0.16%
Particulate matter(PM10)
20,443 2,112 594 44.0 43.7 0.00% 0.01% 0.05%
Particulate matter(PM2.5)
11,728 1,555 576 42.7 42.4 0.00% 0.02% 0.06%
Total VOCs 131,356 23,515 869 37.6 36.1 0.00% 0.01% 0.17%
1,3 Butadiene 142 3 0.1 0.1 0.01% 0.24%
Acetaldehyde 101 33 1.3 1.4 -0.05% -0.15%
Benzene 624 9 0.4 0.4 0.00% 0.07%
Formaldehyde 266 85 3.5 3.6 -0.03% -0.10%
Isomers of xylene 979 3 0.1 0.1 0.00% 0.38%
Lead andcompounds 3 0 0 0.01 0.01% 0.14%
Toluene 1,315 4 0.2 0.2 0.00% 0.21%
TSP 2,737 600 44.5 44.1 0.01% 0.06%
PAH 23 2.9 3.0 -0.43%
Source: Technical Paper 8 – Regional Air Quality Assessment (Volume 6)
Notes: HV = heavy vehicles; PAH = Polycyclic aromatic hydrocarbon; loco = locomotives
Table 18.3 indicates that the Project would not have a discernible effect on total emissions or regional airquality in Sydney. The largest regional calculated change is a reduction of 0.03% in total NOX emissionsfrom all sources in the region (the regional change is shown in the ‘Total Sydney’ column in Table 18.3).The change in emissions is attributed to freight rail locomotives replacing heavy vehicles.
Table 18.3 also shows the specific impact of the Project on the motor vehicle and locomotive fraction oftotal emissions, and also the specific impact on heavy vehicles and locomotive emissions. As the Projectemissions are produced primarily by heavy vehicles and locomotives, the Project’s impact on this sub-component (heavy vehicles and locomotives) of the total regional emissions is most notable inTable 18.3.
Overall, the results show that the Project would have only a very small effect (increase or decrease) interms of total emissions in Sydney, and in terms of total emissions from either heavy vehicles orlocomotives alone. The total emissions in the Sydney region include emissions from electricitygeneration, solid fuel burning, industrial processes and a number of other sources, so the extent towhich the Project would have an impact at a regional scale is minor.

Parsons Brinckerhoff 18-12
To assess the effect on air quality from the predicted changes in pollutant emissions, the dispersion ofemissions in the Sydney region airshed was modelled. Air quality impacts that may result across variouslocations within the regional Sydney area were assessed by comparing the predicted air dispersionmodelling results with and without the Project at the various NSW OEH monitoring station locations. Thelocations represent the typical population exposure to air pollutants in the Sydney region. This has alsoallowed for direct comparison with the actual measured levels at these locations. The results of theProject dispersion modelling for each OEH monitoring location in 2031 have been presented alongsidethe 2011 measured data in Table 18.4. Table 18.4 also includes a summary of the future increase inconcentration for both the 2031 ‘with the Project’ and ‘without the Project’ scenarios for each locationand concentration. The relevant criteria for the modelled pollutants are listed in the first column of thetable.
Table 18.4 Modelling predictions at NSW OEH monitoring sites
Measured 2011 levels and additional future impact due to the Project
Barg
o
Bri
ngelly
Chullora
Earl
wood
Lin
dfi
eld
Liv
erp
ool
Macart
hur
Oakdale
Pro
spect
Randw
ick
Ric
hm
ond
Roze
lle
St
Mary
s
Vin
eya
rd
Max NO2
1-hraverage(µg/m³)
Criterionof 246µg/m³
Measured
86.5 54.5 95.9 86.5 75.2 86.5 84.6 50.8 73.3 99.6 54.5 94 67.7 69.6
Additional impact, in 2031, without the Project
0.01 0.13 0.26 0.15 0.22 0.26 0.23 0.02 0.29 0.18 0.08 0.27 0.13 0.12
Additional impact, in 2031, with the Project
0.01 0.14 0.27 0.17 0.21 0.37 0.23 0.02 0.27 0.17 0.08 0.27 0.12 0.13
Change due to the Project (%)
0.00 0.02 0.00 0.03 -0.01 0.13 0.00 0.00 -0.02 -0.01 0.00 0.00 0.00 0.01
NO2
annualaverage(µg/m³)
Criterionof 62µg/m³
Measured
8.7 9 24.5 17.4 18.4 18.2 14.6 3.4 19.5 14 9.6 20.9 10.8 11
Additional impact, in 2031, without the Project
0.00 0.03 0.10 0.05 0.06 0.09 0.07 0.00 0.11 0.02 0.01 0.07 0.03 0.03
Additional impact, in 2031, with the Project
0.00 0.01 0.05 0.02 0.02 0.05 0.03 0.00 0.04 0.01 0.01 0.03 0.01 0.01
Change due to the Project (%)
-0.01 -0.16 -0.21 -0.14 -0.21 -0.22 -0.28 -0.06 -0.33 -0.09 -0.08 -0.20 -0.19 -0.19
Max PM10
24-hraverage(µg/m³)
Criterionof 50mg/m³
Measured
89.7 86 65.2124.9
35.7 68.8 38.1 54.7 41.5 40.1 46.2 39.4 73.9 32.7
Additional impact, in 2031, without the Project
0.00 0.00 0.01 0.00 0.00 0.00 0.01 0.00 0.01 0.00 0.00 0.00 0.00 0.00
Additional impact, in 2031, with the Project
0.00 0.00 0.01 0.00 0.00 0.01 0.01 0.00 0.01 0.00 0.00 0.00 0.00 0.00
Change due to the Project (%)
0.00 0.00 0.00 0.00 0.00 0.01 0.00 0.00 0.00 0.00 0.00 0.00 0.00 0.00

Parsons Brinckerhoff 18-13
Measured 2011 levels and additional future impact due to the Project
Barg
o
Bri
ngelly
Chullora
Earl
wood
Lin
dfi
eld
Liv
erp
ool
Macart
hur
Oakdale
Pro
spect
Randw
ick
Ric
hm
ond
Roze
lle
St
Mary
s
Vin
eya
rd
PM10
annualaverage(µg/m³)
Criterionof 30µg/m³
Measured
12.9 15.9 19.8 18 13.3 18.1 13.2 10.7 15.8 16 13.2 16.6 14.7 14
Additional impact, in 2031, without the Project
0.00 0.00 0.00 0.00 0.00 0.00 0.00 0.00 0.00 0.00 0.00 0.00 0.00 0.00
Additional impact, in 2031, with the Project
0.00 0.00 0.00 0.00 0.00 0.00 0.00 0.00 0.00 0.00 0.00 0.00 0.00 0.00
Change due to the Project (%)
0.00 0.00 0.00 0.00 0.00 0.01 0.00 0.00 0.00 0.00 0.00 0.00 0.00 0.00
Max CO1-hraverage(mg/m³)
Criterionof 30mg/m³
Measured
ND ND 1.73 ND ND 2.76 1.27 ND 1.96 ND ND 1.61 ND ND
Additional impact, in 2031, without the Project
0.01 0.08 0.16 0.09 0.13 0.15 0.14 0.01 0.17 0.1 0.05 0.16 0.07 0.07
Additional impact, in 2031, with the Project
0.01 0.08 0.19 0.13 0.13 0.35 0.14 0.01 0.16 0.15 0.05 0.18 0.07 0.08
Change due to the Project (%)
- - 1.90 - - 7.21 0.55 - -0.52 - - 1.25 - -
Source: Technical Paper 8 – Regional Air Quality Assessment (Volume 6)
Notes: µg/m3 = micrograms per cubic metre; mg/m3 = milligrams per cubic metre; NO2 = nitrogen dioxide; CO = carbonmonoxide; PM10 = Particulate matter ≤ 10 µm in aerodynamic diameter
Figures showing the spatial distribution of any change in air quality are presented in Technical Paper 8 –Regional Air Quality Assessment in Volume 6 (section 7.2.2). As would be expected, these figures showthat the largest effects occur alongside road and rail corridors, and the effect reduces rapidly withincreasing distance from the corridor.
The results from Table 18.4 demonstrate that, overall, the Project would not have any discernible impacton air pollution concentrations at any of the monitoring locations within the Sydney basin. All predictedlevels are well within the applicable criteria.
The Project is predicted to slightly increase some concentrations of air pollutants in the region, alongroads near Moorebank and the western part of the rail corridor from Port Botany to Moorebank, as theseare the primary routes for IMT transport. This slight increase is shown in Table 18.4, which indicates thatareas close to the Project and Port Botany transport corridor, such as Liverpool, would generallyexperience a slight increase in pollutant concentrations with the addition of the Project in 2030. TheProject is also predicted to reduce emissions on the eastern part of the Port Botany to Moorebank railcorridor and to decrease traffic emissions along the M5, M4 and M2 Motorways, due to the anticipatedshift in transport from road to rail.
The regional air quality assessment found that, as a whole, the Project would have a negligible effect onair emissions across the Sydney basin when it reaches full operation in 2030. Therefore, it can beconcluded that the predicted impacts of the Project on regional air quality in Sydney are insignificant.
The change in emissions due to the Project arises from a reduction in VKT travelled by heavy dieseltrucks on Sydney roads (refer Chapter 11 – Traffic, transport and access), and an increase ofapproximately 20 trains a day travelling between Port Botany and Moorebank as a result of the IMEXoperation.

Parsons Brinckerhoff 18-14
The effect on air quality due to the Project arises from a reduction in emissions from heavy dieselvehicles in most LGAs and an increase in locomotive emissions between Port Botany and Moorebank.There is also an increase in emissions from heavy diesel vehicles in the general area of the Project.
However, the notable finding of the assessment is that the change in emissions due to the Project on aregional level is likely to be small and is unlikely to be discernible relative to pollutant levels within theSydney basin that would occur with or without the Project.
18.3.3 Consideration of cumulative assessment
A cumulative assessment of the Project and a potential warehousing development on the SydneyIntermodal Terminal Alliance (SIMTA) site has been undertaken for traffic, noise and local air quality. Theprimary purpose of the assessment was to identify impacts on the local community, and to this end thelocal air quality cumulative assessment (refer to Chapter 27 – Cumulative impacts) is considered to be amore appropriate approach to cumulative impact assessment.
At the regional scale, there are a number of other developments that could equally contribute to theregional airshed, and it is not feasible to model all of these. Based on regional air quality modelling, theoverall impact of the Project on the regional airshed was found to be negligible.
18.3.4 Management and mitigation
Based on the regional air quality assessment included in Volume 6 of this EIS and summarised in thischapter, no substantial regional air quality impacts are predicted to result from the operation of theProject. Therefore, no specific management or mitigation measures for regional air quality are proposedin this EIS.
Potential local air quality impacts that may result from the construction and operation of the Project havebeen discussed in Chapter 17 – Local air quality. Chapter 17 also includes a range of management andmitigation measures that are designed to address the local air quality impacts discussed in that chapter.
The results show that the largest effects of the Project would be localised to the vicinity of the Project,and hence the local air quality impact assessment at Chapter 17 should be referred to for a detailedassessment of potential impacts at sensitive receptor locations.
18.4 Summary of key findings
Regional air quality in the Sydney basin is primarily influenced by emissions from major industries,commercial operations, motor vehicles and domestic activities such as wood heaters. The SoE report(SEWPaC 2011) notes that national ambient air quality standards are rarely exceeded for extendedperiods in the Sydney region, and exceedances are normally associated with particular events such asbushfires and dust storms.
Motor vehicles are one of the most significant sources of air pollutants in Sydney, accounting for around80% of CO emissions, 70% of NOX emissions and almost 40% of total VOC emissions. The Regional AirQuality Assessment has found that the impacts of the Project on regional air quality in the Sydney basinwould be insignificant. The largest calculated effect is predicted to be a 0.03% reduction in NOx in theSydney airshed which would arise from the reduction in heavy vehicle VKT. No net change waspredicted for other pollutant emissions that are quantified for the whole of Sydney region.

Parsons Brinckerhoff 18-15
A summary of the annual average nitrogen dioxide (NO2) levels between 2005 and 2013 from the NSWEPA monitoring stations is presented in Figure 18.5. The figure shows a falling trend in NOX levels, andthat measured levels were below criteria at all monitoring sites.
All predictions are well within the applicable air quality criteria for the modelled pollutants.
The Project is predicted to slightly increase some concentrations of air pollutants along roads nearMoorebank and the western part of the rail corridor from Port Botany to Moorebank. Also, the Project ispredicted to slightly reduce emissions on the eastern part of the Port Botany to Moorebank rail corridorand to decrease traffic emissions along the M5, M4 and M2 motorways, due to the anticipated shift intransport from road to rail. However, the change in emissions on a regional level is likely to be small, andunlikely to be discernible relative to pollutant levels that would occur with or without the Project.
As there are no substantial regional impacts predicted to result from the operation of the Project, nospecific management or mitigation measures are proposed.
Table 18.5 summaries the regional air quality impacts for the Project at Full Build for each rail accessoption. There is no discernible difference in impact or benefit between the options.
Table 18.5 Summary of regional air quality impacts at Full Build
ImpactIMT layout and associated rail
access connection option
Northern Central Southern
Increase in pollutant concentrations that can be quantified at aregional level for the Sydney basin
- - -
Slight reduction in NOx air pollution levels for the Sydney basin(positive outcome)
· · ·
Slight increase of some concentrations of air pollutants in theregion, along roads near Moorebank and the western part of therail corridor from Port Botany to Moorebank
· · ·
Key: · = impact, - = no impact
The regional air quality assessment focused on the Project’s operational Full Build scenario as thisphase would result in the most significant change to existing regional conditions. Early works andconstruction impacts are unlikely to generate air quality impacts that would be significant at a regionallevel and, therefore, these were examined in the local air quality assessment (refer Chapter 17 – Localair quality).