chapter 17: noise a. introduction - amazon web...
TRANSCRIPT
17-1
Chapter 17: Noise
A. INTRODUCTION The proposed project would result in the development of a major new urban waterfront park along the East River shoreline from the Manhattan Bridge to Atlantic Avenue. The proposed project would include an approximately 85-acre public park with a mix of active and passive open spaces along the waterfront as well as residential and commercial space.
This noise analysis examines three issues:
1. Whether project-generated traffic would result in significant increases in noise levels at receptor sites in the area surrounding the project site;
2. Whether noise levels at the proposed park would comply with New York City Environmental Quality Review (CEQR) noise criteria; and
3. What is the appropriate level of building attenuation necessary to provide acceptable interior noise levels.
Depending on location, noise levels in the project area are due to a combination of sources: traffic on nearby streets, the Brooklyn-Queens Expressway, and the Brooklyn Bridge; traffic and trains on the Manhattan Bridge; aircraft flyovers; and boat traffic on the East River. The proposed Brooklyn Bridge Park would add new traffic to nearby streets and roadways and thereby increase surrounding noise levels. In addition, the proposed project would increase noise as a result of boating activities associated with the park and people using the park. As described in detail below, this noise analysis examines the cumulative effect of noise from all of these sources on future noise levels with the proposed project (Build condition) compared with future noise levels without the proposed project (No Build condition).
The proposed project would result in no significant off-site adverse noise impacts. In terms of on-site locations, noise levels both with and without the proposed project would be high. They are high in the western portion of the project site, principally due to noise generated by traffic on the Brooklyn-Queens Expressway and along the eastern portion of the project site principally due to noise generated by vehicular traffic and trains on the Manhattan Bridge. The project site was an industrial area at the time the Brooklyn-Queens Expressway and Manhattan Bridge were built, and noise from these facilities was not a significant concern. While noise at the proposed park would be similar to, or less than, noise at other New York City parks which are adjacent to heavily trafficked roadways, based upon CEQR noise criteria, ambient noise levels would have a potentially significant noise impact on users of the new park. On the uplands between Pier 2 and Pier 5, the proposed park incorporates hills that reduce the noise from the Brooklyn Queens Expressway and Furman Street by 2-to-10 dBA within the park—thereby providing notable noise abatement to the park compared to existing and no-build conditions. There are no additional feasible and practicable mitigation measures that can be implemented to further reduce noise levels within the park. Buildings on-site would be designed with sufficient building attenuation measures to comply with all appropriate CEQR guidelines.
Brooklyn Bridge Park FEIS
17-2
B. NOISE FUNDAMENTALS
A-WEIGHTED SOUND LEVEL, dBA
Loudness is a subjective quantity that enables a listener to order the magnitude of different sounds on a scale from soft to loud. Although the perceived loudness of a sound is based somewhat on its frequency and duration, it chiefly depends on the sound pressure level. Sound pressure level is a measure of the sound pressure at a point relative to a standard reference value; sound pressure level is always expressed in decibels (dB), which is a logarithmic quantity.
Another important characteristic of sound is its frequency, or “pitch.” This is the rate of repetition of sound pressure oscillations as they reach our ears. Frequency is expressed in units known as hertz (abbreviated “Hz” and equivalent to one cycle per second). Sounds heard in the environment usually consist of a range of frequencies. The distribution of sound energy as a function of frequency is termed the “frequency spectrum.”
The human ear does not respond equally to identical noise levels at different frequencies. Although the normal frequency range of hearing for most people extends from a low of about 20 Hz to a high of 10,000 Hz to 20,000 Hz, people are most sensitive to sounds in the voice range, between about 500 Hz to 2,000 Hz. Therefore, to correlate the amplitude of a sound with its level as perceived by people, the sound energy spectrum is adjusted, or “weighted.”
The weighting system most commonly used to correlate with people’s response to noise is “A-weighting” (or the “A-filter”), and the resultant noise level is called the “A-weighted noise level” (dBA). A-weighting significantly de-emphasizes those parts of the frequency spectrum from a noise source that occur at lower frequencies (below about 500 Hz) and at very high frequencies (above 10,000 Hz) where we do not hear as well. The filter has very little effect, or is nearly “flat,” in the middle range of frequencies between 500 and 10,000 Hz. A-weighted sound levels have been found to correlate better than other weighting networks with human perception of “noisiness.” One of the primary reasons for this is that the A-weighting network emphasizes the frequency range where human speech occurs, and noise in this range interferes with speech communication. Figure 17-1 shows common indoor and outdoor A-weighted sound levels and the environments or sources that produce them.
EQUIVALENT SOUND LEVEL, Leq
The equivalent sound level, abbreviated Leq, is a measure of the total exposure resulting from the accumulation of A-weighted sound levels over a particular period of interest—for example, an hour, an 8-hour school day, nighttime, or a full 24-hour day. However, because the length of the period can be different depending on the time frame of interest, the applicable period should always be identified or clearly understood when discussing the metric. Such durations are often identified through a subscript; for example, the 1-hour equivalent sound levels is usually denoted as Leq1h, or Leq(1) and the 24-hour equivalent sound level is usually denoted as Leq(24).
Leq may be thought of as a constant sound level over the period of interest that contains as much sound energy as (is “equivalent” to) the actual time-varying sound level with its normal peaks and valleys. It is important to recognize, however, that the two signals (the constant one and the time-varying one) would sound very different from each other. Also, the “average” sound level suggested by Leq is not an arithmetic value but a logarithmic, or “energy-averaged,” sound level. Thus, the loudest events may dominate the noise environment described by the metric, depending on the relative loudness of the events.

Chapter 17: Noise
17-3
Common OutdoorSound Levels
Common IndoorSound Levels
Noise LeveldB(A)
110
100
90
80
70
60
50
40
30
20
10
0
Rock Band
Inside Subway Train (New York)
Food Blender at 3 Feet
Garbage Disposal at 3 FeetShouting at 3 Feet
Vacuum Cleaner at 10 Feet
Normal Speech at 3 Feet
Large Business Office
Dishwasher Next Room
Small Theater, Large Conference Room(Background)
Library
Bedroom at Night
Concert Hall (Background)
Broadcast and Recording Studio
Threshold of Hearing
Commercial Jet Flyover at 1000 Feet
Gas Lawn Mower at 3 Feet
Diesel Truck at 50 Feet
Concrete Mixer at 50 Feet
Air Compressor at 50 Feet
Lawn Tiller at 50 Feet
Quiet Urban Daytime
Quiet Urban Nighttime
Quiet Suburban Nighttime
Quiet Rural Nighttime
Figure 17-1. Common Indoor and Outdoor A-Weighted Noise Levels
STATISTICAL SOUND LEVEL DESCRIPTORS
Statistical descriptors of the time-varying sound level are often used instead of, or in addition to, Leq to provide more information about how the sound level varies during the time period of interest. The descriptor includes a subscript that indicates the percentage of time the sound level is exceeded during the period. The L50 is an example, which represents the sound level exceeded 50 percent of the time, and equals the median sound level. Another commonly used descriptor is the L10, which represents the sound level exceeded 10 percent of the measurement period and describes the sound level during the louder portions of the period. The L90 is often used to describe the quieter background sound levels that occurred, since it represents the level exceeded 90 percent of the period.
The relationship between Leq and statistical descriptors is worth mentioning. Where noise fluctuates very little, the Leq approximates the median L50 level. Where noise fluctuates more, Leq may approximate or even exceed the L10. In urban areas, Leq is usually between L50 and L10, often 2 dB to 4 dB less than L10, except under an airport flight path.
Brooklyn Bridge Park FEIS
17-4
NOISE DESCRIPTORS USED IN THIS STUDY
For the proposed project’s noise analysis, the 1-hour equivalent sound level (Leq(1)) was selected as the noise descriptor to be used in the noise impact evaluation. Leq(1) is the descriptor recommended for use in the CEQR Technical Manual (October 2001) for vehicular traffic and train noise evaluation; these are the main sources of noise in the area of the Brooklyn Bridge Park site. In addition, the L10(1) is used for determining compliance with CEQR Noise Exposure Standards and for CEQR review in determining required attenuation values to achieve acceptable interior noise levels for buildings. Comparisons of L10(1) and Leq(1) from the long-term noise measurements conducted for this project are presented and described in the “Noise Measurements” section below.
APPLICABLE NOISE STANDARDS AND CRITERIA
On property not owned by New York State, noise levels associated with the construction and operation of the proposed project are subject to the emission source provisions of the New York City Noise Control Code and to noise standards set for the CEQR process. Other standards and guidelines promulgated by federal agencies do not apply to project noise, but are presented for perspective on other noise impact measures. Although not leagally required, CEQR guidelines were used to assess potential project noise impacts.
NEW YORK CITY NOISE CODE
The New York City Noise Control Code promulgates sound-level standards for motor vehicles, air compressors, and paving breakers; requires that all exhausts be muffled; and prohibits all unnecessary noise adjacent to schools, hospitals, or courts. The code further limits construction activities to weekdays between 7 AM and 6 PM.
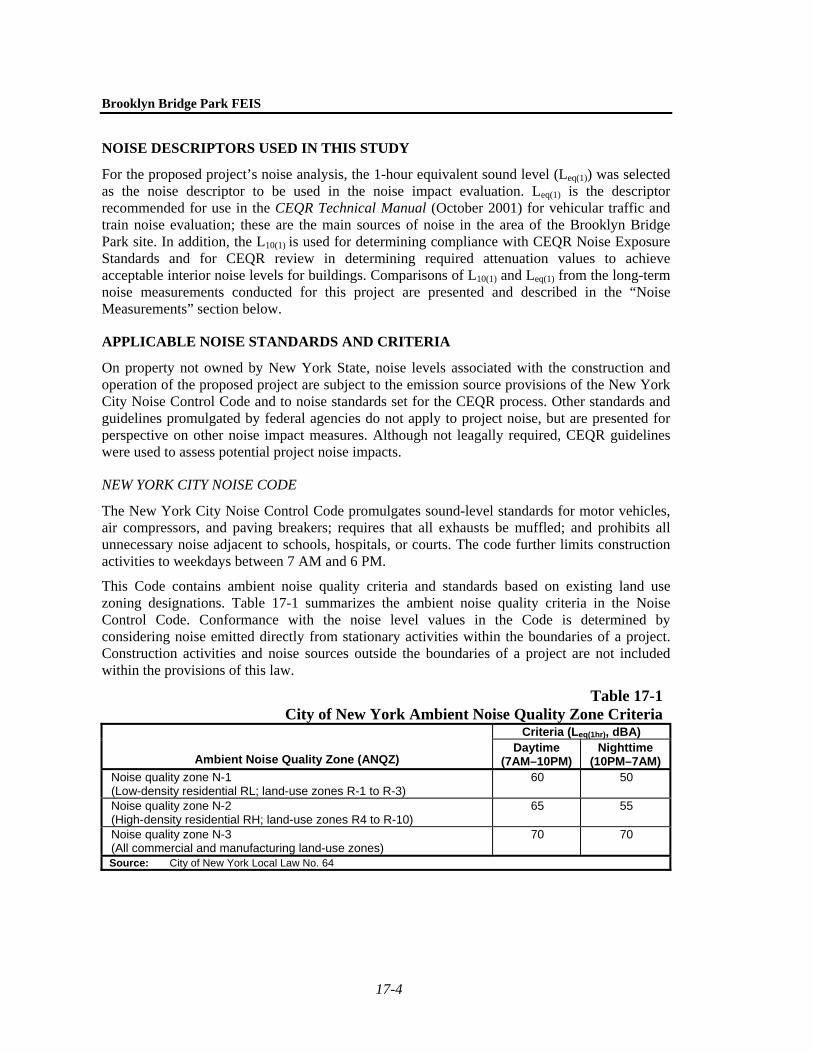
This Code contains ambient noise quality criteria and standards based on existing land use zoning designations. Table 17-1 summarizes the ambient noise quality criteria in the Noise Control Code. Conformance with the noise level values in the Code is determined by considering noise emitted directly from stationary activities within the boundaries of a project. Construction activities and noise sources outside the boundaries of a project are not included within the provisions of this law.
Table 17-1City of New York Ambient Noise Quality Zone Criteria
Criteria (Leq(1hr), dBA)
Ambient Noise Quality Zone (ANQZ) Daytime
(7AM–10PM) Nighttime
(10PM–7AM) Noise quality zone N-1 (Low-density residential RL; land-use zones R-1 to R-3)
60 50
Noise quality zone N-2 (High-density residential RH; land-use zones R4 to R-10)
65 55
Noise quality zone N-3 (All commercial and manufacturing land-use zones)
70 70
Source: City of New York Local Law No. 64

Chapter 17: Noise
17-5
NEW YORK CITY CEQR NOISE STANDARDS
The New York City Department of Environmental Protection (DEP) has set exterior noise exposure standards (see Table 17-2). Noise exposure is classified into four categories: acceptable, marginally acceptable, marginally unacceptable, and clearly unacceptable. For parklands, described as “outdoor areas requiring serenity and quiet,” the CEQR criterion for “acceptable” noise conditions is no higher than 55 dBA, L10. For residential areas during daytime hours, the highest “acceptable” exterior L10 value is 65 dBA. While the park would be open until 1:00 AM, this analysis focuses on daytime noise criteria, since those are the hours when the project would have the maximum potential for significant impacts. Where increases in noise levels due to the project are expected from future No Build to future Build conditions such that the future Build condition results in levels higher than the “acceptable” category, noise mitigation must be considered.
A screening process for increases in noise due to increased traffic from the existing to the future Build conditions is also required. Where traffic volumes are expected to be at least twice as high under the Build scenario, further study of these areas is required.
Table 17-2 CEQR Noise Exposure Standards for Use
in City Environmental Impact Review1

Brooklyn Bridge Park FEIS
17-6
DEP has also set standards of acceptability for exterior noise levels in residential areas, with the aim of maintaining an interior L10 noise level of no higher than 45 dBA during the worst-case hour. The standards are shown in Table 17-3, along with the required outdoor-to-indoor attenuation values needed to achieve the 45 dBA interior level.
Table 17-3 Required Attenuation Values to Achieve Acceptable Interior Noise Levels
NOISE CONTROL ACT OF 1972
As a result of the Noise Control Act of 1972, a document titled “Information on Levels of Environmental Noise Requisite to Protect Public Health and Welfare with an Adequate Margin of Safety” was published in 1974 by the U.S. Environmental Protection Agency (EPA). This report identified the day-night sound level (Ldn) of 55 dBA as an appropriate exterior noise level for residential and park areas. An Ldn of 45 dBA was identified as appropriate for indoor residential areas. These levels do not constitute enforceable Federal regulations or standards, but they do represent valid criteria for evaluating the effect of project noise on public health and welfare.
C. NOISE PREDICTION/ASSESSMENT METHODOLOGY Future noise levels both with and without the Brooklyn Bridge Park project may change from existing conditions as a result of one or more of the following factors:
• Traffic effects, including changes in vehicle volumes and travel speeds due to the general growth of traffic in the study area, changes in vehicle volumes and travel speeds due to site- specific projects in the study area, and/or changes in vehicle volumes and travel speeds due to trips associated with the proposed Brooklyn Bridge Park project (including trips made by park users and trips made by residential and commercial uses associated with the project);
• Changes in the roadway system;
• Trains on the Manhattan Bridge;
• Boating activities associated with the park;
• People using the park, particularly gatherings of people in the park (“crowd” noise); and
• Construction of buildings as part of the proposed project that may reduce noise in some areas and increase noise in others due to reflections.
Noise associated with each of these sources and factors was addressed in this analysis; the noise from all contributing sources was summed.
Noise was assessed during three different time periods to ensure potential circumstances for noise impact and increases were addressed. The time periods identified for evaluation in this
Chapter 17: Noise
17-7
study are: the weekday midday, weekday PM peak, and Sunday midday periods. The weekday AM peak period was not studied, since park usage would be lower during this period than during the other periods analyzed, and potential project impacts and ambient noise levels would be less than one or more of the other periods analyzed.
VEHICULAR TRAFFIC NOISE
Vehicular traffic volumes, speeds, and classification used in the noise study were developed as part of the project’s traffic analysis (see Chapter 14, “Traffic and Parking”). Separate predictions were developed for 2005 existing, 2012 No Build, and 2012 Build conditions. For each of these conditions, traffic data were developed separately for each of the three time periods studied. This traffic data formed the basis for the traffic noise predictions.
Two separate traffic noise prediction exercises were undertaken to address potential noise impacts due to the proposed project. The first was a screening analysis to determine if there were any locations where changes in traffic volumes due to the proposed project had the potential to result in an increase in noise levels of 3 dBA or more. This analysis is performed by first determining if the volume of passenger car equivalents (PCEs) would double, which would cause a 3 dBA increase. Then, for roadways where project-generated traffic would result in a doubling or greater in PCEs, the noise levels due to traffic on the immediately adjacent street were computed. These noise level computations were performed with Traffic Noise Model (TNM) Lookup Version 2.0, a Federal Highway Administration (FHWA)-approved traffic noise prediction program for simple situations, based on computations from TNM Version 2.5.1 Next, noise from other sources (i.e., the Brooklyn Queens Expressway, the Manhattan Bridge, the Brooklyn Bridge, and/or other more heavily trafficked roadways) was assessed to determine if these sources were dominant. If noise from other sources was not dominant and would not mask noise from the local street, then that location was selected as a noise receptor requiring detailed analysis.
The second traffic noise prediction exercise, a detailed analysis, was performed using the full TNM Version 2.5. This modeling exercise incorporated all of the major roadways, including the Brooklyn Queens Expressway, Furman Street, Old Fulton Street, Atlantic Avenue, the Brooklyn Bridge, and the Manhattan Bridge. TNM Version 2.5 is the FHWA’s latest traffic noise prediction model, and accounts for vehicle volume, vehicle speed, vehicle mix, source-receiver geometry, and shielding from terrain and buildings. However, the TNM cannot adequately account for the complex sound reflections that occur within the Brooklyn Queens Expressway “half tunnels” adjacent to the Brooklyn Heights Promenade and the proposed park. That unique highway geometry does not lend itself to accurate modeling within current noise prediction computer models. Therefore, controlled noise measurements were conducted at two sites adjacent to the Brooklyn Queens Expressway near Pier 2 (Sites OPS-7 and OPS-8) for purposes of determining the effect of reflections (see following section on noise measurements). These two sites, at 150 feet and 260 feet from the Brooklyn Queens Expressway, respectively, were modeled with TNM using normal highway modeling procedures. The computed Existing case noise levels at the two sites averaged 7 dBA less than the measured values. Therefore, an adjustment factor of 7 dBA was added to the TNM-computed Brooklyn Queens Expressway noise levels to account for the reflections at all receivers outboard of the Brooklyn Queens Expressway from Pier 2 to Pier 5.
1 U.S. Department of Transportation, Federal Highway Administration, FHWA Traffic Noise Model User's
Guide, Report FHWA-PD-96-009, Washington, D.C., January 1998.

Brooklyn Bridge Park FEIS
17-8
TRAIN NOISE
The rail lines that cross the Manhattan Bridge increase the noise levels in the D.U.M.B.O. area significantly more than the noise from local and bridge vehicular traffic. The bridge’s rigid steel structure serves as an efficient radiator of the wheel–rail noise generated each time a train passes by. Given the complexity of the structure, the most straightforward means to represent the train noise in the greater study area is through the measured noise levels. The noise measurements were conducted in a manner that allowed the train noise to be separated from that of other sources (see description of the method in the measurement section below). This approach allowed the noise from the trains during the measurement period to be adjusted for other time periods, based on the number of trains per hour taken from published schedules. The measured PM peak period train-only noise level was slightly lower than the midday period level at the same site. Since the number of trains in the PM peak period is greater than those at midday, the difference is likely due to the slightly reduced speeds in the PM peak period. Train noise levels increase significantly with increased speed.
BOATING ACTIVITY NOISE
Marine engineers on the project team provided estimates of expected future activity and locations for the proposed marina and water taxis during peak periods. At the marina, a maximum of 120 motorboat movements was conservatively assumed in the no-wake zones during peak periods (one boat per minute in each direction, representing two-thirds of the marina’s capacity). The highest noise emissions in terms of sound exposure level (SEL, which represents the total noise energy of a pass-by) are predicted to be in these no-wake zones, where the boat speeds are 5 knots or less. Water taxi docks for Build conditions were modeled at Piers 1, 3, and 6. They are expected to travel to the docks at a frequency of up to twice per hour at each pier during peak periods. As a worst case it was assumed that all boats will travel between piers so boat noise sources were modeled at a distance of about 50 feet from the end of each pier.
Boat noise emissions data were obtained from the Appendix D2 of the Hudson River Park Final Environmental Impact Statement (FEIS)1. The water taxi boat was assumed to be equivalent to a 60-foot aluminum charter fishing boat with Twin DD12V-71 600 hp Diesels (Boat A in Table D2-1 of the FEIS). Motorboats at the marina were modeled from the list of eight boats in Table D2-3 of the FEIS, and the average low-speed condition was used to model the worst-case peak period at 120 boats per hour. Modeling for both types of boats used reference SELs from the emissions data in the low-speed (5 knots) pass-by case. In addition, idling of water taxis at the dock was modeled for 3 minutes per stop.
NOISE FROM PARK USERS
From a review of the acoustical literature, very little quantitative information is available on noise levels from park users or from crowds in public gatherings. In addition, the noise levels produced are highly dependent on the nature of the activity that draws the crowd (e.g., speech, musical or dramatic performance, and so on). Human voices can generate a wide range of sound levels, and different people will vocalize differently under the same circumstances. Notwithstanding this variability, logical assumptions can yield estimates from which conclusions may be reached. A single person cheering at a moderately enthusiastic level can produce noise 1 Hudson River Park, Final Environmental Impact Statement, Empire State Development Corporation in
cooperation with Hudson River Park Conservancy, May 1998.

Chapter 17: Noise
17-9
levels ranging anywhere from 80 dBA to 100 dBA at 3 feet in front of the person. Sound levels drop 5 to 10 dBA to the side and behind the person cheering. A cheer of 90 dBA at 3 feet would be 50 dBA at a 300-foot distance, in front of the person, with no shielding or atmospheric/ground effects affecting the sound propagation. The sound level in front of a gathering of 200 people all cheering at once could be about 75 dBA at 300 feet from the crowd. Levels would increase or decrease proportionally (by ± 3 decibels per doubling/halving of the number of people) depending on the number of people in the gathering and the percentage of them cheering. However, very large crowds, such as those present at sports or music events in a stadium, would not be expected as a result of the proposed project.
Another aspect of crowd noise is that it is usually quite intermittent. People do not cheer continuously at gatherings. Rather, the cheers surge and drop during event conditions.
Routine events that would draw large crowds are not anticipated for the Brooklyn Bridge Park project.
Because of the intermittent nature of this noise source, and the relatively high level of noise generated by other sources in the project area, noise from park users is expected to have a negligible effect on ambient noise levels.
D. EXISTING CONDITIONS
SITE DESCRIPTION AND NOISE RECEPTOR SELECTION
The study area extends along Brooklyn’s East River waterfront from Jay Street in the north to Atlantic Avenue in the south. Existing City and State park lands near the Manhattan and Brooklyn Bridges are included in the project development area as well as pier areas from Pier 1 through Pier 6. The proposed project would include some residential and commercial development (including a hotel, restaurants, and retail space) as well as park and recreational areas. Noise-sensitive receptors adjacent to the project site that may be affected by project-related activities and traffic include residences in Brooklyn Heights and D.U.M.B.O. and people using the Brooklyn Heights Promenade opposite Pier 2 through Pier 5.
Based on the results of a traffic screening analysis, seven representative noise receptor sites were selected at locations adjacent to the project site for detailed impact analysis. These locations were chosen based on their noise sensitivity and likelihood of being exposed to the greatest increases in noise from the project. (It should be noted that at some locations where there was a doubling or even a tripling in traffic volumes, noise from other sources—the Brooklyn Queens Expressway, the Manhattan Bridge, the Brooklyn Bridge, and/or other more heavily trafficked roadways—was the dominant noise source and would mask noise from the local street. Consequently, such locations were not selected as noise receptors for detailed analysis.)
In addition to the seven off-site noise receptor sites, 21 representative noise receptor sites were selected at locations on the project site, either to determine compliance with CEQR noise exposure standards for parkland or to determine building attenuation values for evaluating compliance at project buildings with CEQR interior noise level requirements.
At six of the seven off-site receptor locations, and four of the 21 on-project-site receptor sites, noise measurements were performed. These measurements were taken at a sufficient number of receptor sites to document existing noise levels and to validate the modeling procedures used to calculate noise levels. It is common practice to conduct measurements at a representative

Brooklyn Bridge Park FEIS
17-10
selection of all receptor sites used in the analysis; measurements are not required at each site to adequately characterize project noise levels and potential impacts.
Figure 17-2 shows the 28 noise receptor sites. Table 17-4 describes each of the sites and indicates receptor sites where noise measurements were taken.
Table 17-4Noise Measurement and Prediction Site Descriptions
Site Name Description/Location OS-1* Five-story residential building, corner of Jay St. and John St. OS-2* Five-story residential building, corner of Old Fulton St. and Furman St. OS-3 Squibb Park OS-4* Proposed residential/hotel site, along Furman St., opposite end Cranberry St. OS-5* Bench at back of Brooklyn Heights Promenade opposite Pier 2 and Sites 6A and B OS-6* End Remsen St., residential near Brooklyn Heights Promenade OS-7* Proposed residential site, Atlantic Ave. and Furman St. OPS-1* Proposed residential site, John St. near Adams St. OPS-2* Existing Main Street Park, benches near playground opposite 13-story residential building OPS-3* Empire Fulton-Ferry State Park, benches at south end near Brooklyn Bridge OPS-4 Fulton Ferry Landing OPS-5 Proposed park lawn, Pier 1 OPS-6 Proposed park, Pier 1, public gathering OPS-7* Proposed park, Pier 2, 150 feet from Brooklyn Queens Expressway OPS-8* Proposed park, Pier 2, 260 feet from Brooklyn Queens Expressway OPS-9 Proposed park lawn/kayak launch, middle Pier 2 OPS-10 Proposed park, middle Pier 3 OPS-11 Proposed park, west end Pier 3 OPS-12 Proposed park, east end Pier 3 OPS-13 Proposed park, east end Pier 3 OPS-14 Proposed park, east end Pier 4 OPS-15 Proposed park/water habitat, east end Pier 5 OPS-16 Proposed park, east end Pier 5 OPS-17 Proposed park boat mooring, middle Pier 5 OPS-18 Proposed park, west end Pier 5 OPS-19 Proposed park, west end Pier 6 OPS-20 Proposed park, east end Pier 6 OPS-21 Proposed park, middle Pier 6 Notes: * Denotes noise measurement site. OS = Off-site OPS = On-project-site
NOISE MEASUREMENTS
The noise measurement program consisted of both short-term measurements (approximately 20 minutes in duration) and long-term 24-hour, unattended monitoring. Measurements were conducted on May 3 and 4, 2005, both weekdays, and on May 8, 2005, a Sunday. All

StateStreet
Grace
Court
Rem
senStreet
Montague
Street
PierrepontStreet C
larkStreet
PineappleStreet
Orange
Street
Cranberry
Street
Middagh
Street
Poplar
Street
W illow Place
Columb
Hicks Street
Columbia Heights
Promenade
W illow Street
Hicks Street
HenryStreet
Columbia He
ights
W illow Street
HicksStreet
HenryStreet
d n Place
College Plac
e
Grace
Court
Plac
Montague Terrace - Pierre
LoveLane
Vine
Street
Doughty
Street
Elizabeth St.
Brooklyn
Qu
ns Expressway
Everitt St
Furman Street
Old
Fulto
nSt
reet
New
Dock
Street
Dock
Street
Front Street
York
Street
Willow
Street
Main S
treet
Adam
s Stre
et
earl St
reet
y Stre
et
YorkStree
Plymouth
Street
Washing
tonStreet
Anchora
Adam
s Stre
et
Water
Str
C adm
anPlaz
aWest
JohnStreet
0 200 400 800 F
llumbb
nns
Manhattan
1 REIP
2 REIP3 REIP4 REIP
5 REIP6 REIP
namruF 063 teertS
Marina
Pier 6 Upland Residential
Pier 1 Restaurant
Pier 1 Hotel/ Residential
Existing Fulton Ferry State Park
John Street SiteResidential
Safe Water Zone
Safe Water Zone
egdirB nylkoor
B
egdirB nattahna
M
E A S T R I V E R
Squibb Park
Existing Main Street City Park
Indoor Athletic Field Structure
Residential
Residential
OPS-19OPS-19
OPS-21OPS-21
OPS-20OPS-20
OS-7OS-7
OPS-16OPS-16
OPS-17OPS-17
OPS-18OPS-18
OPS-15OPS-15
OS-6OS-6
OPS-14OPS-14
OPS-13OPS-13
OPS-11OPS-11
OPS-10OPS-10
OPS-12OPS-12
OPS-9OPS-9
OPS-8OPS-8
OPS-6OPS-6OPS-5OPS-5
OS-3OS-3
OS-2OS-2
OPS-4OPS-4
OPS-3OPS-3
OPS-2OPS-2
OPS-1OPS-1
OS-4OS-4
OS-5OS-5
OPS-7OPS-7
OS-1OS-1(corner of Jay &John St.)(corner of Jay &John St.)
OPS-21
OPS-20
OS-7
OPS-16
OPS-17
OPS-18
OPS-15
OS-6
OPS-13
OPS-11
OPS-10
OPS-12
OPS-9
OPS-8
OPS-6OPS-5
OS-3
OS-2
OPS-4
OPS-3
OPS-2
OPS-1
OS-4
OS-5
OPS-7
OS-1(corner of Jay &John St.)
OPS-19
OPS-14
6.21
.05
BROOKLYN BRIDGE PARK
Noise Receptor SitesFigure 17-2
N
0 100 500Feet
Project Area Boundary
Noise Receptor Location
Off-Site Receptor
Receptor On Project Site
New Building
Existing Building to Remain
Existing Building to Reuse
Landscaping/Lawn
Astroturf
Playground
Active Recreation
Vehicular Road/Parking
Pedestrian Paving
Marina
Safe Water Zone
OPS-
OS-

Chapter 17: Noise
17-11
measurements were conducted with a Brüel and Kjær Type 2260 integrating sound level meter, a Type I (precision) instrument. The short-term data collection procedure involved the measurement of Leq over consecutive 1-minute periods. With this method, minute-to-minute, the observer annotates those sources of noise that may affect the measured Leq. Later, when analyzing the data, individual minutes for which the Leq is controlled by different noise sources, such as traffic, trains, or aircraft, may be separated or combined, as appropriate. Also, minutes contaminated by noise that the observer believes is uncharacteristic of a site can be excluded altogether. This method of measurement allowed the noise from trains on the Manhattan Bridge to be analyzed and computed separately from vehicular traffic noise.
Table 17-5 presents the measured noise levels at the short-term measurement sites. The table shows first the site number and location, followed by the time period in which the measurement was conducted. At sites OS-4 on Furman St., OS-5 on the Brooklyn Heights Promenade, and OPS-3 in Empire Fulton-Ferry State Park, measurements were conducted during two different time periods. The first column under “Measured Leq” gives the total measured noise level, exclusive of uncharacteristic events, as described above. The total includes noise from aircraft and trains as well as traffic. Nearly all aircraft noise was associated with helicopter traffic over the river, and all train noise was from traffic on the Manhattan Bridge. The second column under “Measured Leq” gives the noise level attributable only to vehicular traffic, and the third column gives the noise level associated only with trains on Manhattan Bridge. The last column in the table provides an estimate of the L10 at each site, which was based on the observed differences between Leq and L10 measured at the long-term sites, described below.
Table 17-5Short-Term Noise Measurement Results
Measured Leq (dBA)
Site No. Location Time Period Total Traffic Only
Trains Only
L10 (dBA) Total
OS-1 Jay St. and John St. Weekday midday 67.5 67.1 66.7 71.5
OS-2 Old Fulton and Furman St. Weekend midday 66.9 66.2 N/A 68.9
Weekday midday 75.7 75.6 N/A 77.7 OS-4 Furman St., opposite end Cranberry St. Weekday PM 74.1 73.7 N/A 76.1
Weekday midday 63.0 62.0 N/A 65.0 OS-5
Brooklyn Heights Promenade opposite Pier 2 Weekend midday 63.2 63.2 N/A 65.2
OS-6 Remsen St., near Brooklyn Heights Promenade Weekend midday 72.1 72.2 N/A 74.1
OS-7 Atlantic Ave. and Furman St. Weekend midday 64.7 64.9 N/A 66.7 OPS-1 John St. and Adams St. Weekday PM 76.0 63.3 76.7 80.0
OPS-2 Main Street Park, near playground Weekend midday 74.5 64.3 75.2 78.5
Weekday midday 67.7 64.7 68.2 71.7 OPS-3 Empire Fulton-Ferry State Park Weekday PM 66.9 63.9 67.4 70.9
OPS-7 Pier 2, 150 ft from Brooklyn Queens Expressway Weekday midday 74.7 74.7 N/A 76.7
OPS-8 Pier 2, 260 ft from Brooklyn Queens Expressway Weekday midday 73.5 73.5 N/A 75.5
Brooklyn Bridge Park FEIS
17-12
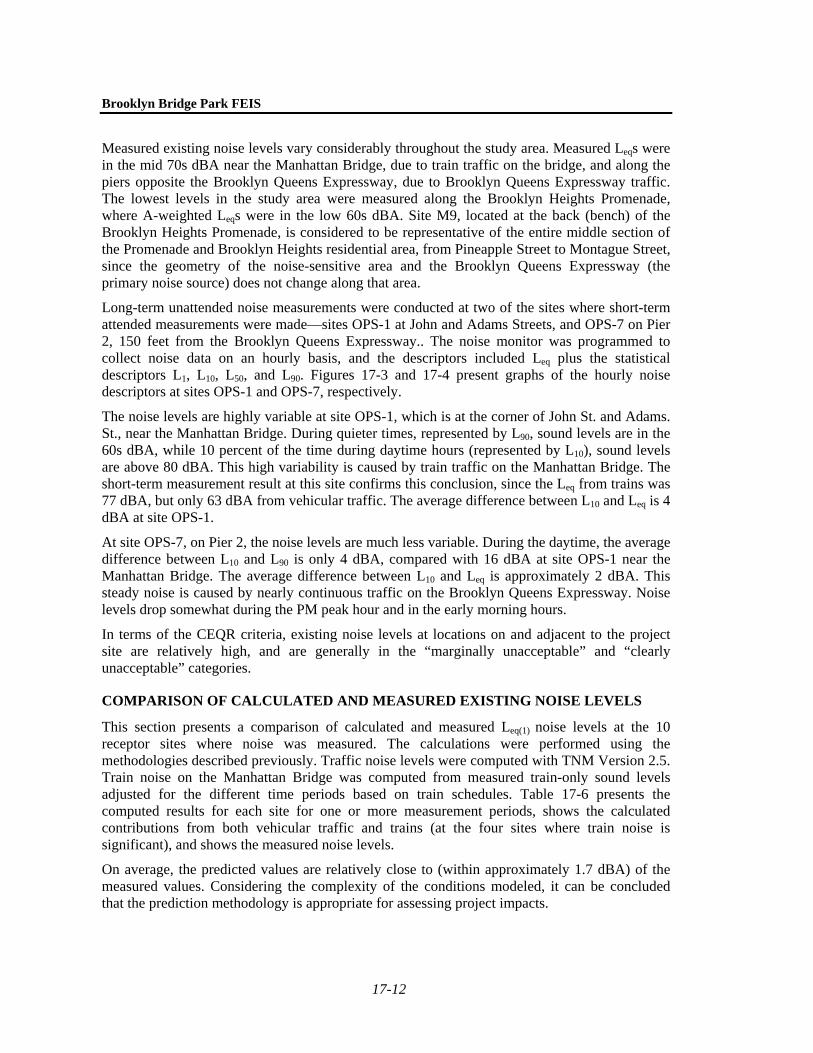
Measured existing noise levels vary considerably throughout the study area. Measured Leqs were in the mid 70s dBA near the Manhattan Bridge, due to train traffic on the bridge, and along the piers opposite the Brooklyn Queens Expressway, due to Brooklyn Queens Expressway traffic. The lowest levels in the study area were measured along the Brooklyn Heights Promenade, where A-weighted Leqs were in the low 60s dBA. Site M9, located at the back (bench) of the Brooklyn Heights Promenade, is considered to be representative of the entire middle section of the Promenade and Brooklyn Heights residential area, from Pineapple Street to Montague Street, since the geometry of the noise-sensitive area and the Brooklyn Queens Expressway (the primary noise source) does not change along that area.
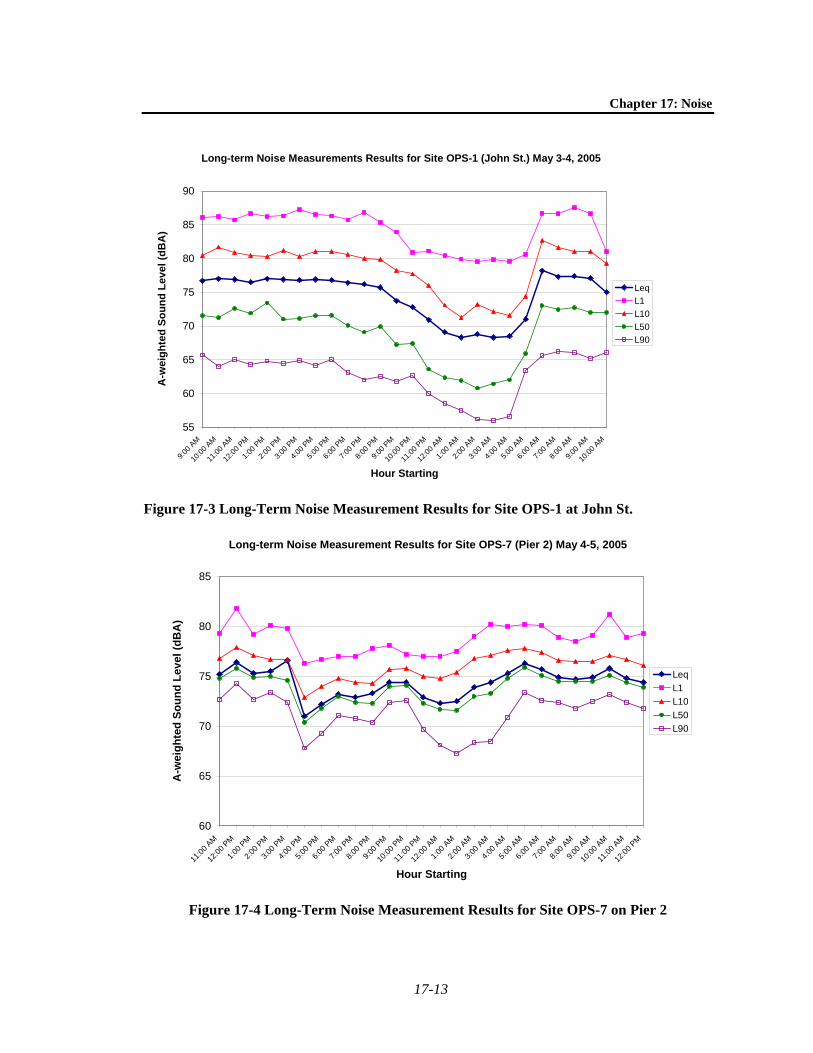
Long-term unattended noise measurements were conducted at two of the sites where short-term attended measurements were made—sites OPS-1 at John and Adams Streets, and OPS-7 on Pier 2, 150 feet from the Brooklyn Queens Expressway.. The noise monitor was programmed to collect noise data on an hourly basis, and the descriptors included Leq plus the statistical descriptors L1, L10, L50, and L90. Figures 17-3 and 17-4 present graphs of the hourly noise descriptors at sites OPS-1 and OPS-7, respectively.
The noise levels are highly variable at site OPS-1, which is at the corner of John St. and Adams. St., near the Manhattan Bridge. During quieter times, represented by L90, sound levels are in the 60s dBA, while 10 percent of the time during daytime hours (represented by L10), sound levels are above 80 dBA. This high variability is caused by train traffic on the Manhattan Bridge. The short-term measurement result at this site confirms this conclusion, since the Leq from trains was 77 dBA, but only 63 dBA from vehicular traffic. The average difference between L10 and Leq is 4 dBA at site OPS-1.
At site OPS-7, on Pier 2, the noise levels are much less variable. During the daytime, the average difference between L10 and L90 is only 4 dBA, compared with 16 dBA at site OPS-1 near the Manhattan Bridge. The average difference between L10 and Leq is approximately 2 dBA. This steady noise is caused by nearly continuous traffic on the Brooklyn Queens Expressway. Noise levels drop somewhat during the PM peak hour and in the early morning hours.
In terms of the CEQR criteria, existing noise levels at locations on and adjacent to the project site are relatively high, and are generally in the “marginally unacceptable” and “clearly unacceptable” categories.
COMPARISON OF CALCULATED AND MEASURED EXISTING NOISE LEVELS
This section presents a comparison of calculated and measured Leq(1) noise levels at the 10 receptor sites where noise was measured. The calculations were performed using the methodologies described previously. Traffic noise levels were computed with TNM Version 2.5. Train noise on the Manhattan Bridge was computed from measured train-only sound levels adjusted for the different time periods based on train schedules. Table 17-6 presents the computed results for each site for one or more measurement periods, shows the calculated contributions from both vehicular traffic and trains (at the four sites where train noise is significant), and shows the measured noise levels.
On average, the predicted values are relatively close to (within approximately 1.7 dBA) of the measured values. Considering the complexity of the conditions modeled, it can be concluded that the prediction methodology is appropriate for assessing project impacts.
Chapter 17: Noise
17-13
Long-term Noise Measurements Results for Site OPS-1 (John St.) May 3-4, 2005
55
60
65
70
75
80
85
90
9:00 A
M
10:00
AM
11:00
AM
12:00
PM
1:00 P
M
2:00 P
M
3:00 P
M
4:00 P
M
5:00 P
M
6:00 P
M
7:00 P
M
8:00 P
M
9:00 P
M
10:00
PM
11:00
PM
12:00
AM
1:00 A
M
2:00 A
M
3:00 A
M
4:00 A
M
5:00 A
M
6:00 A
M
7:00 A
M
8:00 A
M
9:00 A
M
10:00
AM
Hour Starting
A-w
eigh
ted
Soun
d Le
vel (
dBA
)
LeqL1L10L50L90
Figure 17-3 Long-Term Noise Measurement Results for Site OPS-1 at John St.
Long-term Noise Measurement Results for Site OPS-7 (Pier 2) May 4-5, 2005
60
65
70
75
80
85
11:00
AM
12:00
PM
1:00 P
M
2:00 P
M
3:00 P
M
4:00 P
M
5:00 P
M
6:00 P
M
7:00 P
M
8:00 P
M
9:00 P
M
10:00
PM
11:00
PM
12:00
AM
1:00 A
M
2:00 A
M
3:00 A
M
4:00 A
M
5:00 A
M
6:00 A
M
7:00 A
M
8:00 A
M
9:00 A
M
10:00
AM
11:00
AM
12:00
PM
Hour Starting
A-w
eigh
ted
Soun
d Le
vel (
dBA
)
LeqL1L10L50L90
Figure 17-4 Long-Term Noise Measurement Results for Site OPS-7 on Pier 2

Brooklyn Bridge Park FEIS
17-14
Table 17-6Existing Leq(1) Noise Levels—Calculated (with Source Contributions)
and Measured Values in dBA
Site No. Location Time Period
Predicted Traffic
Only Leq(1)
Predicted Train Only
Leq(1) Predicted Total Leq(1)
Measured Total Leq(1)
OS-1 Jay St. and John St. Weekday midday 61.2 70.3 70.8 67.5
OS-2 Old Fulton and Furman St. Weekend midday 66.3 N/A 66.3 66.9
Weekday midday 74.0 N/A 74.0 75.7 OS-4 Furman St., opposite end Cranberry St. Weekday PM 74.9 N/A 74.9 74.1
Weekday midday 62.5 N/A 62.5 63.0 OS-5
Brooklyn Heights Promenade opposite Pier 2 Weekend midday 62.4 N/A 62.4 63.2
OS-6 Remsen St., near Brooklyn Heights Promenade
Weekend midday 70.0 N/A 70.0 72.1
OS-7 Atlantic Ave. and Furman St. Weekend midday 66.4 N/A 66.4 64.7
OPS-1 John St. and Adams St. Weekday PM 65.4 76.9 77.2 76.0
OPS-2 Main Street Park, near playground Weekend midday 67.1 73.7 74.6 74.5
Weekday midday 63.1 69.0 70.0 67.7 OPS-3 Empire Fulton-Ferry State Park Weekday PM 62.9 70.2 70.9 66.9
OPS-7 Pier 2, 150 ft from Brooklyn Queens Expressway
Weekday midday 75.7 N/A 75.7 74.7
OPS-8 Pier 2, 260 ft from Brooklyn Queens Expressway
Weekday midday 73.0 N/A 73.0 73.5
E. THE FUTURE WITHOUT THE PROPOSED PROJECT This section presents the future 2012 No Build noise levels at the seven off-site receptor sites, computed for the three evaluated time periods. Traffic noise levels were computed with TNM Version 2.5, and, as for existing conditions, train noise on the Manhattan Bridge was computed from measured train-only sound levels adjusted for the different time periods based on train schedules.
Table 17-7 presents computed Leq(1) noise levels for No Build conditions at all of the off-site receptor sites for each time period. The table also presents for comparison purposes the existing Leq(1) noise levels and the differences between No Build and existing Leq(1) noise levels. The predicted changes in noise levels between existing and No Build conditions are small, and reflect the small change in traffic volumes between 2005 and 2012. The decrease in predicted noise levels at some locations is due to changes in traffic resulting from Furman Street changing from a one-way to a two-way street. The largest computed increase is less than 1.5 dBA. This is an imperceptible increase.
In terms of the CEQR criteria, future No Build noise levels (similar to existing noise levels) at all of the off-site receptor sites would be relatively high, and would be generally in the “marginally unacceptable” and “clearly unacceptable” categories.

Chapter 17: Noise
17-15
Table 17-7Predicted 2012 No Build Noise Levels, Compared with Existing Noise Levels
Site No. Location Time Period
Predicted Existing Leq(1)
Levels
Predicted No- Build Leq(1)
Levels
Increase in Leq(1) Levels (No Build minus Existing)
Weekday midday 70.8 70.8 0.0 Weekday PM 71.8 71.9 0.1 OS-1 Jay St. and John St. Weekend midday 70.4 70.4 0.0 Weekday midday 66.8 65.2 -1.6 Weekday PM 70.6 70.0 -0.6 OS-2 Old Fulton and Furman St. Weekend midday 66.3 63.6 -2.7 Weekday midday 76.0 76.0 0.0 Weekday PM 76.6 77.5 0.9 OS-3 Squibb Park Weekend midday 75.8 75.7 -0.1 Weekday midday 74.0 73.9 -0.1 Weekday PM 74.9 76.2 1.3 OS-4 Furman St. opposite end
Cranberry St. Weekend midday 73.8 73.5 -0.3 Weekday midday 62.5 62.6 0.1 Weekday PM 62.6 62.9 0.3 OS-5 Brooklyn Heights Promenade
opposite Pier 2 Weekend midday 62.4 62.5 0.1 Weekday midday 70.1 70.1 0.0 Weekday PM 69.7 70.9 1.2 OS-6 Remsen St., near Brooklyn
Heights Promenade Weekend midday 70.0 70.0 0.0 Weekday midday 66.6 66.8 0.2 Weekday PM 67.7 68.6 0.9 OS-7 Atlantic Ave., near
Furman St. Weekend midday 66.4 66.3 -0.1
F. THE FUTURE WITH THE PROPOSED PROJECT
NOISE LEVELS AT RECEPTOR SITES
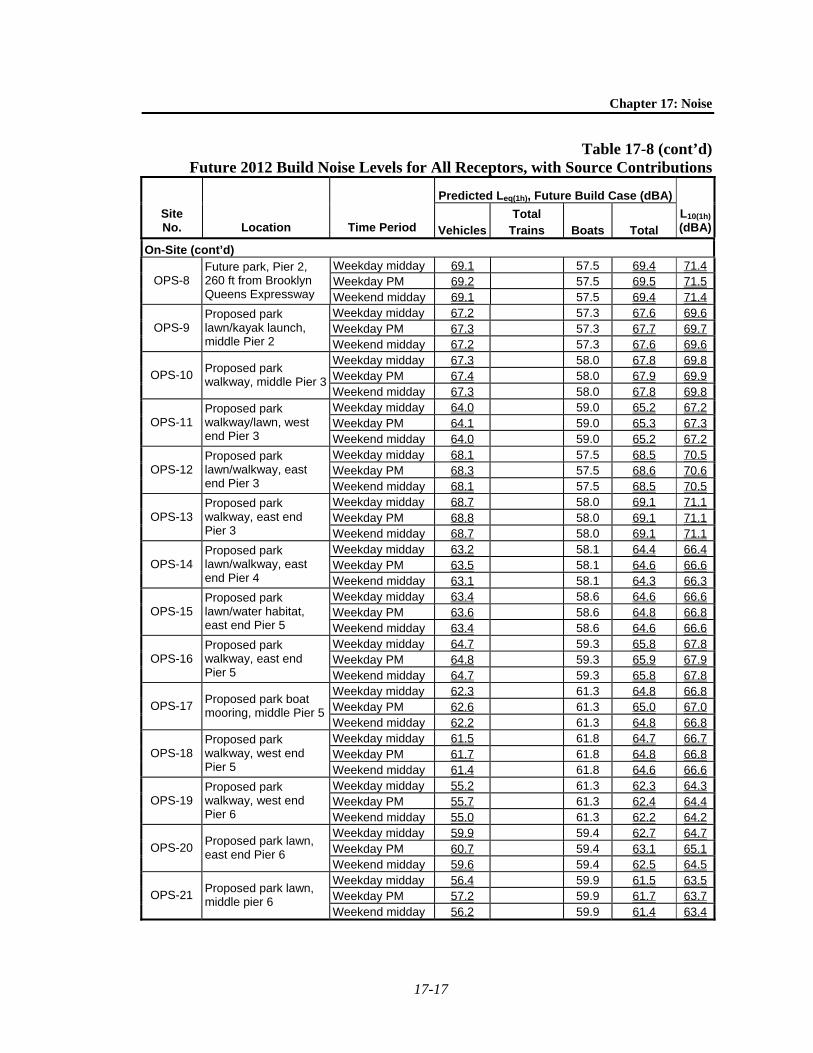
This section presents the future 2012 Build noise conditions at all 28 receptor sites (i.e., both the seven off-site and 21 on-project-site receptors) computed for the three evaluated time periods. Noise levels for each of the four contributing sources—traffic, trains, and boating activities—were computed according to the methods described above in “Noise Prediction/Assessment Methodology.” Table 17-8 presents the computed results for the 2012 Build conditions at all sites for each time period and shows the Leq(1) contributions from each source where those contributions would be significant. Total Leq(1) and L10(1) values are shown.
Noise levels at receptor sites within the park include the effects of the hills that would be located along Furman Street between Piers 2 and 5.
At the four sites north of the Brooklyn Bridge (sites OS-1 and OPS1-3), noise from the train traffic on the Manhattan Bridge dominates the computed Leq. Vehicular traffic noise would dominate the future noise environment throughout much of the study area, including the proposed park areas. Exceptions would be at site OPS-5 on Pier 1 where the peak usage boat noise Leq is projected to be slightly higher than the contribution from vehicles, and on Pier 6 (sites OPS-19 and OPS-21), much of which is shielded from Brooklyn Queens Expressway traffic noise by the building at 360 Furman Street.

Brooklyn Bridge Park FEIS
17-16
Table 17-8 Future 2012 Build Noise Levels for All Receptors, with Source Contributions
Predicted Leq(1), Future Build Case (dBA) Site No. Location Time Period Vehicles
Total Trains Boats Total
L10(1) (dBA)
Off-Site Weekday midday 61.4 70.3 70.8 74.8Weekday PM 61.4 71.5 71.9 75.9OS-1 Residential, corner
Jay St. and John St. Weekend midday 61.4 69.8 70.4 74.4Weekday midday 67.0 67.0 69.0Weekday PM 70.5 70.5 72.5OS-2
Residential, corner Old Fulton and Furman St. Weekend midday 65.6 65.6 67.6
Weekday midday 76.2 76.2 78.2Weekday PM 77.6 77.6 79.6OS-3 Squibb Park Weekend midday 76.0 76.0 78.0Weekday midday 74.3 74.3 76.3Weekday PM 76.4 76.4 78.4OS-4
Proposed Pier 1 residential/hotel, along Furman St. Weekend midday 73.9 73.9 75.9
Weekday midday 62.6 56.9 63.6 65.6Weekday PM 63.0 56.9 64.0 66.0OS-5
Bench, back of Brooklyn Promenade opposite Pier 2 Weekend midday 62.6 56.9 63.6 65.6
Weekday midday 70.3 57.7 70.5 72.5Weekday PM 71.0 57.7 71.2 73.2OS-6 End Remsen St., near
Brooklyn Promenade Weekend midday 70.1 57.7 70.3 72.3Weekday midday 67.3 58.2 67.8 69.8Weekday PM 68.9 58.2 69.3 71.3OS-7
Proposed residential, Atlantic Ave., near Furman St. Weekend midday 66.9 58.2 67.4 69.4
On-Site Weekday midday 67.8 75.7 76.4 80.4Weekday PM 67.9 76.9 77.4 81.4OPS-1
Proposed residential, John St. near Adams St. Weekend midday 67.8 75.3 76.0 80.0
Weekday midday 67.2 74.2 75.0 79.0Weekday PM 67.2 75.3 75.9 79.9OPS-2 Existing Main Street
Park, near playground Weekend midday 67.2 73.7 74.6 78.6Weekday midday 63.3 69.0 70.0 74.0Weekday PM 63.5 70.2 71.0 75.0OPS-3 Empire Fulton-Ferry
State Park, benches Weekend midday 63.2 68.5 69.6 73.6Weekday midday 62.5 61.4 65.0 67.0Weekday PM 63.5 61.4 65.6 67.6OPS-4 Fulton Ferry Landing Weekend midday 62.3 61.4 64.9 66.9Weekday midday 60.4 62.3 64.5 66.5Weekday PM 61.6 62.3 65.0 67.0OPS-5 Proposed park lawn,
Pier 1 Weekend midday 60.1 62.3 64.3 66.3Weekday midday 60.1 56.6 61.7 63.7Weekday PM 60.6 56.6 62.1 64.1OPS-6
Proposed park lawn, Pier 1, public gathering Weekend midday 60.0 56.6 61.6 63.6
Weekday midday 65.3 57.5 66.0 68.0Weekday PM 65.7 57.5 66.3 68.3OPS-7
Future park, Pier 2, 150 ft from Brooklyn Queens Expressway Weekend midday 65.3 57.5 66.0 68.0
Chapter 17: Noise
17-17
Table 17-8 (cont’d) Future 2012 Build Noise Levels for All Receptors, with Source Contributions
Predicted Leq(1h), Future Build Case (dBA)Site No. Location Time Period Vehicles
Total Trains Boats Total
L10(1h)(dBA)
On-Site (cont’d) Weekday midday 69.1 57.5 69.4 71.4Weekday PM 69.2 57.5 69.5 71.5OPS-8
Future park, Pier 2, 260 ft from Brooklyn Queens Expressway Weekend midday 69.1 57.5 69.4 71.4
Weekday midday 67.2 57.3 67.6 69.6Weekday PM 67.3 57.3 67.7 69.7OPS-9
Proposed park lawn/kayak launch, middle Pier 2 Weekend midday 67.2 57.3 67.6 69.6
Weekday midday 67.3 58.0 67.8 69.8Weekday PM 67.4 58.0 67.9 69.9OPS-10 Proposed park
walkway, middle Pier 3 Weekend midday 67.3 58.0 67.8 69.8Weekday midday 64.0 59.0 65.2 67.2Weekday PM 64.1 59.0 65.3 67.3OPS-11
Proposed park walkway/lawn, west end Pier 3 Weekend midday 64.0 59.0 65.2 67.2
Weekday midday 68.1 57.5 68.5 70.5Weekday PM 68.3 57.5 68.6 70.6OPS-12
Proposed park lawn/walkway, east end Pier 3 Weekend midday 68.1 57.5 68.5 70.5
Weekday midday 68.7 58.0 69.1 71.1Weekday PM 68.8 58.0 69.1 71.1OPS-13
Proposed park walkway, east end Pier 3 Weekend midday 68.7 58.0 69.1 71.1
Weekday midday 63.2 58.1 64.4 66.4Weekday PM 63.5 58.1 64.6 66.6OPS-14
Proposed park lawn/walkway, east end Pier 4 Weekend midday 63.1 58.1 64.3 66.3
Weekday midday 63.4 58.6 64.6 66.6Weekday PM 63.6 58.6 64.8 66.8OPS-15
Proposed park lawn/water habitat, east end Pier 5 Weekend midday 63.4 58.6 64.6 66.6
Weekday midday 64.7 59.3 65.8 67.8Weekday PM 64.8 59.3 65.9 67.9OPS-16
Proposed park walkway, east end Pier 5 Weekend midday 64.7 59.3 65.8 67.8
Weekday midday 62.3 61.3 64.8 66.8Weekday PM 62.6 61.3 65.0 67.0OPS-17 Proposed park boat
mooring, middle Pier 5 Weekend midday 62.2 61.3 64.8 66.8Weekday midday 61.5 61.8 64.7 66.7Weekday PM 61.7 61.8 64.8 66.8OPS-18
Proposed park walkway, west end Pier 5 Weekend midday 61.4 61.8 64.6 66.6
Weekday midday 55.2 61.3 62.3 64.3Weekday PM 55.7 61.3 62.4 64.4OPS-19
Proposed park walkway, west end Pier 6 Weekend midday 55.0 61.3 62.2 64.2
Weekday midday 59.9 59.4 62.7 64.7Weekday PM 60.7 59.4 63.1 65.1OPS-20 Proposed park lawn,
east end Pier 6 Weekend midday 59.6 59.4 62.5 64.5Weekday midday 56.4 59.9 61.5 63.5Weekday PM 57.2 59.9 61.7 63.7OPS-21 Proposed park lawn,
middle pier 6 Weekend midday 56.2 59.9 61.4 63.4

Brooklyn Bridge Park FEIS
17-18
Sound levels from crowds gathered in the proposed park for public events were also evaluated. However, these noise levels are not included in the tables due to uncertainty in the locations and frequency of any such gatherings, and because absent an unusual event, crowd noise is not expected to be significant. As described above in “Noise Prediction/Assessment Methodology,” momentary maximum sound levels may reach 75 dBA at a distance of 300 feet from a group of 200 people, all cheering. This could be clearly audible above the background noise levels at, for example, the back of the residential/hotel buildings proposed at Pier 1. These buildings would be located approximately 300 feet from the center of the proposed raised lawn area on Pier 1, where informal performances may be held (near site OPS-6). Background Leq on the west side of these buildings is expected to be in the low 60s dBA, which is comparable to the predicted levels at sites OPS-5 and OPS-6 on the public gathering lawn.
In terms of the CEQR criteria, similar to future No Build noise levels, future Build noise levels at locations on and adjacent to the project site would be relatively high and would be generally in the “marginally unacceptable” and “clearly unacceptable” categories.
IMPACT ASSESSMENT
For off-site locations, Table 17-9 compares the computed total noise levels for Build and No Build conditions at the seven off-site receptor sites. At all off-site receptor locations, the increase in Leq(1) noise levels as a result of the proposed project, for all time periods analyzed, would be 2.0 dBA or less. Increases of this magnitude are imperceptible and are below the CEQR impact criteria. Therefore, the proposed project would not cause any significant noise impacts at the seven off-site locations.
Regarding on-project-site locations where park use is proposed, noise levels would be above the 55 dBA L10(1) noise level for outdoor areas requiring serenity and quiet contained in the CEQR noise exposure guidelines (Table 17-2). While the noise levels at on-site locations reflect noise from both off-site and on-project-site sources (including boating activities, etc.), the high predicted noise levels result principally from the relatively high noise levels from various off-site sources—i.e., traffic on the Brooklyn Queens Expressway, traffic on the Brooklyn Bridge, traffic and trains on the Manhattan Bridge, etc. Noise from these roadway and bridge sources pre-date park and/or residential uses in this area, and these roadways and bridges were not designed with consideration of park and/or residential land uses (i.e., they were designed when the area had industrial land uses and noise was not a significant concern). The on-site entries in Table 17-8 show calculated maximum Leq(1) and L10(1) noise levels—based on the results of the weekday midday, weekday PM, and weekend midday analysis periods—at the on-project-site receptor locations. At all of the on-site locations shown, the L10(1) noise levels would exceed 55 dBA. Therefore, based on CEQR criteria, the ambient noise levels would result in a potentially significant noise impact on users of the new park.
In recognition of high noise levels in the area, the proposed park would include hills along the uplands between Pier 2 and Pier 5.

Chapter 17: Noise
17-19
Table 17-92012 Build Noise Levels, Compared with No Build Noise Levels at
Off-Site Receptor Locations
Site No. Location Time Period
Predicted Leq(1h), No Build Case (dBA)
Predicted Leq(1h), Build Case
(dBA)
Increase in Noise Levels, Build Minus No
Build Case (dB) Weekday midday 70.8 70.8 0.0 Weekday PM 71.9 71.9 0.0 OS-1 Residential, corner Jay St. and
John St Weekend midday 70.4 70.4 0.0 Weekday midday 65.2 67.0 1.8 Weekday PM 70.0 70.5 0.5 OS-2
Residential, corner Old Fulton St. and Furman St. and an outdoor sitting area Weekend midday 63.6 65.6 2.0
Weekday midday 76.0 76.2 0.2 Weekday PM 77.5 77.6 0.1 OS-3 Squibb Park Weekend midday 75.7 76.0 0.3 Weekday midday 73.9 74.3 0.4 Weekday PM 76.2 76.4 0.2 OS-4
Proposed Pier 1 residential/hotel, along Furman St. Weekend midday 73.5 73.9 0.4
Weekday midday 62.6 63.6 1.0 Weekday PM 62.9 64.0 1.1 OS-5 Bench, back of Brooklyn
Promenade opposite Pier 2 Weekend midday 62.5 63.6 1.1 Weekday midday 70.1 70.5 0.4 Weekday PM 70.9 71.2 0.3 OS-6 End Remsen St., near
Brooklyn Promenade Weekend midday 70.0 70.3 0.3 Weekday midday 66.8 67.8 1.0 Weekday PM 68.6 69.3 0.7 OS-7 Proposed residential, Atlantic
Ave., near Furman St. Weekend midday 66.3 67.4 1.1
These hills were acoustically designed and located to shield park areas from the noise from the Brooklyn-Queens Expressway and Furman Street. As a result, within the park the Build condition is notably quieter than the No Build condition. More specifically, these hills provide up to 10 dBA noise reduction at the river side of the hill between Piers 2 and 5. Park locations just outboard of the hills receive the greatest noise reduction: 9 to 10 dBA reduction at sites OPS-7, OPS-14, and OPS-15. Park locations somewhat farther away toward the river (the bulkhead area) receive an intermediate noise reduction: 4 to 5 dBA reduction at sites OPS-12 and OPS-13. Park locations on the piers receive the least noise reduction: 2 to 5 dBA reduction at sites OPS-8, OPS-9, OPS-10, OPS-11, OPS-16, OPS-17, and OPS-18. Even that smaller reduction will be a noticeable improvement, compared to the absence of these earth hills.
The hills would not cause increases in noise levels along the Brooklyn Heights Promenade and nearby residences due to reflected sound. In addition, they are designed to avoid degrading air quality within the park and along Furman Street.
There are no additional practical and feasible mitigation measures that could be implemented to reduce noise levels within the park to below the 55 dBA L10(1) guideline noise level. While noise levels in the park would be above the 55 dBA L10(1) guideline noise level, they would be less than or comparable to noise levels in a number of existing parks in New York City that are also located adjacent to heavily trafficked roadway, including Central Park, Hudson River Park, Riverside Park, and Empire-Fulton Ferry State Park, which is already within the area of the proposed project. While 55 dBA L10(1) is a worthwhile goal for outdoor areas requiring serenity and quiet, due to the level of activity present at most New York City parks, except for park areas far away from traffic and other typical urban activities, this relatively low noise level is often not achieved.
Brooklyn Bridge Park FEIS
17-20
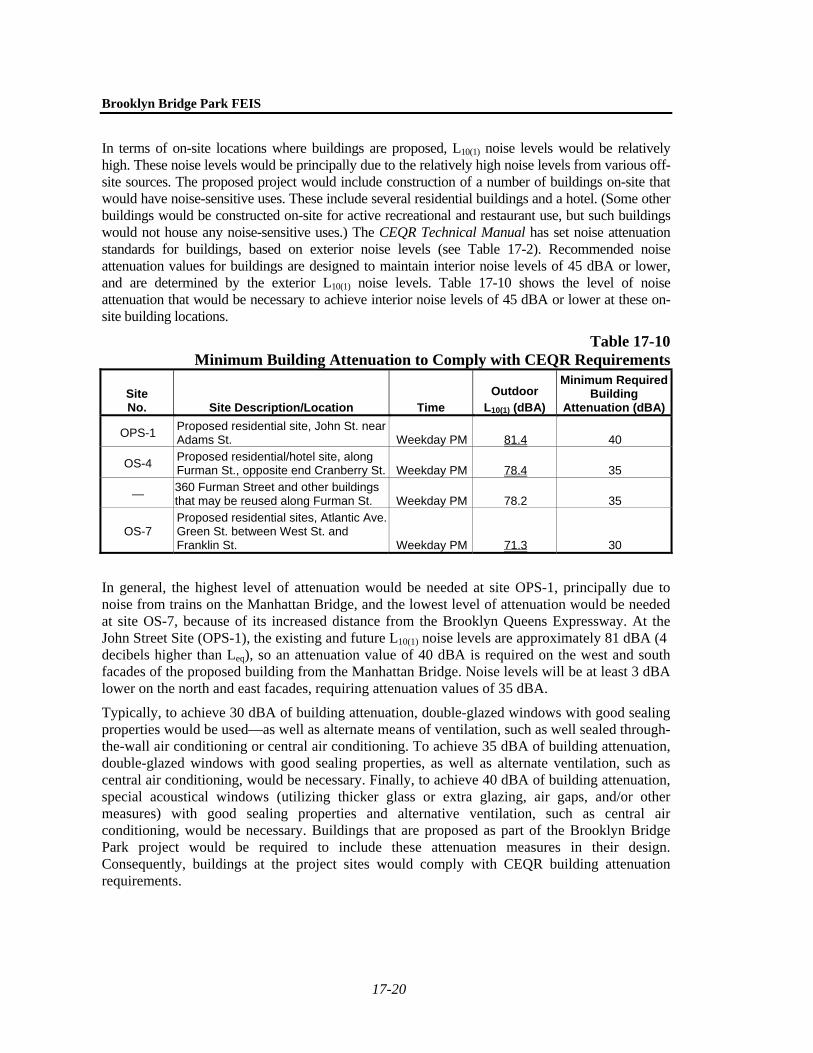
In terms of on-site locations where buildings are proposed, L10(1) noise levels would be relatively high. These noise levels would be principally due to the relatively high noise levels from various off-site sources. The proposed project would include construction of a number of buildings on-site that would have noise-sensitive uses. These include several residential buildings and a hotel. (Some other buildings would be constructed on-site for active recreational and restaurant use, but such buildings would not house any noise-sensitive uses.) The CEQR Technical Manual has set noise attenuation standards for buildings, based on exterior noise levels (see Table 17-2). Recommended noise attenuation values for buildings are designed to maintain interior noise levels of 45 dBA or lower, and are determined by the exterior L10(1) noise levels. Table 17-10 shows the level of noise attenuation that would be necessary to achieve interior noise levels of 45 dBA or lower at these on-site building locations.
\Table 17-10 Minimum Building Attenuation to Comply with CEQR Requirements
Site No. Site Description/Location Time
Outdoor L10(1) (dBA)
Minimum Required Building
Attenuation (dBA)
OPS-1 Proposed residential site, John St. near Adams St. Weekday PM 81.4 40
OS-4 Proposed residential/hotel site, along Furman St., opposite end Cranberry St. Weekday PM 78.4 35
— 360 Furman Street and other buildings that may be reused along Furman St. Weekday PM 78.2 35
OS-7 Proposed residential sites, Atlantic Ave. Green St. between West St. and Franklin St. Weekday PM 71.3 30
In general, the highest level of attenuation would be needed at site OPS-1, principally due to noise from trains on the Manhattan Bridge, and the lowest level of attenuation would be needed at site OS-7, because of its increased distance from the Brooklyn Queens Expressway. At the John Street Site (OPS-1), the existing and future L10(1) noise levels are approximately 81 dBA (4 decibels higher than Leq), so an attenuation value of 40 dBA is required on the west and south facades of the proposed building from the Manhattan Bridge. Noise levels will be at least 3 dBA lower on the north and east facades, requiring attenuation values of 35 dBA.
Typically, to achieve 30 dBA of building attenuation, double-glazed windows with good sealing properties would be used—as well as alternate means of ventilation, such as well sealed through-the-wall air conditioning or central air conditioning. To achieve 35 dBA of building attenuation, double-glazed windows with good sealing properties, as well as alternate ventilation, such as central air conditioning, would be necessary. Finally, to achieve 40 dBA of building attenuation, special acoustical windows (utilizing thicker glass or extra glazing, air gaps, and/or other measures) with good sealing properties and alternative ventilation, such as central air conditioning, would be necessary. Buildings that are proposed as part of the Brooklyn Bridge Park project would be required to include these attenuation measures in their design. Consequently, buildings at the project sites would comply with CEQR building attenuation requirements.

Chapter 17: Noise
17-21
JORALEMON STREET OPEN
An analysis was also performed to examine noise impacts with a scenario which has Joralemon Street remaining open with the project. (Consistent with the traffic analysis, the preceding impact studies presented in this section assumed that for Build conditions, Joralemon Street would be closed to traffic at Furman Street, while remaining open to pedestrians.)
As part of this additional analysis, existing noise levels were measured at two locations on Joralemon Street. Noise levels were measured for a total of 40 minutes in two 20-minute periods at each site for each time of day. Site A was located on Joralemon Street between Hicks Street and Willow Street Place, and Site B was located on Joralemon Street at the corner of Columbia Place. Noise levels at Site B were dominated by traffic on the Brooklyn Queens Expressway, while noise levels at Site A were dominated by traffic on Joralemon Street. Table 17-11 shows the average measured Leq and L10 sound levels at each site for each of the three analysis time periods.
Table 17-11Noise Measurements for Joralemon Street
Site No. Location Time Period
Measured Leq (dBA)
Measured L10 (dBA)
Weekday midday 60.6 62.7 Weekday PM 59.7 62.4 A Joralemon Street between
Hicks Street and Willow Street Weekend midday 59.0 60.5 Weekday midday 66.1 68.0 Weekday PM 63.1 65.1 B Joralemon Street at the corner
of Columbia Place Weekend midday 63.9 65.7
Note: Noise measurements conducted by AKRF, Inc. on June 25th, and June 28th, 2005.
The Traffic Noise Model (TNM) was used to compute noise levels for the analysis of this scenario, including noise at the two receptor sites along Joralemon Street. TNM modeled noise levels, on average, were within approximately 1 dBA of the measured noise levels at the two Joralemon Street sites and, consequently, the TNM modeled noise levels were used at this site to assess project impacts.
Table 17-12 shows calculated noise levels at the two Joralemon Street receptor sites for existing, No Build, and Build conditions accounting for Joralemon Street remaining open.
Increases in noise level at both receptor sites along Joralemon Street from the proposed project would be less than 1 dBA. Increases of this magnitude would not be perceptible, would be below the CEQR noise impact criteria, and would not be significant.
Regarding other off-site locations, the scenario with Joralemon Street open would not have a significant effect on noise levels. In general, this scenario would change noise levels by a maximum of approximately 0.2 dBA. Outside the park, the proposed project, both with Joralemon Street open and closed, would result in a significant noise impact only at site OS-2, which is located at the corner of Old Fulton Street and Furman Street. In both scenarios, traffic increases on both Old Fulton and Furman Streets would cause significant noise increases at this location, and there are no feasible mitigation measures that could be implemented to reduce and eliminate this project impact.

Brooklyn Bridge Park FEIS
17-22
Table 17-12Calculated Leq Noise Levels at Receptor Sites on Joralemon Street
Site No. Location Time Period
Existing Leq Noise Levels
No Build
Leq Noise Levels
Build Leq Noise Levels
Increase in Leq Levels (Build minus
No-Build)
Weekday midday 59.2 59.2 59.5 0.3 Weekday PM 59.1 59.1 59.3 0.2 A
Joralemon Street between Hicks Street and Willow Place
Weekend midday 58.1 58.2 58.6 0.4 Weekday midday 66.4 66.4 66.4 0.0 Weekday PM 63.7 63.7 63.8 0.1 B Joralemon Street at the
corner of Columbia Place Weekend midday 64.3 64.3 64.4 0.1
Whether Joralemon Street is open or closed would not significantly affect noise levels within the new park. Both with Joralemon Street open and closed, based upon CEQR noise criteria, ambient noise levels would cause significant noise impacts on users of the new park.
ONE-WAY FURMAN STREET
An analysis was performed to examine noise impacts with a scenario in which Furman Street remains a one-way street. Future noise levels both with and without the proposed project (i.e., for Build and No Build conditions) were calculated using the same methodologies used for analyzing conditions with Furman as a two-way street.
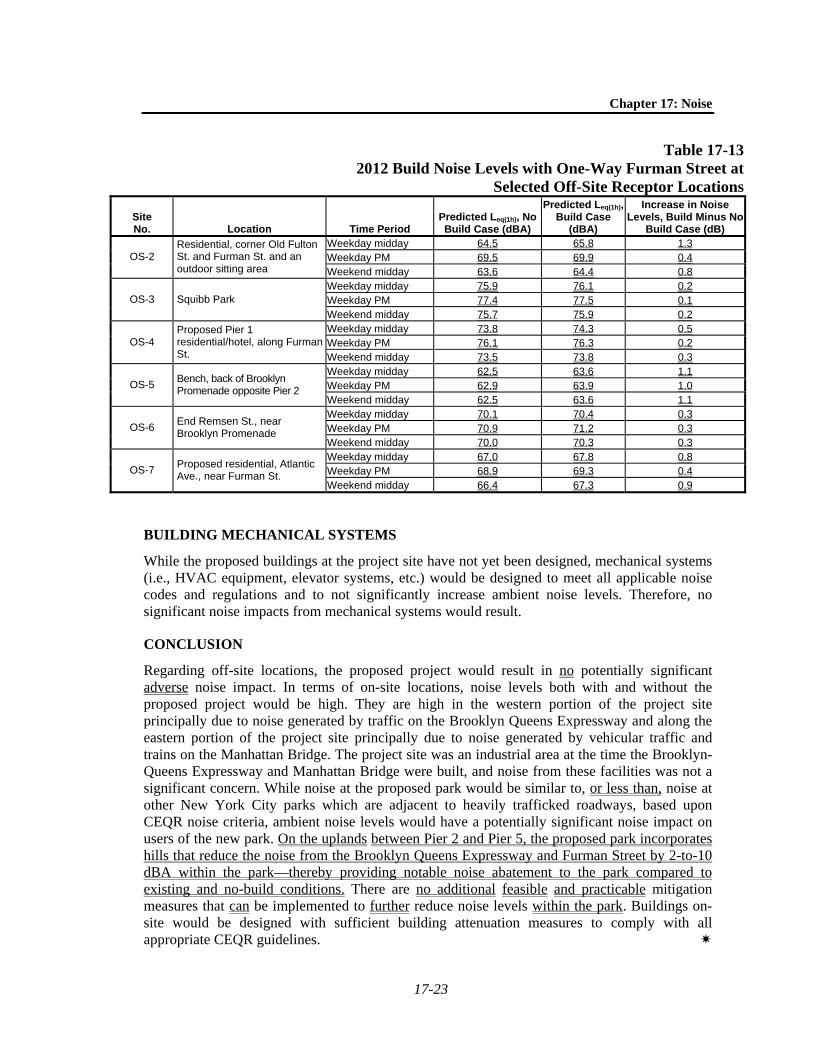
Table 17-13 shows predicted future noise levels for Build and No Build conditions at the six off-site receptor locations adjacent to Furman Street assuming Furman Street remains a one-way Street.1 Noise levels with a one-way Furman Street are slightly less than noise levels with a two-way Furman Street. In addition, the project increment with a one-way Furman Street is slightly less (i.e., a few tenths of a decibel) than the project increment with a two-way Furman Street. At all of the off-site locations, the largest increase in noise level with a one-way Furman Street would be 1.3 dBA. Increases of this magnitude would be imperceptible. Therefore, both with a one-way and a two-way Furman Street, the project would not significantly increase noise levels at off-site receptor locations.
Within the proposed park, noise levels with a one-way Furman Street would be within a few tenths of a decibel of noise levels with a two-way Furman Street. Therefore, noise levels within the proposed park, both with a one-way and two-way Furman Street, would exceed the 55 L10 CEQR noise criteria for outdoor areas requiring serenity and quiet, and the proposed project both with a one-way and two-way Furman Street would have a significant impact on users of the new park.
1 Noise levels at Receptor Site OS-1, which is located at the corner of Jay Street and John Street, would
not be affected by the one-way Furman Street, and has not been included in this reanalysis.
Chapter 17: Noise
17-23
Table 17-132012 Build Noise Levels with One-Way Furman Street at
Selected Off-Site Receptor Locations
Site No. Location Time Period
Predicted Leq(1h), No Build Case (dBA)
Predicted Leq(1h), Build Case
(dBA)
Increase in Noise Levels, Build Minus No
Build Case (dB) Weekday midday 64.5 65.8 1.3 Weekday PM 69.5 69.9 0.4 OS-2
Residential, corner Old Fulton St. and Furman St. and an outdoor sitting area Weekend midday 63.6 64.4 0.8
Weekday midday 75.9 76.1 0.2 Weekday PM 77.4 77.5 0.1 OS-3 Squibb Park Weekend midday 75.7 75.9 0.2 Weekday midday 73.8 74.3 0.5 Weekday PM 76.1 76.3 0.2 OS-4
Proposed Pier 1 residential/hotel, along Furman St. Weekend midday 73.5 73.8 0.3
Weekday midday 62.5 63.6 1.1 Weekday PM 62.9 63.9 1.0 OS-5 Bench, back of Brooklyn
Promenade opposite Pier 2 Weekend midday 62.5 63.6 1.1 Weekday midday 70.1 70.4 0.3 Weekday PM 70.9 71.2 0.3 OS-6 End Remsen St., near
Brooklyn Promenade Weekend midday 70.0 70.3 0.3 Weekday midday 67.0 67.8 0.8 Weekday PM 68.9 69.3 0.4 OS-7 Proposed residential, Atlantic
Ave., near Furman St. Weekend midday 66.4 67.3 0.9
BUILDING MECHANICAL SYSTEMS
While the proposed buildings at the project site have not yet been designed, mechanical systems (i.e., HVAC equipment, elevator systems, etc.) would be designed to meet all applicable noise codes and regulations and to not significantly increase ambient noise levels. Therefore, no significant noise impacts from mechanical systems would result.
CONCLUSION
Regarding off-site locations, the proposed project would result in no potentially significant adverse noise impact. In terms of on-site locations, noise levels both with and without the proposed project would be high. They are high in the western portion of the project site principally due to noise generated by traffic on the Brooklyn Queens Expressway and along the eastern portion of the project site principally due to noise generated by vehicular traffic and trains on the Manhattan Bridge. The project site was an industrial area at the time the Brooklyn-Queens Expressway and Manhattan Bridge were built, and noise from these facilities was not a significant concern. While noise at the proposed park would be similar to, or less than, noise at other New York City parks which are adjacent to heavily trafficked roadways, based upon CEQR noise criteria, ambient noise levels would have a potentially significant noise impact on users of the new park. On the uplands between Pier 2 and Pier 5, the proposed park incorporates hills that reduce the noise from the Brooklyn Queens Expressway and Furman Street by 2-to-10 dBA within the park—thereby providing notable noise abatement to the park compared to existing and no-build conditions. There are no additional feasible and practicable mitigation measures that can be implemented to further reduce noise levels within the park. Buildings on-site would be designed with sufficient building attenuation measures to comply with all appropriate CEQR guidelines.