chapter 14: noise and vibration...
TRANSCRIPT
14-1
Chapter 14: Noise and Vibration
A. INTRODUCTION
This chapter assesses the potential noise impacts due to operation of the Proposed Project by comparing existing noise levels with the projected future noise levels at sensitive receptors near the project site. The potential for significant vibration impacts with regard to operation of the Proposed Project is also assessed.
The analysis was conducted according to methodology set forth in a guidance manual prepared by the Federal Transportation Authority (FTA), Transit Noise and Vibration Impact Assessment, FTA-VA-90-1003-06, May 2006 as well as a manual prepared by the Federal Railroad Administration (FRA), High-Speed Ground Transportation Noise and Vibration Impact Assessment, DOT/FRA/ORD-12/15, October 2005. The FTA guidance manual is used for analysis of “conventional” rail activity (i.e., at speeds less than 125 mph), and the FRA guidance manual is used for “high speed” rail activity (i.e., at speeds of 125 mph or greater). The guidance documents set forth methodologies for analyzing noise and vibration from commuter and intercity rail operations and as such are the standard methodology for assessing potential impacts of new rail bridges and transit systems. This chapter briefly describes the methodology used and results of the analysis conducted.
As discussed in Chapter 2, “Project Alternatives,” this Environmental Assessment (EA) evaluates two Build Alternatives: Alternative 9A and Alternative 9B. Alternative 9A was selected as the Preferred Alternative.
B. NOISE FUNDAMENTALS, STANDARDS, AND IMPACT CRITERIA
AIRBORNE NOISE FUNDAMENTALS
Sound pressure levels are measured in units called “decibels” (dB). The particular character of the noise that we hear is determined by the rate, or “frequency,” at which the air pressure fluctuates, or “oscillates.” Frequency defines the oscillation of sound pressure in terms of cycles per second. One cycle per second is known as 1 Hertz (Hz). People can hear over a relatively limited range of sound frequencies, generally between 20 Hz and 20,000 Hz, and the human ear does not perceive all frequencies equally well. High frequencies are more easily discerned and therefore more intrusive than many of the lower frequencies1.
“A”-WEIGHTED SOUND LEVEL (DBA)
To bring a uniform noise measurement that simulates people’s perception of loudness and annoyance, the decibel measurement is weighted to account for those frequencies most audible to the human ear. This is known as the A-weighted sound level, or “dBA,” and because of the 1 Transit Noise and Vibration Impact Assessment, FTA-VA-90-1003-06, May 2006.
Susquehanna River Rail Bridge Project
14-2
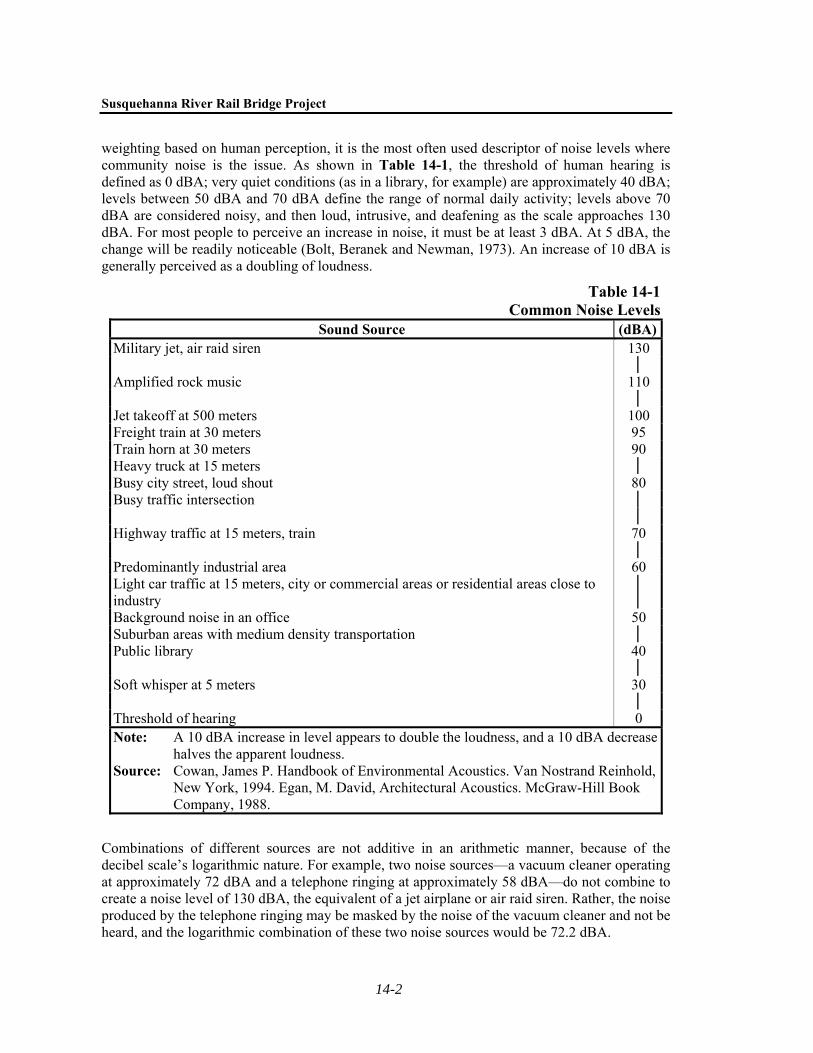
weighting based on human perception, it is the most often used descriptor of noise levels where community noise is the issue. As shown in Table 14-1, the threshold of human hearing is defined as 0 dBA; very quiet conditions (as in a library, for example) are approximately 40 dBA; levels between 50 dBA and 70 dBA define the range of normal daily activity; levels above 70 dBA are considered noisy, and then loud, intrusive, and deafening as the scale approaches 130 dBA. For most people to perceive an increase in noise, it must be at least 3 dBA. At 5 dBA, the change will be readily noticeable (Bolt, Beranek and Newman, 1973). An increase of 10 dBA is generally perceived as a doubling of loudness.
Table 14-1Common Noise Levels
Sound Source (dBA)Military jet, air raid siren 130 Amplified rock music 110 Jet takeoff at 500 meters 100 Freight train at 30 meters 95 Train horn at 30 meters 90 Heavy truck at 15 meters Busy city street, loud shout 80 Busy traffic intersection Highway traffic at 15 meters, train 70 Predominantly industrial area 60 Light car traffic at 15 meters, city or commercial areas or residential areas close to industry
Background noise in an office 50 Suburban areas with medium density transportation Public library 40 Soft whisper at 5 meters 30 Threshold of hearing 0 Note: A 10 dBA increase in level appears to double the loudness, and a 10 dBA decrease
halves the apparent loudness. Source: Cowan, James P. Handbook of Environmental Acoustics. Van Nostrand Reinhold,
New York, 1994. Egan, M. David, Architectural Acoustics. McGraw-Hill Book Company, 1988.
Combinations of different sources are not additive in an arithmetic manner, because of the decibel scale’s logarithmic nature. For example, two noise sources—a vacuum cleaner operating at approximately 72 dBA and a telephone ringing at approximately 58 dBA—do not combine to create a noise level of 130 dBA, the equivalent of a jet airplane or air raid siren. Rather, the noise produced by the telephone ringing may be masked by the noise of the vacuum cleaner and not be heard, and the logarithmic combination of these two noise sources would be 72.2 dBA.
Chapter 14: Noise and Vibration
14-3
EFFECTS OF DISTANCE ON NOISE
Noise varies with distance. For example, highway traffic 50 feet away from a receptor (such as a person listening to the noise) typically produces sound levels of approximately 70 dBA. The same highway noise measures 66 dBA at a distance of 100 feet, assuming soft ground conditions (such as grass). This decrease is known as “drop-off.” The outdoor drop-off rate for line sources, such as traffic, is a decrease of approximately 4.5 dBA (for soft ground) for every doubling of distance between the noise source and receptor. For hard ground (such as concrete), the outdoor drop-off rate is 3 dBA for line sources. Assuming soft ground, for point sources, such as amplified rock music, the outdoor drop-off rate is a decrease of approximately 7.5 dBA for every doubling of distance between the noise source and receptor (for hard ground the outdoor drop-off rate is 6 dBA for point sources).2
NOISE DESCRIPTORS USED IN IMPACT ASSESSMENT
The sound-pressure level unit of dBA describes a noise level at just one moment, but since very few noises are constant, other ways of describing noise over more extended periods have been developed. One way of describing fluctuating sound is to describe the fluctuating noise heard over a specific period as if it were a steady, unchanging sound (i.e., as if it were averaged over that time period). For this condition, a descriptor called the “equivalent sound level” (Leq) can be computed. Leq is the constant sound level that, in a given situation and period (e.g., 1 hour, denoted by Leq(1), or 24 hours, denoted as Leq(24)), conveys the same sound energy as the actual time-varying sound.
A descriptor for cumulative 24-hour exposure is the day-night average sound level, abbreviated as Ldn. This is a 24-hour measurement that accounts for the moment-to-moment fluctuations in A-weighted noise levels due to all sound sources, combined. Mathematically, the Ldn noise level is the energy average of all Leq(1) noise levels over a 24-hour period, where nighttime noise levels (10 PM to 7 AM) are increased by 10 dBA before averaging because of increased noise sensitivity during nighttime when people are typically sleeping.
Following FTA guidance, either the maximum Leq(1) sound level or the Ldn sound level is used for impact assessment, depending on land use category as described below.
VIBRATION FUNDAMENTALS
Fixed railway operations have the potential to produce high vibration levels, since railway vehicles contact a rigid steel rail with steel wheels. Train wheels rolling on the steel rails create vibration energy that is transmitted into the track support system. The amount of vibrational energy is strongly dependent on such factors as how smooth the wheels and rails are and the vehicle suspension system. The vibration of the track structure “excites” the adjacent ground, creating vibration waves that propagate through the various soil and rock strata to the foundations of nearby buildings. As the vibration propagates from the foundation through the remaining building structure, certain resonant, or natural, frequencies of various components of the building may be excited.
The effects of ground-borne vibration may include discernable movement of building floors, rattling of windows, and shaking of items on shelves or hanging on walls. In extreme cases, the vibration can cause damage to buildings. The movement of building surfaces and objects within the building can also result in a low-frequency rumble noise. The rumble is the noise radiated from the motion of the room surfaces, even when the motion itself cannot be felt. This is called ground-borne noise. 2 FTA Transit Noise and Vibration Impact Assessment, FTA-VA-90-1003-06.
Susquehanna River Rail Bridge Project
14-4
All vibration levels in this document are referenced to 1x10⁻⁶ inches per second as is recommended in the FTA guidance manual for vibration analysis. “VdB” is used for vibration decibels to reduce the potential for confusion with noise decibels.
EFFECT OF PROPAGATION PATH
Vibrations are transmitted from the source to the ground, and propagate through the ground to the receptor. Soil conditions have a strong influence on the levels of ground-borne vibration. Stiff soils, such as some clay and rock, can transmit vibrations over substantial distances. Sandy soils, wetlands, and groundwater tend to absorb movement and thus reduce vibration transmission. Because subsurface conditions vary widely, measurement of actual vibration conditions, or transfer mobility, at the site can be the most practical way to address the variability of propagation conditions3.
HUMAN RESPONSE TO VIBRATION LEVELS
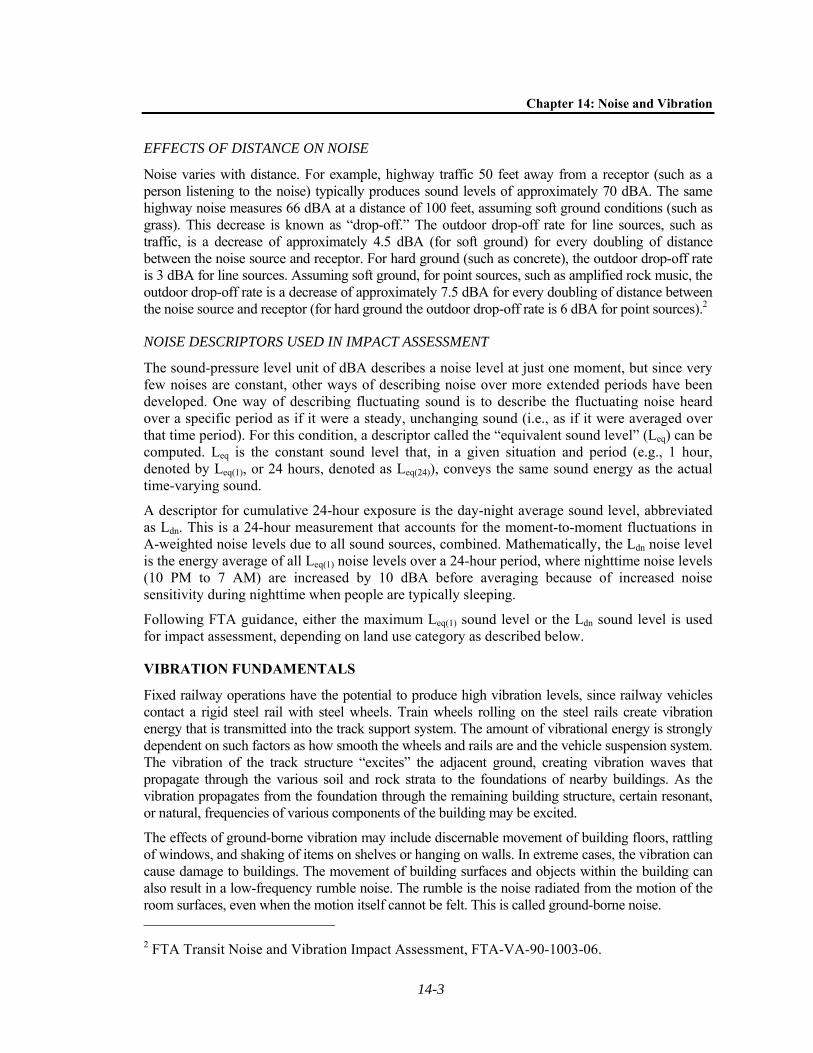
Although the perceptibility threshold for ground-borne vibration is about 65 VdB, the typical threshold of human annoyance is 72 VdB. As a comparison, buses and trucks rarely create vibration that exceeds 72 VdB unless there are significant bumps in the road, and these vehicles are operating at moderate speeds1. Vibration levels for typical human and structural responses and sources are shown in Table 14-2.
Table 14-2 Typical Levels of Ground-Borne Vibration
Human/Structural Response Velocity
Level (VdB) Typical Sources (at 50 feet)
Threshold, minor cosmetic damage fragile buildings
100 Blasting from construction projects Bulldozers and other heavy tracked
construction equipment Difficulty with vibration-sensitive tasks, such as reading a video screen
90 Locomotive powered freight train
Residential annoyance, infrequent events
80 Rapid Transit Rail, upper range Commuter Rail, typical range
Residential annoyance, frequent events
Bus or Truck over bump 70
Rapid Transit Rail, typical range
Limit for vibration-sensitive equipment. Approximate threshold for human perception of vibration
Bus or truck, typical
60
Typical background vibration 50
Source: U.S. Department of Transportation, FTA, Transit Noise and Vibration Impact Assessment, May 2006.
3 Transit Noise and Vibration Impact Assessment, FTA-VA-90-1003-06, May 2006.
Chapter 14: Noise and Vibration
14-5
NOISE STANDARDS AND CRITERIA
AIRBORNE NOISE STANDARDS AND CRITERIA
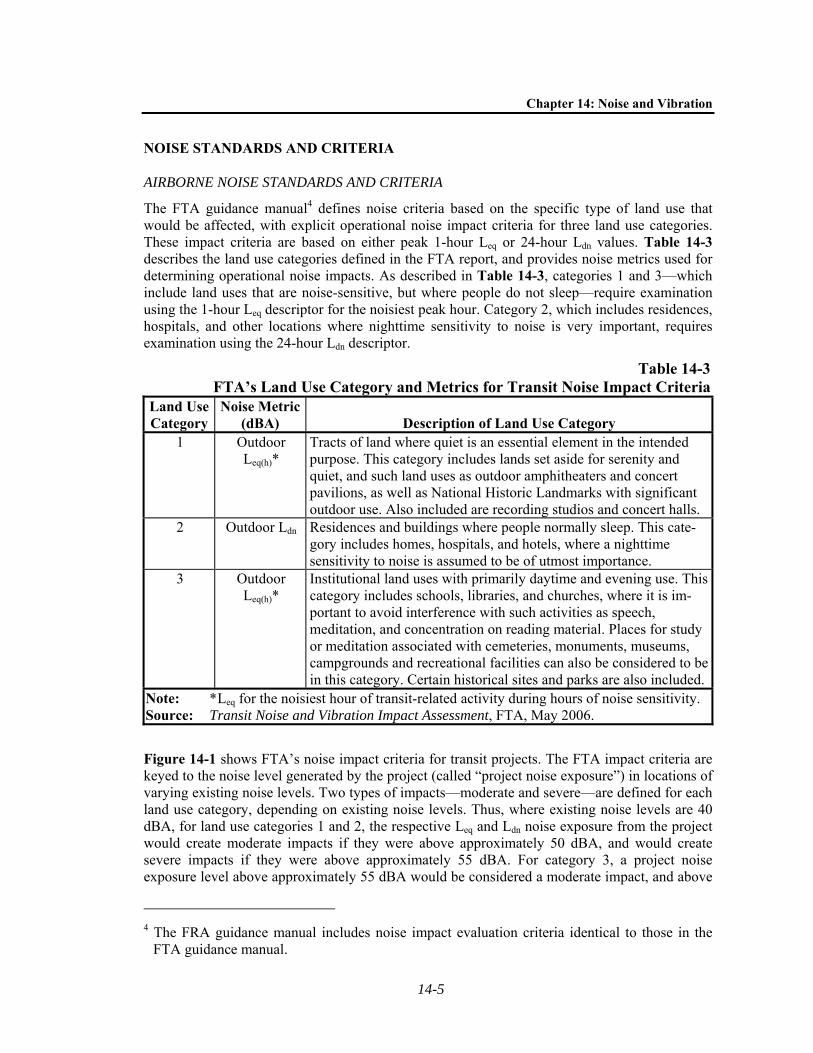
The FTA guidance manual4 defines noise criteria based on the specific type of land use that would be affected, with explicit operational noise impact criteria for three land use categories. These impact criteria are based on either peak 1-hour Leq or 24-hour Ldn values. Table 14-3 describes the land use categories defined in the FTA report, and provides noise metrics used for determining operational noise impacts. As described in Table 14-3, categories 1 and 3—which include land uses that are noise-sensitive, but where people do not sleep—require examination using the 1-hour Leq descriptor for the noisiest peak hour. Category 2, which includes residences, hospitals, and other locations where nighttime sensitivity to noise is very important, requires examination using the 24-hour Ldn descriptor.
Table 14-3FTA’s Land Use Category and Metrics for Transit Noise Impact Criteria
Land Use Category
Noise Metric (dBA) Description of Land Use Category
1 Outdoor Leq(h)*
Tracts of land where quiet is an essential element in the intended purpose. This category includes lands set aside for serenity and quiet, and such land uses as outdoor amphitheaters and concert pavilions, as well as National Historic Landmarks with significant outdoor use. Also included are recording studios and concert halls.
2 Outdoor Ldn Residences and buildings where people normally sleep. This cate-gory includes homes, hospitals, and hotels, where a nighttime sensitivity to noise is assumed to be of utmost importance.
3 Outdoor Leq(h)*
Institutional land uses with primarily daytime and evening use. This category includes schools, libraries, and churches, where it is im-portant to avoid interference with such activities as speech, meditation, and concentration on reading material. Places for study or meditation associated with cemeteries, monuments, museums, campgrounds and recreational facilities can also be considered to be in this category. Certain historical sites and parks are also included.
Note: * Leq for the noisiest hour of transit-related activity during hours of noise sensitivity. Source: Transit Noise and Vibration Impact Assessment, FTA, May 2006.
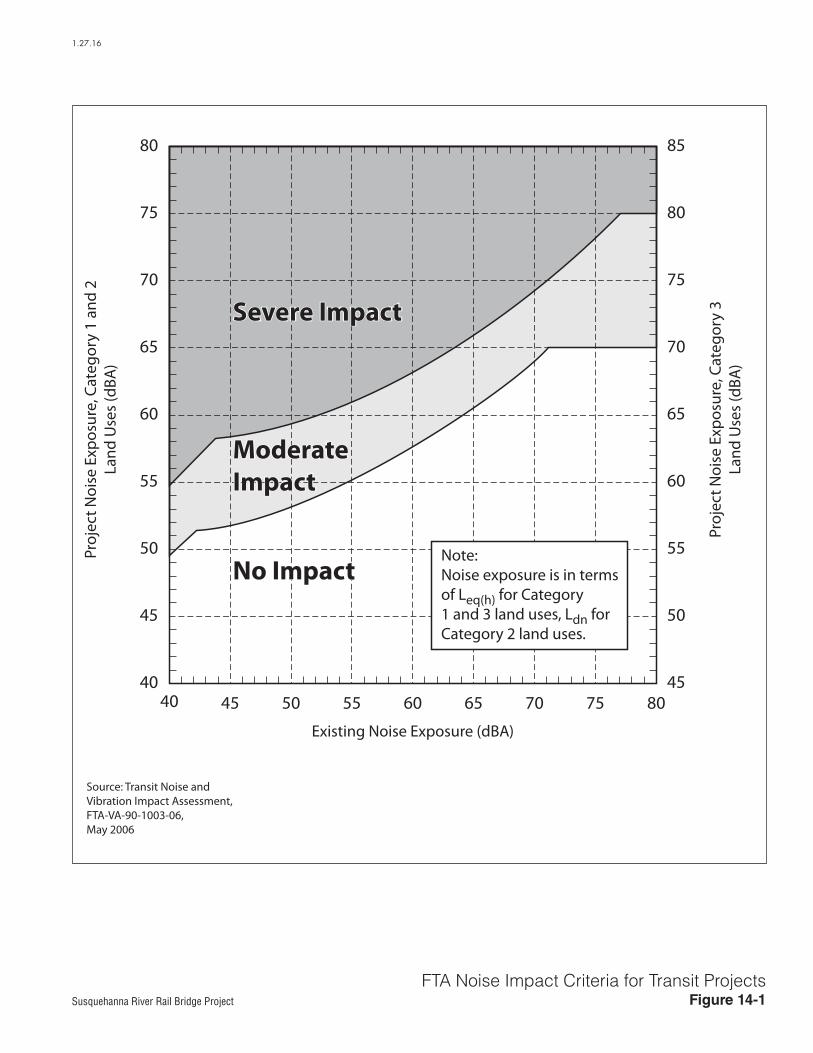
Figure 14-1 shows FTA’s noise impact criteria for transit projects. The FTA impact criteria are keyed to the noise level generated by the project (called “project noise exposure”) in locations of varying existing noise levels. Two types of impacts—moderate and severe—are defined for each land use category, depending on existing noise levels. Thus, where existing noise levels are 40 dBA, for land use categories 1 and 2, the respective Leq and Ldn noise exposure from the project would create moderate impacts if they were above approximately 50 dBA, and would create severe impacts if they were above approximately 55 dBA. For category 3, a project noise exposure level above approximately 55 dBA would be considered a moderate impact, and above
4 The FRA guidance manual includes noise impact evaluation criteria identical to those in the
FTA guidance manual.
1.27.16
Susquehanna River Rail Bridge Project Figure 14-1FTA Noise Impact Criteria for Transit Projects
80
75
70
65
60
55
50
45
4040 45 50 55 60 65 70 8075
85
80
75
70
65
60
55
50
45
Proj
ect N
oise
Exp
osur
e, C
ateg
ory
1 an
d 2
Land
Use
s (d
BA)
Existing Noise Exposure (dBA)Pr
ojec
t Noi
se E
xpos
ure,
Cat
egor
y 3
Land
Use
s (d
BA)
Source: Transit Noise andVibration Impact Assessment,FTA-VA-90-1003-06,May 2006
Note:Noise exposure is in termsof Leq(h) for Category1 and 3 land uses, Ldn forCategory 2 land uses.
ModerateImpactModerateImpact
Severe ImpactSevere Impact
No ImpactNo Impact
Susquehanna River Rail Bridge Project
14-6
approximately 60 dBA would be considered a severe impact. The difference between “severe impact” and “moderate impact” is that a severe impact occurs when a change in noise level occurs that a significant percentage of people would find annoying, while a moderate impact occurs when a change in noise level occurs that is noticeable to most people but not necessarily sufficient to result in strong adverse reactions from the community.
VIBRATION STANDARDS AND CRITERIA
With the construction of new rail rapid transit systems in recent years, the acoustical industry has gained considerable experience about how communities react to various levels of building vibration. This experience, combined with the available national and international standards, represents a good foundation for predicting annoyance from ground-borne noise and vibration in residential areas (see Table 14-2).
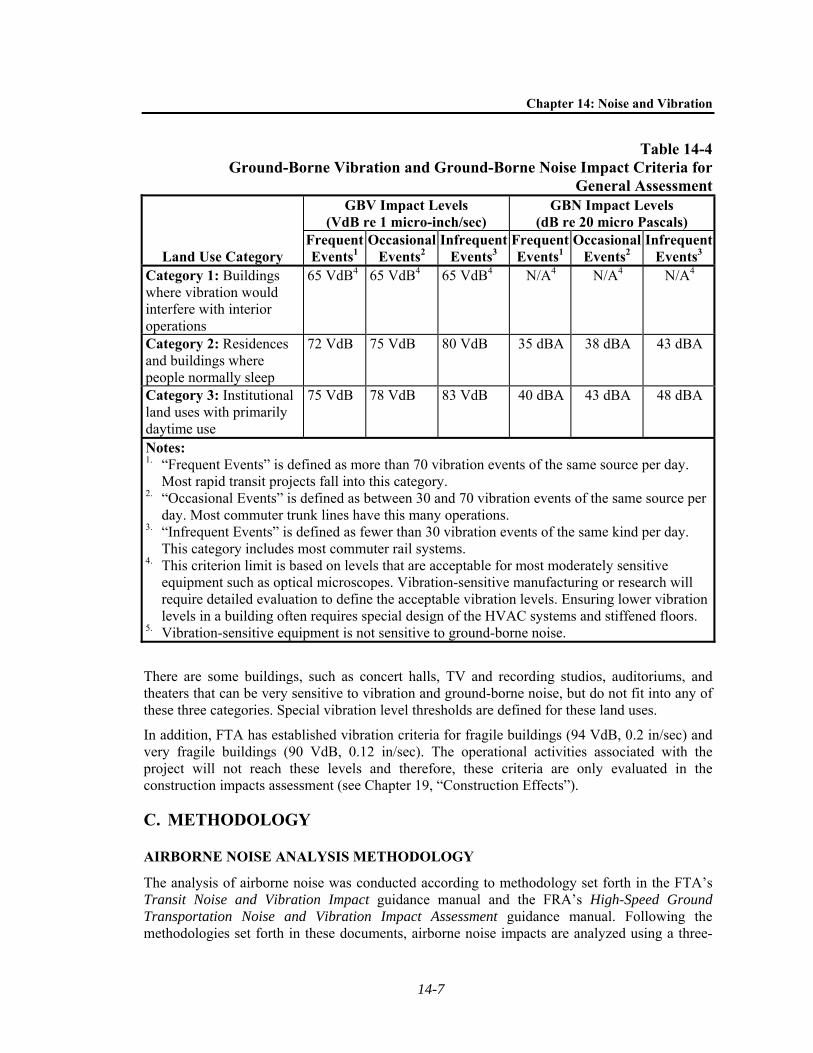
The FTA criteria for environmental impact from ground-borne vibration and noise are based on the maximum levels for a single event. The impact criteria as defined in the FTA guidance manual are shown in Table 14-4. The criteria for acceptable ground-borne vibration are expressed in terms of root-mean square velocity levels in decibels and the criteria for acceptable ground-borne noise are expressed in terms of A-weighted sound level. As shown in the table, the FTA methodology provides three different impact criteria—one for “infrequent” events, when there are fewer than 30 vibration events per day, one for “occasional” events, when there are between 30 and 70 vibration events per day, and one for “frequent” events, when there are more than 70 vibration events per day. It should be noted that these impacts occur only if a project causes ground-borne noise or vibration levels that are higher than existing vibration levels. Thus, if the vibration level for a building in Category 1 is already 70 VdB (5 VdB above the 65 VdB threshold listed in Table 14-4) but a hypothetical project will not increase that level, then the project will not be considered to have an impact.
The limits are specified for the three land use categories defined below:
Category 1: High Sensitivity—Buildings where low ambient vibration is essential for the operations within the building, which may be well below levels associated with human annoyance. Typical land uses are vibration-sensitive research and manufacturing, hospitals, and university research operations.
Category 2: Residential—This category covers all residential land uses and any buildings where people sleep, such as hotels and hospitals. No differentiation is made between different types of residential areas. This is primarily because ground-borne vibration and noise are experienced indoors and building occupants have practically no means to reduce their exposure. Even in a noisy urban area, the bedrooms often will be quiet in buildings that have effective noise insulation and tightly closed windows. Hence, an occupant of a bedroom in a noisy urban area is likely to be just as sensitive to ground-borne noise and vibration as someone in a quiet suburban area.
Category 3: Institutional—This category includes schools, churches, other institutions, and quiet offices that do not have vibration-sensitive equipment, but still have the potential for activity interference.
Chapter 14: Noise and Vibration
14-7
Table 14-4Ground-Borne Vibration and Ground-Borne Noise Impact Criteria for
General Assessment
Land Use Category
GBV Impact Levels (VdB re 1 micro-inch/sec)
GBN Impact Levels (dB re 20 micro Pascals)
Frequent Events1
Occasional Events2
Infrequent Events3
Frequent Events1
Occasional Events2
Infrequent Events3
Category 1: Buildings where vibration would interfere with interior operations
65 VdB4 65 VdB4 65 VdB4 N/A4 N/A4 N/A4
Category 2: Residences and buildings where people normally sleep
72 VdB 75 VdB 80 VdB 35 dBA 38 dBA 43 dBA
Category 3: Institutional land uses with primarily daytime use
75 VdB 78 VdB 83 VdB 40 dBA 43 dBA 48 dBA
Notes: 1. “Frequent Events” is defined as more than 70 vibration events of the same source per day.
Most rapid transit projects fall into this category. 2. “Occasional Events” is defined as between 30 and 70 vibration events of the same source per
day. Most commuter trunk lines have this many operations. 3. “Infrequent Events” is defined as fewer than 30 vibration events of the same kind per day.
This category includes most commuter rail systems. 4. This criterion limit is based on levels that are acceptable for most moderately sensitive
equipment such as optical microscopes. Vibration-sensitive manufacturing or research will require detailed evaluation to define the acceptable vibration levels. Ensuring lower vibration levels in a building often requires special design of the HVAC systems and stiffened floors.
5. Vibration-sensitive equipment is not sensitive to ground-borne noise.
There are some buildings, such as concert halls, TV and recording studios, auditoriums, and theaters that can be very sensitive to vibration and ground-borne noise, but do not fit into any of these three categories. Special vibration level thresholds are defined for these land uses.
In addition, FTA has established vibration criteria for fragile buildings (94 VdB, 0.2 in/sec) and very fragile buildings (90 VdB, 0.12 in/sec). The operational activities associated with the project will not reach these levels and therefore, these criteria are only evaluated in the construction impacts assessment (see Chapter 19, “Construction Effects”).
C. METHODOLOGY
AIRBORNE NOISE ANALYSIS METHODOLOGY
The analysis of airborne noise was conducted according to methodology set forth in the FTA’s Transit Noise and Vibration Impact guidance manual and the FRA’s High-Speed Ground Transportation Noise and Vibration Impact Assessment guidance manual. Following the methodologies set forth in these documents, airborne noise impacts are analyzed using a three-
Susquehanna River Rail Bridge Project
14-8
step process that consists of a screening procedure, a general noise assessment, and potentially a detailed noise analysis. The screening procedure is performed first to determine whether any noise-sensitive receptors are within distances where impacts are likely to occur. If the screening reveals that there are noise-sensitive receptors in locations where impacts are likely to occur, then a general noise assessment is performed to determine locations where noise impacts could occur. If this general assessment indicates that a potential for noise impact does exist, then a detailed noise analysis may be necessary. The detailed analysis methodology is used to predict impacts and evaluate the effectiveness of mitigation with greater precision than can be achieved with the general noise assessment. The methodology and results of the noise analysis screening procedure are presented below.
ANALYSIS PROCEDURE
The Project Team employed the following procedures for the noise analysis:
Identified noise-sensitive land uses (i.e., residential, church, certain parks, etc.) within the screening distance from the rail corridor;
Selected representative noise receptor sites to represent those noise-sensitive land uses identified within the screening distance. The selected noise receptor sites provide geographic coverage of the study area and represent those locations with the greatest potential to experience a significant increase in noise levels associated with the Proposed Project;
Determined existing noise levels at the aforementioned receptor sites by performing field measurements and using acoustical fundamentals. For sites at which direct access to conduct noise level measurements was not available, measurements occurred at a nearby location with a comparable level of non-rail noise;
Calculated existing rail noise levels at each receptor site using a combination of the FTA’s Chicago Rail Efficiency and Transportation Efficiency (CREATE) model for rail activity at speeds less than 125 mph and the FRA’s High Speed Rail (HSR) model for rail activity at speeds at or above 125 mph as well as data associated with the existing conditions on the railway;
Subtracted the calculated existing rail noise levels for each receptor site from measured existing noise levels to determine the non-rail component of the noise level (e.g., noise from vehicular traffic, aircraft, parking lots, etc.) at each site;
Calculated future rail noise levels for each Build Alternative according to the CREATE and HSR models;
Determined future noise levels for each Build Alternative at each receptor site as the sum of calculated rail noise level and the calculated non-rail noise level;
Used the future noise levels for each Build Alternative to determine the project noise exposure at each receptor site; and
Compared the project noise exposure for each analysis alternative to the FTA criteria to identify potential impacts.
STEP 1: NOISE SCREENING
The FTA methodology begins with a noise screening to determine whether any noise-sensitive receptors are within a distance where an impact is likely to occur. According to the FTA screening methodology, potential impacts may occur if noise receptors are within 750 feet of the
Chapter 14: Noise and Vibration
14-9
centerline of a commuter rail mainline if the pathway between the track and the receptor is unobstructed, or 375 feet from the track centerline if the pathway is obstructed (since obstructions block some noise and therefore reduce the distance the noise will travel). Based on a review of current aerial photography, site visits, and land use maps, the Project Team determined that noise-sensitive receptors are located within the screening distances of the Proposed Project site.
STEP 2: GENERAL NOISE ASSESSMENT
Since sensitive receptors are present within the screening distance, a general noise assessment was conducted to examine the effect of the Proposed Project (including the replacement bridge as well as changes in train volume and speed) on noise levels. The assessment used the procedures contained in the FTA guidance manual and the calculation method contained in the FRA guidance manual for “high speed” rail activity. According to FTA’s guidance document, the potential for noise impacts at sensitive land use locations will occur if the project-generated noise levels, or “noise exposure,” exceed the levels shown in Figure 14-1.
The general noise assessment methodology consists of determining the project noise exposure at 50 feet from the centerline of track, adjusting the noise level based on the actual distance from the rail right-of-way (ROW) and the receptor, and comparing the calculated levels with the criteria based on land use categories. In order to perform the general noise assessment, FTA’s CREATE railroad noise model and FRA’s HSR noise model were used to determine the rail component of the total noise level at a receptor location. Both models calculate hourly-equivalent (Leq) or day-night (Ldn) noise levels taking into account the type of trains and types of locomotives (freight vs. passenger, diesel vs. electric), the number of locomotives on each train and length of train, the number of trains per day, the speed of the trains, characteristics of the track, and the time of day. The calculations predict the noise levels from the proposed increased train volume, the new rail alignments, and the expected increase in train speeds.
The (total) noise level at a receptor location near the project site is the sum of the noise generated by rail operations and non-rail sources. As described below non-rail noise levels at receptor sites were calculated based upon field measurements of existing noise levels.
VIBRATION AND GROUND-BORNE NOISE METHODOLOGY
STEP 1: VIBRATION SCREENING
The FTA methodology begins with a vibration screening to determine whether any vibration-sensitive receptors are within a distance where an impact is likely to occur. According to the FTA screening methodology, potential impacts may occur if high-sensitivity vibration receptors are within 600 feet of the centerline of a commuter rail mainline, or if residential receptors are within 200 feet from the track centerline. Based on a review of current aerial photography, site visits, and land use maps, the Project Team determined that residences are located within the screening distance of the Proposed Project as shown in Figure 4-1.
STEP 2: GENERAL NOISE ASSESSMENT
As mentioned above, there are sensitive receptors within the screening distances from the Proposed Project area, so the general assessment methodology was used to evaluate vibration associated with the Proposed Project.
Susquehanna River Rail Bridge Project
14-10
The Project Team used the following procedures for the general vibration assessment:
Identified vibration-sensitive land uses (i.e., residential, school, etc.) within the screening distance from the rail corridor;
Selected a representative worst-case vibration receptor site to represent vibration-sensitive land uses identified within the screening distance. The selected receptor site represents the location with the greatest potential to experience a significant increase in vibration associated with the Proposed Project;
Calculated future rail vibration levels for each Build Alternative according to the FTA general vibration assessment guidance; and
Compared the predicted vibration levels for each Build Alternative to the FTA criteria to identify potential impacts.
D. AFFECTED ENVIRONMENT
AIRBORNE NOISE
SELECTION OF NOISE RECEPTOR LOCATIONS
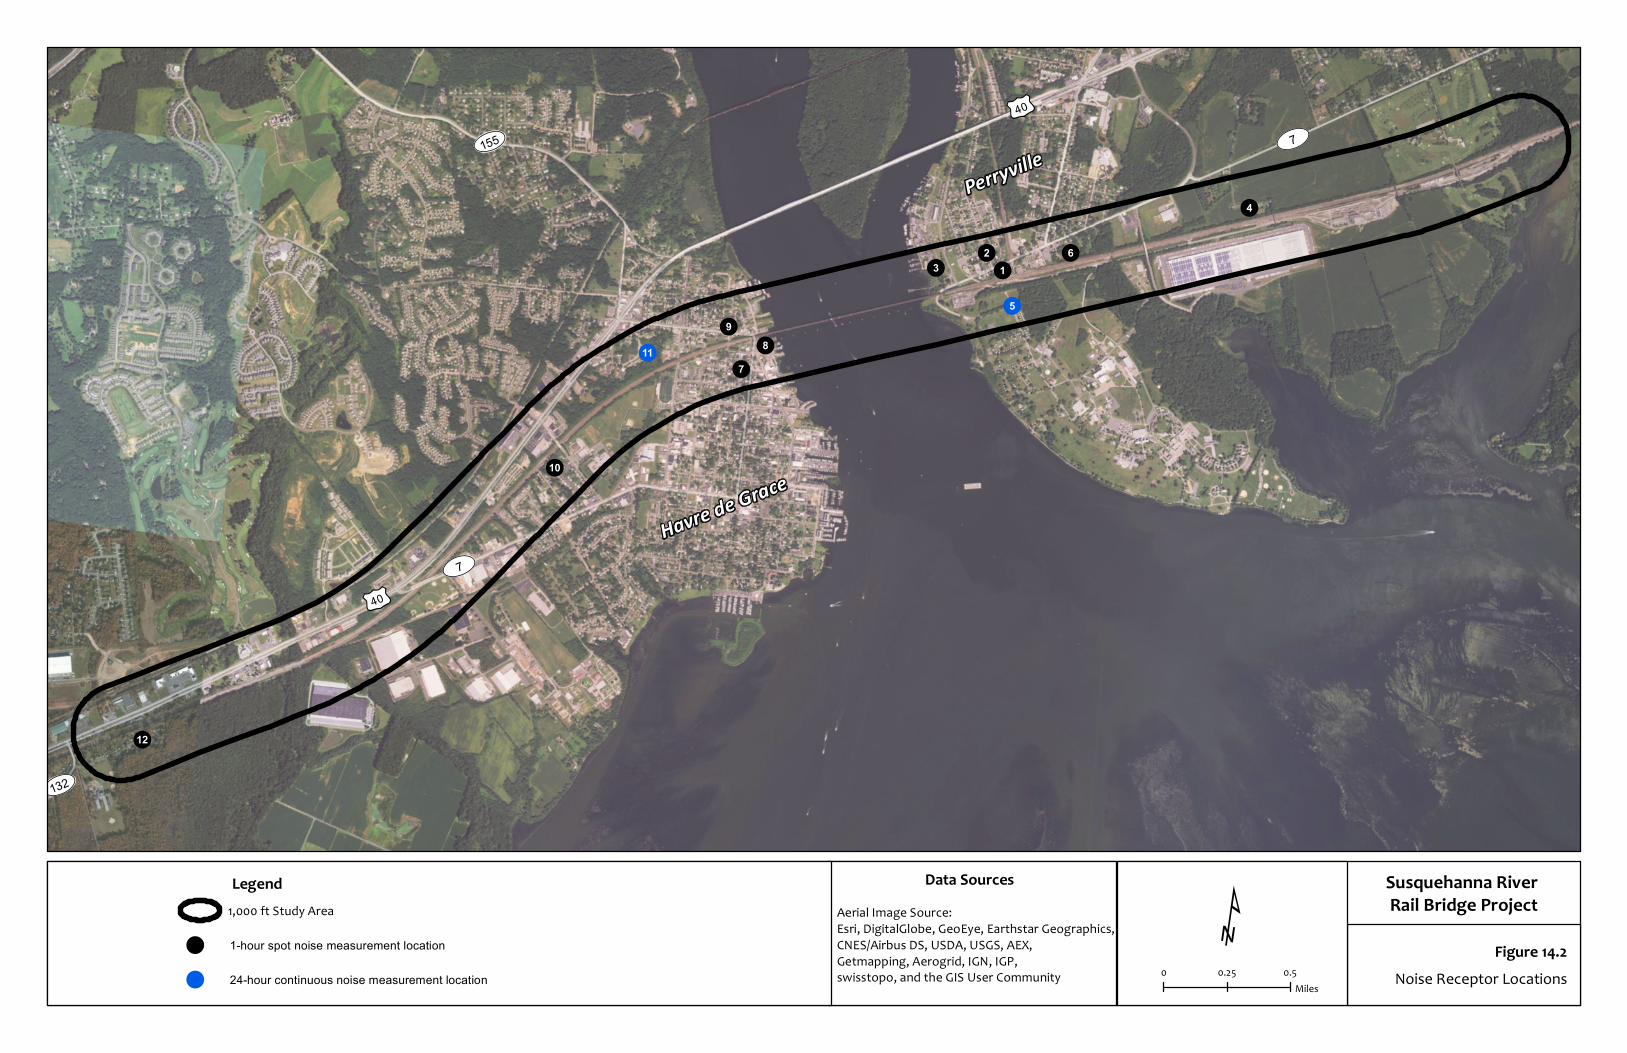
In order to assess potential project impacts, 12 representative noise receptor sites were selected to represent all noise receptor sites within the screening distance. Noise analysis results at each of the representative receptor sites were applied to other receptors nearby and with comparable distance from the rail ROW. The Project Team used information on land use and proximity to existing railway to identify those locations that would be particularly sensitive to noise increases (e.g., residences, places of worship, parkland, etc.) or that would be likely to experience the greatest increases in noise from the project to select representative receptor sites. At each of the representative receptor sites, the Project Team performed noise measurements to establish existing conditions.
A combination of 24-hour continuous noise level measurements and 1-hour spot noise measurements were conducted at the selected receptor sites. Due to site access and security concerns, it was not possible to conduct 24-hour measurements at all of the selected representative noise receptor sites. Because the dominant noise source in the study area is the existing rail activity, the 24-hour temporal distribution of the noise levels is consistent at each site, following the pattern of rail activity over the course of the day. Consequently, at locations where the Project Team conducted 1-hour spot noise level measurements, the Project Team developed 24-hour noise levels by prorating the 1-hour noise level based on the 24-hour distribution of noise levels at the nearest 24-hour noise measurement location.
The locations of the noise receptor sites considered in this analysis and their land use categories are shown in Table 14-5 and on Figure 14-2.
Perryville
Of the six noise representative receptor sites selected in Perryville, the Project Team conducted a 24-hour continuous noise level measurement at one location and 1-hour spot noise level
!!
!
!
!
!
!!
!
!
!
!
Havre de Grace
Perryville
132
155
222
7£¤40
7
£¤40
12
3
4
5
6
78
9
10
11
12
¹0 0.25 0.5
Miles
Susquehanna River Rail Bridge Project
Data Sources
Figure 14.2Noise Receptor Locations
Legend1,000 ft Study Area
! 1-hour spot noise measurement location
! 24-hour continuous noise measurement location
Aerial Image Source:Esri, DigitalGlobe, GeoEye, Earthstar Geographics, CNES/Airbus DS, USDA, USGS, AEX, Getmapping, Aerogrid, IGN, IGP,swisstopo, and the GIS User Community
Chapter 14: Noise and Vibration
14-11
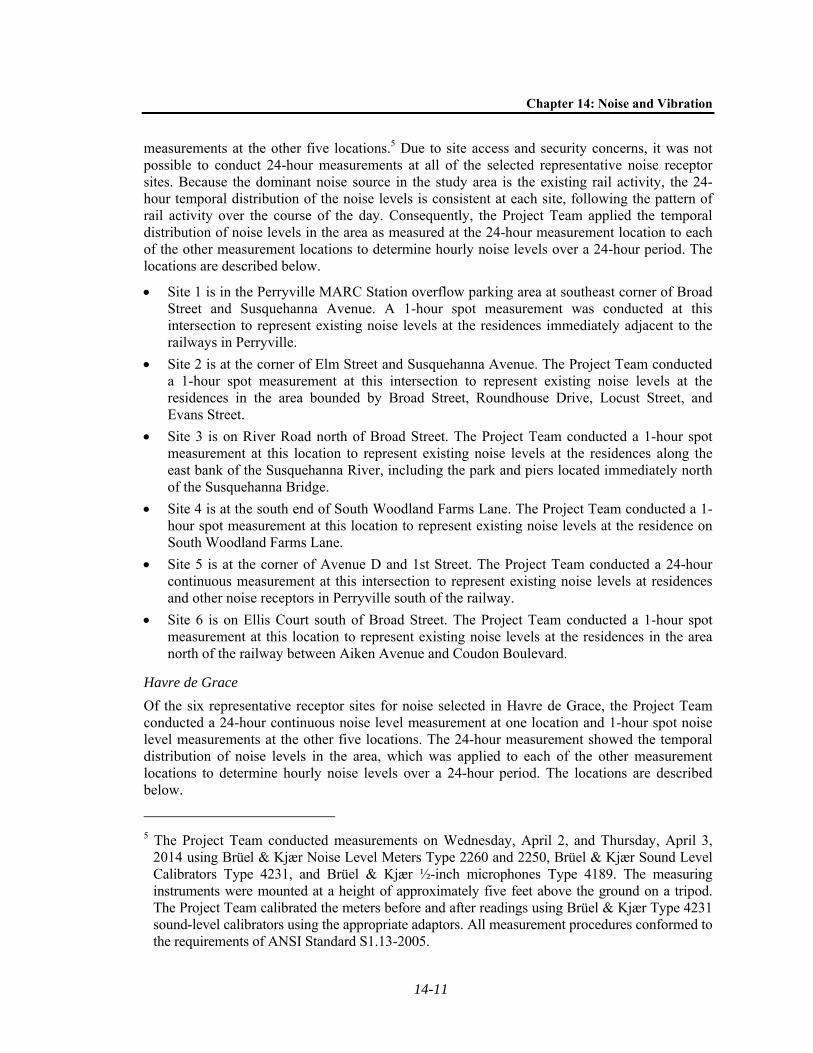
measurements at the other five locations.5 Due to site access and security concerns, it was not possible to conduct 24-hour measurements at all of the selected representative noise receptor sites. Because the dominant noise source in the study area is the existing rail activity, the 24-hour temporal distribution of the noise levels is consistent at each site, following the pattern of rail activity over the course of the day. Consequently, the Project Team applied the temporal distribution of noise levels in the area as measured at the 24-hour measurement location to each of the other measurement locations to determine hourly noise levels over a 24-hour period. The locations are described below.
Site 1 is in the Perryville MARC Station overflow parking area at southeast corner of Broad Street and Susquehanna Avenue. A 1-hour spot measurement was conducted at this intersection to represent existing noise levels at the residences immediately adjacent to the railways in Perryville.
Site 2 is at the corner of Elm Street and Susquehanna Avenue. The Project Team conducted a 1-hour spot measurement at this intersection to represent existing noise levels at the residences in the area bounded by Broad Street, Roundhouse Drive, Locust Street, and Evans Street.
Site 3 is on River Road north of Broad Street. The Project Team conducted a 1-hour spot measurement at this location to represent existing noise levels at the residences along the east bank of the Susquehanna River, including the park and piers located immediately north of the Susquehanna Bridge.
Site 4 is at the south end of South Woodland Farms Lane. The Project Team conducted a 1-hour spot measurement at this location to represent existing noise levels at the residence on South Woodland Farms Lane.
Site 5 is at the corner of Avenue D and 1st Street. The Project Team conducted a 24-hour continuous measurement at this intersection to represent existing noise levels at residences and other noise receptors in Perryville south of the railway.
Site 6 is on Ellis Court south of Broad Street. The Project Team conducted a 1-hour spot measurement at this location to represent existing noise levels at the residences in the area north of the railway between Aiken Avenue and Coudon Boulevard.
Havre de Grace
Of the six representative receptor sites for noise selected in Havre de Grace, the Project Team conducted a 24-hour continuous noise level measurement at one location and 1-hour spot noise level measurements at the other five locations. The 24-hour measurement showed the temporal distribution of noise levels in the area, which was applied to each of the other measurement locations to determine hourly noise levels over a 24-hour period. The locations are described below.
5 The Project Team conducted measurements on Wednesday, April 2, and Thursday, April 3,
2014 using Brüel & Kjær Noise Level Meters Type 2260 and 2250, Brüel & Kjær Sound Level Calibrators Type 4231, and Brüel & Kjær ½-inch microphones Type 4189. The measuring instruments were mounted at a height of approximately five feet above the ground on a tripod. The Project Team calibrated the meters before and after readings using Brüel & Kjær Type 4231 sound-level calibrators using the appropriate adaptors. All measurement procedures conformed to the requirements of ANSI Standard S1.13-2005.
Susquehanna River Rail Bridge Project
14-12
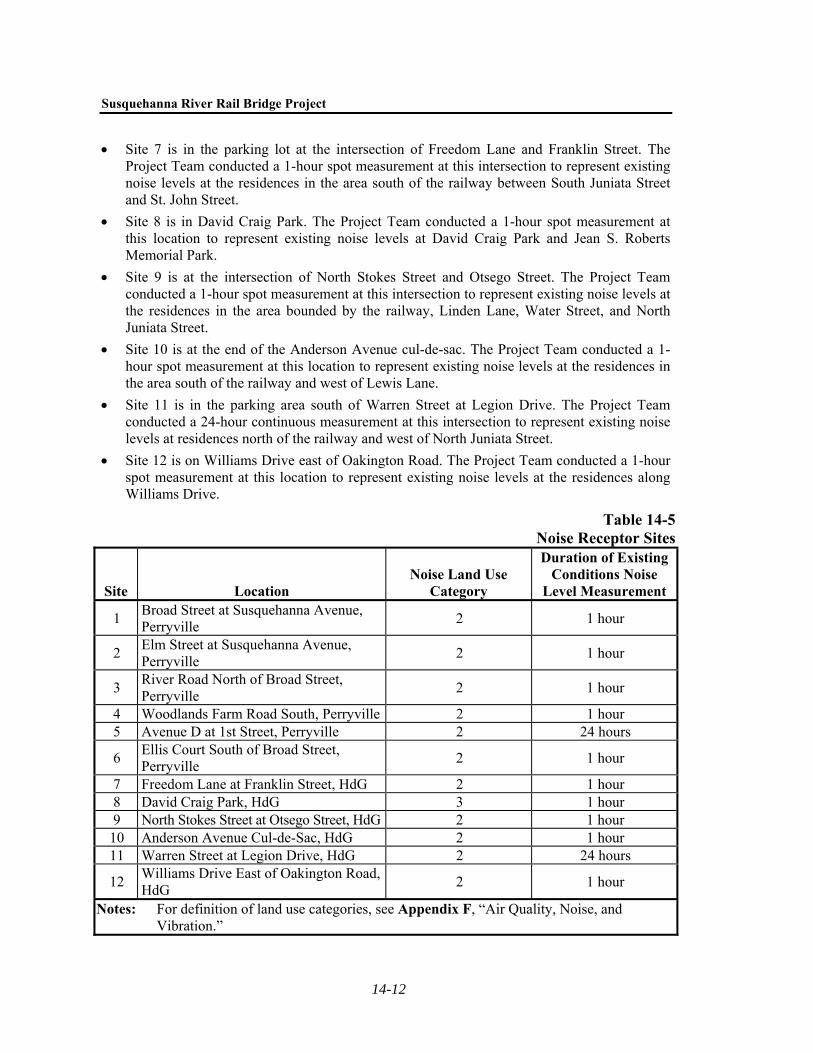
Site 7 is in the parking lot at the intersection of Freedom Lane and Franklin Street. The Project Team conducted a 1-hour spot measurement at this intersection to represent existing noise levels at the residences in the area south of the railway between South Juniata Street and St. John Street.
Site 8 is in David Craig Park. The Project Team conducted a 1-hour spot measurement at this location to represent existing noise levels at David Craig Park and Jean S. Roberts Memorial Park.
Site 9 is at the intersection of North Stokes Street and Otsego Street. The Project Team conducted a 1-hour spot measurement at this intersection to represent existing noise levels at the residences in the area bounded by the railway, Linden Lane, Water Street, and North Juniata Street.
Site 10 is at the end of the Anderson Avenue cul-de-sac. The Project Team conducted a 1-hour spot measurement at this location to represent existing noise levels at the residences in the area south of the railway and west of Lewis Lane.
Site 11 is in the parking area south of Warren Street at Legion Drive. The Project Team conducted a 24-hour continuous measurement at this intersection to represent existing noise levels at residences north of the railway and west of North Juniata Street.
Site 12 is on Williams Drive east of Oakington Road. The Project Team conducted a 1-hour spot measurement at this location to represent existing noise levels at the residences along Williams Drive.
Table 14-5Noise Receptor Sites
Site Location Noise Land Use
Category
Duration of Existing Conditions Noise
Level Measurement
1 Broad Street at Susquehanna Avenue, Perryville
2 1 hour
2 Elm Street at Susquehanna Avenue, Perryville
2 1 hour
3 River Road North of Broad Street, Perryville
2 1 hour
4 Woodlands Farm Road South, Perryville 2 1 hour 5 Avenue D at 1st Street, Perryville 2 24 hours
6 Ellis Court South of Broad Street, Perryville
2 1 hour
7 Freedom Lane at Franklin Street, HdG 2 1 hour 8 David Craig Park, HdG 3 1 hour 9 North Stokes Street at Otsego Street, HdG 2 1 hour
10 Anderson Avenue Cul-de-Sac, HdG 2 1 hour 11 Warren Street at Legion Drive, HdG 2 24 hours
12 Williams Drive East of Oakington Road, HdG
2 1 hour
Notes: For definition of land use categories, see Appendix F, “Air Quality, Noise, and Vibration.”
Chapter 14: Noise and Vibration
14-13
MEASURED NOISE LEVELS
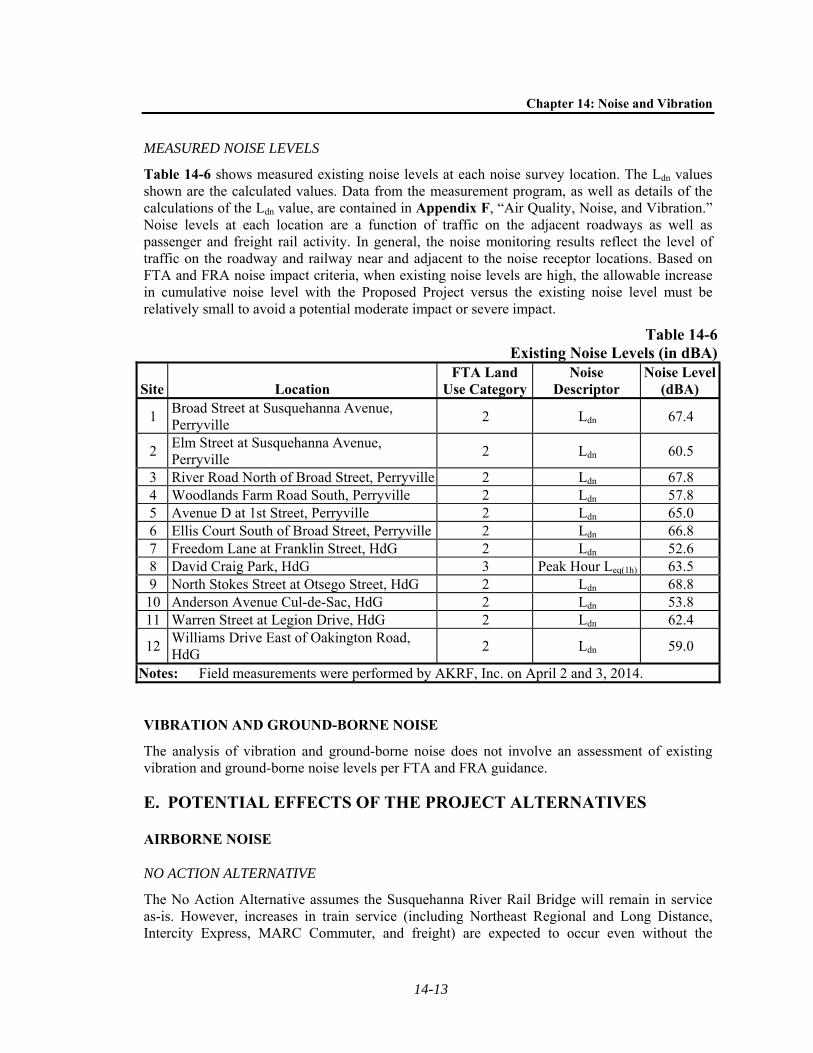
Table 14-6 shows measured existing noise levels at each noise survey location. The Ldn values shown are the calculated values. Data from the measurement program, as well as details of the calculations of the Ldn value, are contained in Appendix F, “Air Quality, Noise, and Vibration.” Noise levels at each location are a function of traffic on the adjacent roadways as well as passenger and freight rail activity. In general, the noise monitoring results reflect the level of traffic on the roadway and railway near and adjacent to the noise receptor locations. Based on FTA and FRA noise impact criteria, when existing noise levels are high, the allowable increase in cumulative noise level with the Proposed Project versus the existing noise level must be relatively small to avoid a potential moderate impact or severe impact.
Table 14-6Existing Noise Levels (in dBA)
Site Location FTA Land
Use CategoryNoise
Descriptor Noise Level
(dBA)
1 Broad Street at Susquehanna Avenue, Perryville
2 Ldn 67.4
2 Elm Street at Susquehanna Avenue, Perryville
2 Ldn 60.5
3 River Road North of Broad Street, Perryville 2 Ldn 67.8 4 Woodlands Farm Road South, Perryville 2 Ldn 57.8 5 Avenue D at 1st Street, Perryville 2 Ldn 65.0 6 Ellis Court South of Broad Street, Perryville 2 Ldn 66.8 7 Freedom Lane at Franklin Street, HdG 2 Ldn 52.6 8 David Craig Park, HdG 3 Peak Hour Leq(1h) 63.5 9 North Stokes Street at Otsego Street, HdG 2 Ldn 68.8
10 Anderson Avenue Cul-de-Sac, HdG 2 Ldn 53.8 11 Warren Street at Legion Drive, HdG 2 Ldn 62.4
12 Williams Drive East of Oakington Road, HdG
2 Ldn 59.0
Notes: Field measurements were performed by AKRF, Inc. on April 2 and 3, 2014.
VIBRATION AND GROUND-BORNE NOISE
The analysis of vibration and ground-borne noise does not involve an assessment of existing vibration and ground-borne noise levels per FTA and FRA guidance.
E. POTENTIAL EFFECTS OF THE PROJECT ALTERNATIVES
AIRBORNE NOISE
NO ACTION ALTERNATIVE
The No Action Alternative assumes the Susquehanna River Rail Bridge will remain in service as-is. However, increases in train service (including Northeast Regional and Long Distance, Intercity Express, MARC Commuter, and freight) are expected to occur even without the
Susquehanna River Rail Bridge Project
14-14
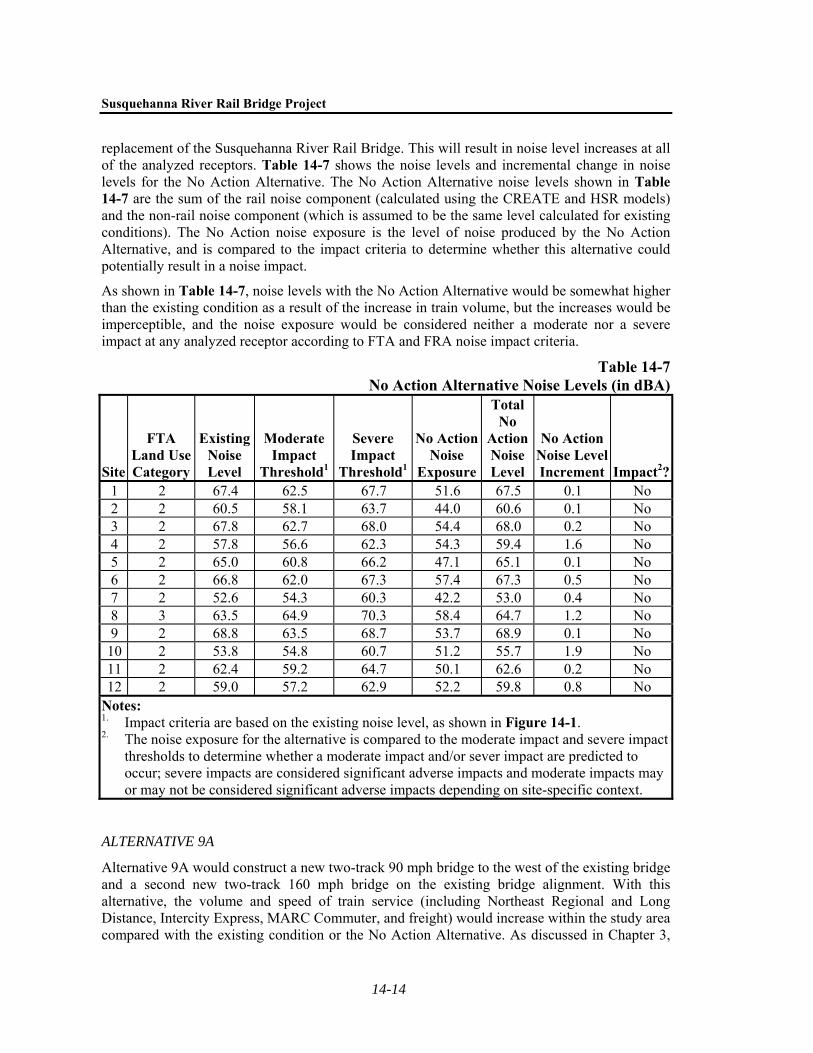
replacement of the Susquehanna River Rail Bridge. This will result in noise level increases at all of the analyzed receptors. Table 14-7 shows the noise levels and incremental change in noise levels for the No Action Alternative. The No Action Alternative noise levels shown in Table 14-7 are the sum of the rail noise component (calculated using the CREATE and HSR models) and the non-rail noise component (which is assumed to be the same level calculated for existing conditions). The No Action noise exposure is the level of noise produced by the No Action Alternative, and is compared to the impact criteria to determine whether this alternative could potentially result in a noise impact.
As shown in Table 14-7, noise levels with the No Action Alternative would be somewhat higher than the existing condition as a result of the increase in train volume, but the increases would be imperceptible, and the noise exposure would be considered neither a moderate nor a severe impact at any analyzed receptor according to FTA and FRA noise impact criteria.
Table 14-7No Action Alternative Noise Levels (in dBA)
Site
FTA Land Use Category
Existing Noise Level
Moderate Impact
Threshold1
Severe Impact
Threshold1
No Action Noise
Exposure
Total No
Action Noise Level
No Action Noise Level Increment Impact2?
1 2 67.4 62.5 67.7 51.6 67.5 0.1 No 2 2 60.5 58.1 63.7 44.0 60.6 0.1 No 3 2 67.8 62.7 68.0 54.4 68.0 0.2 No 4 2 57.8 56.6 62.3 54.3 59.4 1.6 No 5 2 65.0 60.8 66.2 47.1 65.1 0.1 No 6 2 66.8 62.0 67.3 57.4 67.3 0.5 No 7 2 52.6 54.3 60.3 42.2 53.0 0.4 No 8 3 63.5 64.9 70.3 58.4 64.7 1.2 No 9 2 68.8 63.5 68.7 53.7 68.9 0.1 No
10 2 53.8 54.8 60.7 51.2 55.7 1.9 No 11 2 62.4 59.2 64.7 50.1 62.6 0.2 No 12 2 59.0 57.2 62.9 52.2 59.8 0.8 No
Notes: 1. Impact criteria are based on the existing noise level, as shown in Figure 14-1. 2. The noise exposure for the alternative is compared to the moderate impact and severe impact
thresholds to determine whether a moderate impact and/or sever impact are predicted to occur; severe impacts are considered significant adverse impacts and moderate impacts may or may not be considered significant adverse impacts depending on site-specific context.
ALTERNATIVE 9A
Alternative 9A would construct a new two-track 90 mph bridge to the west of the existing bridge and a second new two-track 160 mph bridge on the existing bridge alignment. With this alternative, the volume and speed of train service (including Northeast Regional and Long Distance, Intercity Express, MARC Commuter, and freight) would increase within the study area compared with the existing condition or the No Action Alternative. As discussed in Chapter 3,
Chapter 14: Noise and Vibration
14-15
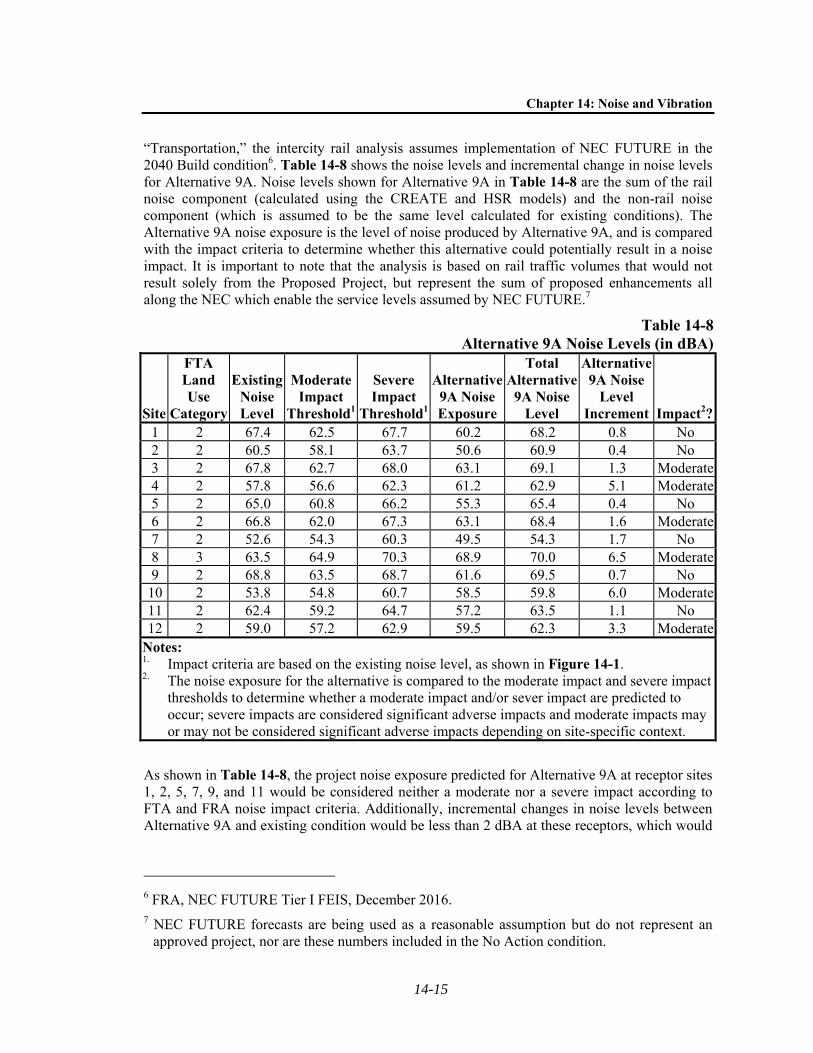
“Transportation,” the intercity rail analysis assumes implementation of NEC FUTURE in the 2040 Build condition6. Table 14-8 shows the noise levels and incremental change in noise levels for Alternative 9A. Noise levels shown for Alternative 9A in Table 14-8 are the sum of the rail noise component (calculated using the CREATE and HSR models) and the non-rail noise component (which is assumed to be the same level calculated for existing conditions). The Alternative 9A noise exposure is the level of noise produced by Alternative 9A, and is compared with the impact criteria to determine whether this alternative could potentially result in a noise impact. It is important to note that the analysis is based on rail traffic volumes that would not result solely from the Proposed Project, but represent the sum of proposed enhancements all along the NEC which enable the service levels assumed by NEC FUTURE.7
Table 14-8Alternative 9A Noise Levels (in dBA)
Site
FTA Land Use
Category
Existing Noise Level
Moderate Impact
Threshold1
Severe Impact
Threshold1
Alternative 9A Noise Exposure
Total Alternative
9A Noise Level
Alternative 9A Noise
Level Increment Impact2?
1 2 67.4 62.5 67.7 60.2 68.2 0.8 No 2 2 60.5 58.1 63.7 50.6 60.9 0.4 No 3 2 67.8 62.7 68.0 63.1 69.1 1.3 Moderate4 2 57.8 56.6 62.3 61.2 62.9 5.1 Moderate5 2 65.0 60.8 66.2 55.3 65.4 0.4 No 6 2 66.8 62.0 67.3 63.1 68.4 1.6 Moderate7 2 52.6 54.3 60.3 49.5 54.3 1.7 No 8 3 63.5 64.9 70.3 68.9 70.0 6.5 Moderate9 2 68.8 63.5 68.7 61.6 69.5 0.7 No
10 2 53.8 54.8 60.7 58.5 59.8 6.0 Moderate11 2 62.4 59.2 64.7 57.2 63.5 1.1 No 12 2 59.0 57.2 62.9 59.5 62.3 3.3 Moderate
Notes: 1. Impact criteria are based on the existing noise level, as shown in Figure 14-1. 2. The noise exposure for the alternative is compared to the moderate impact and severe impact
thresholds to determine whether a moderate impact and/or sever impact are predicted to occur; severe impacts are considered significant adverse impacts and moderate impacts may or may not be considered significant adverse impacts depending on site-specific context.
As shown in Table 14-8, the project noise exposure predicted for Alternative 9A at receptor sites 1, 2, 5, 7, 9, and 11 would be considered neither a moderate nor a severe impact according to FTA and FRA noise impact criteria. Additionally, incremental changes in noise levels between Alternative 9A and existing condition would be less than 2 dBA at these receptors, which would
6 FRA, NEC FUTURE Tier I FEIS, December 2016. 7 NEC FUTURE forecasts are being used as a reasonable assumption but do not represent an
approved project, nor are these numbers included in the No Action condition.
Susquehanna River Rail Bridge Project
14-16
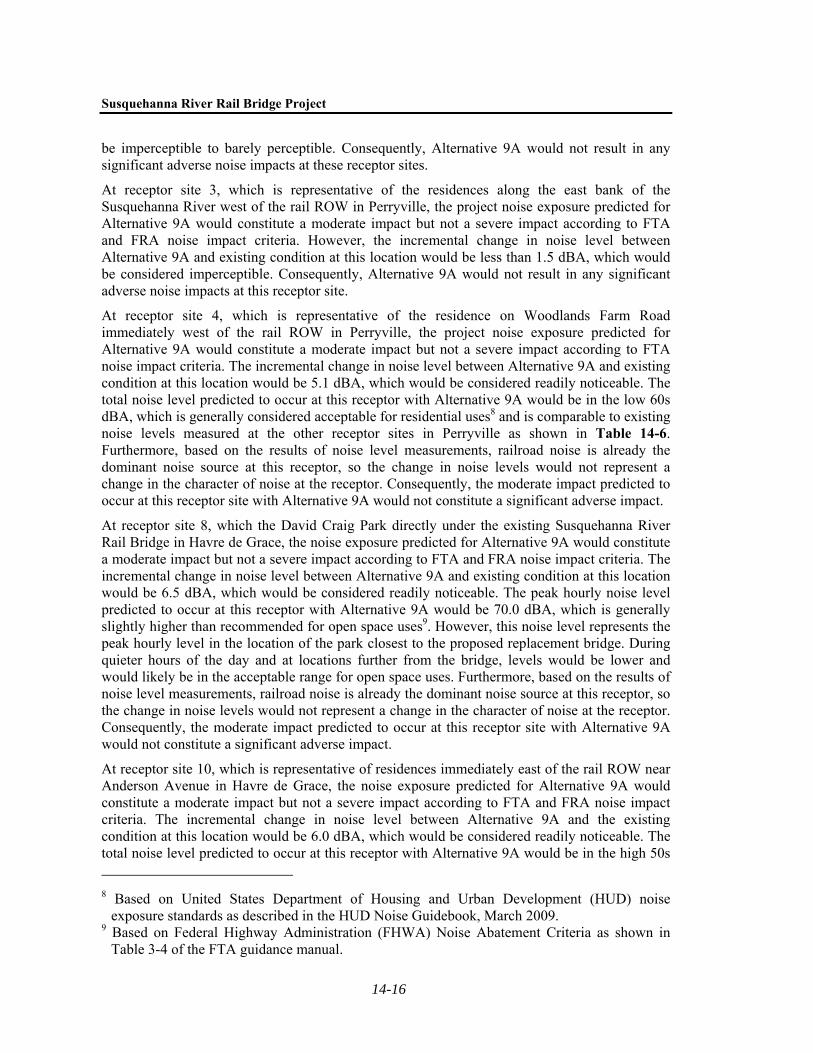
be imperceptible to barely perceptible. Consequently, Alternative 9A would not result in any significant adverse noise impacts at these receptor sites.
At receptor site 3, which is representative of the residences along the east bank of the Susquehanna River west of the rail ROW in Perryville, the project noise exposure predicted for Alternative 9A would constitute a moderate impact but not a severe impact according to FTA and FRA noise impact criteria. However, the incremental change in noise level between Alternative 9A and existing condition at this location would be less than 1.5 dBA, which would be considered imperceptible. Consequently, Alternative 9A would not result in any significant adverse noise impacts at this receptor site.
At receptor site 4, which is representative of the residence on Woodlands Farm Road immediately west of the rail ROW in Perryville, the project noise exposure predicted for Alternative 9A would constitute a moderate impact but not a severe impact according to FTA noise impact criteria. The incremental change in noise level between Alternative 9A and existing condition at this location would be 5.1 dBA, which would be considered readily noticeable. The total noise level predicted to occur at this receptor with Alternative 9A would be in the low 60s dBA, which is generally considered acceptable for residential uses8 and is comparable to existing noise levels measured at the other receptor sites in Perryville as shown in Table 14-6. Furthermore, based on the results of noise level measurements, railroad noise is already the dominant noise source at this receptor, so the change in noise levels would not represent a change in the character of noise at the receptor. Consequently, the moderate impact predicted to occur at this receptor site with Alternative 9A would not constitute a significant adverse impact.
At receptor site 8, which the David Craig Park directly under the existing Susquehanna River Rail Bridge in Havre de Grace, the noise exposure predicted for Alternative 9A would constitute a moderate impact but not a severe impact according to FTA and FRA noise impact criteria. The incremental change in noise level between Alternative 9A and existing condition at this location would be 6.5 dBA, which would be considered readily noticeable. The peak hourly noise level predicted to occur at this receptor with Alternative 9A would be 70.0 dBA, which is generally slightly higher than recommended for open space uses9. However, this noise level represents the peak hourly level in the location of the park closest to the proposed replacement bridge. During quieter hours of the day and at locations further from the bridge, levels would be lower and would likely be in the acceptable range for open space uses. Furthermore, based on the results of noise level measurements, railroad noise is already the dominant noise source at this receptor, so the change in noise levels would not represent a change in the character of noise at the receptor. Consequently, the moderate impact predicted to occur at this receptor site with Alternative 9A would not constitute a significant adverse impact.
At receptor site 10, which is representative of residences immediately east of the rail ROW near Anderson Avenue in Havre de Grace, the noise exposure predicted for Alternative 9A would constitute a moderate impact but not a severe impact according to FTA and FRA noise impact criteria. The incremental change in noise level between Alternative 9A and the existing condition at this location would be 6.0 dBA, which would be considered readily noticeable. The total noise level predicted to occur at this receptor with Alternative 9A would be in the high 50s
8 Based on United States Department of Housing and Urban Development (HUD) noise
exposure standards as described in the HUD Noise Guidebook, March 2009. 9 Based on Federal Highway Administration (FHWA) Noise Abatement Criteria as shown in
Table 3-4 of the FTA guidance manual.
Chapter 14: Noise and Vibration
14-17
dBA, which is generally considered acceptable for residential uses1 and is comparable to or lower than existing noise levels measured at the other receptor sites in Havre de Grace as shown in Table 14-6. Furthermore, based on the results of noise level measurements, railroad noise is already the dominant noise source at this receptor, so the change in noise levels would not represent a change in the character of noise at the receptor. Consequently, the moderate impact predicted to occur at this receptor site with Alternative 9A would not constitute a significant adverse impact.
At receptor site 12, which is representative of residences in the vicinity of Oakington Road east of the rail ROW in Havre de Grace, the project noise exposure predicted for Alternative 9A would constitute a moderate impact but not a severe impact according to FTA noise impact criteria. However, the incremental change in noise level between Alternative 9A and existing condition at this location would be 3.3 dBA, which would be considered barely perceptible. Consequently, Alternative 9A would not result in any significant adverse noise impacts at this receptor site.
Based on the above discussion, Alternative 9A would not be expected to result in any significant adverse noise impacts.
ALTERNATIVE 9B
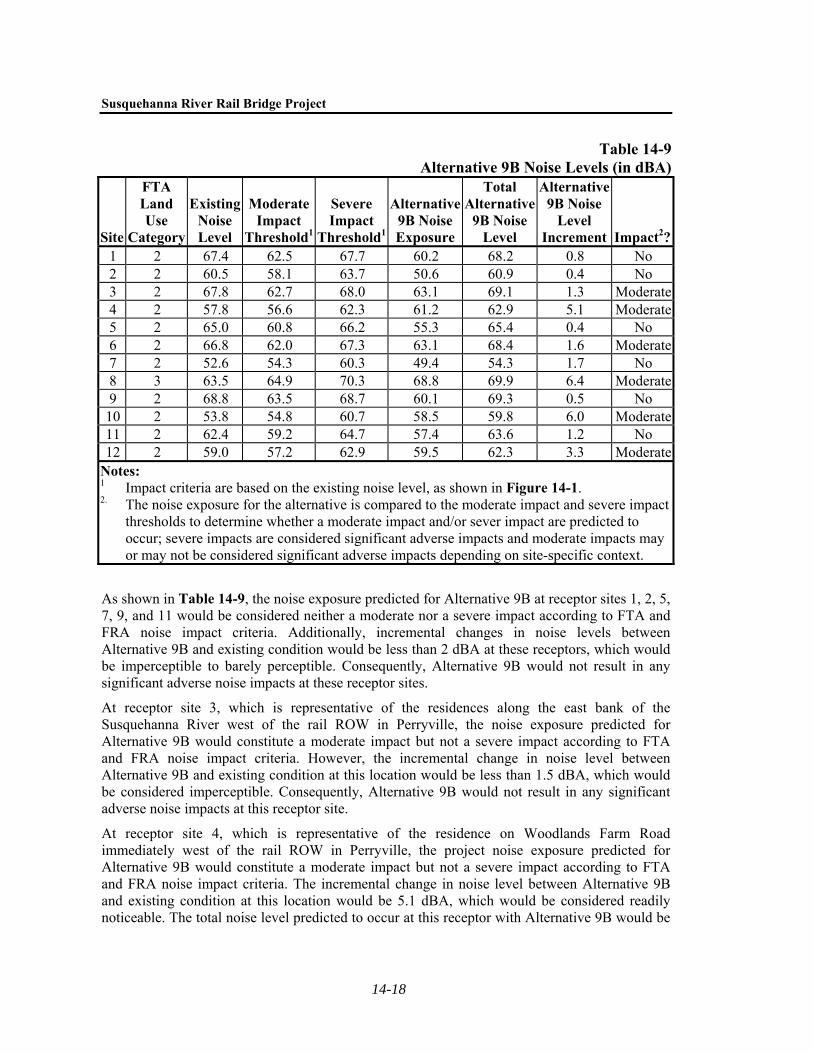
Alternative 9B would construct a new two-track 90 mph bridge to the west of the existing bridge and a second new two-track 160 mph bridge on the existing bridge alignment. The difference between Alternative 9A and Alternative 9B occurs in Havre de Grace along the east side of the corridor from Lewis Lane to the Susquehanna River. Alternative 9B improves the curve in Havre de Grace and would allow for a maximum speed of 150 mph. With this alternative, the volume and speed of train service (including Northeast Regional and Long Distance, Intercity Express, MARC Commuter, and freight) would increase within the study area as compared with the existing condition or the No Action Alternative. The potential effects of the proposed replacement bridge and increase in train volume and speed on noise levels at the receptors in the study area were analyzed using the methodology described above. As discussed, the train volumes considered for intercity rail assume implementation of the NEC FUTURE 2040 Build condition.10 Table 14-9 shows the noise levels and incremental change in noise levels for Alternative 9B. Noise levels shown for Alternative 9B in Table 14-9 are the sum of the rail noise component (calculated using the CREATE and HSR models) and the non-rail noise component (which is assumed to be the same level calculated for existing conditions). The Alternative 9B noise exposure is the level of noise produced by Alternative 9B, and is compared with the impact criteria to determine whether this alternative could potentially result in a noise impact. It is important to note that the analysis is based on rail traffic volumes that would not result solely from the Proposed Project, but represent the sum of proposed enhancements all along the NEC which enable the service levels assumed by NEC FUTURE.11
10 FRA, NEC FUTURE Tier I FEIS, December 2016. 11 NEC FUTURE forecasts are being used as a reasonable assumption but do not represent an
approved project, nor are these numbers included in the No Action condition.
Susquehanna River Rail Bridge Project
14-18
Table 14-9Alternative 9B Noise Levels (in dBA)
Site
FTA Land Use
Category
Existing Noise Level
Moderate Impact
Threshold1
Severe Impact
Threshold1
Alternative 9B Noise Exposure
Total Alternative
9B Noise Level
Alternative 9B Noise
Level Increment Impact2?
1 2 67.4 62.5 67.7 60.2 68.2 0.8 No 2 2 60.5 58.1 63.7 50.6 60.9 0.4 No 3 2 67.8 62.7 68.0 63.1 69.1 1.3 Moderate4 2 57.8 56.6 62.3 61.2 62.9 5.1 Moderate5 2 65.0 60.8 66.2 55.3 65.4 0.4 No 6 2 66.8 62.0 67.3 63.1 68.4 1.6 Moderate7 2 52.6 54.3 60.3 49.4 54.3 1.7 No 8 3 63.5 64.9 70.3 68.8 69.9 6.4 Moderate9 2 68.8 63.5 68.7 60.1 69.3 0.5 No
10 2 53.8 54.8 60.7 58.5 59.8 6.0 Moderate11 2 62.4 59.2 64.7 57.4 63.6 1.2 No 12 2 59.0 57.2 62.9 59.5 62.3 3.3 Moderate
Notes: 1 Impact criteria are based on the existing noise level, as shown in Figure 14-1. 2. The noise exposure for the alternative is compared to the moderate impact and severe impact
thresholds to determine whether a moderate impact and/or sever impact are predicted to occur; severe impacts are considered significant adverse impacts and moderate impacts may or may not be considered significant adverse impacts depending on site-specific context.
As shown in Table 14-9, the noise exposure predicted for Alternative 9B at receptor sites 1, 2, 5, 7, 9, and 11 would be considered neither a moderate nor a severe impact according to FTA and FRA noise impact criteria. Additionally, incremental changes in noise levels between Alternative 9B and existing condition would be less than 2 dBA at these receptors, which would be imperceptible to barely perceptible. Consequently, Alternative 9B would not result in any significant adverse noise impacts at these receptor sites.
At receptor site 3, which is representative of the residences along the east bank of the Susquehanna River west of the rail ROW in Perryville, the noise exposure predicted for Alternative 9B would constitute a moderate impact but not a severe impact according to FTA and FRA noise impact criteria. However, the incremental change in noise level between Alternative 9B and existing condition at this location would be less than 1.5 dBA, which would be considered imperceptible. Consequently, Alternative 9B would not result in any significant adverse noise impacts at this receptor site.
At receptor site 4, which is representative of the residence on Woodlands Farm Road immediately west of the rail ROW in Perryville, the project noise exposure predicted for Alternative 9B would constitute a moderate impact but not a severe impact according to FTA and FRA noise impact criteria. The incremental change in noise level between Alternative 9B and existing condition at this location would be 5.1 dBA, which would be considered readily noticeable. The total noise level predicted to occur at this receptor with Alternative 9B would be
Chapter 14: Noise and Vibration
14-19
in the low 60s dBA, which is generally considered acceptable for residential uses12 and is comparable to existing noise levels measured at the other receptor sites in Perryville as shown in Table 14-6. Furthermore, based on the results of noise level measurements, railroad noise is already the dominant noise source at this receptor, so the change in noise levels would not represent a change in the character of noise at the receptor. Consequently, the moderate impact predicted to occur at this receptor site with Alternative 9B would not constitute a significant adverse impact.
At receptor site 8, which is the David Craig Park, directly under the existing Susquehanna River Bridge in Havre de Grace, the noise exposure predicted for Alternative 9B would constitute a moderate impact but not a severe impact according to FTA and FRA noise impact criteria. The incremental change in noise level between Alternative 9B and existing condition at this location would be 6.4 dBA, which would be considered readily noticeable. The peak hourly noise level predicted to occur at this receptor with Alternative 9B would be 69.9 dBA, which is generally higher than recommended for open space uses13. However, this noise level represents the peak hourly level in the location of the park closest to the proposed replacement bridge. During quieter hours of the day and at locations further from the bridge, levels would be lower and would likely be in the acceptable range for open space uses. Furthermore, based on the results of noise level measurements, railroad noise is already the dominant noise source at this receptor, so the change in noise levels would not represent a change in the character of noise at the receptor. Consequently, the moderate impact predicted to occur at this receptor site with Alternative 9B would not constitute a significant adverse impact.
At receptor site 10, which is representative of residences immediately east of the rail ROW near Anderson Avenue in Havre de Grace, the project noise exposure predicted for Alternative 9B would constitute a moderate impact but not a severe impact according to FTA noise impact criteria. The incremental change in noise level between Alternative 9B and the existing condition at this location would be 6.0 dBA, which would be considered readily noticeable. The total noise level predicted to occur at this receptor with Alternative 9B would be in the high 50s dBA, which is generally considered acceptable for residential uses14 and is comparable to or lower than existing noise levels measured at the other receptor sites in Havre de Grace as shown in Table 14-6. Furthermore, based on the results of noise level measurements, railroad noise is already the dominant noise source at this receptor, so the change in noise levels would not represent a change in the character of noise at the receptor. Consequently, the moderate impact predicted to occur at this receptor site with Alternative 9B would not constitute a significant adverse impact.
At receptor site 12, which is representative of residences in the vicinity of Oakington Road east of the rail ROW in Havre de Grace, the noise exposure predicted for Alternative 9B would constitute a moderate impact but not a severe impact according to FTA noise impact criteria. However, the incremental change in noise level between Alternative 9B and existing condition at
12 Based on United States Department of Housing and Urban Development (HUD) noise
exposure standards as described in the HUD Noise Guidebook, March 2009. 13 Based on Federal Highway Administration (FHWA) Noise Abatement Criteria as shown in
Table 3-4 of the FTA guidance manual. 14 Based on U. S. Department of Housing and Urban Development (HUD) noise exposure
standards as described in the HUD Noise Guidebook, March 2009.
Susquehanna River Rail Bridge Project
14-20
this location would be 3.3 dBA, which would be considered barely perceptible. Consequently, Alternative 9B would not result in any significant adverse noise impacts at this receptor site.
Based on the above discussion, Alternative 9B would not be expected to result in any significant adverse noise impacts.
VIBRATION
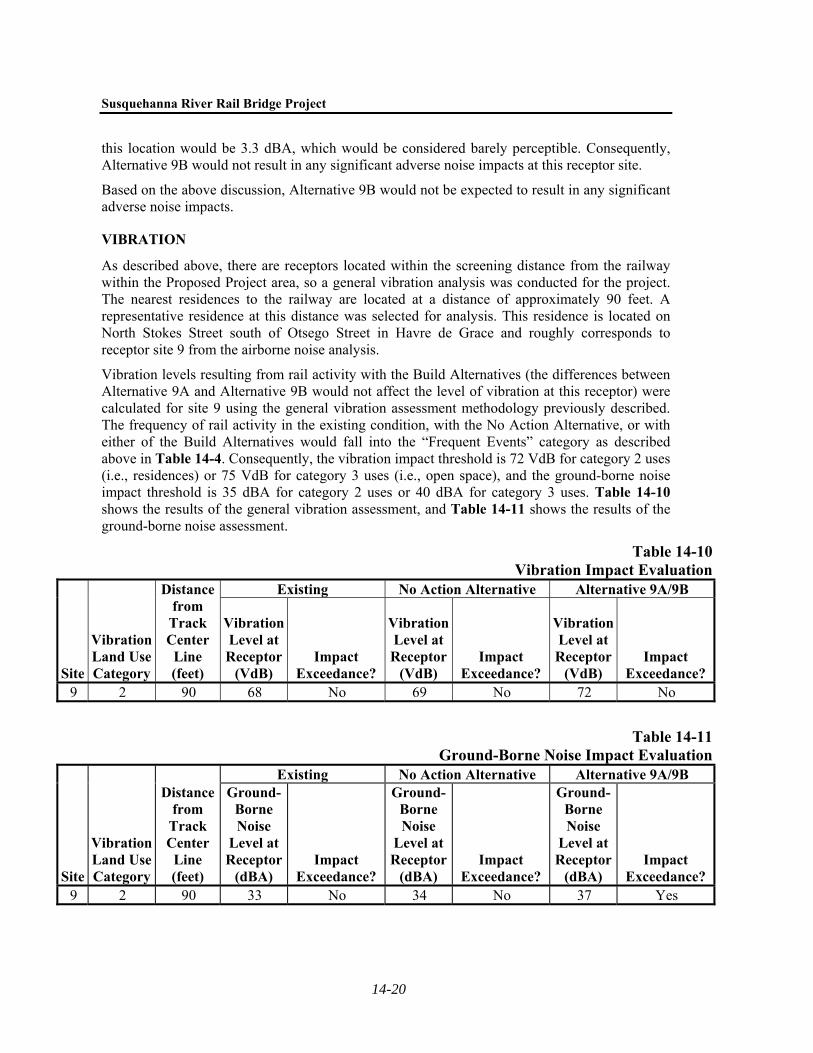
As described above, there are receptors located within the screening distance from the railway within the Proposed Project area, so a general vibration analysis was conducted for the project. The nearest residences to the railway are located at a distance of approximately 90 feet. A representative residence at this distance was selected for analysis. This residence is located on North Stokes Street south of Otsego Street in Havre de Grace and roughly corresponds to receptor site 9 from the airborne noise analysis.
Vibration levels resulting from rail activity with the Build Alternatives (the differences between Alternative 9A and Alternative 9B would not affect the level of vibration at this receptor) were calculated for site 9 using the general vibration assessment methodology previously described. The frequency of rail activity in the existing condition, with the No Action Alternative, or with either of the Build Alternatives would fall into the “Frequent Events” category as described above in Table 14-4. Consequently, the vibration impact threshold is 72 VdB for category 2 uses (i.e., residences) or 75 VdB for category 3 uses (i.e., open space), and the ground-borne noise impact threshold is 35 dBA for category 2 uses or 40 dBA for category 3 uses. Table 14-10 shows the results of the general vibration assessment, and Table 14-11 shows the results of the ground-borne noise assessment.
Table 14-10Vibration Impact Evaluation
Site
Vibration Land Use Category
Distance from
Track Center Line (feet)
Existing No Action Alternative Alternative 9A/9B
Vibration Level at Receptor
(VdB) Impact
Exceedance?
Vibration Level at Receptor
(VdB) Impact
Exceedance?
Vibration Level at Receptor
(VdB) Impact
Exceedance? 9 2 90 68 No 69 No 72 No
Table 14-11Ground-Borne Noise Impact Evaluation
Site
Vibration Land Use Category
Distance from
Track Center Line (feet)
Existing No Action Alternative Alternative 9A/9B Ground-
Borne Noise
Level at Receptor
(dBA) Impact
Exceedance?
Ground-Borne Noise
Level at Receptor
(dBA) Impact
Exceedance?
Ground-Borne Noise
Level at Receptor
(dBA) Impact
Exceedance? 9 2 90 33 No 34 No 37 Yes
Chapter 14: Noise and Vibration
14-21
As shown in Table 14-10, the predicted level of vibration at site 9 would not exceed the vibration impact threshold in the No Action or either of the Build Alternatives. The level of vibration predicted to occur at the worst-case receptor location with the Build Alternatives would be right at the vibration impact threshold, but would not exceed the threshold. This receptor location represents the closest point at the closest residence to the railway. At other locations and other sensitive receptors, which would be located further from the railway, vibration levels would be lower and would consequently also not exceed the vibration impact threshold. Consequently, the Build Alternatives would not result significant adverse vibration impacts at any nearby receptors.
The Proposed Project in its operational condition would not have the potential to result in vibration at a level that could cause damage to nearby historic structures. As described above, vibration produced by the Proposed Project would not exceed the significant impact thresholds specified in the FTA guidance document's general assessment methodology. These impact thresholds are designed to avoid human annoyance and disruptions to human activity, and as such are substantially lower than those that could potentially result in building damage, even at historic structures. Because the impact thresholds are based on the more stringent criterion of human annoyance, damage to adjacent buildings is not specifically addressed in the FTA's general assessment methodology. However, since operational vibration resulting from the Proposed Project would not result in exceedances of the vibration impact criteria, it would not have the potential to result in vibration levels that could damage historic resources.
As shown in Table 14-11, the predicted level of ground-borne noise at site 9 would not exceed the ground-borne noise impact threshold in the No Action Alternative, and the predicted level of ground-borne noise with Alternative 9A, as well as with Alternative 9B, would be 37 dBA, which would exceed the ground-borne noise impact threshold for category 2 (i.e., residential) uses. However, while the predicted level of ground-borne noise would exceed the impact threshold, the predicted difference between the existing condition ground-borne noise level and the ground-borne noise level with the Build Alternatives would be 4 dBA, which would be considered a barely perceptible change in the level of ground-borne noise. Consequently, ground-borne noise produced by the Build Alternatives at site 9 would not constitute a significant adverse ground-borne noise impact. At other receptors located further from the railway, levels of ground-borne noise would be lower, and the Build Alternatives would also not result in a significant adverse impact.
Based on the above discussion, Alternative 9A and Alternative 9B would not be expected to result in any significant adverse vibration or ground-borne noise impacts.
Overall, the general noise analysis conducted according to FTA and FRA analysis guidance found that there would be the potential for a noise impact at five of the receptors. At these five receptors, moderate impacts were predicted to occur, but based on the incremental change in the noise levels, which would be considered imperceptible to readily noticeable, and considering the total noise levels with the Build Alternatives, which were in the typically acceptable range and comparable to existing levels measured in the surrounding area, these receptors were predicted not to experience significant adverse impacts. The general vibration and ground-borne noise analysis found that there would be no potential for exceedances of the vibration impact criteria, and that while the ground-borne noise level with the Build Alternatives would have the potential to exceed the ground-borne noise impact criteria, the change in ground-borne noise would be barely perceptible, and consequently the ground-borne noise would not constitute a significant adverse impact.
Susquehanna River Rail Bridge Project
14-22
Based on the conclusion that the Build Alternatives would not have the potential to result in significant adverse impacts relating to airborne noise, vibration, or ground-borne noise at any of the analyzed receptor sites, and that these receptor sites represent the sites closest to the railway having the greatest potential to experience noise and vibration impacts as a result of the Build Alternatives, the Build Alternatives would not be expected to result in any significant adverse impacts related to noise or vibration.