chapter 13 mass spectrometry and infrared · pdf file• mass spectrometry is a technique...
TRANSCRIPT
1
Chapter 13
Mass Spectrometry and Infrared Spectroscopy
Copyright © 2011 The McGraw-Hill Companies, Inc. Permission required for reproduction or display.

2
• Mass spectrometry is a technique used for measuring the molecular weight, which can be helpful in determining the molecular formula of an organic compound.
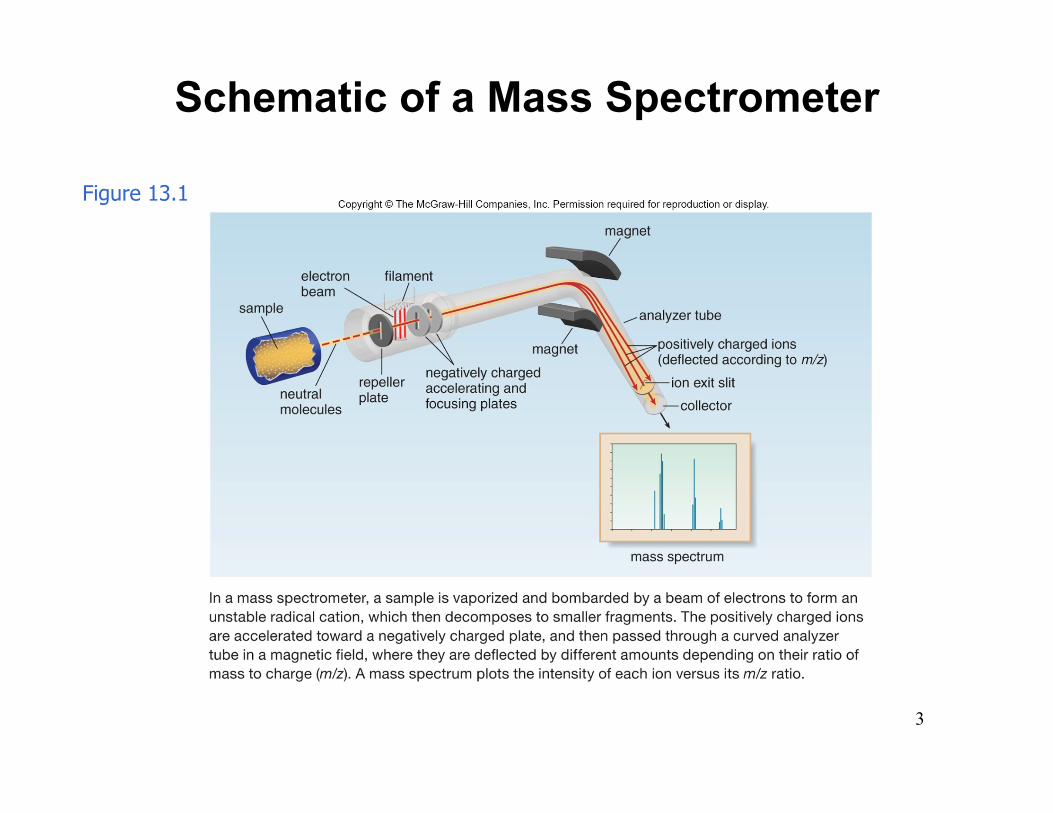
• In one type of mass spectrometer, a molecule is ionized by bombardment with a beam of high-energy electrons.
• The energy of the electrons is ~ 1600 kcal (or 70 eV).
• Since it takes ~ 100 kcal of energy to cleave a typical σ bond, 1600 kcal is an enormous amount of energy to come into contact with a molecule.
• The electron beam ionizes the molecule by causing it to eject an electron.
Overview of Mass Spectrometry
3
Schematic of a Mass Spectrometer
Figure 13.1
4
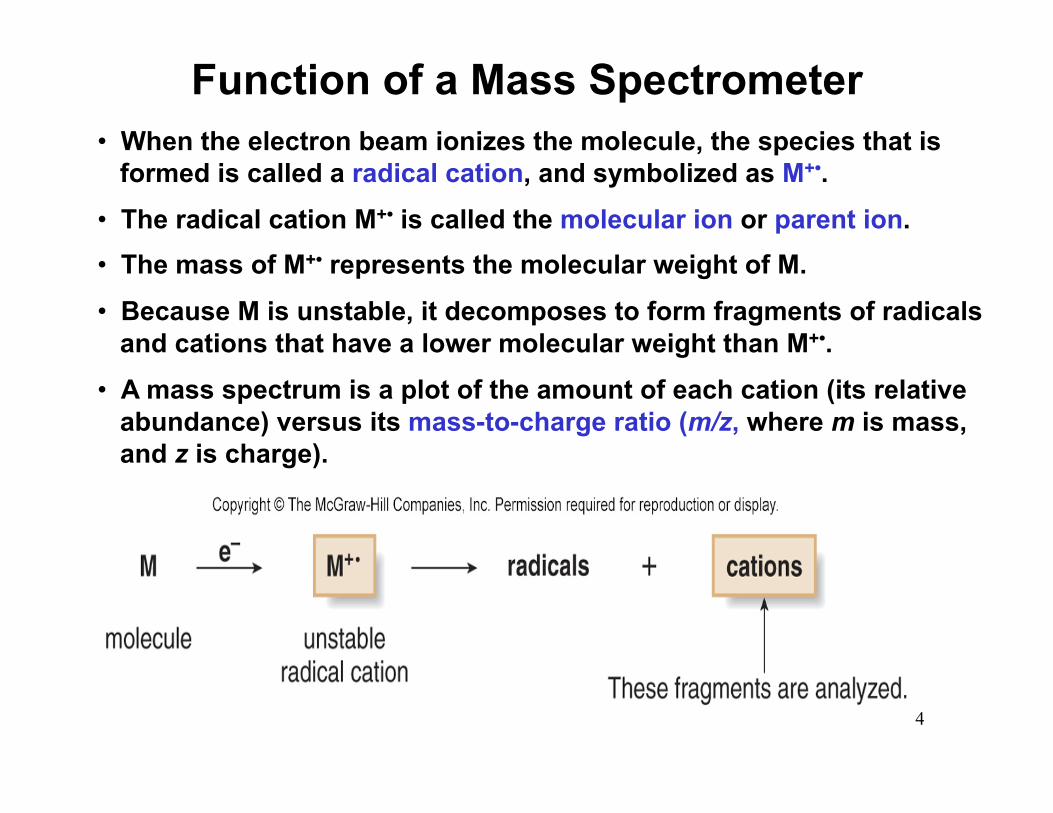
• When the electron beam ionizes the molecule, the species that is formed is called a radical cation, and symbolized as M+•.
• The radical cation M+• is called the molecular ion or parent ion. • The mass of M+• represents the molecular weight of M.
• Because M is unstable, it decomposes to form fragments of radicals and cations that have a lower molecular weight than M+•.
• A mass spectrum is a plot of the amount of each cation (its relative abundance) versus its mass-to-charge ratio (m/z, where m is mass, and z is charge).
Function of a Mass Spectrometer

5
• The tallest peak in the mass spectrum is called the base peak. • For methane the base peak is also the M peak (molecular ion),
although this is usually not the case. • Though most C atoms have an atomic mass of 12, 1.1% have a
mass of 13. • Thus, 13CH4 is responsible for the peak at m/z = 17. This is called
the M + 1 peak.
Understanding Mass Spectra

6
• The mass spectrum of CH4 consists of more peaks than just the M peak.
• Since the molecular ion is unstable, it fragments into other cations and radical cations containing one, two, three, or four fewer hydrogen atoms than methane itself.
• Thus, the peaks at m/z 15, 14, 13, and 12 are due to these lower molecular weight fragments.
Peaks in a Mass Spectrum

7
Figure 13.2
Mass Spectrum of Hexane • The molecular ion for hexane is at m/z = 86. • A small M + 1 peak occurs at m/z = 87. • The base peak occurs at m/z = 57 (C4H9
+). • Major fragment peaks also occur at 43 (C3H7
+) and 29 (C2H5+).
8
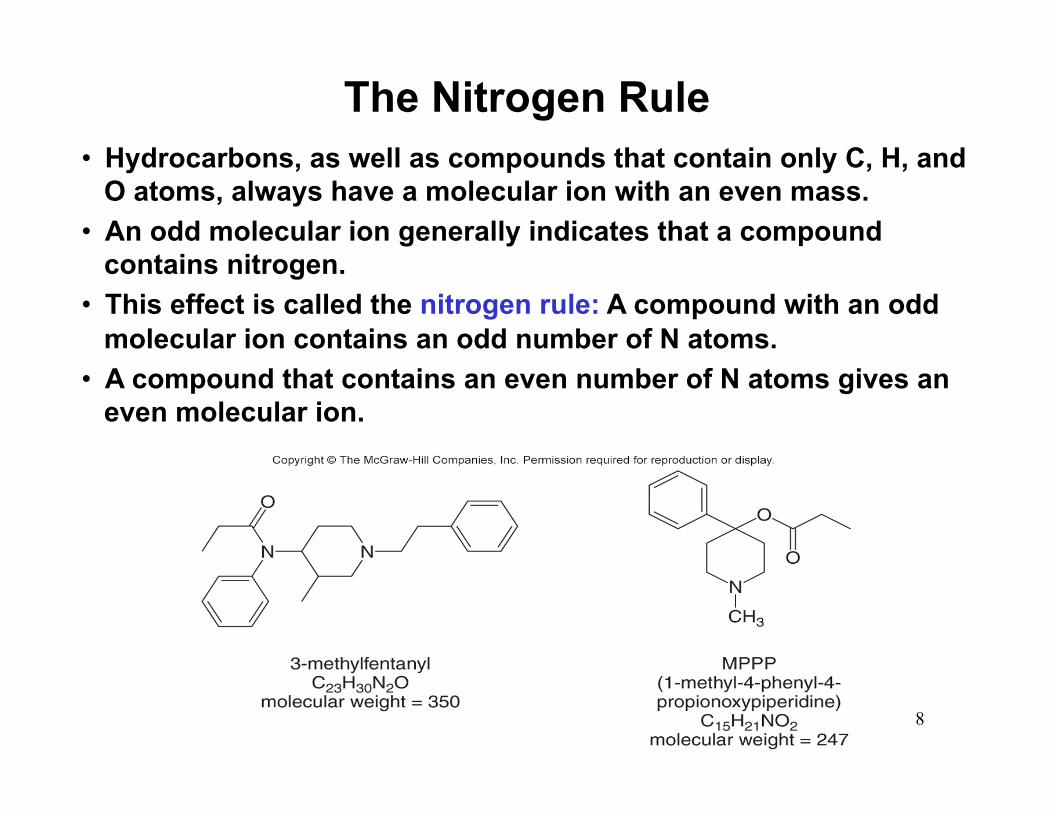
• Hydrocarbons, as well as compounds that contain only C, H, and O atoms, always have a molecular ion with an even mass.
• An odd molecular ion generally indicates that a compound contains nitrogen.
• This effect is called the nitrogen rule: A compound with an odd molecular ion contains an odd number of N atoms.
• A compound that contains an even number of N atoms gives an even molecular ion.
The Nitrogen Rule
9
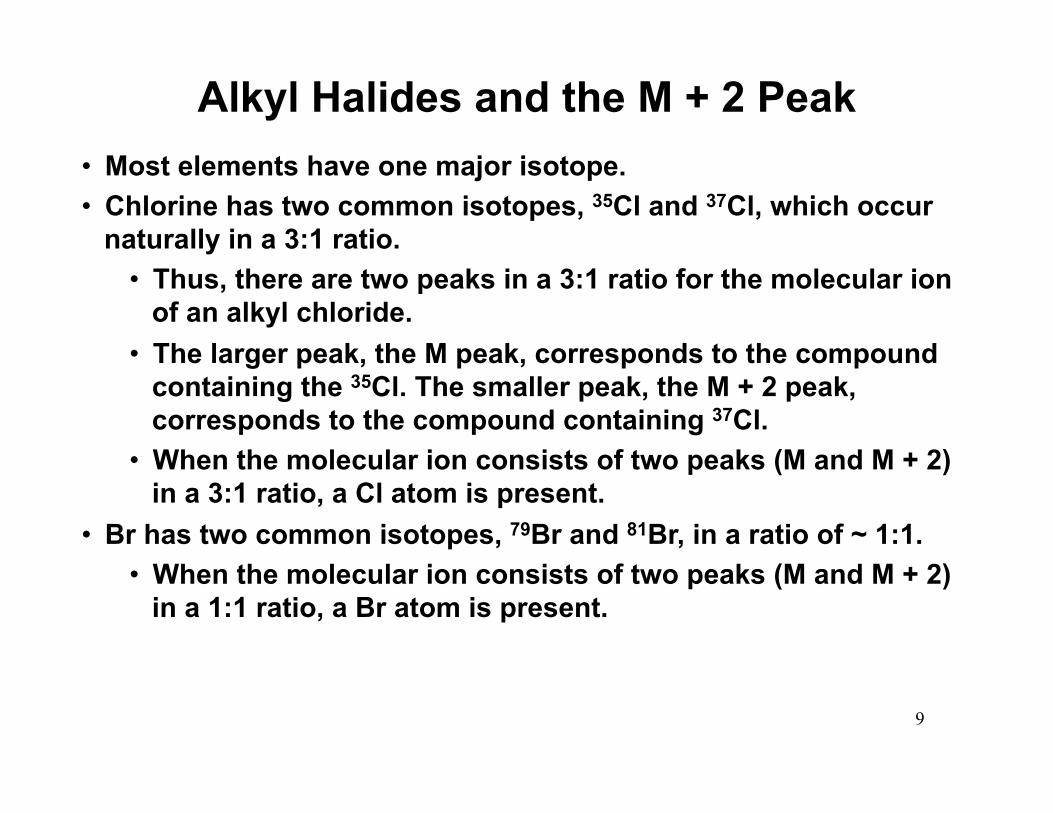
• Most elements have one major isotope. • Chlorine has two common isotopes, 35Cl and 37Cl, which occur
naturally in a 3:1 ratio. • Thus, there are two peaks in a 3:1 ratio for the molecular ion
of an alkyl chloride. • The larger peak, the M peak, corresponds to the compound
containing the 35Cl. The smaller peak, the M + 2 peak, corresponds to the compound containing 37Cl.
• When the molecular ion consists of two peaks (M and M + 2) in a 3:1 ratio, a Cl atom is present.
• Br has two common isotopes, 79Br and 81Br, in a ratio of ~ 1:1. • When the molecular ion consists of two peaks (M and M + 2)
in a 1:1 ratio, a Br atom is present.
Alkyl Halides and the M + 2 Peak

10
Figure 13.3
Mass Spectrum of 2-Chloropropane

11
Figure 13.4
Mass Spectrum of 2-Bromopropane
12
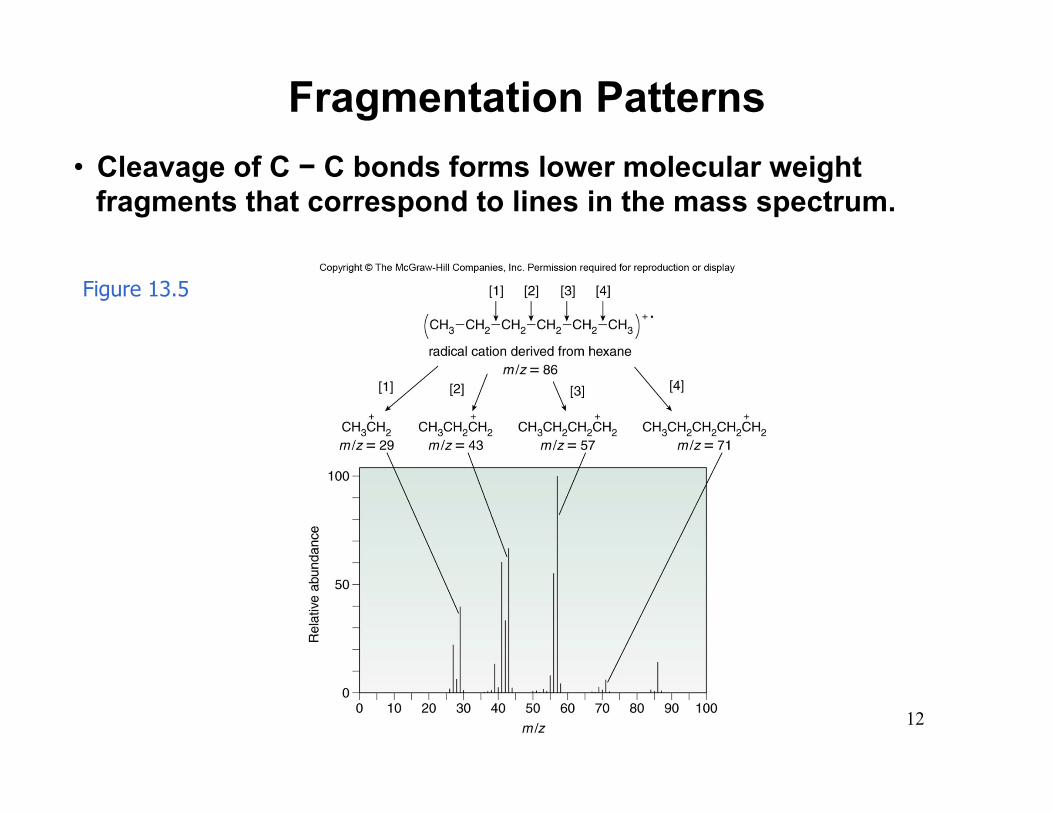
Fragmentation Patterns • Cleavage of C − C bonds forms lower molecular weight
fragments that correspond to lines in the mass spectrum.
Figure 13.5
13
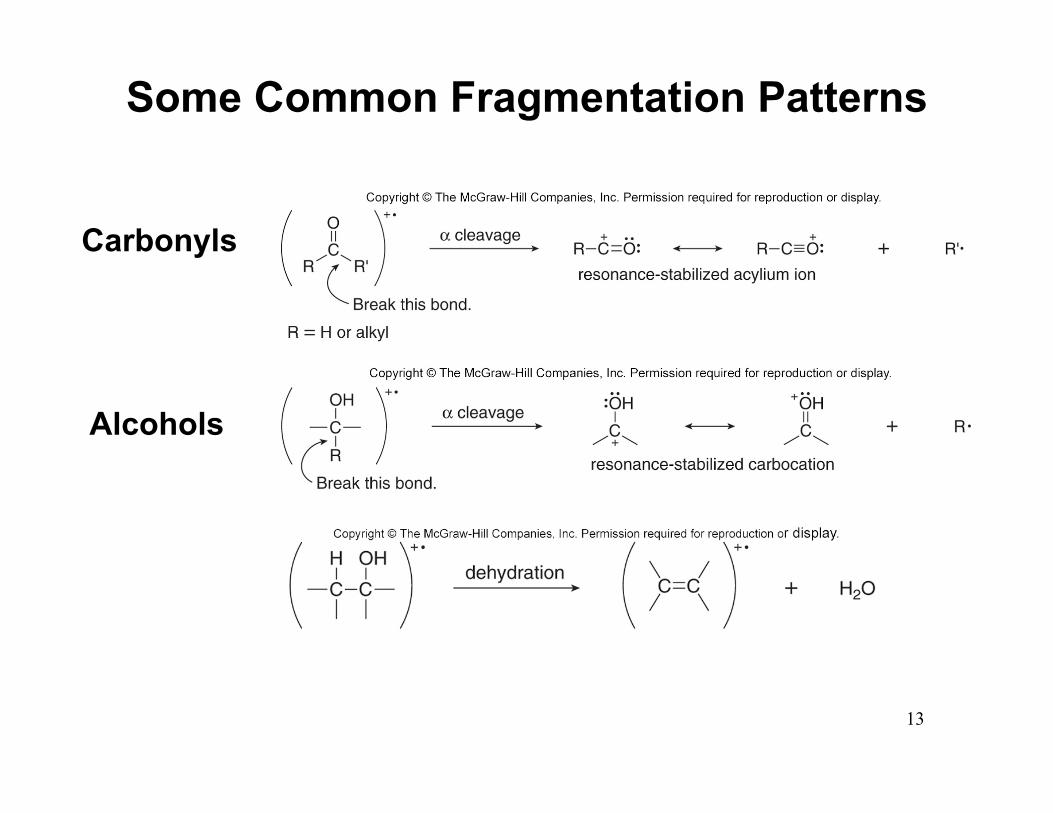
Some Common Fragmentation Patterns
Carbonyls
Alcohols

14
• Low resolution mass spectrometers report m/z values to the nearest whole number.
• Thus, the mass of a given molecular ion can correspond to many different molecular formulas.
• High resolution mass spectrometers measure m/z ratios to four (or more) decimal places.
• This is valuable because except for 12C whose mass is defined as 12.0000, the masses of all other nuclei are very close—but not exactly—whole numbers.
• Using the mass values of common nuclei, it is possible to determine the single molecular formula that gives rise to a molecular ion.
High Resolution Mass Spectrometers
15
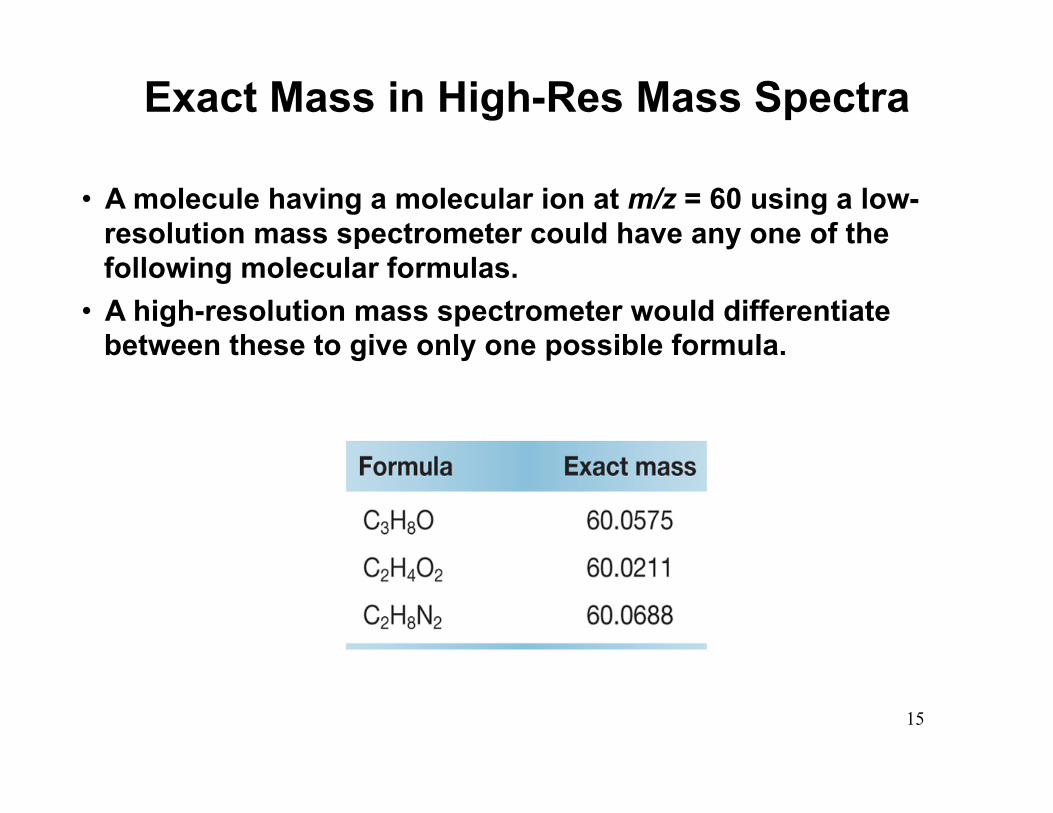
• A molecule having a molecular ion at m/z = 60 using a low-resolution mass spectrometer could have any one of the following molecular formulas.
• A high-resolution mass spectrometer would differentiate between these to give only one possible formula.
Exact Mass in High-Res Mass Spectra

16
• Electromagnetic radiation is radiant energy having dual properties of both waves and particles.
• Particles of electromagnetic radiation are called photons, and each has a discrete amount of energy called a quantum.
• Electromagnetic radiation can be characterized by its wavelength and frequency.
• Wavelength (λ) is the distance from one point on a wave to the same point on an adjacent wave.
• Frequency (ν) is the number of waves passing per unit time. It is reported in cycles per second (s−1), which is also called hertz (Hz).
Electromagnetic Radiation
17
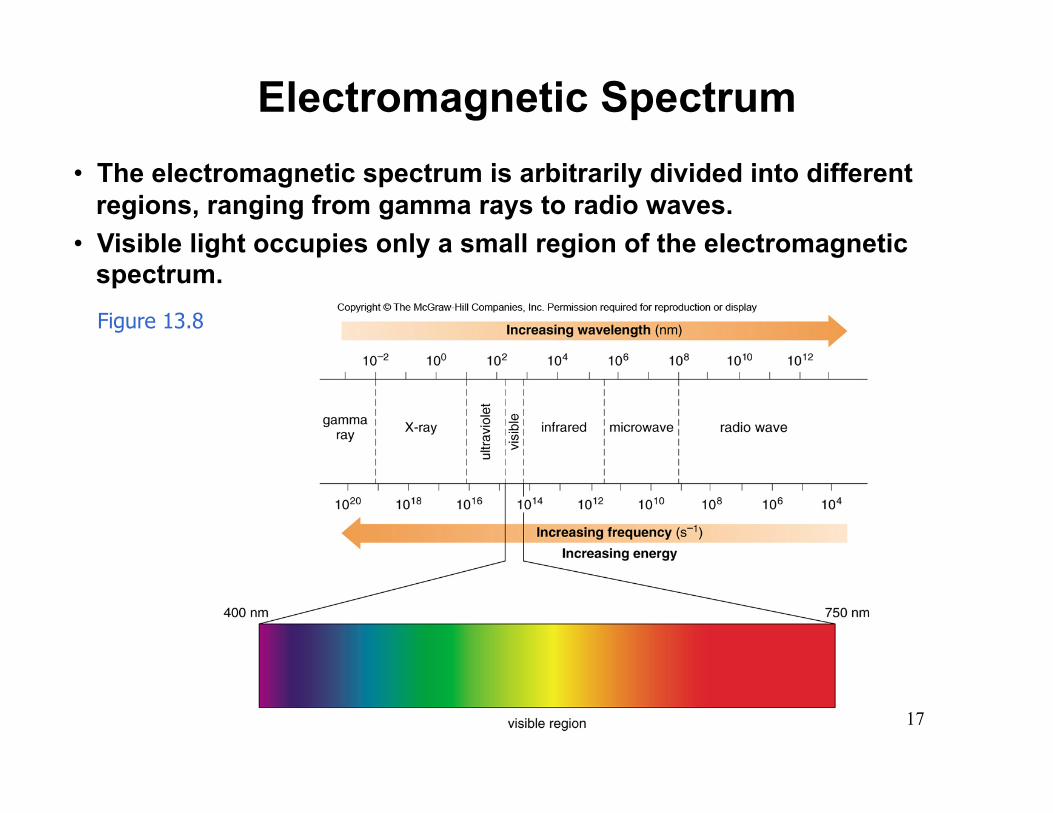
• The electromagnetic spectrum is arbitrarily divided into different regions, ranging from gamma rays to radio waves.
• Visible light occupies only a small region of the electromagnetic spectrum. Figure 13.8
Electromagnetic Spectrum
18
Properties of Electromagnetic Radiation
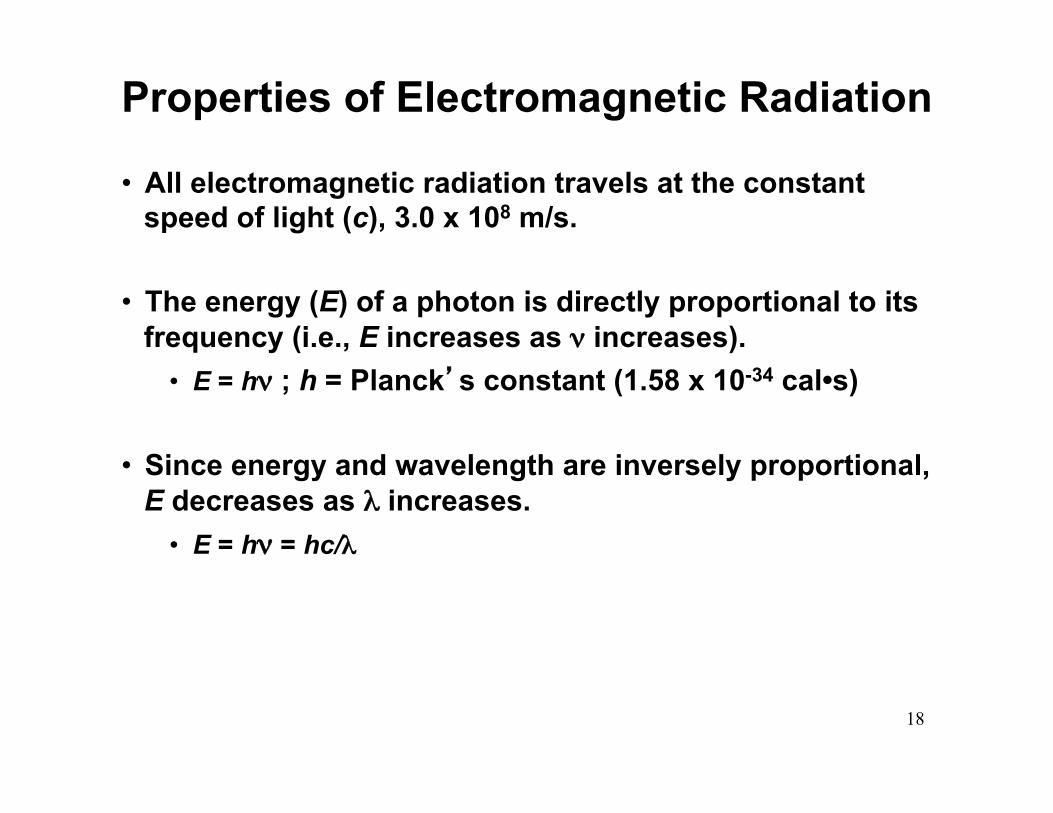
• All electromagnetic radiation travels at the constant speed of light (c), 3.0 x 10⁸ m/s.
• The energy (E) of a photon is directly proportional to its
frequency (i.e., E increases as ν increases). • E = hν ; h = Planck’s constant (1.58 x 10⁻³⁴ cal•s)
• Since energy and wavelength are inversely proportional, E decreases as λ increases.
• E = hν = hc/λ
19
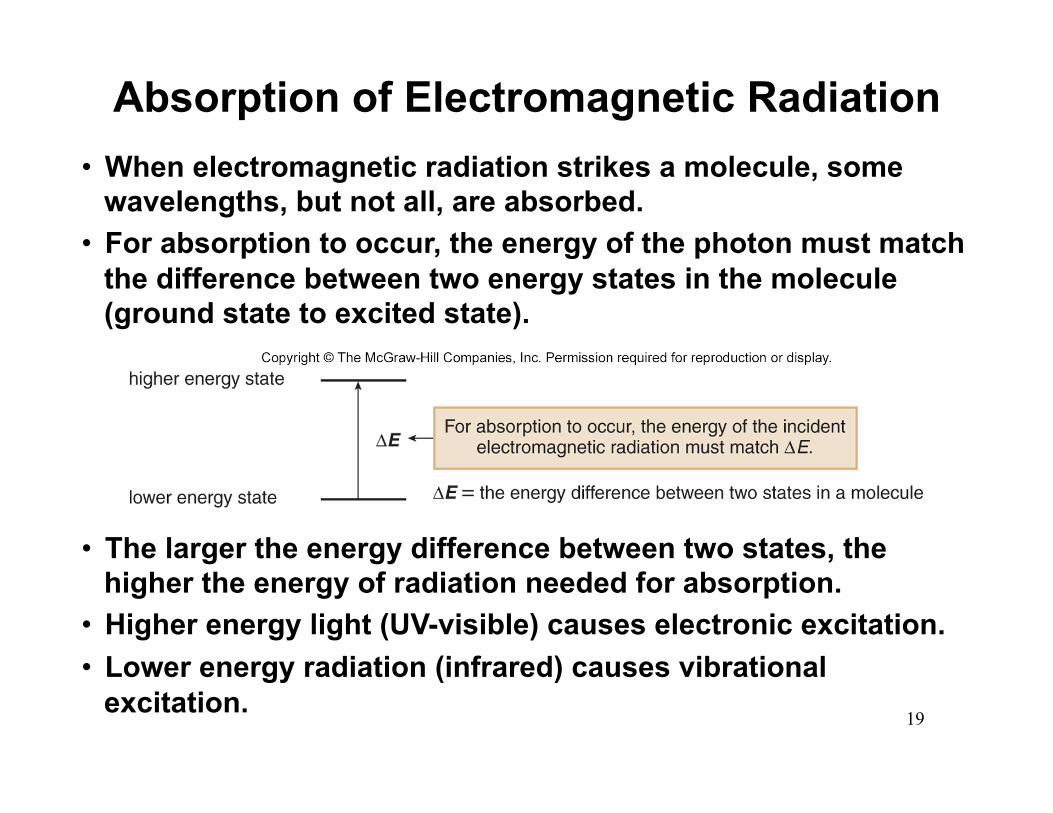
• When electromagnetic radiation strikes a molecule, some wavelengths, but not all, are absorbed.
• For absorption to occur, the energy of the photon must match the difference between two energy states in the molecule (ground state to excited state).
• The larger the energy difference between two states, the higher the energy of radiation needed for absorption.
• Higher energy light (UV-visible) causes electronic excitation. • Lower energy radiation (infrared) causes vibrational
excitation.
Absorption of Electromagnetic Radiation
20
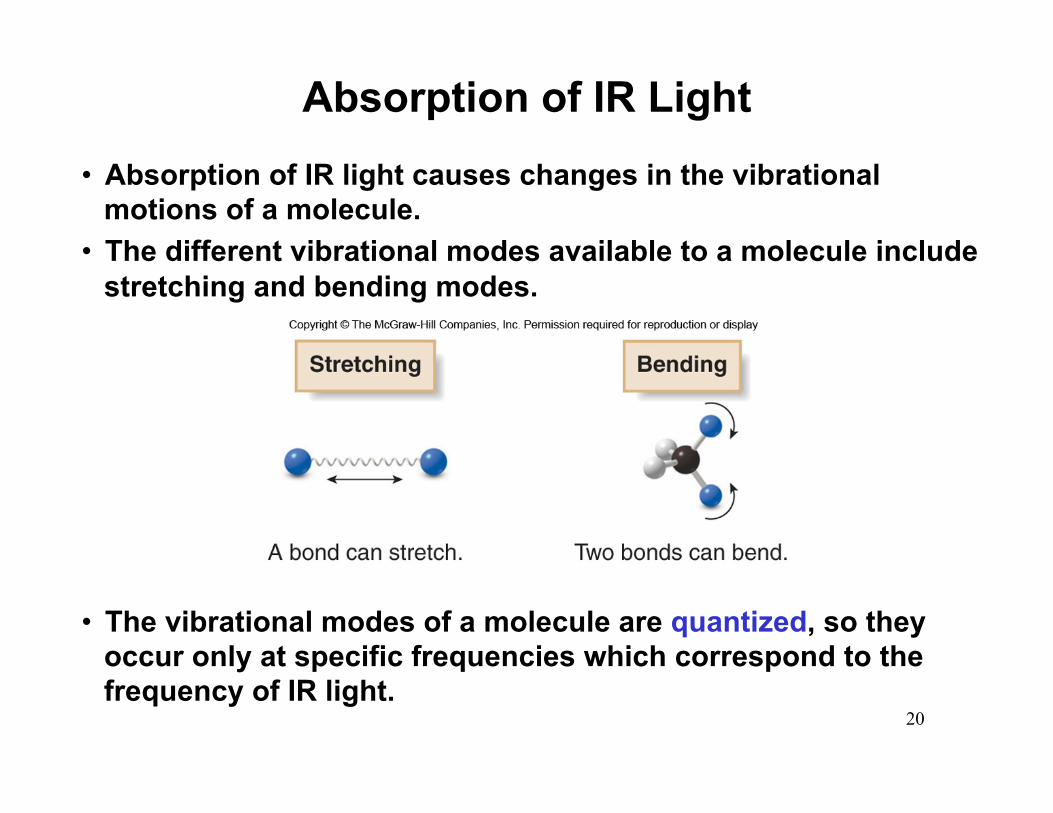
• Absorption of IR light causes changes in the vibrational motions of a molecule.
• The different vibrational modes available to a molecule include stretching and bending modes.
• The vibrational modes of a molecule are quantized, so they occur only at specific frequencies which correspond to the frequency of IR light.
Absorption of IR Light
21
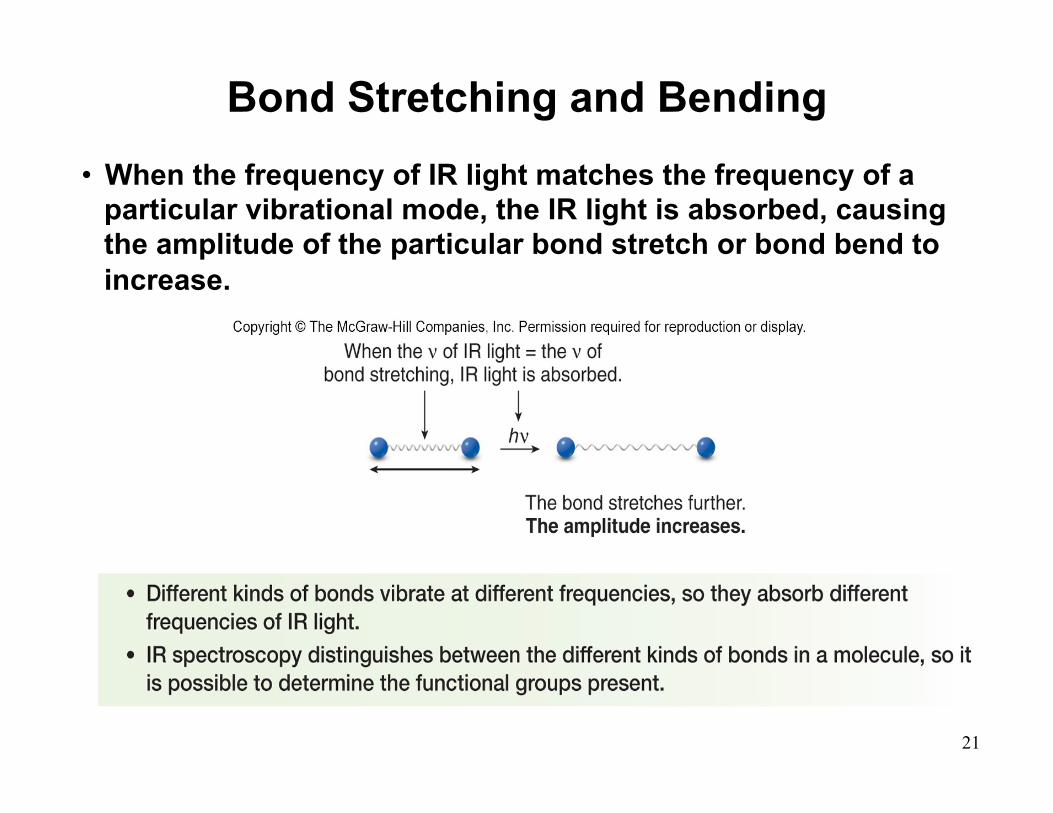
• When the frequency of IR light matches the frequency of a particular vibrational mode, the IR light is absorbed, causing the amplitude of the particular bond stretch or bond bend to increase.
Bond Stretching and Bending

22
• In an IR spectrometer, light passes through a sample. • Frequencies that match the vibrational frequencies are absorbed,
and the remaining light is transmitted to a detector. • An IR spectrum is a plot of the amount of transmitted light versus
its wavenumber. • Most bonds in organic molecules absorb in the region of 4000 cm−1
to 400 cm−1.
Characteristics of an IR Spectrum
23
• The x-axis is reported in frequencies using a unit called wavenumbers (ν).
• Wavenumbers are inversely proportional to wavelength and reported in reciprocal centimeters (cm–1).
• The y-axis is % transmittance: 100% transmittance means that all the light shone on a sample is transmitted and none is absorbed.
• 0% transmittance means that none of the light shone on the sample is transmitted and all is absorbed.
• Each peak corresponds to a particular kind of bond, and each bond type (such as O − H and C − H) occurs at a characteristic frequency.
• Infrared (IR) spectroscopy is used to identify what bonds and what functional groups are in a compound.
Characteristics of an IR Spectrum
24
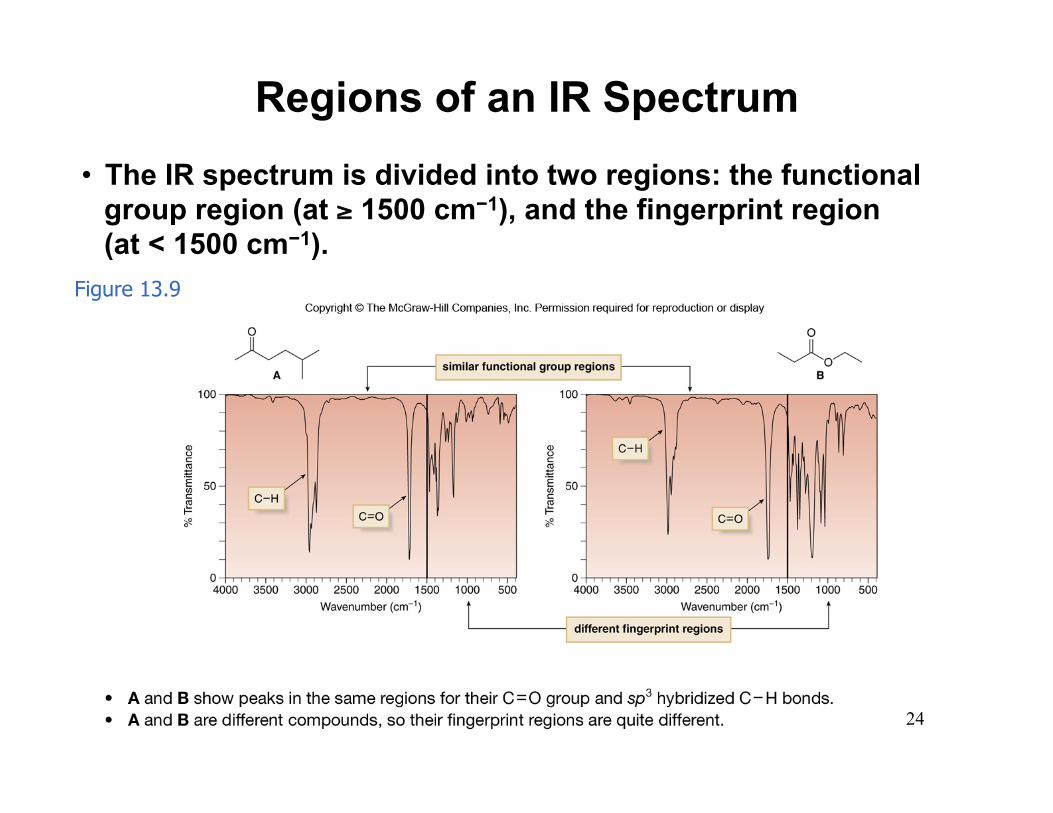
• The IR spectrum is divided into two regions: the functional group region (at ≥ 1500 cm−1), and the fingerprint region (at < 1500 cm−1).
Figure 13.9
Regions of an IR Spectrum
25
• Where a particular bond absorbs in the IR depends on bond strength and atom mass.
• Stronger bonds (i.e., triple > double > single) vibrate at a higher frequency, so they absorb at higher wavenumbers.
• Bonds with lighter atoms vibrate at higher frequency, so they absorb at higher wavenumbers.
Bonds and IR Absorption
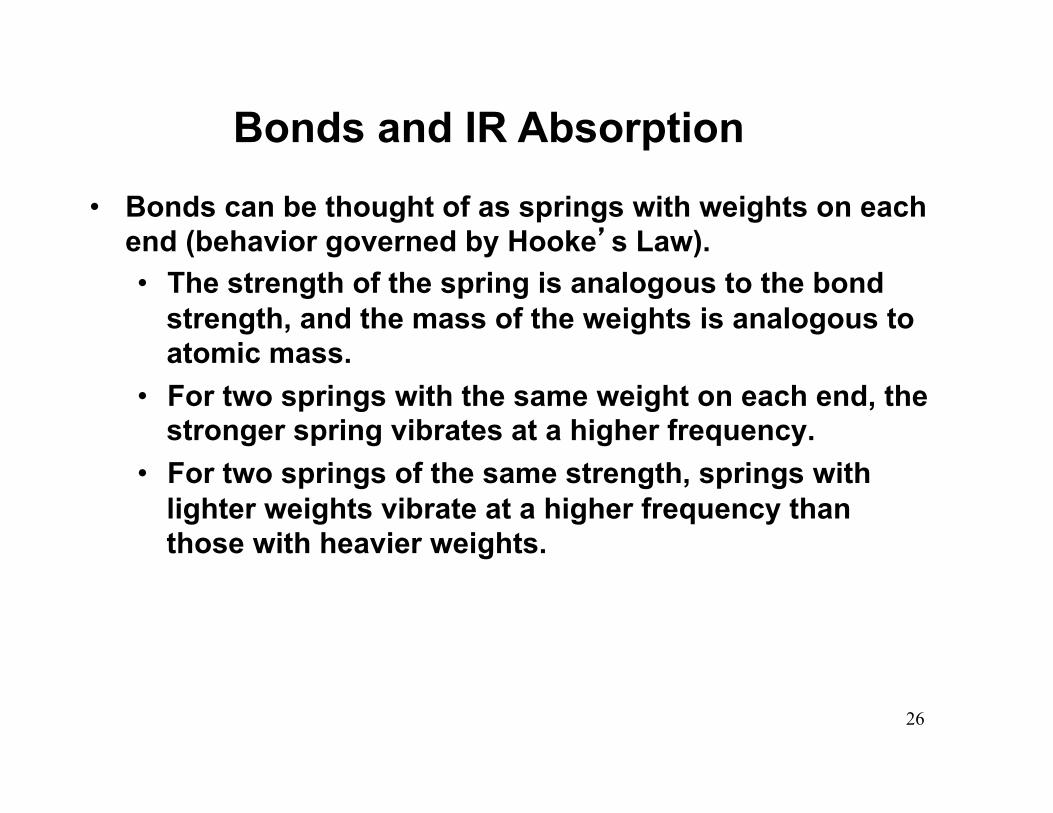
• Bonds can be thought of as springs with weights on each end (behavior governed by Hooke’s Law). • The strength of the spring is analogous to the bond
strength, and the mass of the weights is analogous to atomic mass.
• For two springs with the same weight on each end, the stronger spring vibrates at a higher frequency.
• For two springs of the same strength, springs with lighter weights vibrate at a higher frequency than those with heavier weights.
Bonds and IR Absorption
26

27
• Hooke’s Law describes the relationship of frequency to mass and bond length.
Figure 13.10
Hooke’s Law

28
• Bonds absorb in four predictable regions of an IR spectrum.
Figure 13.11
Four Regions of an IR Spectrum

29

30
• Even subtle differences that affect bond strength affect the frequency of an IR absorption.
• The higher the percent s-character, the stronger the bond and the higher the wavenumber of absorption.
Bond Strength and % s-Character

31
• For a bond to absorb in the IR, there must be a change in dipole moment during the vibration.
• Symmetrical nonpolar bonds do not absorb in the IR. This type of vibration is said to be IR inactive.
Symmetry and IR Absorption

32
• Hexane has only C−C single bonds and sp3 hybridized C atoms.
• Therefore, it has only one major absorption at 3000-2850 cm−1.
IR Absorptions in Hydrocarbons
33
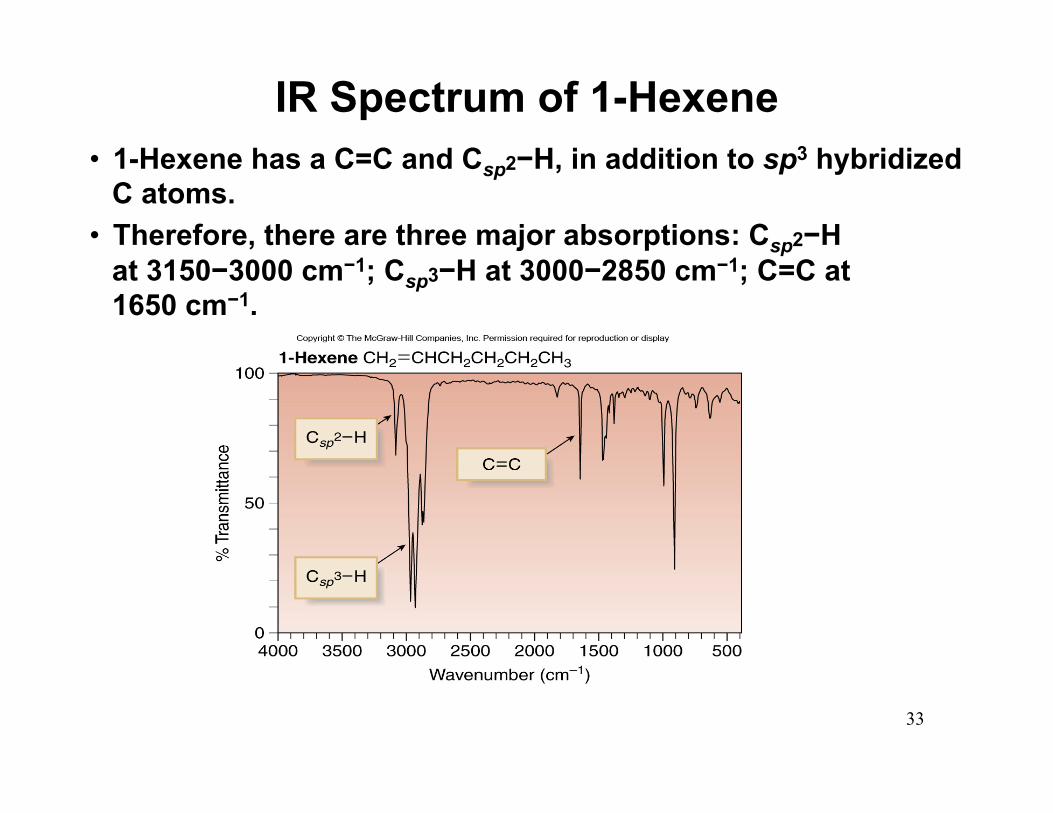
• 1-Hexene has a C=C and Csp2−H, in addition to sp3 hybridized C atoms.
• Therefore, there are three major absorptions: Csp2−H at 3150−3000 cm−1; Csp3−H at 3000−2850 cm−1; C=C at 1650 cm−1.
IR Spectrum of 1-Hexene

34
• 1-Hexyne has a C≡C and Csp−H, in addition to sp3 hybridized C atoms.
• Therefore, there are three major absorptions: Csp−H at 3300 cm−1; Csp3−H at 3000−2850 cm−1; C≡C at 2250 cm−1.
IR Spectrum of 1-Hexyne

35
• The OH group of the alcohol shows a strong absorption at 3600-3200 cm−1.
• The peak at ~ 3000 cm−1 is due to sp3 hybridized C−H bonds.
IR Spectrum of 2-Butanol
36
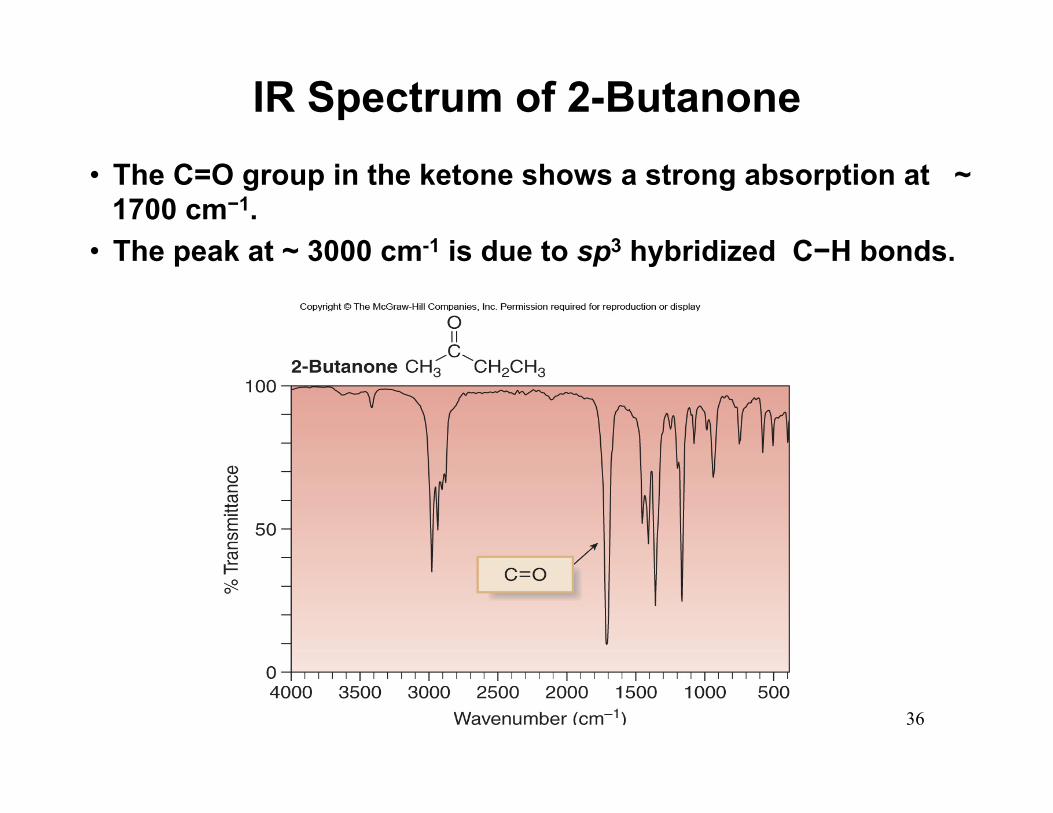
• The C=O group in the ketone shows a strong absorption at ~ 1700 cm−1.
• The peak at ~ 3000 cm-1 is due to sp3 hybridized C−H bonds.
IR Spectrum of 2-Butanone

37
• The ether has neither an OH or a C=O, so its only absorption above 1500 cm−1 occurs at ~ 3000 cm−1, due to sp3 hybridized C−H bonds.
IR Spectrum of Diethyl Ether

38
• The N−H bonds in the amine give rise to two weak absorptions at 3300 and 3400 cm−1.
IR Spectrum of Octylamine

39
• The amide exhibits absorptions above 1500 cm−1 for both its N−H and C=O groups: N−H (two peaks) at 3200 and 3400 cm−1; C=O at 1660 cm−1.
IR Spectrum of Propanamide

40
• The C≡N of the nitrile absorbs in the triple bond region at ~ 2250 cm−1.
IR Spectrum of Octanenitrile
41
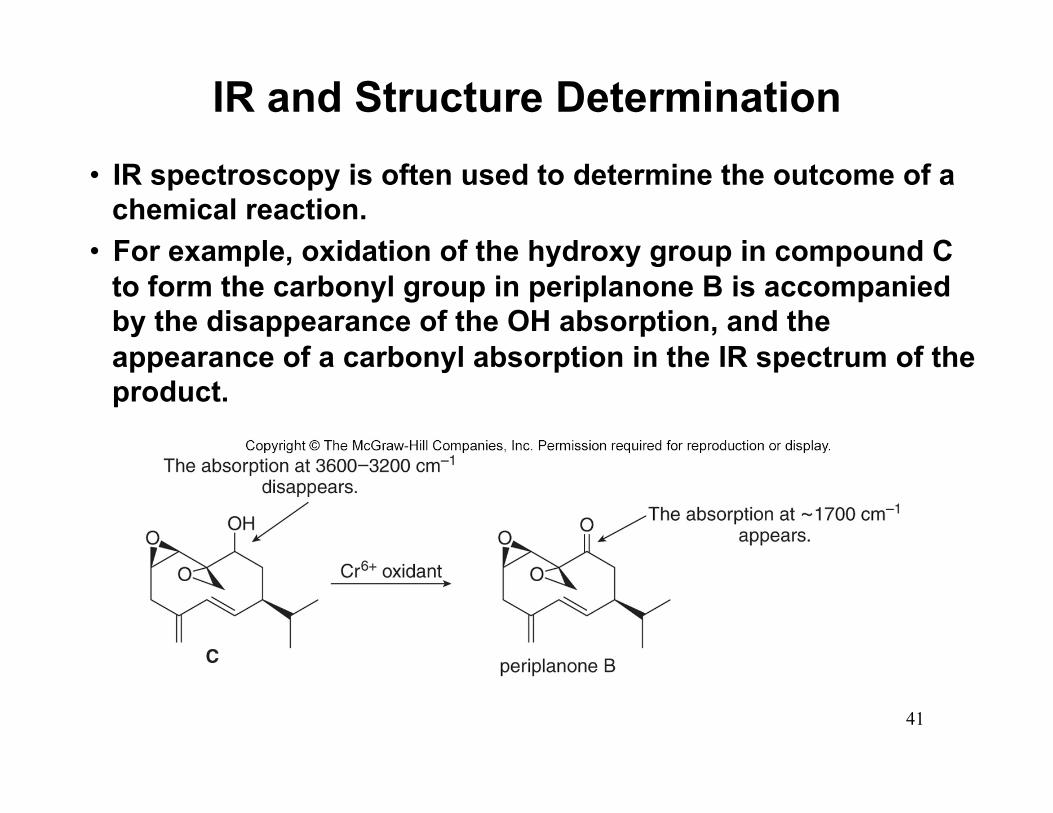
• IR spectroscopy is often used to determine the outcome of a chemical reaction.
• For example, oxidation of the hydroxy group in compound C to form the carbonyl group in periplanone B is accompanied by the disappearance of the OH absorption, and the appearance of a carbonyl absorption in the IR spectrum of the product.
IR and Structure Determination

42
Using MS and IR for Structure Determination
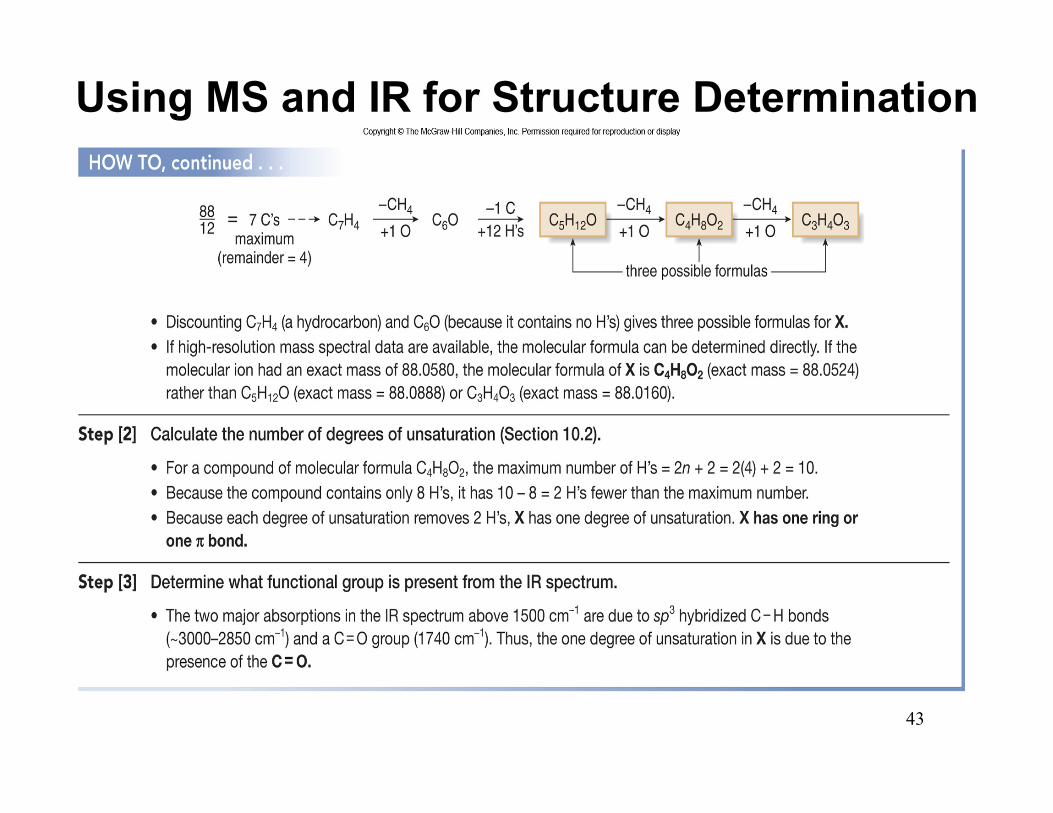
43
Using MS and IR for Structure Determination

Solving IR problems
1. Check the region around 3000 cm-1
2. Is there a strong, broad band in the region of 3500 cm-1
If yes, OH, COOH or NH2 3. Is there a sharp peak in the region around 1700 cm-1?
If yes, C=O 4. Is there a peak in the region around 1630 cm-1?
If yes, C=C 5. Be aware that symmetrical alkynes and alkenes do not give
IR absorbance

or

or OH

OHor
A B
O
