chapter 1.2. the effects of the covid-19 pandemic on …
TRANSCRIPT
CHAPTER 1.2.
THE EFFECTS OF THE COVID-19 PANDEMIC ON THE EXCHANGE RATES OF
THE FRAGILE SEVEN COUNTRIES
Hülya DENİZ KARAKOYUN*
*Assist. Prof. PhD., Istanbul University, Faculty of Economics, Department of Economics, Istanbul, Turkeye-mail: [email protected]
DOI: 10.26650/B/SS10.2020.016.02
Abstract
This study aims to analyze the exchange rate fluctuations in seven fragile emerging market economies (EMEs), with similar macroeconomic structure characteristics such as a high short-term external debt, low official international reserves, and dependency on foreign capital inflows, underlined by the IMF at the onset of the COVID-19 crisis. After the COVID-19 outbreak, the first sudden impact of uncertainties appeared on the portfolio outflows from EMEs. The spillover effect of the excess liquidity through unconventional expansionary monetary policy and helicopter money created by the expansionary monetary policy by the FED did not lead to any repeating portfolio flows from advanced economies to EMEs, contrary to the Global Financial Crisis of 2008-2009. Thus, the risk-off sentiment of investors led to capital reversals, which in turn, brought about the sudden depreciation of many emerging market currencies. However, differences in the size and time of depreciation rates raise a question about the relative importance of push and pull factors on the fluctuations in these currencies. From this point of view, the research found out that push factors like the Volatility Index (VIX) affect national currency immediately and adversely. In contrast, the effects of the pull factors on exchange rates are asymmetrical. In this setting, good economic performance helps to mitigate depreciation while the bad indicators accelerate this depreciation in the currency.
Keywords: Sudden stop, exchange rate depreciation, fragile seven, emerging market economies, COVID-19.
THE COVID-19 PANDEMIC: GLOBAL RISKS AND UNCERTAINTIES

THE EFFECTS OF THE COVID-19 PANDEMIC ON THE EXCHANGE RATES OF THE FRAGILE SEVEN COUNTRIES22
1. Introduction
Although the COVID-19 pandemic occurred on December 29th, 2019, its cost to the world economy started to appear after 11st of March 2020. It simultaneously caused health and economic crisis affecting the entire world. It is such a severe financial crisis that international organizations like the International Monetary Fund (IMF), World Bank (WB), and Organization of Economic Corporation and Development (OECD) have revised their growth forecasts for the 2020 downside more than once since the end of 2019. Comparing this to the cost of the Great Financial Crisis (GFC) of 2008 for the world economy and country groups, it is a crisis where expectations diversify dramatically from the former, and economic relief packages announced by almost all governments were multiplied in the line with this fact.
COVID 19’s effect in all countries is monitored by quarterly growth data or monthly Purchasing Managers’ Index (PMI). For example, the PMI was around 51 in China, Japan, and France before the pandemic, but after that it plunged to 40, 29, and 31 levels respectively after the crisis, (IHS Markit, 2020). In addition to the direct cost of shutdowns in the service sector that requires face-to-face contact with the client, diminishing demand caused by decreasing income due to the shrinking employment market is a source of indirect cost. In addition to these, in developing countries another cost incurred by COVID-19 is the sudden stop of capital inflows. According to IIF statistics, net portfolio outflows reached a record high level of $83.3 billion from EMEs in March 2020 (IIF,2020). Thus, emerging economies with high foreign exchange (FX) denominated short-term external debt, decreasing international reserves, and current account deficit issue found themselves in a difficult position with capital flight.
The subject of this chapter is to discuss the risks coming from the sudden stop in capital movements due to COVID-19 on countries with similar macroeconomic structures, whom the IMF referred implicitly as the fragile seven in World Economic Outlook (WEO) April 2020. Moreover, the chapter will analyze how a sudden stop in COVID-19 diverges from previous sudden stops and whether it is a result of the fragility of these developing economies in their macroeconomic structure or the change in the risk sentiment of international investors in the market.
The chapter has five sections. The first section includes a literature review regarding how EMEs are dependent on foreign capital inflow, leading factors to a sudden stop, and how a sudden stop makes emerging markets fragile. The second section discusses the impact of the COVID-19 pandemic on global capital movements, and the risk of this impact for EMEs. The third section will address the macroeconomic situation in EMEs before COVID-19. This is

23Hülya DENİZ KARAKOYUN
followed by an evaluation of how a sudden stop influenced the foreign exchange rates in the fragile seven countries and which factors had more explanatory power on the prediction of capital outflow by descriptive and comparative methods. The fifth section concludes the chapter.
2. Literature Review
Global financial deepening has increased cross-border capital flows. In the early 1980s, when financial liberalization began, the global gross domestic product (GDP) was $10 trillion, while the financial stock exceeded $12 trillion (Altun & Mutan, 2007). However, this gap between real and financial stock rose in favor of financial stock, surpassing US$ 220 trillion (SIFMA, 2020) against $90 trillion in global GDP 2019 (WB, 2020). Thus, such an escalation in financial deepening, which grew from 109% to 250%, created a natural channel for the cross-border portfolio movement. At first, this movement concentrated on developed countries; then, progressively turned towards developing countries. For example, while 95% of the international capital flows moved among advanced economies such as the USA, the EU, and Japan until the 1990s, it started to flow to developing countries after 2005.
Figure 1: Net Private Capital Inflows (% of GDP)Source: Ahmed & Zlate, 2014
Figure 1 shows the net private capital inflows to EMEs between 2002 and 2013. While foreign direct investment had the largest share in total capital movements in the early 2000s, net outflows are observed in portfolio investment, and loans in the banking sector. Although net portfolio inflows to EMEs started in 2003, the continuity of this movement coincides with the post GFC. Since then, the largest share of the capital flows towards EMEs has shifted to the portfolio investment.
THE EFFECTS OF THE COVID-19 PANDEMIC ON THE EXCHANGE RATES OF THE FRAGILE SEVEN COUNTRIES24
In the global financial order, to compensate for their savings gap, foreign capital inflows appear to be a welcome alternative to developing countries as surging capital inflows increase the value of the national currency, create a credit boom with liquidity abundance, and accelerate the economic activity. However, when foreign capital inflow is unexpectedly fast, some negative consequences may occur. For instance, the escalation in capital inflow may create a bubble in asset prices, disrupt efficiency in resource allocation, and appreciate the national currency in a way that makes a deficit in foreign trade (Forbes & Warnock, 2020). However, the opposite situation is no less dangerous. If net foreign capital leaves a country rapidly (Calvo, 1998) and unexpectedly, or there is a sudden stop in capital inflow to the country, financial crises might appear (Salas, Alaminos, Fernández, & López-Valverde, 2020), (Blanchard, Ostry, Ghosh, & Chamon, 2015). Indeed, the sudden stop in net capital inflows harms many macroeconomic variables. The initial and the fastest impact occurs in the depreciation of the national currency. Then, it causes a slowdown in economic activity in proportion to the dependence of the production structure of the country’s economy on imports. Additionally, it may increase the liabilities of firms with high foreign currency indebtedness, making their balance sheet riskier, and may even lead to bankruptcy (Forbes & Warnock, 2020). Parallel to this, unemployment will increase and the GDP will decrease (Salas et al., 2020). Also, the depreciation of national currency will transmit the price levels via the exchange rate pass-through mechanism, which will exert pressure to increase inflation.
To sum up, although the sudden rise or sudden stop in capital flows causes a couple of problems for the country of investment, the cost of macroeconomic issues originating from the sudden stop is much more noteworthy as it may mean a currency crisis, debt crisis, and/or financial crisis. Calvo (1998) explained how a sudden stop in capital flow could lead countries to the financial and balance of payment crisis, even if this deficit is financed entirely by foreign direct investment.
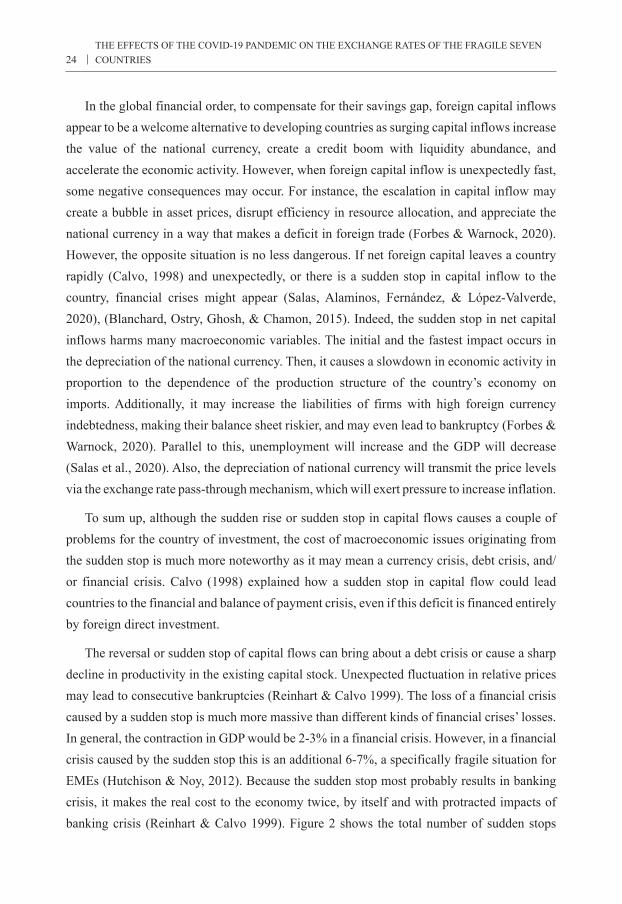
The reversal or sudden stop of capital flows can bring about a debt crisis or cause a sharp decline in productivity in the existing capital stock. Unexpected fluctuation in relative prices may lead to consecutive bankruptcies (Reinhart & Calvo 1999). The loss of a financial crisis caused by a sudden stop is much more massive than different kinds of financial crises’ losses. In general, the contraction in GDP would be 2-3% in a financial crisis. However, in a financial crisis caused by the sudden stop this is an additional 6-7%, a specifically fragile situation for EMEs (Hutchison & Noy, 2012). Because the sudden stop most probably results in banking crisis, it makes the real cost to the economy twice, by itself and with protracted impacts of banking crisis (Reinhart & Calvo 1999). Figure 2 shows the total number of sudden stops
25Hülya DENİZ KARAKOYUN
between 1960-2020. Even though nearly 30 EMEs and 10 advanced economies faced a sudden stop in 2009 GFC, EMEs have not experienced capital reversals on the huge scale as observed in the COVID-19 crisis since Volcker’s disinflation policies in 1982 (Salas et al, 2020).
Figure 2. Number of Sudden Stops in the World Between 1960-2020Source: Salas et al., 2020.
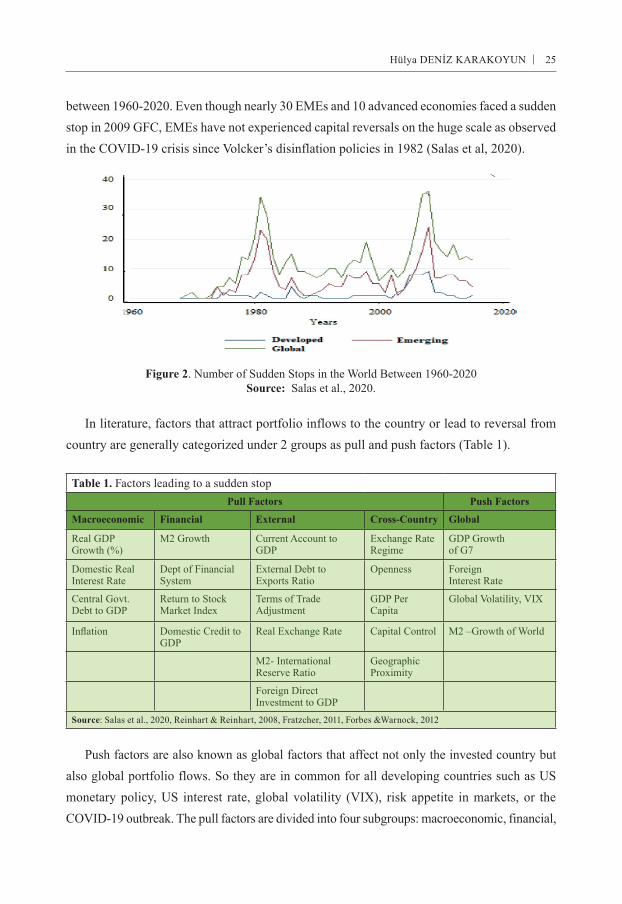
In literature, factors that attract portfolio inflows to the country or lead to reversal from country are generally categorized under 2 groups as pull and push factors (Table 1).
Table 1. Factors leading to a sudden stopPull Factors Push Factors
Macroeconomic Financial External Cross-Country Global
Real GDP Growth (%)
M2 Growth Current Account to GDP
Exchange Rate Regime
GDP Growthof G7
Domestic Real Interest Rate
Dept of Financial System
External Debt to Exports Ratio
Openness ForeignInterest Rate
Central Govt. Debt to GDP
Return to Stock Market Index
Terms of Trade Adjustment
GDP Per Capita
Global Volatility, VIX
Inflation Domestic Credit to GDP
Real Exchange Rate Capital Control M2 –Growth of World
M2- International Reserve Ratio
Geographic Proximity
Foreign Direct Investment to GDP
Source: Salas et al., 2020, Reinhart & Reinhart, 2008, Fratzcher, 2011, Forbes &Warnock, 2012
Push factors are also known as global factors that affect not only the invested country but also global portfolio flows. So they are in common for all developing countries such as US monetary policy, US interest rate, global volatility (VIX), risk appetite in markets, or the COVID-19 outbreak. The pull factors are divided into four subgroups: macroeconomic, financial,
THE EFFECTS OF THE COVID-19 PANDEMIC ON THE EXCHANGE RATES OF THE FRAGILE SEVEN COUNTRIES26
external, and cross country factors which are country-specific factors and are related to the country of investment’s macroeconomic variables. They aim to show the investors the performance of the economy, such as growth, inflation, fiscal balance, current account, total debt nominated in foreign exchange, structural reforms, productivity shocks, etc. (Mahecha, 2011).
Many papers aim to evaluate the absolute and relative importance of push and pull factors to attract foreign capital into developing and emerging economies. Although some economists highlighted the domestic factors as the main reason for capital inflows (Calvo, Leiderman, & Reinhart, 1996; Ying & Kim, 2001; Fratzcher, 2011; Ahmed & Zlate, 2014), this hypothesis seems more meaningful for the period before GFC. On the other hand, most of the succeeding models concluded that external factors dominated in explanatory power in the prediction of capital flows, especially after the GFC and taper tantrum of 2013 (Forbes &Warnock, 2012; Ahmed & Zlate, 2014; Bruno & Shin, 2015; Cerutti et al., 2017; Aizenman & Binici, 2016). These are crucial since before COVID-19, GFC and the FED’s taper tantrum were two examples of sudden stops seen in emerging and developing countries. Forbes & Warnock (2020), Aizenman & Binici (2016) investigated whether the GFC changed the significance of factors affecting capital flows. They revealed that the crisis changed the relative significance of push and pull factors. Although the pull macroeconomic factors such as GDP per capita or inflation had more explanatory power to predict portfolio inflows to EMEs before GFC, along with pull factor-like short term external debt, push factors such as US monetary policy and the VIX has been found to have more relative significance during and post-GFC (Aizenman & Binici, 2016). For example, the FED›s low-interest-rate (cut-rate) policy increased capital movements towards developing countries. In contrast, its high-interest rate policy, like the taper tantrum of 2013, pulls back the capital out of these countries (Mahecha, 2011). On the contrary, when all the types of capital flows (surge, stop, flight, retrenchment) were analyzed considering their period (before the GFC 2000-2007, GFC 2008-2009 or post crises 2010-2018) in the EMEs, Forbes and Warnock (2020) claimed that after the GFC, the relationship between the capital flows and global risk and growth weakened. Thus, they stated that global growth is not useful to predict capital flows, and the global risk is only meaningfully related to the stops. A significant but less correlated relation is present between economic growth and capital surges, but no relationship exists between economic growth and stops. Investigating whether it would be a change in portfolio structure in capital movements of EMEs, the continuation of the debt-driven movement is striking after GFC, too. While the total debt-driven flows accounted for 72% of total capital movements before the GFC, this ratio hiked to 88% in the post-crisis period. When the debt-driven capital movements are examined considering sudden
27Hülya DENİZ KARAKOYUN
stops, a deduction in banking driven flows is striking. While it was 60% in the first period, it increased to 81% in the second period. Whereas capital inflows increased from 41% before GFC to 44% after GFC, portfolio debt inflows rose from 15% in the first period to 23% in the second period (Forbes & Warnock, 2020). Aizenman and Binici (2016) found that market risk appetite, liquidity, and US monetary policy have a significant role in portfolio inflows to or outflows from EMEs. Similar to this, after analyzing sudden stop in capital flows for 73 emerging and 30 developed countries by using artificial intelligence techniques, Salas et al. (2020) put forward that the most important variable for absolute and relative sudden stop models is the exchange rate regime for EMEs. In addition to this, they claimed that inflation, global GDP, stock return, current account deficit, external debt, international reserves, and global volatility are other important variables that explain the variance in portfolio flows. On the other hand, some economists suggest that risk factors were less critical over portfolio flows than they were before GFC (Goldberg & Krogstrup, 2019), while some stress that the fluctuations in the US $ have more explanatory power than they had before GFC.
When the FED raised the federal funds rate the first time after GFC (taper tantrum) a 10-year period without any rise in the interest rate ended (Forbes & Warnock, 2020). The taper tantrum on portfolio flow reflected that nearly one out of every four economies experienced the sudden stop, and one out of five economies faced retrenchment. This rate was lower compared to the sudden stop experienced by one-third of the world before GFC and much smaller than the sudden stop seen in four out of every five countries in 2008-2009. Similarly, the interest rate’s dramatic increase in 2015 caused a sudden stop in 43% of EMEs. It is striking that, compared to the sudden stops which affected only 31% of EMEs before GFC, any reversal in capital flows has threatened the EMEs more since then. Additionally, Forbes and Warnock explained that another common feature of sudden stops in the EMEs is also the liquidity abundance in an environment with the high current account deficit, overvalued exchange rate, and weak macroeconomic indicators (Forbes & Warnock, 2020).
Although portfolio investment moves from advanced economies with a saving glut to developing countries with saving gaps, most of the short-term foreign investment flowed into EMEs after GFC. The higher borrowing costs of EMEs in all developing countries expose these countries to the risk of financial crisis due to a sudden stop. For this reason, crises arising from capital outflows in EMEs have been analyzed many times (Calvo,1998; Reinhart & Calvo, 1999; Calvo, 2007; Agosin & Huatita, 2012; Aizenman & Hutchison, 2012; Ahmed & Zlate, 2014; Blanchard et al., 2015). The common point of all studies investigating the sudden stop in EMEs is that they always found a capital boom before the sudden stop and

THE EFFECTS OF THE COVID-19 PANDEMIC ON THE EXCHANGE RATES OF THE FRAGILE SEVEN COUNTRIES28
financial crisis. The studies found that as the foreign capital inflows rise, economies are exposed to more capital reversal risk than before (Edwards, 2007). An increase in capital inflows creates liquidity abundance and this results in an increase in the indebtedness levels of the countries to that extent. The indebtedness ratio of developing and emerging economies reached a record high level between 2010-2020. This increase is striking both in terms of speed and broad base. For instance, while the ratio of the total debt to GDP in developing and EMEs was around 60% in 2010, this ratio spiked to 170%, increasing approximately threefold at the beginning of the pandemic (Köse et al, 2020).
Although China owns the largest share in this borrowing, this ratio is above 100% in 80% of all developing and EMEs excluding China. Figure 3 illustrates four major capital boom and borrowing waves between 1970 and 2018 in the world (Köse, Ohnsorge, Nagle, & Sugawara, 2020). In the first wave, the reason was the fluctuation in low real interest rate debts that flowing mainly into Latin America and Sub-Saharan countries under the leadership of IMF and WB between 1970 and 1989. The second wave is the period in which East Asia, Pacific countries, Europe, and Central Asian countries started to borrow heavily in foreign currency because of liberalization between 1990-2001. The Mexican Crisis, the Russian Crisis, and the Asian Crisis were examples of the crisis resulted from boosting those second wave. The third debt fluctuation that increased private sector debt in Europe and Central Asia with low real interest rates resulted from the monetary expansion policy of EU between 2002-2009. Greece and Italy’s debt crisis are an example of the third wave. The fourth and the last wave in this period when COVID-19 broke out is the period when both public and private sector indebtedness ratios reached a record high level, which started as a result of unconventional monetary policies of developed countries in 2010 due to GFC (Köse et al., 2020; Fratzcher, 2011). The great debt wave experienced after GFC is the fourth largest debt surge in the world economy between 1970-2020 (Köse et al, 2020).
Figure 3: Debt in Emerging Markets and Developing EconomiesSource: Köse et al., 2020
29Hülya DENİZ KARAKOYUN
These four debt waves have some common features. All of them emerged with a low-interest-rate environment, financial innovation, or facilitated borrowing opportunities in financial markets. In the end, they all resulted in a wide and profound financial crisis, like in 1982, 1991, and 2009, or turbulence in 1998 and 2001. The event that ends the expansion period is the emergence of a shock that will lead to a risk aversion by investors and an increase in risk premium and cost. For this reason, any sudden stop in portfolio investment made these countries implement the political reforms aimed at increasing international reserves by plunging these countries deep into recession. The significant difference between fluctuations is the positive divergence of private sector debt during the last debt wave. The increase in private sector indebtedness strikingly exceeded public debt in this last wave. A shrink in commodity prices is one of the main reasons for the surge in government debt in 2014-2015. Recently, another distinguishing point of EMEs’ debt composition has been to increase in indebtedness of the non-banking financial sector in the economy.
Some reasons for the depreciation of national currencies of EMEs so early are their corporation debt levels denominated in FX despite having low official reserves, their governments’ budget deficits, and their current account deficits that are four times greater than what they were just before the GFC of 2007-2008. Twin deficit leads to a negative motivation for international investors and their risk aversion attitude on behalf of USA dollars as a safe haven. As seen in Figure 3, the debt ratio to GDP in EMEs has risen every single year for the last twenty years. Dashed lines illustrate the picture of the situation in EMEs, excluding China. The most dramatic change in the cumulated debt ratio is seen in the private sector debts. Its growth rate accelerates, especially after the Taper Tantrum. Unfortunately, the COVID-19 outbreak hit EMEs at a time when most of them had low official international reserves. This situation makes it harder to get capital inflow and rollover of the external debt. Even if it is so, it causes a higher interest payment for an external debt due to higher risk premium (Çakmaklı, Demiralp, Kalemli-Özcan, Yeşilyaş, & Yıldırım, 2020).
Similar to the claim of the changing relative importance of push and pull factors after GFC, there is another assertion that suggests an asymmetrical relative importance relationship between pull-push elements and portfolio flows resulting from COVID-19 (De Bock et al., 2020). They found out that while weak macroeconomic indicators trigger the portfolio outflows, strong domestic fundamentals did not lead to surge capital inflows but ensure a smoother transaction.
Finally, another type of relationship between a sudden stop and a speculative attack is examined from the perspective of institutional economy (Ma & Wei, 2020). The institutional
THE EFFECTS OF THE COVID-19 PANDEMIC ON THE EXCHANGE RATES OF THE FRAGILE SEVEN COUNTRIES30
economists said that equity has a larger share in portfolio inflow compared to debt in countries with strong institutions. On the other hand, countries with poor institutions may be exposed to more sudden stop risk as portfolios formed with debt weighted because equity investment is closely connected more to legal and institutional regulations compared to debt financing. If the required legal regulations in a country do not protect foreign investors’ rights, capital inflow through debt will be preferable for foreign investors. Therefore, the strong states need capital control less to restrain the outflow, while this policy may turn to a necessity for vulnerable countries (Ma & Wei, 2020).
3. The Risks Triggered by the COVID-19 Pandemic to the Financial Markets in the Fragile Seven Countries
COVID-19 brought global economic, political, and collective risks to light simultaneously with risks in health. These risks differ based on the countries’ development levels. Considering the scope and size of relief packages, the G7 countries’ economies are expected to recover faster compared to developing countries with a limited budget and borrowing facilities. In this respect, as developing countries have been trying to cope with the direct and indirect costs of the pandemic, an unprecedented crush in portfolio investments exposes EMEs to another threat. In the WEO report, which the IMF revised in April ‘20, a group of EMEs countries is entitled implicitly the fragile seven (IMF, 2020a). These countries are Brazil, Colombia, Egypt, India, South Africa, and Turkey. Common features of the fragile seven countries are similar macroeconomic structure and dependency on foreign financing due to high external debt. In other words, it is the similarity of pull factors that affect capital flows. It is estimated that the costs of COVID-19 may be higher than it may be in the other developing countries due to these common features.
The growth expectations of the IMF in the fragile seven countries for 2020 and 2021 are expressed in Figure 4. The IMF had to revise its estimates downwards both in April and June subsequently. The figure shows both revised projections. In the April report, all group countries except India are projected to shrink, while in the new report, it is estimated that India will shrink by 4.5%. Contrary to the previous report, they expect increases in economic activity only for Egypt. Moreover, the expectation for Egypt has undergone a radical upward revision from -5.8% to 2%. In the last report, the biggest contraction was foreseen for Brazil, S. Africa, and Turkey for 2020, while a moderate downsizing was predicted for Colombia. Also, there were no change in forecasts for Turkey, Colombia, and Hungary in June, meaning no upsizing or downsizing. The IMF estimated the positive economic performance of all countries in 2021. Following India with the highest growth rate by 6%, the Turkish economy

31Hülya DENİZ KARAKOYUN
ranks second with a 5% growth rate. While the report revised the forecast for growth in Brazil upwards, it revised downwards for India and Egypt. Thus, the IMF accepts a V-type of economic recovery for the fragile seven countries (IMF, 2020b).
Figure 4. The expected economic growth rates in the fragile seven countries in 2020-2021. (%)Source: IMF, World Economic Outlook, 2020a, 2020b. 2020* and 2021* show the revised growth
projections in the June report.
As explained in the previous section, to predict sudden stop risk for any country, certain pull factors such as a current account to GDP, real exchange rate, domestic credit to GDP, capital flow to GDP, external debt to exports ratio, terms or trade or M2 to international reserve ratio are evaluated. So, Table 2 depicts the macroeconomic variables, including some of these indicators for every single country as of the end of 2019. According to Table 2, Turkey and Egypt have the highest inflation rate in the group with 11.8 % and 9.4%, respectively. Inflation is between 3.7% and 5.8% and moderate in all other countries. Except Hungary, with a 5.39% unemployment rate, almost all of the fragile seven countries are suffering from a high level of unemployment. The most dramatic situation is seen in South Africa, where nearly one in 3 people in the labor force is unemployed. Turkey ranks second with 13.7% after S. Africa. The economic growth rate of all countries in the group in 2019 is positive; however, Egypt, Hungary, and India›s economic performance differ from Brazil, South Africa, and Turkey that were close to recession. Considering budget deficit, Colombia and Hungary have a tight budget discipline with -2.15% and -2.04%. The general government borrowing rate in Egypt and India is more than others are. With the lowest ratio of internal dept to GDP of 33.1% in Turkey, this is followed by Colombia with 52.9%. In terms of official reserves, India and Brazil’s official reserves are almost over ten times that of Colombia, Egypt, S. Africa, and Hungary.

THE EFFECTS OF THE COVID-19 PANDEMIC ON THE EXCHANGE RATES OF THE FRAGILE SEVEN COUNTRIES32
Table 2. Macroeconomics indicators for fragile seven countries in end-2019 (%) Countries Brazil Colombia Egypt Hungary Indian S. Africa TurkeyInflationa 4.3 3.8 9.4 4.0 5.8 3.7 11.8
Unemployment Ratea 11.9 12.2 10.29 5.39 N/A 35.13 13.7
Economic Growth Ratea 1.1 3.3 5.6 4.9 4.2 0.2 0.9
Budget Deficita* -6.01 -2.15 -7.40 -2.04 -7.44 -6.25 -5.26
Internal Debt Stockb* 89.5 52.9 83.3 66.3 71.9 62.2 33.1
External Debt Stok(blln $)
573.65 139.12 109.36 157.49 557.38 177.68 436.9
Current Deficit* -2.69 -4.26 -3.60 -0.77 -1.12 -3.01 1.66
Official Reserves 356.88 58.27 55.70 32.22 461.83 55.06 105.7
Official Reserves* 0.19 0.18 0.18 0.2 0.16 0.15 0.14
Gross Official Reserves/ Gross External Debtd
0.62 0.42 0.51 0.21 0.83 0.31 0.24
Gross Ext. Debt/ Exports 257 352 377 127 172 197 241Source: aIMF, World Economic Outlook, April 2020a, b IMF, Global Fiscal Monitor 2020c, c authors calculation based on data retrieved from https://www.ceicdata.com/en/indicator/turkey/external-debt;d authors calculation based on data retrieved from WTO, Data Portal retrieved from https://timeseries.wto.org/ *percent of GDP
Emerging countries need foreign exchange to catch up with their production activities somewhere close to its potential level. As seen in Table 2, developing countries had a current account deficit since they suffer from inadequate savings to meet their import expenditures. Since Turkey grew by 0.9% in 2019, relatively less than its potential growth rate, it is the only country having a 1.66 % surplus in the current account to GDP (current deficit* row in Table 2).
Because the economic growth in emerging countries is heavily based on the imported raw material or semi-final goods, there is a dilemma on economic growth and current account deficit for these countries. Thus, they require a continuous foreign capital inflow into their economies to finance their trade deficit. Also, as seen in Table 2, emerging countries are net indebted countries whose debt is dominated heavily in the US dollar or Euro. To service their foreign debt, they require a steady flowing capital into their economies. In sum, vulnerabilities of EMEs such as high debt, low FX reserves, weak balance sheets, and limited policy credibility have exacerbated the capital outflow from EMEs with the risk-off sentiment of markets since COVID-19 (Çakmaklı et al., 2020).
4. Sudden Stop of Portfolio Investment to the Fragile Seven
If a country faces a 5% decrease in capital inflow compared to the previous year, or the standard deviation of capital inflow from its sample mean exceeds more than two, then it is a sudden stop for that country (Calvo, Izquierdo, & Meija, 2004). Before the sudden stop, the
33Hülya DENİZ KARAKOYUN
country generally enjoys a credit boom. Excess capital flows to EMEs causes an overvalue in national currency, decrease in interest rate, and increase in domestic demand; thus, a current account deficit. On the other hand, falling inflation, and a high growth rate enhanced the short-term external debt stock, a sufficient reason for the sudden stop in EMEs and drafting them into a liquidity crisis (Altun & Mutan, 2007). Even though weak domestic and external demand resulted from COVID-19, the decline in prices of raw materials, which are the main export items of most developing countries, a high private sector debt ratio denominated in national or foreign currency, and low international reserves, the implemented expansionary monetary and fiscal policy to cope with COVID-19 raised these countries risk premiums. This increases the cost of foreign finance, and consequently, increasing depreciation expectation in currency leads capital outflows putting EMEs in a clamp. An expectation of a fall in currency value leads international investors to pull their savings out of that country and restrain the new investors from investing their savings into the home country. The depreciation expectation comes true, as with the melting net official reserves of the country, the net capital inflow is getting lower and lower, resulting in devaluation of the country’s currency. This situation is sudden stop (Calvo, 1998).
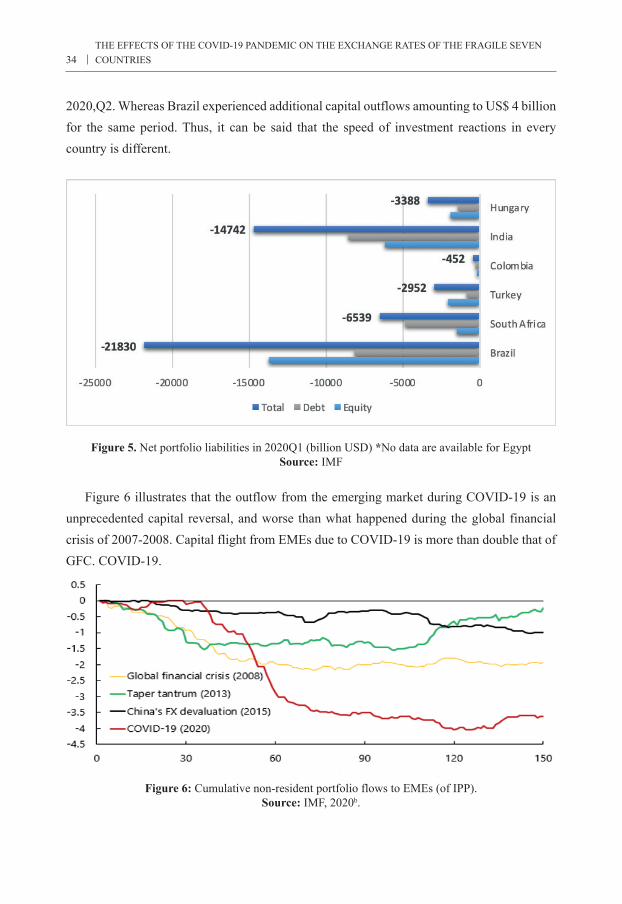
Together with the COVID-19 outbreak in early 2020, emerging markets’ capital inflows declined dramatically. Short-term portfolio movements also continued to show record outflows in 2020: Q2. As the COVID-19 outbreak spread throughout Europe and America, portfolio investment realized a sudden stop to emerging markets, including China and India. According to IIF data, capital outflow recorded a historically low level in March 2020. Within a single month, almost US$ 83.3 billion (US$ 52.4 billion for equity and USD 31 billion in dept) capital outflowed from EMEs to advanced economies such as France and Germany because of investors’ risk-off sentiment at the time of rising global risk. The IIF estimated around US$ 103 billion portfolio flight from EMEs between mid-January and mid-May. The expectation of cumulative capital flows to EMEs in 2020 is almost US$ 444 trillion, that is less than half of the magnitude in 2019 (US$937) (IIF). As shown in Figure 5, capital reversal is striking in all the fragile seven countries in 2020,Q1. In Brazil, Turkey, and Hungary, outflows from the stock market dominated debt outflows, whereas it is vice-versa in India, S. Africa, and Colombia. Although there is no official detailed data for Egypt, at the peak of the risk aversion sentiment during March and April, Egypt experienced capital outflows of nearly US$16 billion (IMF). Moreover, capital outflows were too fast in Brazil, South Africa, and India compared to Turkey and Colombia in the first quarter of the year. However, capital outflows were intensified by an additional reversal of over US$10 billion in Turkey in
THE EFFECTS OF THE COVID-19 PANDEMIC ON THE EXCHANGE RATES OF THE FRAGILE SEVEN COUNTRIES34
2020,Q2. Whereas Brazil experienced additional capital outflows amounting to US$ 4 billion for the same period. Thus, it can be said that the speed of investment reactions in every country is different.
Figure 5. Net portfolio liabilities in 2020Q1 (billion USD) *No data are available for EgyptSource: IMF
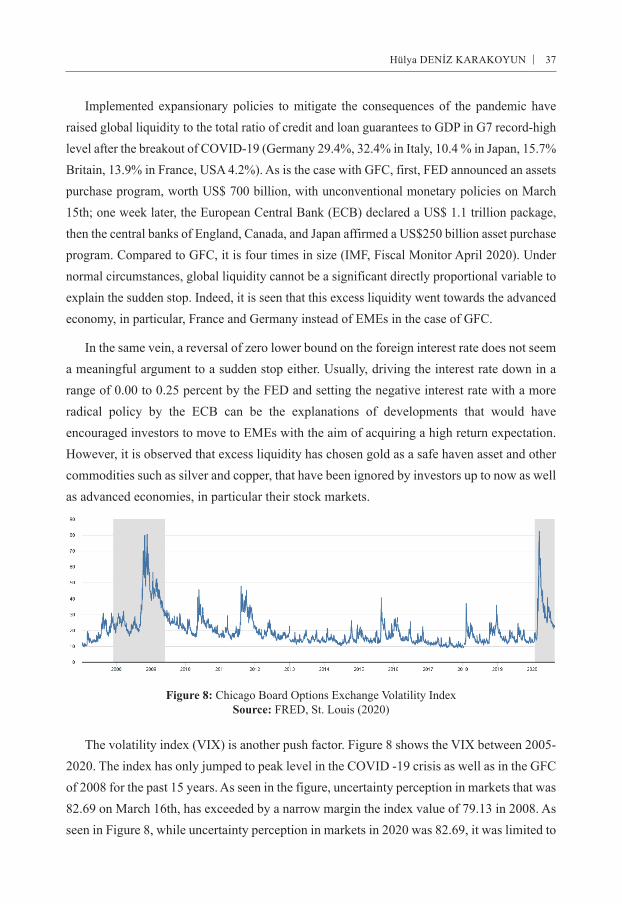
Figure 6 illustrates that the outflow from the emerging market during COVID-19 is an unprecedented capital reversal, and worse than what happened during the global financial crisis of 2007-2008. Capital flight from EMEs due to COVID-19 is more than double that of GFC. COVID-19.
Figure 6: Cumulative non-resident portfolio flows to EMEs (of IPP).Source: IMF, 2020b.

35Hülya DENİZ KARAKOYUN
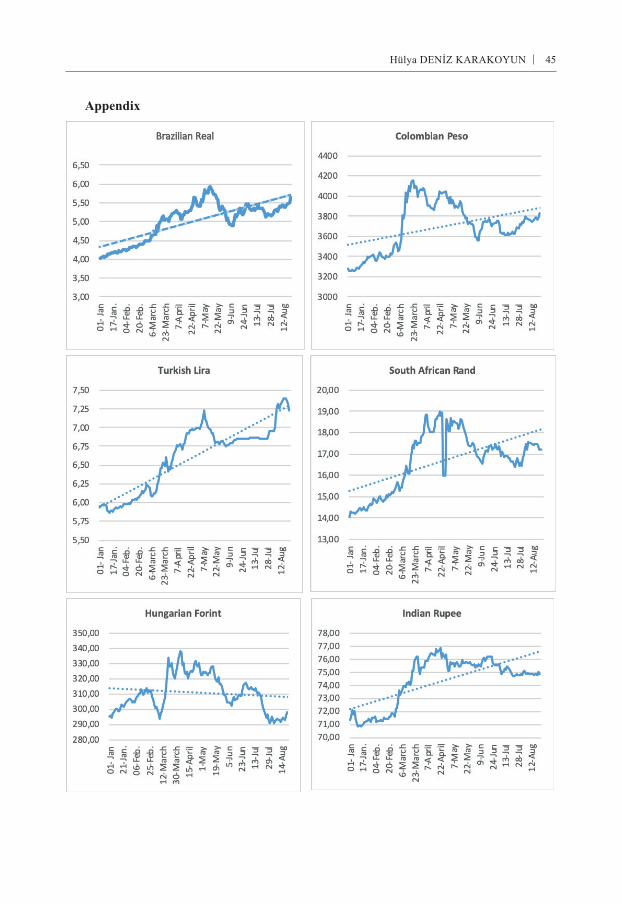
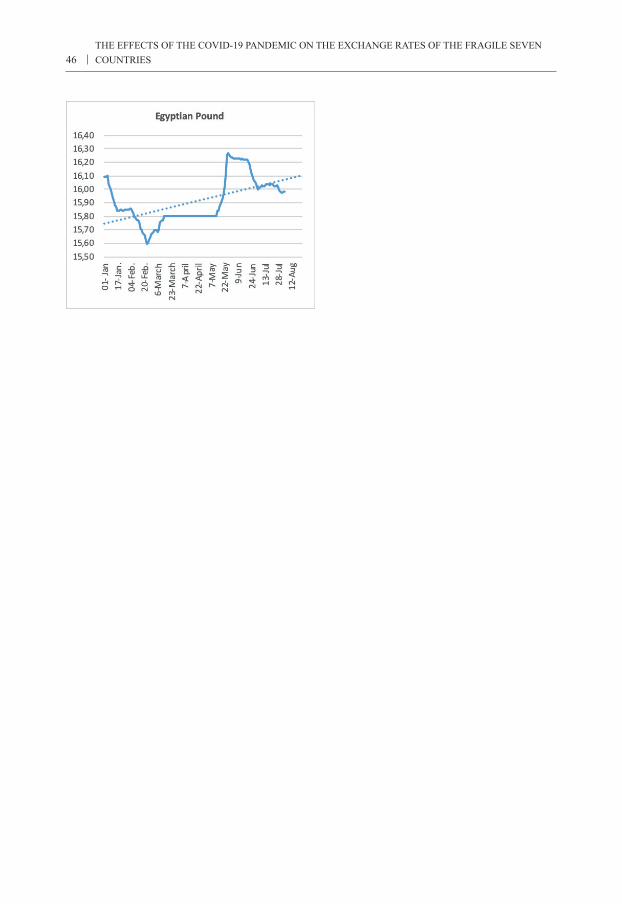
The initial effect of the decreasing portfolio investment and net outflows were seen in foreign exchange rates. Figure 7 shows the period between January 1st and August 21st, the exchange rate depreciation of each of the fragile seven countries against US $, and the maximum depreciation rate in the period. It is seen that all currencies, apart from the Egyptian Pound, depreciated against $. The Pound stayed stable year-to-date as if it adopted the fixed exchange rate regime. The most depreciated currency within the eight months is the Brazilian Real with a considerable decline of 39%, followed by S. Africa Rand’s 22.85%, Turkish Lira’s 21.3%, Columbian Peso’s 16.8%, Indian Rupee’s 5%, and Hungary’s 1%. The Pound, thus, differs from the group positively because of the strong growth expectation. Additionally, Egypt requested Rapid Financial Assistance of US$ 2.8billion from the IMF in May, and they approved. Then, Egypt signed a 12-month Stand-by agreement with access to US$ 5.2 billion in June. Thus, the country could access over US$ 7.2 foreign capital. Similarly, Colombia is another country which requested 2-year arrangement of about US$ 10.8 billion from the IMF in May. In other words, Egypt and Colombia needed to be supported by the international institution to cope with the portfolio outflows during COVID-19.
Figure 7. Exchange rate depreciation between Q1:2020 through August 21st and max drawdownSource: IMF, CBE, CBH
There are three striking points in Figure 7:
i. The ranking of the Brazilian Real and S. Africa Rand, which were the most depreciated currencies, and the Egyptian Pound, which was the least depreciated currency, did not change for the whole period. However, in maximum drawdown ranking, the Turkish Lira was replaced by the Colombian Peso and the Indian Rupee was replaced by the Hungarian Forint. The maximum drawdown in currencies during the whole period were observed in the currencies that were the most depreciated ones at the end of the period. On the other hand, the

THE EFFECTS OF THE COVID-19 PANDEMIC ON THE EXCHANGE RATES OF THE FRAGILE SEVEN COUNTRIES36
Colombian Peso and Hungarian Forint saw a considerable recovery after the first sudden stop between April and March. In other words, Hungary Forint had -15% maximum drawdown, but owing to the considerable recovery, the depreciation for the entire period is -1%, and similarly for Peso from -27% maximum drawdown to -17 % overall drawdown.
ii. The country with the most difference between the end of period value and maximum drawdown was Hungary.
iii. Towards the end of the period, while all currencies started to recover, only the depreciated Turkish Lira converged to its maximum drawdown.
It is possible to have an idea regarding whether push or pull factors have strong impacts on the exchange rate looking into fluctuations of currency and the depreciation of all currencies in time. If fluctuations of exchange rates in EMEs show co-movement patterns, push factors are the driving force, while if the time diversification in exchange rate movements occurs, then pull factors can be detected as a driving force. When viewed from this aspect, Turkey cuts loose from the group negatively because of recent depreciation in the period. It would be misleading to suppose push factors dominance upon Turkish liras devaluation in August. On the other hand, the top dropdown in exchange rates between April and May can be explained by push factors.
5. Decomposition of Push and Pull Factors Leading to a Sudden Stop in the Fragile Seven
There are plenty of studies (Calvo et al. 1996; Ying & Kim, 2001; Fratzcher, 2011; Ahmed & Zlate, 2014; Forbes & Warnock, 2012; Bruno & Shin, 2015; Cerutti et al., 2017; Aizenman & Binici, 2016), analyzing the push and pull factors to determine which set of indicators has more explanatory power in the prediction of sudden stop in EMEs. First, a subsection will discuss the leading push factors such as VIX, CDS, FED policy rate then, pull factors such as GDP growth rate, inflation, interest rate, official reserves, the short-term foreign debt, and M2 for each country in the fragile seven. Thus, the aim is to get a preliminary opinion regarding the relative importance of alternative determinants of the sudden stop.
5.1. Push Factors
Push factors are situations or developments that happen outside of the emerging countries and affect not only the country of investment but also other countries in the global financial market. G7 growth rate, foreign interest rates, Volatility Index, and size of global liquidity are leading examples of these factors.
37Hülya DENİZ KARAKOYUN
Implemented expansionary policies to mitigate the consequences of the pandemic have raised global liquidity to the total ratio of credit and loan guarantees to GDP in G7 record-high level after the breakout of COVID-19 (Germany 29.4%, 32.4% in Italy, 10.4 % in Japan, 15.7% Britain, 13.9% in France, USA 4.2%). As is the case with GFC, first, FED announced an assets purchase program, worth US$ 700 billion, with unconventional monetary policies on March 15th; one week later, the European Central Bank (ECB) declared a US$ 1.1 trillion package, then the central banks of England, Canada, and Japan affirmed a US$250 billion asset purchase program. Compared to GFC, it is four times in size (IMF, Fiscal Monitor April 2020). Under normal circumstances, global liquidity cannot be a significant directly proportional variable to explain the sudden stop. Indeed, it is seen that this excess liquidity went towards the advanced economy, in particular, France and Germany instead of EMEs in the case of GFC.
In the same vein, a reversal of zero lower bound on the foreign interest rate does not seem a meaningful argument to a sudden stop either. Usually, driving the interest rate down in a range of 0.00 to 0.25 percent by the FED and setting the negative interest rate with a more radical policy by the ECB can be the explanations of developments that would have encouraged investors to move to EMEs with the aim of acquiring a high return expectation. However, it is observed that excess liquidity has chosen gold as a safe haven asset and other commodities such as silver and copper, that have been ignored by investors up to now as well as advanced economies, in particular their stock markets.
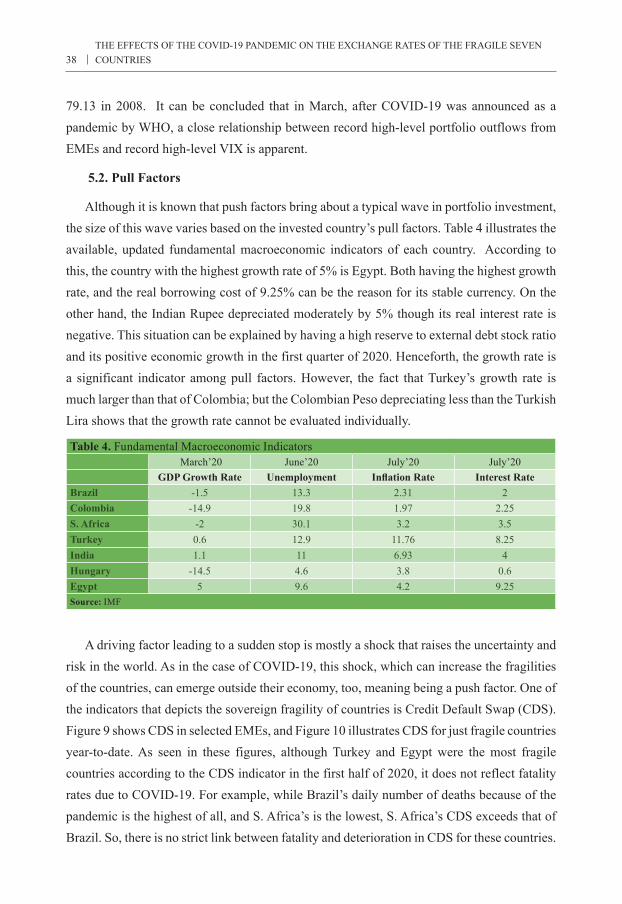
Figure 8: Chicago Board Options Exchange Volatility IndexSource: FRED, St. Louis (2020)
The volatility index (VIX) is another push factor. Figure 8 shows the VIX between 2005-2020. The index has only jumped to peak level in the COVID -19 crisis as well as in the GFC of 2008 for the past 15 years. As seen in the figure, uncertainty perception in markets that was 82.69 on March 16th, has exceeded by a narrow margin the index value of 79.13 in 2008. As seen in Figure 8, while uncertainty perception in markets in 2020 was 82.69, it was limited to
THE EFFECTS OF THE COVID-19 PANDEMIC ON THE EXCHANGE RATES OF THE FRAGILE SEVEN COUNTRIES38
79.13 in 2008. It can be concluded that in March, after COVID-19 was announced as a pandemic by WHO, a close relationship between record high-level portfolio outflows from EMEs and record high-level VIX is apparent.
5.2. Pull Factors
Although it is known that push factors bring about a typical wave in portfolio investment, the size of this wave varies based on the invested country’s pull factors. Table 4 illustrates the available, updated fundamental macroeconomic indicators of each country. According to this, the country with the highest growth rate of 5% is Egypt. Both having the highest growth rate, and the real borrowing cost of 9.25% can be the reason for its stable currency. On the other hand, the Indian Rupee depreciated moderately by 5% though its real interest rate is negative. This situation can be explained by having a high reserve to external debt stock ratio and its positive economic growth in the first quarter of 2020. Henceforth, the growth rate is a significant indicator among pull factors. However, the fact that Turkey’s growth rate is much larger than that of Colombia; but the Colombian Peso depreciating less than the Turkish Lira shows that the growth rate cannot be evaluated individually.
Table 4. Fundamental Macroeconomic Indicators March’20 June’20 July’20 July’20
GDP Growth Rate Unemployment Inflation Rate Interest RateBrazil -1.5 13.3 2.31 2Colombia -14.9 19.8 1.97 2.25S. Africa -2 30.1 3.2 3.5Turkey 0.6 12.9 11.76 8.25India 1.1 11 6.93 4Hungary -14.5 4.6 3.8 0.6Egypt 5 9.6 4.2 9.25Source: IMF
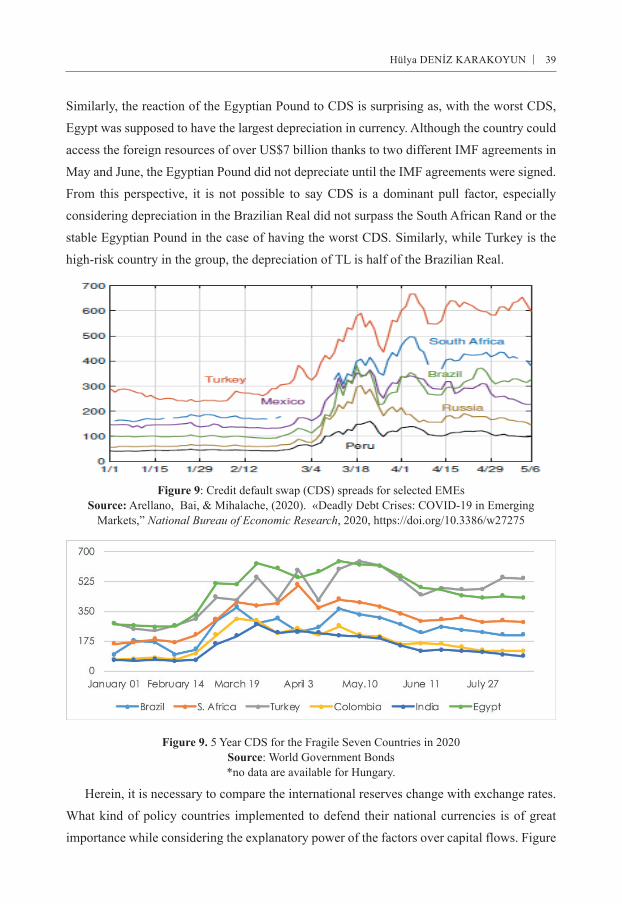
A driving factor leading to a sudden stop is mostly a shock that raises the uncertainty and risk in the world. As in the case of COVID-19, this shock, which can increase the fragilities of the countries, can emerge outside their economy, too, meaning being a push factor. One of the indicators that depicts the sovereign fragility of countries is Credit Default Swap (CDS). Figure 9 shows CDS in selected EMEs, and Figure 10 illustrates CDS for just fragile countries year-to-date. As seen in these figures, although Turkey and Egypt were the most fragile countries according to the CDS indicator in the first half of 2020, it does not reflect fatality rates due to COVID-19. For example, while Brazil’s daily number of deaths because of the pandemic is the highest of all, and S. Africa’s is the lowest, S. Africa’s CDS exceeds that of Brazil. So, there is no strict link between fatality and deterioration in CDS for these countries.
39Hülya DENİZ KARAKOYUN
Similarly, the reaction of the Egyptian Pound to CDS is surprising as, with the worst CDS,
Egypt was supposed to have the largest depreciation in currency. Although the country could
access the foreign resources of over US$7 billion thanks to two different IMF agreements in
May and June, the Egyptian Pound did not depreciate until the IMF agreements were signed.
From this perspective, it is not possible to say CDS is a dominant pull factor, especially
considering depreciation in the Brazilian Real did not surpass the South African Rand or the
stable Egyptian Pound in the case of having the worst CDS. Similarly, while Turkey is the
high-risk country in the group, the depreciation of TL is half of the Brazilian Real.
Figure 9: Credit default swap (CDS) spreads for selected EMEsSource: Arellano, Bai, & Mihalache, (2020). «Deadly Debt Crises: COVID-19 in Emerging
Markets,” National Bureau of Economic Research, 2020, https://doi.org/10.3386/w27275
Figure 9. 5 Year CDS for the Fragile Seven Countries in 2020Source: World Government Bonds*no data are available for Hungary.
Herein, it is necessary to compare the international reserves change with exchange rates.
What kind of policy countries implemented to defend their national currencies is of great
importance while considering the explanatory power of the factors over capital flows. Figure

THE EFFECTS OF THE COVID-19 PANDEMIC ON THE EXCHANGE RATES OF THE FRAGILE SEVEN COUNTRIES40
10 illustrates countries’ ratio of the external debt, international reserves, and current account deficits to their GDP. There is a close relationship between reserve ratio and limited depreciation in the currencies of Egypt, Hungary, India, and Colombia. The depreciation in the Turkish Lira can be explained by its low reserve ratio. However, the explanatory power of international reserve over capital outflow is invalid for the case of Brazil. Although its reserve ratio is higher than that of the Egypt Central Bank, the Pound was stable for the whole period. Turkey is the most indebted country, followed by Hungary. Low reserve ratio and high external debt can explain the speed of foreign outflows. Even if countries’ pull factors are promising, that does not prevent depreciation, instead they slow-down the deterioration in the value of the currency. So, it is found out that the pull factor has asymmetric effects on the Exchange rate in the face of risks triggered by COVID-19.
Figure 10. Selected external pull factors (% of GDP)Source: World Government Bonds
Another pull factor that causes the depreciation of currency and raises the risk is the broad base monetary supply - M2. It is importance comes from the fact foreign exchange is demanded not only by non-resident investors during the reversal of capital but also by a resident who has a high motivation to issue a foreign account due to increasing dollarization. Changes in M2 is of great importance to trace and find out the source of this depreciation. Figure 11 illustrates M2 growth rates in the fragile seven countries between January-June. Obviously, Turkey has the most considerable monetary expansion during the whole period. It is striking that expansionary policy had already been started before the COVID-19 shock in Turkey. Brazil ranked the second country following Turkey. Thus, M2 growth seems a meaningful indicator for Turkey as well as Brazil. This is the case since excess liquidity stimulates the dollarization motives of residents in these countries due to lack of confidence in national currency.

41Hülya DENİZ KARAKOYUN
Moreover, the sticky inflation rate due to high M2 growth leads to a negative real interest that triggers the sudden stop and capital outflow because of an increase in the expectation of depreciation of currency during the period. According to the CBRT, a foreign account of residents grew by more than $20 billion years to August (CBRT). Although monetary expansion in Egypt is the average of the group, its high growth rate of 5% mitigates the effects of this expansion.
Figure 11: M2 growth rate, monthlySource: CEICDATA
6. Conclusion
It is hardly possible that EMEs can hit their growth target without foreign capital inflow because of their low saving, the vicious circle of development, and inefficient economic policies. Excess liquidity starting in the mid-2000s accelerated the portfolio investment towards EMEs, while it was also exposed to the cost of the sudden stop more than before. Because the reflection of the increase in capital inflows to the world economy is the rise of external debt in EMEs, although many EMEs were able to decrease the government debt ratio to downward, it might be difficult to gain political achievement for the most of them because the credibility of economic policy is getting less during the crisis than advanced economies. Also, a sudden stop following every expansionary period may cause/lead/pull EMEs (in)to the currency crisis, debt crisis, and even financial crisis. The fact that COVID-19 resulted in a high portfolio outflow of $83.3 billion in March worries some EMEs due to their concerns on low international reserve and increased short term external debt. The IMF underlined the fragility of seven EMEs, Brazil, Colombia, India, Hungary, Turkey, S. Africa, and Egypt, against the sudden stop in the WEO Report revised in April.
This study aimed to investigate what factors are dominated in explaining the exchange rate movements of these countries. Thus, while VIX is found the most significant of the push

THE EFFECTS OF THE COVID-19 PANDEMIC ON THE EXCHANGE RATES OF THE FRAGILE SEVEN COUNTRIES42
factors, specifying a pull factor is more complicated because no single pull factor can explain the fluctuations in all currencies. However, while real growth rate, M2 growth, and external debt to the reserve have an explanatory power on predicting the sudden stop and consequently depreciation, CDS does not seem to be a driving factor. Moreover, it is observed that good economic performance (i.e. GDP growth, relatively high PMI) helps to mitigate the depreciation while the bad indicators accelerate this depreciation in the currency. An unprecedented sudden stop with COVID-19 requires more than a single pull or push factor to accurately predict exchange rate movements in EMEs.
References
Agosin M. R., & Huatita F. (2012). Overreaction in capital flows to emerging markets: Booms and sudden stops. Journal of International Money and Finance, 31(5), 1140–1155.https://doi:10.1016/j.jimonfin.2011.12.015
Ahmed S., & Zlate, A. (2014). Capital flows to emerging market economies: A brave new world? Journal of International Money and Finance, 48, 221-248. https://doi.org/10.1016/j.jimonfin.2014.05.015
Aizenman J., & Binici, M. (2016). Exchange market pressure in OECD and emerging economies: Domestic vs. external factors and capital flows in the old and new normal. Journal of International Money and Finance. 66, 65-87. https://doi:10.1016/j.jimonfin.2015.12.008
Aizenman J., Hutchison, M., & M. (2012). Exchange market pressure and absorption by international reserves: Emerging markets and fear of reserve loss during the 2008-2009 crisis. Journal of International Money and Finance, 31(5), 1076-1091. doi: 10.1016/j.jimonfin.2011.12.011
Altun, O., & Mutan, O., C. (2007, August). Küresel fon akımlarının gelişmekte olan ekonomilere ve Türkiye ekonomisine etkisi. Türkiye’ye yönelik sermaye akımlarına ilişkin ampirik bir çalışma [Impact of global capital flows on the emerging economies and Turkish economy. An empirical study on capital inflows in Turkey]. (Capital Markets Board of Turkey, Research Report No. OA3/OCM/2). Retrieved from: https://spk.gov.tr/SiteApps/Yayin/YayinGoster/929.
Arellano, C., Bai, Y., & Mihalache, G. (2020, May). Deadly debt crises: COVID-19 in emerging markets, (NBER Working Paper No.27275). https://doi.org/10.3386/w27275.
Blanchard, O., Ostry, J., Ghosh, A., & Chamon, M. (October 2015). Are capital inflows expansionary or contractionary? Theory, policy implications, and some evidence. (IMF Working Papers No. 15 (226). https://doi.org/10.5089/9781513500805.001
Bruno V. & Shin, H., S. (2015). Cross-Border banking and global liquidity. Review of Economic Studies, 82(2), 535-564. https://doi.org/10.1093/restud/rdu042
Calvo, G., Leiderman, L., & Reinhart, C. (1996). Inflows of capital to developing countries in the 1990s: Causes and effects. Journal of Economic Perspectives, 10(2), 123-139. Retrieved September 01, 2020 from: https://www.jstor.org/stable/2138485
Calvo, G. (1998). Capital flows and capital-market crisis: The simple economics of sudden stops. Journal of Applied Economics, 1(1), 35–54. https://doi.org/10.1080/15140326.1998.12040516
Calvo, G., Izquierdo, A., & Meija, L. (May 2004). On the empirics of sudden stops: The relevance of balance sheet effects. (NBER Working Paper No.10520). https://doi.org/10.3386/w10520.
Calvo, G. A., (2007, May). Crisis in emerging market economies: A global perspective. (NBER Working Paper No. 11305). http://doi.org/ 10.3386/w11305

43Hülya DENİZ KARAKOYUN
CEICDATA. Stat (2020). Global macroeconomic indicators. Data extracted on 26 August 2020. Retrieved from: https://www.ceicdata.com/en/indicator/turkey/m2-growth
CBE. Stat (2020). Daily exchange rates. Data extracted on 21 August 2020. Retrieved from: https://www.cbe.org.eg/en/EconomicResearch/Statistics/Pages/ExchangeRateshistorical.aspxCBH
CBH. Stat (2020). Time series of daily exchange rates. Data extracted on 21 August 2020 Retrieved from: https://www.mnb.hu/en/arfolyamtablazat?deviza=rbCurrencyActual&devizaSelected=USD&datefrom= 01%2F01%2F2020&datetill=26%2F08%2F2020&order=1
CBRT. Stat (2020). Balance of payments statistics, Data extracted on 17 August 2020. Retrieved from: https://www.tcmb.gov.tr
Cerutti, E., Claessens, S., & Rose, A., K. (2017, August). How important is the global cycle? Evidence from capital flows. (NBER Working Paper No. 23699).http://doi.org/ 10.3386/w23699
Çakmaklı, C., Demiralp, S., Kalemli-Özcan, Ş., Yeşiltaş, S., & Yıldırım, M. (2020, July). Covid-19 and emerging markets: An epidemiological model with international production networks and capital flows. (IMF Working Papers No. 20/133). Retrieved from: https://www.imf.org/en/Publications/WP/Issues/2020/07/17/COVID-19-and-Emerging-Markets-An-Epidemiological-Model-with-International-Production-49566.
De Bock, R., Drakopoulos D., Goel, R., Gornicka, L., Papageorgio E., Schneider, P, & Sever, C. (2020, August 19). Managing volatile capital flows in emerging and frontier markets. Voxeu,, Centre of Economic Policy Research Retrieved from: https://voxeu.org/article/managing-volatile-capital-flows-emerging-and-frontier-markets
Edwards, S (2007). Capital controls, capital flow contractions, and macroeconomic vulnerability. Journal of International Money and Finance, 26(5).814–840. https://doi.org/10.1016/j.jimonfin.2007.04.010
ECB Stat. (2020). Euro foreign exchange reference rates. HUF. Data extracted on 21 August 2020. Retrieved from: https://www.ecb.europa.eu/stats/policy_and_exchange_rates/euro_reference_exchange_rates/html/eurofxref-graph-huf.en.html
FRED St. Louis and US Stat (2020). Economic data. Chicago board options exchange volatility index. Data extracted on 17 August 2020. Retrieved from https://fred.stlouisfed.org/series/VIXCLS
Fratzcher, M. (2011). Capital flows, push versus pull factors and the global financial crisis. Journal of International Economics, Elsevier, 88(2), 341-356. https://doi.org/10.1016/j.jinteco.2012.05.003
Forbes, K. J., & Warnock, F. E. (2020, March). Capital flow waves—or ripples? Extreme capital flow movements since the crisis. (NBER Working Paper No. 26851). https://doi.org/10.3386/w26851
Forbes, K. J., & Warnock, F. E. (2012). Capital flow waves: Surges, stops, flight, and retrenchment. Journal of International Economics, 88(2), 235-251. https://doi.org/10.1016/j.jinteco.2012.03.006
Goldberg, L. S., & Krogstrup S. (2019, September). International capital flow pressures. (Federal Reserve Bank, New York Staff Report No. 834). Retrieved from: https://www.newyorkfed.org/medialibrary/media/research/staff_reports/sr834.pdf
Hutchison M. M, & Noy I (2006). Sudden stops and the Mexican wave: Currency crises, capital flow reversals, and output loss in emerging markets. Journal of Development Economics, 79 (1), 225–248.http://doi.org/ https://doi.org/10.1016/j.jdeveco.2004.12.002
IHS-Markit Stat. (2020). Purchasing Managers’ Index. Data extracted on 3 August 2020. Retrieved from: https://www.markiteconomics.com/public?language=tr
IIF (2020, April). The Covid-19 cliff. Capital Flows Tracker. Retrieved from: https://www.iif.com/Portals/0/Files/content/1_IIF_Capital%20Flows%20Tracker_April.pdf.
THE EFFECTS OF THE COVID-19 PANDEMIC ON THE EXCHANGE RATES OF THE FRAGILE SEVEN COUNTRIES44
IMF. (2020a April). World economic outlook. The great lockdown. Washington, D.C: International Monetary Fund. Retrieved from: https://www.imf.org/en/Publications/WEO/Issues/2020/04/14/weo-april-2020#Introduction
IMF (2020b June). World economic outlook update. A crisis like no other an uncertain recovery. Washington, D. C: International Monetary Fund. Retrieved from: https://www.imf.org/en/Publications/WEO/Issues/2020/06/24/WEOUpdateJune2020.
IMF (2020c April). Global fiscal monitor. Washington, D.C: International Monetary Fund. Retrieved from: https://www.imf.org/en/Publications/FM/Issues/2020/04/06/fiscal-monitor-april-2020
Köse, M. A., Ohnsorge, F., Nagle, P., & Sugawara, N. (2020). Debt wave. IMF Finance and Development, 57(2), 40-43. Retrieved from: https://www.imf.org/external/pubs/ft/fandd/2020/06/pdf/COVID19-and-debt-in-developing-economies-kose.pdf
Ma, C., & Wei, S.-J. (2020, May). International equity and debt flows: Composition, crisis, and controls. (NBER Working Paper No. 27129). https://doi.org/10.3386/w2712.
Mahecha, J. O. A. (2011). Sudden stop in emerging markets: How to minimize their impact on GDP? Desarrollo y Sociedad, 67, 181–227. https://doi.org/10.13043/dys.67.5
OECD (2020, July). COVID-19 and global capital flows, OECD policy responses to Covid-19. Retrieved from: http://www.oecd.org/coronavirus/policy-responses/covid-19-and-global-capital-flows-2dc69002/
OECD (2020, June). Covid-19 and global capital flows. OECD Report to G20 International Financial Architecture Working Group. Retrieved from: http://www.oecd.org/investment/COVID19-and-global-capital-flows-OECD-Report-G20.pdf
OECD (2020, March). Global financial markets policy to responses to Covid-19. Retrieved from: http://www.oecd.org/coronavirus/policy-responses/global-financial-markets-policy-responses-to-covid-19-2d98c7e0/
Reinhart, C. M., &, Calvo, G. A., (1999). Capital flow reversals, the exchange rate debate, and dollarization. Finance and Development, 36(3), 13-15.
Reinhart, C. M & Reinhart, V. R. (2008, September). Capital flow bonanzas: An encompassing view of the past and present. (NBER Working Paper No. 14321). https://doi.org/ 10.3386/w14321
Salas, M. B., Alaminos, D., Fernández, M. A., & López-Valverde, F. (2020). A global prediction model for sudden stops of capital flows using decision trees. PLoS ONE, 15(2), 1–22. https://doi.org/10.1371/journal.pone.0228387
SIFMA (2020). 2020 Capital markets fact book. Retrieved from https://www.sifma.org/wp-content/uploads/2020/09/US-Fact-Book-2020-SIFMA.pdf
WB. Stat (2020). National accounts data. Data extracted on 15 July 2020. Retrieved from: https://data.worldbank.org/indicator/NY.GDP.MKTP.CD
World Government Bonds Stat (2020). Historical cds data. Data extracted on 24 July 2020. Retrieved from: http://www.worldgovernmentbonds.com/cds-historical-data/hungary/5-years/
WTO. Stat (2020). Data portal. International trade statistic. Data extracted on 28 June 2020. Retrieved from: https://timeseries.wto.org/
Ying, Y., & Kim, Y. (2001). An empirical analysis on capital flows: The case of Korea and Mexico. Southern Economic Journal, 67(4), 954-968.
45Hülya DENİZ KARAKOYUN
Appendix
THE EFFECTS OF THE COVID-19 PANDEMIC ON THE EXCHANGE RATES OF THE FRAGILE SEVEN COUNTRIES46