chapter 12 the analysis of growth and sustainable earnings
TRANSCRIPT

Chapter 12Chapter 12
The Analysis of Growth and Sustainable Earnings

The Analysis of Growth and The Analysis of Growth and Sustainable EarningsSustainable Earnings
Chapter 11 laid out the analysis of profitability
Link to Previous Chapter
LINKS
This chapter analyzes growth
This Chapter
Part III of the book applies the analysis of profitability and growth to forecasting and
valuation
Link to Next Chapter
Link to Web Page
How are sustainable earnings
identified ?
How is growth in investment analyzed ?
How is the analysis of growth incorporated in the evaluation of the P/E and P/B ratios?
What is “growth” in a valuation context?
What is a growth company?
Explore the web page
What you will learn from this What you will learn from this ChapterChapter
•Why the analysis of growth is important for valuation
•Why growth analysis focuses on residual earnings growth
and abnormal earnings growth rather than earnings growth
•What a growth firm is
•What sustainable earnings are and how to identify them
•What transitory earnings are
•What “quality of earnings” means
•How firms can generate unsustainable earnings
•How operating leverage affects earnings as sales change
•How changes in ROCE can be created by borrowing
•What drives growth in the common shareholders’ equity

What Is Growth and How Is What Is Growth and How Is It Valued?It Valued?
– Growth in sales?– Growth is assets?– Growth in equity?– Growth in earnings?
– Does a high P/E ratio indicate a growth company?
– Does a high P/B ratio indicate a growth company?

Remember the Caveat Remember the Caveat (Chapters 5 and 6)(Chapters 5 and 6)
Firms can grow earnings, but not create value
• Earnings growth generated by investment
• Earnings growth generated by the accounting
Value-added growth:
Think of growth in residual earnings and abnormal earnings growth
A reminder: abnormal earnings growth (AEG) is equal to growth in residual earnings (ΔRE)
A Growth Company: A Growth Company: General Electric, Corp.General Electric, Corp.
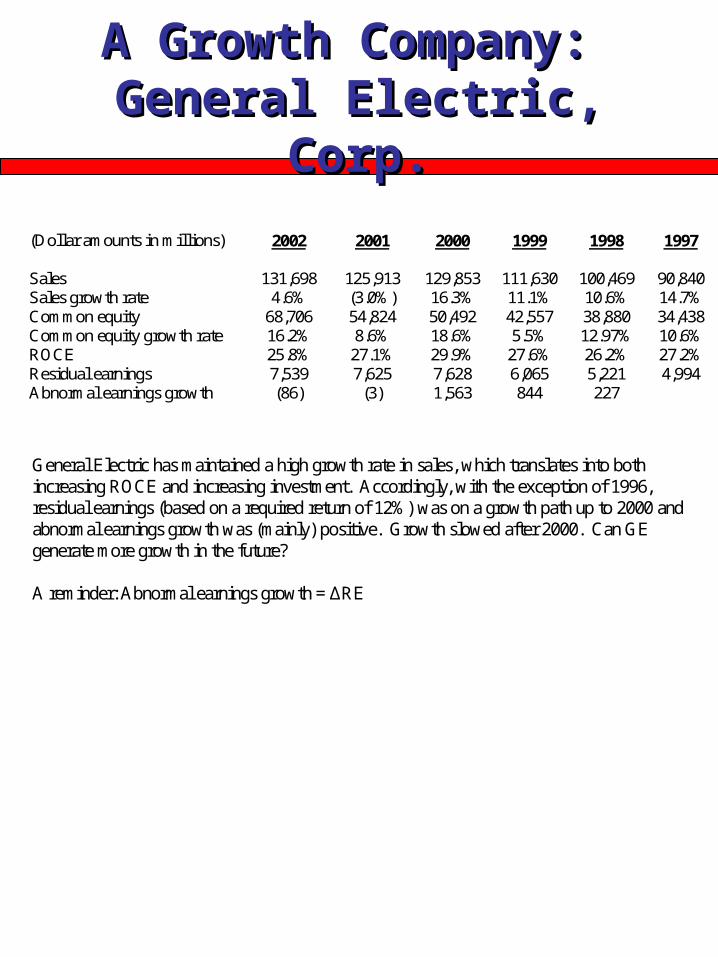
(Dollar amounts in millions) 2002 2001 2000 1999 1998 1997 Sales 131,698 125,913 129,853 111,630 100,469 90,840 Sales growth rate 4.6% (3.0%) 16.3% 11.1% 10.6% 14.7% Common equity 68,706 54,824 50,492 42,557 38,880 34,438 Common equity growth rate 16.2% 8.6% 18.6% 5.5% 12.97% 10.6% ROCE 25.8% 27.1% 29.9% 27.6% 26.2% 27.2% Residual earnings 7,539 7,625 7,628 6,065 5,221 4,994 Abnormal earnings growth (86) (3) 1,563 844 227
General Electric has maintained a high growth rate in sales, which translates into both increasing ROCE and increasing investment. Accordingly, with the exception of 1996, residual earnings (based on a required return of 12%) was on a growth path up to 2000 and abnormal earnings growth was (mainly) positive. Growth slowed after 2000. Can GE generate more growth in the future? A reminder: Abnormal earnings growth = ΔRE

Is Nike a Growth Firm?Is Nike a Growth Firm?
(Dollar amounts in millions) 2004 2003 2002 2001 2000 1999 Sales 12,253 10,697 9,893 9,489 8,995 8,777 Sales growth rate 14.6% 8.1% 4.3% 5.5% 2.5% 8.1% Common equity 4,840 4,028 3,839 3,495 3,136 3,335
Common equity growth rate 19.8% 4.0% 9.8% 11.4% -6.0% 2.2% ROCE 23.0% 10.3% 19.1% 18.8% 17.4% 13.0% Residual earnings 642 (71) 280 241 210 64 Abnormal earnings growth 572 (209) 39 31 146 36
Apart from 2003, Nike grew sales and earned a high ROCE, increasing investment, increasing residual earnings, and delivering positive abnormal earnings growth. Can Nike maintain growth in the future?

A No-Growth Firm: ReebokA No-Growth Firm: Reebok
(Dollar amounts in millions) 2001 2000 1999 1998 1997 1996 1995 Sales 2,993 2,865 2,900 3,225 3,644 3,479 3,481 Sales growth rate 4.5% -1.2% -10.1% -11.5% 4.7% 0.1% 6.1% Common equity 720 608 529 524 507 381 941
Common equity growth rate 18.4% 14.9% 1.0% 3.4% 33.1% -59.5% -5.8%
ROCE 16.9% 15.3% 2.1% 5.8% 24.3% 17.6% 18.6% Residual earnings 30 17 (52) (32) 55 43 64 Abnormal earnings growth 13 69 (20) (87) 12 (21) (91)
Reebok generated increasing residual earnings and abnormal earnings growth in the early 1990s but, with declining sales growth rates and lower ROCE, was not able to maintain the growth. From 1995 to 2000, Reebok reported little growth in residual earnings, with both lower ROCE and investment growth. Correspondingly, abnormal earnings growth was negative in many years.

A Cyclical Firm: A Cyclical Firm: American AirlinesAmerican Airlines
(Dollar amounts in millions) 2000 1999 1998 1997 1996 1995 Sales 19,703 17,730 16,299 15,856 15,136 15,610 Sales growth rate 11.1% 8.8% 2.8% 4.8% -3.0% 5.2% Common equity 7,176 6,858 6,428 5,354 4,528 3,646 Common equity growth rate 4.6% 6.7% 20.1% 18.2% 24.2% 12.8% ROCE 11.9% 15.6% 18.0% 16.2% 16.7% 6.2% Residual earnings (147) 85 238 107 112 (274) Abnormal earning growth (232) (153) 131 (5) 386 (94)
American Airlines, the air carrier, grew residual earnings from 1996 to 1998. (Residual earnings is calculated using a 14 percent required return, as befits a risky airline.) But airlines are cyclical, as the residual earnings and abnormal earnings growth in the earlier and later years show. Sales growth has been modest and variable, and the increase in ROCE from 1996 to 1998 was also modest, with growth coming from growth in investment. ROCE declined after 1998, even with growing sales, and residual earnings also declined.

Analyzing Growth in Residual Analyzing Growth in Residual EarningsEarnings
• Changes in residual earnings are driven by:
1. Changes in ROCE
2. Changes in required return
3. Changes in investment
1capitaloftcosROCEx
1CSE
0xCSE1capitaloftcosROCE
1RE
Change in residual earnings
Change due to change in ROCE
over the cost of capital
Change dueto change in
common equity= +
1AEG
A reminder: ΔRE=AEG, so this calculation also gives AEG

Analysis of Growth in Residual Analysis of Growth in Residual Earnings and AEG: Nike, Inc.Earnings and AEG: Nike, Inc.
2004 2003 Net operating assets $4,441 $4,395 Net financial obligations 7 495 Common shareholders' equity $4,434 $3,936 Sales $12,253 $10,697 Operating income $ 1,035 $ 423 Return on common equity (ROCE) 22.98% 10.29% Return on net operating assets (RNOA) 23.31% 9.62% Profit margin (PM) 8.45% 3.95% Asset turnover (ATO) 2.76 3.90 Financial leverage (FLEV) 0.001 0.117
Residual Earnings2004 = (22.98% 8.5%) x $.4,434 million = $642.0 million
Residual Earnings2003 = (10.29% 8.5%) x $3,936 million = $70.5 million
RE2004 = (12.69 x $3,936 million) + [$498 million x (22.98% 8.5%)] = $499.5 million + $72.1 million = $571.5 million = AEG2004
[Assumes no change in required equity return]

Analysis of Growth in Residual Analysis of Growth in Residual Earnings and AEG: ReebokEarnings and AEG: Reebok
2004 2003 Net operating assets $972 $685 Net financial obligations (170) (286) Minority interest 11 10 Common shareholders' equity $ 1,131 $ 961 Sales $3,785 $3,485 Operating income $ 237 $ 191 Return on common equity (ROCE) 18.93% 18.12% Return on common equity (before minority interest) 19.19% 18.45% Return on net operating assets (RNOA) 24.40% 27.88% Profit margin (PM) 6.26% 5.48% Asset turnover (ATO) 3.90 5.09 Financial leverage (FLEV) -0.149 -0.294
Residual Earnings2004 = (18.93% 9.0%) x $1,131 million = $112.3 million
Residual Earnings2003 = (18.12% 9.0%) x $961 million = $87.6 million
RE2004 = (0.81% x $961 million) + [$170 million x (18.93% 9.0%)] = $7.8 million + $16.9 million = $24.7 million = AEG2004

Analyzing Change in ROCE: Analyzing Change in ROCE: The SchemeThe Scheme
ROCE RNOA in Financing SPREAD FLEV
Level 1 NOA
Sales from OI Core NOA
ItemsOther Core NOA
Items Unusual = [RNOA NBC]
Core Sales PM ATO Level 2 Core Sales PM x ATO ATO x Core Core NBC Unusual Sales PM Financing Items Level 3 in Core Sales in ATO Drivers in Core in Unusual in Core in Unusual in NFO PM Drivers Other Income Item NBC Drivers Components Components Components Components

Analysis of Changes in ROCEAnalysis of Changes in ROCE
1. Analyze Changes in Profitability of Operations
2. Analyze the Effects of Changes in Financing
SPREAD] x [FLEV RNOA ROCE
(1) (2)

Explaining the Changes in Explaining the Changes in Operational ProfitabilityOperational Profitability
Explaining RNOA
1. Distinguish core and transitory components
Core OI is persistent income from core businessUI is unusual items that are non-recurring, sometimes called transitory or non-
persistent items. All items are after tax
NOA
UI
OIOther Core
Sales from OI Core
NOA
UI
NOA
OI Core RNOA
NOANOA

Explaining Changes in Explaining Changes in Operational Profitability Operational Profitability (cont’d.)(cont’d.)
2. Distinguish margin and turnover drivers of core income
where,
NOA
UI NOA
OIOther Core ATO x PM Sales Core
NOAUI
NOAOIOther Core
NOASales from OI Core RNOA
SalesSales from OI Core PM Sales Core

Explaining Changes in Explaining Changes in Operational Profitability Operational Profitability (cont’d.)(cont’d.)
3. Explain changes in profit margins and asset turnovers
Explain changes in Core PM by looking at profit margin drivers
GM (by segment) Selling Expenses / Sales Administrative Expenses / Sales R&D / Sales
Pay particular attention to GM: per unit sales prices, production costs…
Explain changes in ATO by looking at turnovers Accounts receivables turnover Inventory turnover PPE turnover Accounts payable turnover Operating liability turnover
Also Look at operating asset composition ratios Look at operating liabilities composition
ratios Look at OLLEV

Reformulating Income Statements Reformulating Income Statements to Identify Core and Unusual Itemsto Identify Core and Unusual Items
Core Operating Income Core sales revenue Core cost of sales = Core gross margin Core operating expenses = Core operating income from sales before tax Tax on core operating income from sales + Tax as reported + Tax benefit from net financial expenses Tax allocated to core other operating income Tax allocated to unusual items = Core operating income from sales + Core other operating income +Equity income in subsidiaries +Earnings on pension assets +Other income not from sales Tax on core other income = Core operating income Unusual Items
Special charges Special liability accruals
Nonrecurring items Asset write-downs Changes in estimates Start-up costs expensed
Profits and losses from asset sales Restructuring charges Profits and losses from discontinued operations Extraordinary operating items
Accounting changes Unrealized gains and losses on equity investments + Gains from share issues in subsidiaries Currency gains and losses
Derivative gains and losses (operations) Tax allocated to unusual items = Comprehensive Operating Income
Reformulated Operating Income Statement: Core and Unusual Items

Reformulation to Identify Reformulation to Identify Core Income: NikeCore Income: Nike

Reformulation to Identify Reformulation to Identify Core Income: ReebokCore Income: Reebok

Comprehensive Tax Comprehensive Tax AllocationAllocation
GAAP Income Statement Reformulated Statement
Revenue 4,000$ Core revenue 4,000$ Operating expense (3,400) Core operating expense (3,400)
Restructuring charge (300) Core operating income before tax 600 Interest expense (100) Tax:
Income before tax 200 Tax reported 45$ Income tax 45 Tax benefit of interest 35
Net earnings 155$ Tax on unusual items 105 185
Core operating income after tax 145 Unusual Items:
Restructuring charge 300$ Tax deduction 105 195
Operating income 220 Interest expense 100$ Tax on interest (35) 65
Net earnings 155$

Explaining Changes in Operational Explaining Changes in Operational Profitability: the Calculations Profitability: the Calculations
The change in RNOA is explained as:
Change in RNOA = +
Change in core sales profit margin at previous asset turnover level
Change due to change in asset turnover
Change due to change in other
core income
Change due to change in
unusual items+ +
NOA
UI PM Core x ATO ATO x PM Core RNOA11011
(i)
Effect due to change in
Profit Margin
(ii)
Effect due to change in Asset
Turnover
(iii)
Effect due to Unusual Items
this period
Note: (i) is usually more important that (ii)

Changes in Operational Changes in Operational Profitability: Nike and ReebokProfitability: Nike and Reebok
9.29% 0 + 2.59% + 1.82% = 4,395
335
4,441
74 + 0 + 7.84%) x (0.33 + 2.43) x (0.75% = 13.69% RNOA2004
0.36% 0 + 6.80% 3.77% = 685
18
972
22 + 0 + 5.71%) x 1.19( + 5.09) x (0.74% = 3.48% - RNOA2004
Nike, Inc.
Reebok Int’l, Ltd.

Identifying Sustainable Identifying Sustainable Earnings: Items to ConsiderEarnings: Items to Consider
1. Restructuring charges, asset impairments, special charges
2. Research and development
3. Advertising and promotion
4. Pension expense
5. Changes in estimates
6. Realized gains and losses: Cherry Picking
7. Unrealized gains and losses
8. Income taxes
9. “Other” income

Watch for Bleed Back of Watch for Bleed Back of Restructuring and Merger ChargesRestructuring and Merger Charges
Did IBM create earnings with restructuring charges?
1991
1992
1993
1994
1995
1996
1997
1998
3.7
11.6
8.9
(2.8)
(2.1)
(1.5)
(0.5)
(0.4)
($billions)

Analyze R&DAnalyze R&D
(In billions of dollars) 2004 2003 2002 Sales 22.9 22.5 21.4 R&D 4.0 3.3 2.7 R&D Sales 17.5% 14.7% 12.5% Sales growth rate 2.0% 4.8% 1.2% Income from continuing operations 9.1 9.7 9.9
THE ANALYSIS OF R&D: MERCK & CO.

Analyze Marketing ExpendituresAnalyze Marketing Expenditures
(In billions of dollars) 2004 2003 2002 Revenues 22.0 21.0 19.6 Cost of goods sold 7.6 7.8 7.1 Gross profit 14.4 13.2 12.5 Selling, administrative and general 8.7 8.0 7.0 Operating income (before tax) 5.7 5.2 5.5 Advertising expenses 2.2 1.8 1.7 Advertising expenses/Sales 10.0% 8.6% 8.7%
The Analysis of Advertising Costs: Coca-Cola

Analyze Pension CostsAnalyze Pension Costs
Components of Pension Expense:1. Service Cost
2. Interest Cost
3. Expected Return on Plan Assets
4. Amortization of Prior Service Cost
5. Amortization of Transaction Asset or Liability
6. Changes in Actuarial Estimates (accrual gains and losses)
_____________________________________________________________________ International Business Machines (IBM) Components of pension expense, 2001-2004 (In millions of dollars) 2004 2003 2002 2001
Service cost 1,263 1,113 1,155 1,076 Interest cost 4,071 3,995 3,861 3,774 Expected return on plan assets (5,987) (5,931) (6,253) (6,264) Amortization of transition asset (82) (159) (156) (153) Amortization of prior service cost
66 78 89 80
Actuarial losses (gains) 764 101 105 (24) Net pension expense 95 (803) (1,199) (1,511)

Watch for the Expected Rate of Watch for the Expected Rate of Return on Pension Plan AssetsReturn on Pension Plan Assets
In the 1980s, firms were using expectedrates of return of about 7%
In the 1990s, firms were using expected rates of returns of 10-10½%
•Applying a high rate of return to bubble asset prices produces bubble earnings
•Pricing on the basis of bubble prices perpetuates the bubble
The Pension Pyramid Scheme

Watch for Gains of Pension Watch for Gains of Pension Fund AssetsFund Assets
•General Electric’s expected return on plan assets was $4,327 million in 2001 (22.0% of earnings before tax) against a service cost of $884 million. Its net pension expense was a gain of $2,095 million.
•IBM reported an expected return on plan assets of $6,264 million in 2001 (56.0% of operating income before tax).

Watch Gains and Losses on Watch Gains and Losses on Sales of SharesSales of Shares
Intel In its report for its third quarter for 1999, Intel reported net income of $1,458 million, with no indication of unusual items. Its cash flow statement, however, reported $556 million in gains on sales of investments, along with a $161 million loss on retirements of plant, as add backs to net income to calculate cash from operations. Delta Air Lines Delta reported operating income (before tax) of $350 million for its September quarter in 1999. However, notes to the report indicated that these earnings included pre-tax gains of $252 million from selling its interest in Singapore Airlines and Priceline.com. IBM IBM reported before-tax operating income of $4,085 for its June, 1999 quarter. However, footnotes revealed that this income included a $3,430 million gain from the sale of IBM's Global Network to AT&T. This gain reduced selling, general and administrative expenses in the income statement!

Watch for Changes in Watch for Changes in EstimatesEstimates
– Bad debt allowances– Deferred revenue – Warranty allowances– Residual values for leases
Beware of Cookie Jar Accounting
Watch Income TaxesWatch Income Taxes
– One-time or expiring credits
– Changes in valuation allowances for deferred tax assets
Effective tax rates tend to move
towards the statutory rate overtime

Analyzing Operating LeverageAnalyzing Operating Leverage
Operating Leverage is the proportion of total costs that are fixed versus variable
SalesCosts Fixed -
SalesMarginon Contributi
SalesCosts Fixed -Cost Variable - Sales PM Sales
The first component here is called the contribution margin ratio
SalesMarginon Contributi
SalesCosts Variable- 1 RatioMargin on Contributi
This ratio measures the change in income from a change in one dollar of sales
Operating Leverage MeasuresOperating Leverage Measures
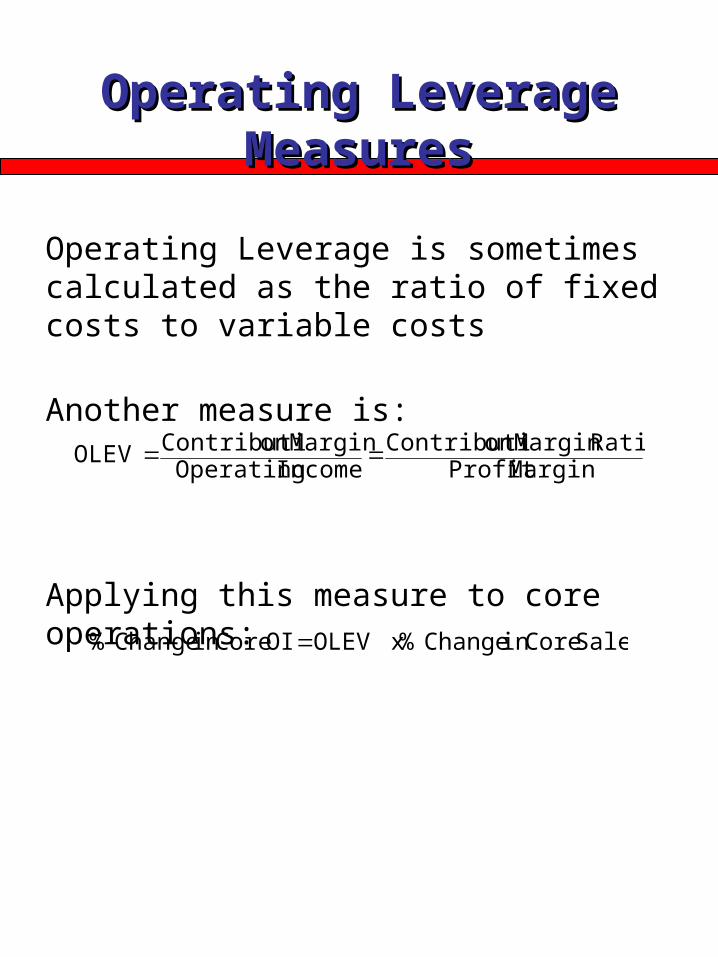
Operating Leverage is sometimes calculated as the ratio of fixed costs to variable costs
Another measure is:
Applying this measure to core operations:
MarginProfit RatioMargin on Contributi
Income OperatingMarginon Contributi OLEV
Sales Corein Change % x OLEV OI Corein Change %

Analysis of Effect of Changes Analysis of Effect of Changes in Financingin Financing
SPREAD] x [FLEV RNOA ROCE
Effect of Financing
Change in ROCE
= Change in RNOA Change due to change in
financial leverage
Change due to change in spread at previous level of
financial leverage
+ +
11011 ΔFLEVx SPREAD FLEV x ΔSPREAD ΔRNOA ΔROCE
(i)
Effect of change in operating profitability
(ii)
Effect of change in spread
(iii)
Effect of change in leverage

Effect of Changes in Financing: Effect of Changes in Financing: Reebok Stock RepurchaseReebok Stock Repurchase
Explaining ΔROCE
In 1996, Reebok borrowed $600 million to repurchase stock
1996 1995Net operating assets 1135 1220Net financial obligations 720 287Common shareholders' equity 415 933ROCE 18.90% 19.20%RNOA 14.10% 16.90%Net borrowing cost (NBC) 4.90% 4.80%Financial leverage (FLEV) 0.515 0.187
Summary Reformulated Balance Sheets(in millions of dollars)
If financial leverage had been maintained at 1995 level,
15.8% 4.9) (14.1 x 0.187 14.1 ROCE
SPREAD) x (FLEV RNOA ROCE
1996
-
3.02% 0.54% - -2.8%
9.2% x 0.328 0.187 x 2.9%- 2.8%- 0.3%- ROCE1996

Explaining Changes in the Explaining Changes in the SPREADSPREAD
SPREAD = RNOA – NBC
RNOA has been explained
Explain Change in NBC:
Distinguish core and unusual borrowing cost
Core financing expenses Change in interest rates (risk free and risk
premium) Change in tax rates (and shield) Substitution of preferred for debt financing
Unusual financing expenses Tax effect from unusually high or low taxes
(operating losses) Interest income from tax refunds of prior years Gains and losses on financial items
NFOexp. financing Unusual
NFOexp. financing Core NBC

A Rough ApproximationA Rough Approximation
• Some observationsThe change in leverage effect (iii) is
generally minorThe change in borrowing costs is
generally small (then, Spread is largely determined by RNOA)
The RNOA effect (i) is generally the largest
• So, if FLEV and NBC are small, a useful approximation is
FLEV Average 1RNOA x ROCE

Breakdown of Growth in Breakdown of Growth in Equity InvestmentEquity Investment
CSE
NOA NFO
Sales ATO
1
Changes in Sales forBusiness SegmentsOr Product Lines
Changes in IndividualAsset Turnovers
Changes in NFOComponents

Analysis of Growth in Equity Analysis of Growth in Equity InvestmentInvestment
These components of growth in equity investment:
1. Growth in sales
2. Change in net operating assets that support each dollar of sales
3. Change in the amount of net debt that is used to finance the change in net operating assets rather than equity
NFO ATO
1 x Sales CSE
ATO1 x Sales NOA
NOASales ATO as But,
NFO - NOA CSE
then
,

Analysis of Growth in Common Analysis of Growth in Common Equity: Nike and ReebokEquity: Nike and Reebok
Change in Common Equity
= Change due to change in sales at previous level of
asset turnover
Change in financial leverage
Change due to change in asset turnover
+ +
20042004
20042003
20042004 NFO - Sales ATO
1
ATO
1 x Sales ΔCSE
x
million $498
million $453 million $594 -million $639
million $453 million $12,253 x 0.0485- 0.411million x $1,556 2004CSE
Nike
Reebok
million $170
million $117 million $228 million $59-
million $225 - million $3,785 x 0.0601 0.197million x $300 CSE2004

Preparing Financial Preparing Financial Statements for ForecastingStatements for Forecasting
1. Identify dirty surplus and calculate ROCE from statement of shareholders’ equity
2. Reformulate balance sheet
3. Reformulate income statement
4. Decompose ROCE: Profitability Analysis
5. Analyze ROCE: Sustainability of Earnings
6. Analyze Growth
Now you are ready to forecast future ROCE and growth and carry out valuations

Using Growth Analysis to Using Growth Analysis to Understand P/B and P/E RatiosUnderstand P/B and P/E Ratios
•How does P/B relate to growth?
•How does P/E relate to growth?
•How does P/E relate to transitory earnings?

A reminder: The Benchmark Case of A reminder: The Benchmark Case of Normal P/B and Normal P/ENormal P/B and Normal P/E
Normal P/B Ratio Normal P/E Ratio
Book values expected to grow at equity cost of capital
Residual earnings expected to be zero
Earnings expected to grow at equity cost of capital
Abnormal earnings growth expected to be zero (Residual earnings expected to be unchanged)
Trailing normal P/E:
Forward normal P/E:
00 CSEV E
10
00
E
E
Earn
dV E
1
1
1
0
E
E
Earn
V

A Normal P/E: Whirlpool A Normal P/E: Whirlpool CorporationCorporation
Valuation:
(approx)
(approx)
These are normal P/E for a 10% cost of capital
______________________________________________________________________________
Whirlpool Corp.: Analyst Forecast, December, 1994
1993A 1994A 1995E 1996E 1997E
Eps 4.43 4.75 5.08 5.45
Dps 1.22 1.28 1.34 1.41
Bps 22.85 25.83 29.30 33.04 37.07
RE (.10) 2.15 2.17 2.15 2.15
AEG 0.02 (0.02) (0.00)
______________________________________________________________________________
3347100152
8325VE
0 ...
.
00.1133.4
22.133.47V
0
0E0
Earn
d
00.1075.4
33.47
1
0 Earn
V E

P/E Ratios Different from NormalP/E Ratios Different from Normal
• If earnings are expected to grow faster than the cost of capital (cum-dividend), P/E > Normal
• If earnings are expected to grow slower than the cost of capital (cum-dividend), P/E < Normal
OR
• If AEG is forecasted to be positive, P/E > Normal
• If AEG is forecasted to be negative, P/E < Normal
OR
• If RE is forecasted to increase, P/E > Normal• If RE is forecasted to decrease, P/E <Normal

The P/E Ratio and the P/B The P/E Ratio and the P/B RatioRatio
• P/B indicates expected growth in book value
• P/E indicates expected growth in earnings
OR
• P/B indicates future RE
• P/E indicates future changes in RE from current RE

How do P/E and P/B Articulate?How do P/E and P/B Articulate?
High Low
Low
High
P/B
P/E
Joint Values of P/E and P/B Ratios; 1963-2001
23,146 10,848
10,849 23,147

Median P/B for E/P Portfolios: Median P/B for E/P Portfolios: 1968-851968-85
_______________________________________________________ E/P
Portfolio Median
E/P Median
P/B _______________________________________________________
1 (High) .255 .645 2 .193 .806 3 .169 .889 4 .154 .938 5 .142 .988 6 .133 1.038 7 .124 1.107 8 .116 1.162 9 .109 1.251 10 .102 1.350 11 .094 1.460 12 .087 1.545 13 .080 1.744 14 .072 1.902 15 .063 2.081 16 .052 2.254 17 .039 2.473 18 .017 2.304 19 -.046 1.428
20 (Low) -.417 .833 ______________________________________________________

Median E/P for P/B Portfolios: Median E/P for P/B Portfolios: 1968-851968-85
_______________________________________________________ P/B
Portfolio Median
P/B Median
E/P _______________________________________________________
1 (High) 6.20 .040 2 3.66 .055 3 2.82 .067 4 2.33 .077 5 2.00 .085 6 1.76 .091 7 1.58 .097 8 1.43 .102 9 1.31 .105 10 1.22 .110 11 1.13 .115 12 1.05 .121 13 .98 .126 14 .92 .130 15 .85 .130 16 .79 .129 17 .72 .129 18 .64 .127 19 .54 .113
20 (Low) .39 .084 ______________________________________________________

Fill Out the CellsFill Out the Cells(this is not TIC-TAC-TOE)(this is not TIC-TAC-TOE)
High
High
Normal
Low
Normal LowP/E
P/B
Which cell do growth firms fall in ?
A B C
D E F
G H I

The SolutionThe Solution
High
High
Normal
Low
Normal Low
P/E
P/B
RE = Expected future residual earnings
RE0 = Current residual earnings
RE>RE0
RE0<0
RE>RE0
RE=RE0
RE0=0
RE=RE0
RE<RE0
RE0>0
RE<RE0
(RE>0) (RE=0) (RE<0)
RE=RE0
RE0<0RE0>0
RE0>0
RE0<0RE>RE0
RE<RE0

A High P/B; High P/E B Normal P/B; High P/E C Low P/B; High P/E
Nike, Inc.
The market gave Nike a P/B of 4.1 and a P/E of 21 in 2005, both high relative to normal ratios. Current residual earnings were $642 million and analysts were forecasting earnings that indicated higher residual earnings in the future.
Westcorp
Westcorp, a financial services holding company, reported earnings for 1998 of 0.65 per share and an ROCE of 5.4%. Analysts in 1999 forecasted earnings of $1.72 for 1999 and $2.00 for 2000, which translate into an ROCE of 13.6% and 14.1% respectively. With a forecasted ROCE at about the (presumed) cost of capital but increasing from the current level this is a cell B firm. The market gave the firm a P/B of 1.10 and a P/E of 24.
Rocky Shoes & Boots, Inc.
Like Nike, a footwear manufacturer, Rocky Shoes reported an ROCE of 1.8% for 1998 with earnings of 0.21 per share. Analysts forecast an ROCE of 6.2% for 1999 and 7.8% for 2000, on earnings of 0.72 and 0.95 respectively. The market gave the firm a P/B of 0.6 and a P/E of 33, appropriate for a firm with forecasted ROCE less than the (presumed) cost of capital but with increasing ROCE.
D High P/B; Normal P/E E Normal P/B, Normal P/E F Low P/B; Normal P/E
Whirlpool Corp.
Whirlpool, with a positive but constant RE was a cell D firm in 1994. Whirlpool was priced at 11 times earnings (cum-dividend), as we saw, and at 1.8 times book value.
Horizon Financial Corp.
Horizon Financial Corp., a bank holding company, reported an ROCE of 10.3% for fiscal 1999. Analysts forecasted that ROCE would be 10.6% for 2000 and after, roughly at the same level. If the equity cost of capital is 10%, this firm should have a normal P/B and a normal P/E. The stock traded at 11 times earnings and 1.0 times book value.
Rainforest Cafe Inc.
In 1999, analysts covering Rainforest Cafe, the theme restaurant (“a wild place to eat”), forecasted earnings of $0.62 per share for 1999 and $0.71 for 2000, or an ROCE of 6.8% and 7.2%. The stock traded at a P/B of 0.6, reflecting the low anticipated ROCE. The ROCE for 1998 was 6.5%. With 1998 profitability similar to forecasted profitability, the stock should sell at a normal P/E ratio. And indeed it did: the P/E at the time of the forecasts was 11.
G High P/B; Low P/E H Normal P/B; Low P/E I Low P/B; Low P/E
US Airways Group
US Airways reported an ROCE of 81% in 1998. Analysts deemed 1998 to be a particularly good year and forecast ROCE for 1999 and 2000 down to 29% and 33%. The stock traded at 12.6 times book value, consistent with high ROCE in the future, but at a P/E of only 4.
America West Holdings
America West Holdings, the holding company for America West Airlines had an ROCE of 15.0% in 1998. Analysts forecasted in 1999 that the ROCE would decline to 11.7% by 2000. The market gave the stock a P/B of 1.0 in 1999, in line with the forecasted ROCE equaling the cost of capital. But the P/E was 7, consistent with the expected drop in the ROCE.
UAL Corporation
United Airlines’ holding company traded at a P/B of 0.7 in mid-1999 and a P/E of 6. It reported an ROCE of 29.2% for 1998, but its ROCE was expected by analysts to drop to 10.6% (before a special gain) in 1999 and to 9.1% in 2000.

What is a Growth Stock?What is a Growth Stock?
• P/E indicates growth in RE but this could be from a very low base: Firms in cell C can be high P/E firms
• Trailing P/E reflects growth and transitory earnings. If earnings are temporarily low, P/E will be high
The Molodovsky Effect:
– Cells B and H are pure Molodovsky effects
– Cells A, C, G and I are mixed growth and Molodovsky effects