chapter 12 standard costing - yolahkiaatevening.yolasite.com/resources/pmnotes/ch16-basic... · web...
TRANSCRIPT

Chapter 16 Variance Analysis
1. Objectives
1.1 Calculate, identify the cause of and interpret basic variances:(a) Sales price and volume, including sales mix and quantity variances.(b) Materials total, price and usage, including material mix and yield variances(c) Labour total, rate and efficiency(d) Variable overhead total, expenditure and efficiency(e) Fixed overhead total, expenditure and, where appropriate, volume, capacity
and efficiency1.2 Calculate the effect of idle time and waste on variances including where idle time has
been budgeted for.1.3 Produce full operating statements in both a marginal cost and full absorption costing
environment, reconciling actual profit to budgeted profit.1.4 Identify the causes of labour, material, overhead and sales margin variances.
242

2. Standard Costing System
2.1 Standard costing is a technique which establishes predetermined estimated of the costs of products and services and then compares these predetermined costs with actual costs as they are incurred. The predetermined costs are known as standard costs and the difference between the standard cost and actual cost is known as a variance.
2.2 The process by which the total difference between actual cost and standard cost is broken down into its different elements is known as variance analysis.
2.3 It can be used in a variety of costing situations, batch and mass production, process manufacture, transport, certain aspects of repetitive clerical work and even in jobbing manufacture. Undoubtedly, the greatest benefit is gained when the manufacturing method involves a substantial degree of repetition. Its major application in practice is in organizations involved in mass production and/or repetitive assembly work.
2.4 Standard-setting
2.4.1 Standards are set for each element of cost in the production of a unit of output. It provides estimating the quantity of the resource used and its associated costs. In addition a standard selling price is set.
2.4.2 Direct materials(i) Product specifications are derived from study (or average past performance).(ii) Quantity standards are recorded, for example, as a bill of materials.(iii) Standard prices are obtained from the purchasing department which researches
alternative suppliers and selects those which can provide: Required quantity Sound quality Most competitive price
2.4.3 Direct labour(i) “Time and motion” studies of operations may be used to determine the most
efficient production method.(ii) Time managements determine standard hours for the average worker to complete
a job.(iii) Wages rates are determined by company policy/negotiations between
management and unions.2.4.4 Variable overheads
(i) A standard variable overhead rate per unit of activity is calculated.(ii) If there is no observable direct relationship between resources and output, past
data is used to predict.
243

(iii) The activity measure that exerts the greatest influence on costs is investigated – usually direct labour hours (or machine hours).
2.4.5 Fixed overheads(i) Because fixed costs are largely independent of changes in activity, they are
constant over wide ranges in the short term.(ii) Therefore, for control purposes, a fixed overhead rate per unit of activity is
inappropriate.
2.5 Advantages and limitation of standards
2.5.1 Advantages of standards(i) Managerial planning – It greats deal in ensuring that all available resources are
utilized optimally and so leading to maximize the profits of the enterprise.(ii) Coordination – It helps the coordination of different functions such as
manufacturing, marketing, engineering, accounting, etc., towards a common goal.
(iii) Cost control – It helps the company to identify the activities which fail to come up to the standards fixed and those which exceed such standards, through the ‘principle of exception’.
(iv) Economy in record keeping – Standard costs reduce clerical effort and expense.(v) Incentives to employees – Standards motivate the staff to work more efficiently
in the accomplishment of company objectives. Many incentives and rewards like cash bonus can be based on actuals as related to standards.
2.5.2 Limitations of standards(i) High start-up expenses – Fixing of standards and their implementation calls for
substantial expenditure initially.(ii) Difficulties in determining standard costs – It involves a high degree of accuracy
to determine the standard costs. Thus, a good number of assumptions will have to be made to cover many situations.
(iii) Implementation in case of some industries poses difficulties – especially in non-standardised products.
(iv) Opposition from employees – The employees consider the standard costing as an oppressive measure solely intended to extract the maximum from them.
244

2.6 Overview of principles
2.7 Purposes of standard costing
2.7.1 Standard costing systems are widely used because they provide cost data for many different purposes. The following are the major purposes for which a standard costing system can be used:(i) To assist in setting budgets and evaluate managerial performance.(ii) To act as control device by highlighting those activities that do not conform to
plan, and thus alerting decision-makers to those situations that may be ‘out of control’ and in need of corrective action.
(iii) To provide a prediction of future costs that can be used for decision-making purposes.
(iv) To simplify the task of tracing costs to products for inventory valuation purposes.
(v) To provide a challenging target that individuals are motivated to achieve.
245

3. Variance Analysis
3.1 It will be recalled from the previous section that a variance is the difference between standard cost and actual cost. The process by which the total difference between standard and actual costs is sub-divided is known as variance analysis which can be defined as: “The analysis of variances arising in a standard costing system into their constituent parts.”
3.2 Variances may be ADVERSE (or UNFAVOURABLE), i.e. where actual cost is greater than standard, or they may be FAVOURABLE, i.e. where actual cost is less than standard.
3.3 The only purpose of variance analysis is to provide practical pointers to the causes of off-standard performance so that management can improve operations, increase efficiency, utilize resources more effectively and reduce costs.
3.4 The types of variances which are identified must be those which fulfill the needs of the organization. The only criterion for the calculation of a variance is its usefulness – if it is not useful for management purposes, it should not be produced.
246
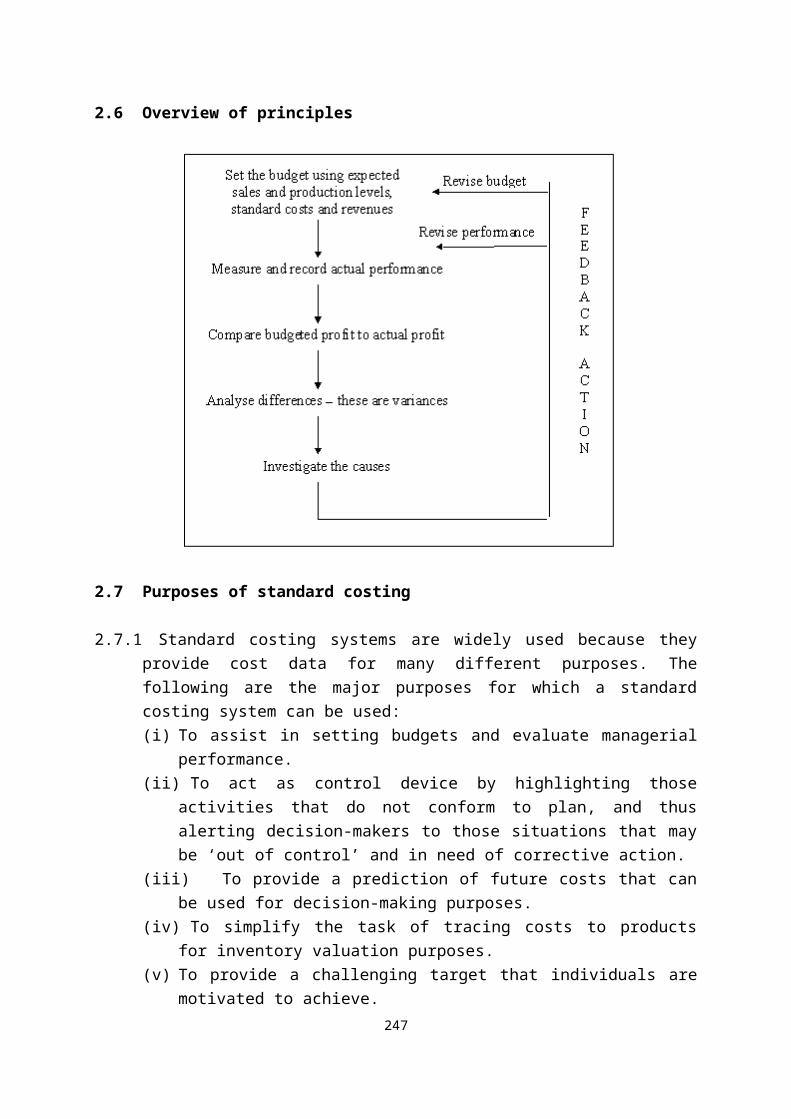
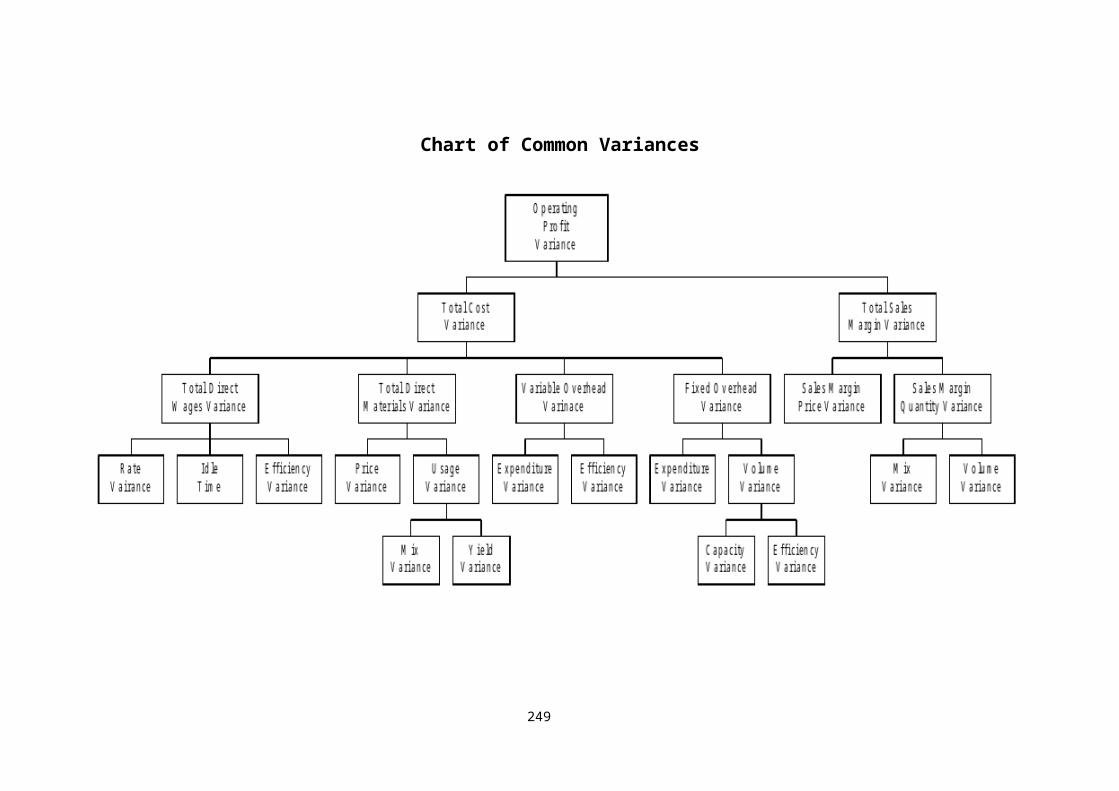
Chart of Common Variances
247

3.5 Material variances
3.5.1 A particular problem arises with materials variances in that materials can be charged to production at either actual prices or standard prices. This affects when the price variance is calculated, i.e. either at the time of purchase or at the time of usage.
3.5.2 The procedure where materials are charged to production at standard price has many advantages. This method means that variances are calculated as soon as they arise, and that they are more easily related to an individual’s responsibility (i.e. a price variance would be the buyer’s responsibility).
3.5.3 Formulae for materials variances
1. Total material cost variance = (SP x SQ – AP x AQ)2. Material price variance = (SP – AP) x AQ3. Material usage variance = (SQ – AQ) x SP
Where:SP = Standard PriceAP = Actual PriceSQ = Standard Quantity for actual outputAQ = Actual quantity
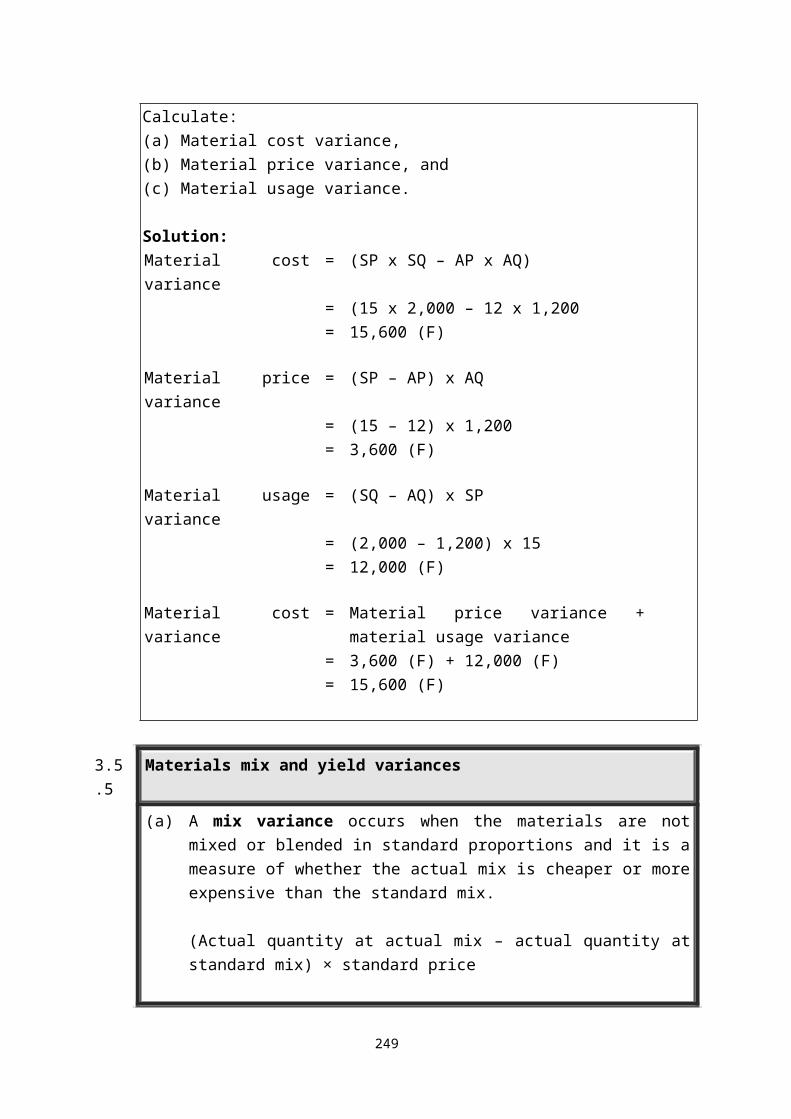
3.5.4 Example 1Standard price $15.00 per KgActual price $12.00 per KgStandard quantity 2,000 KgActual quantity 1,200 Kg
Required:
Calculate:(a) Material cost variance,(b) Material price variance, and(c) Material usage variance.
Solution:Material cost variance = (SP x SQ – AP x AQ)
= (15 x 2,000 – 12 x 1,200
248
= 15,600 (F)
Material price variance = (SP – AP) x AQ= (15 – 12) x 1,200= 3,600 (F)
Material usage variance = (SQ – AQ) x SP= (2,000 – 1,200) x 15= 12,000 (F)
Material cost variance = Material price variance + material usage variance
= 3,600 (F) + 12,000 (F)= 15,600 (F)
3.5.5 Materials mix and yield variances
(a) A mix variance occurs when the materials are not mixed or blended in standard proportions and it is a measure of whether the actual mix is cheaper or more expensive than the standard mix.
(Actual quantity at actual mix – actual quantity at standard mix) × standard price
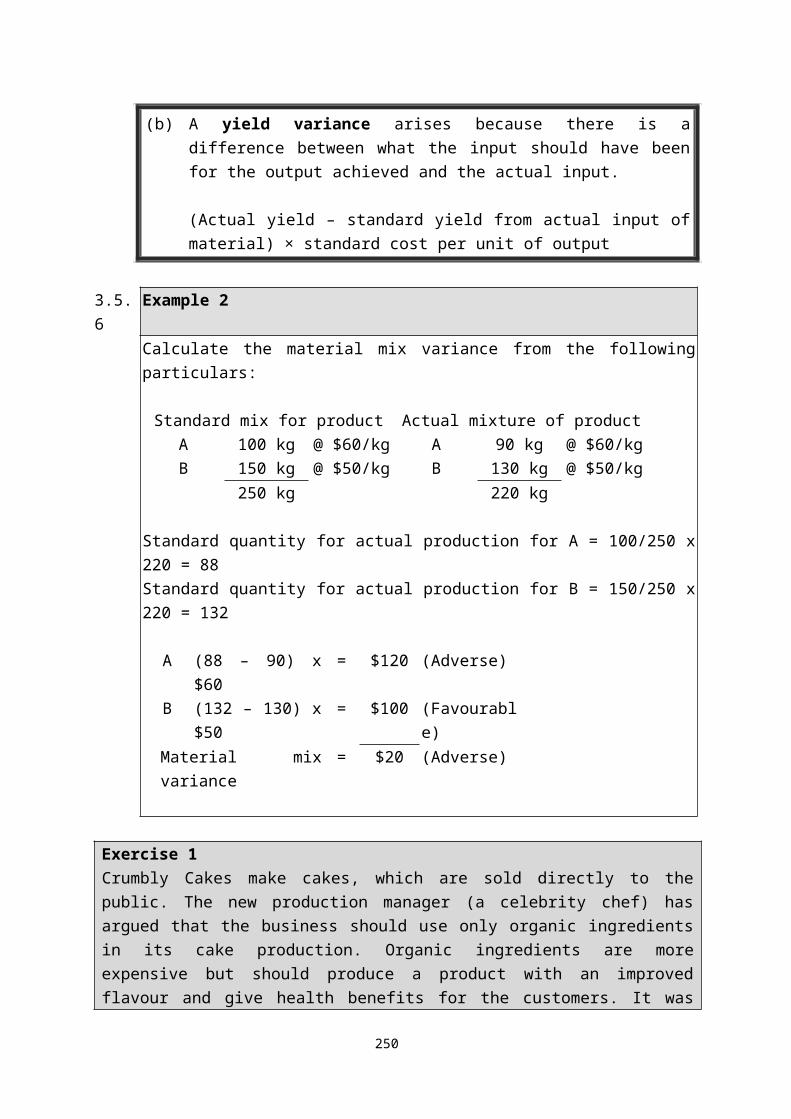
(b) A yield variance arises because there is a difference between what the input should have been for the output achieved and the actual input.
(Actual yield – standard yield from actual input of material) × standard cost per unit of output
3.5.6 Example 2Calculate the material mix variance from the following particulars:
Standard mix for product Actual mixture of productA 100 kg @ $60/kg A 90 kg @ $60/kgB 150 kg @ $50/kg B 130 kg @ $50/kg
250 kg 220 kg
249

Standard quantity for actual production for A = 100/250 x 220 = 88Standard quantity for actual production for B = 150/250 x 220 = 132
A (88 – 90) x $60 = $120 (Adverse)B (132 – 130) x $50 = $100 (Favourable)Material mix variance = $20 (Adverse)
Exercise 1Crumbly Cakes make cakes, which are sold directly to the public. The new production manager (a celebrity chef) has argued that the business should use only organic ingredients in its cake production. Organic ingredients are more expensive but should produce a product with an improved flavour and give health benefits for the customers. It was hoped that this would stimulate demand and enable an immediate price increase for the cakes.
Crumbly Cakes operates a responsibility based standard costing system which allocates variances to specific individuals. The individual managers are paid a bonus only when net favourable variances are allocated to them.
The new organic cake production approach was adopted at the start of March 2009, following a decision by the new production manager. No change was made at that time to the standard costs card. The variance reports for February and March are shown below (Fav = Favourable and Adv = Adverse)
Manager responsible Allocated variances February MarchVariance ($) Variance ($)
Production manager Material price (total for all ingredients 25 Fav 2,100 Adv
Material mix 0 600 AdvMaterial yield 20 Fav 400 Fav
Sales manager Sales price 40 Adv 7,000 FavSales contribution volume 35 Adv 3,000 Fav
The production manager is upset that he seems to have lost all hope of a bonus under the new system. The sales manager thinks the new organic cakes are excellent and is very pleased with the progress made.
250
Crumbly Cakes operate a JIT stock system and holds virtually no inventory.
Required:
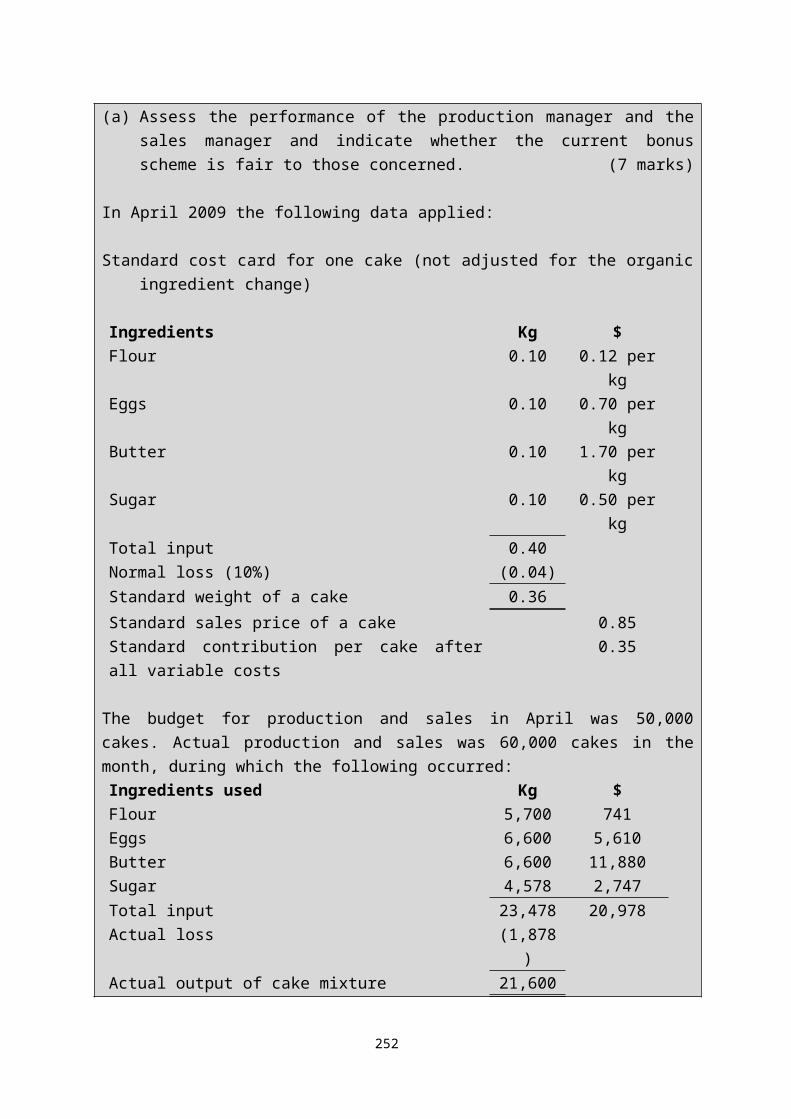
(a) Assess the performance of the production manager and the sales manager and indicate whether the current bonus scheme is fair to those concerned. (7 marks)
In April 2009 the following data applied:
Standard cost card for one cake (not adjusted for the organic ingredient change)
Ingredients Kg $Flour 0.10 0.12 per kgEggs 0.10 0.70 per kgButter 0.10 1.70 per kgSugar 0.10 0.50 per kgTotal input 0.40Normal loss (10%) (0.04)Standard weight of a cake 0.36
Standard sales price of a cake 0.85Standard contribution per cake after all variable costs 0.35
The budget for production and sales in April was 50,000 cakes. Actual production and sales was 60,000 cakes in the month, during which the following occurred:Ingredients used Kg $Flour 5,700 741Eggs 6,600 5,610Butter 6,600 11,880Sugar 4,578 2,747Total input 23,478 20,978Actual loss (1,878)Actual output of cake mixture 21,600
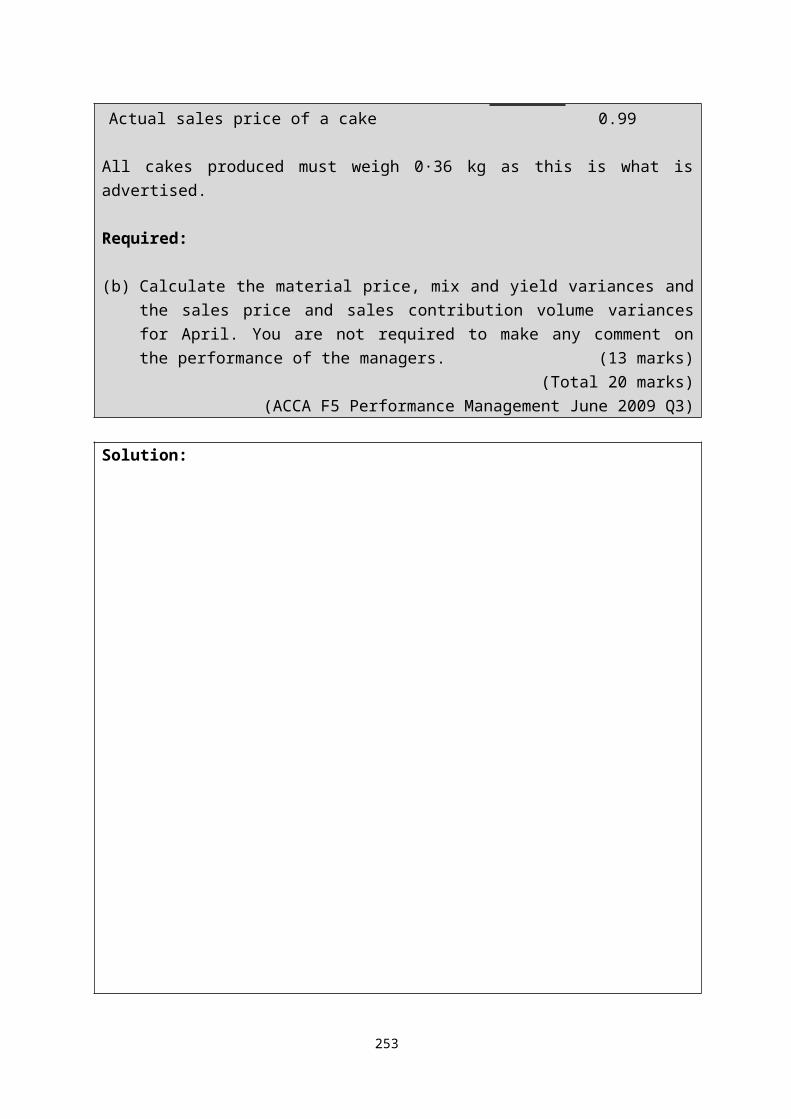
Actual sales price of a cake 0.99
All cakes produced must weigh 0·36 kg as this is what is advertised.
251
Required:
(b) Calculate the material price, mix and yield variances and the sales price and sales contribution volume variances for April. You are not required to make any comment on the performance of the managers. (13 marks)
(Total 20 marks)(ACCA F5 Performance Management June 2009 Q3)
Solution:
252

3.5.7 Typical causes of material variances(a) Material price variance
(i) Recent changes in purchase price of materials.(ii) Failure to purchase anticipated quantities when standards were established
resulting in higher prices owing to non-availability of quantity purchase discounts.
(iii) Not taking cash discounts anticipated at the time of setting standards resulting in higher prices.
(iv) Substituting raw material differing from original materials specifications.(v) Freight cost changes and changes in purchasing and store-keeping costs if
these are debited to the material cost.(b) Materials usage variance
(i) Pool materials handling.(ii) Inferior workmanship by machine operator.(iii) Faulty equipment.(iv) Cheaper, defective raw material causing excessive scrap.(v) Inferior quality control inspection.(vi) Pilferage.(vi) Wastage due to inefficient production method.
3.6 Labour variances
3.6.1 The cost of labour is determined by the price paid for labour and the quantity of labour used. Thus a price and quantity variance will also arise for labour. Unlike materials, labour cannot be stored, because the purchase and usage of labour normally takes place at the same time. Hence the actual quantity of hours purchased will be equal to the actual quantity of hours used for each period. For this reason the price variance plus the quantity variance should agree with the total labour variance.
3.6.2 Idle time may be caused by machine breakdowns or not having work to give to employees, perhaps because of bottlenecks in production or a shortage of orders from customers. When it occurs, the labour force is still paid wages for time at work, but no
253
actual work is done. Such time is unproductive and therefore inefficient.3.6.3 Formulae for labour variances
1. Labour cost variance = SR x SH – AR x AH2. Labour rate variance = (SR – AR) x AH3. Labour efficiency variance = (SH – AH) x SR
Where:SR = Standard RateAR = Actual RateSH = Standard HoursAH = Actual Hours
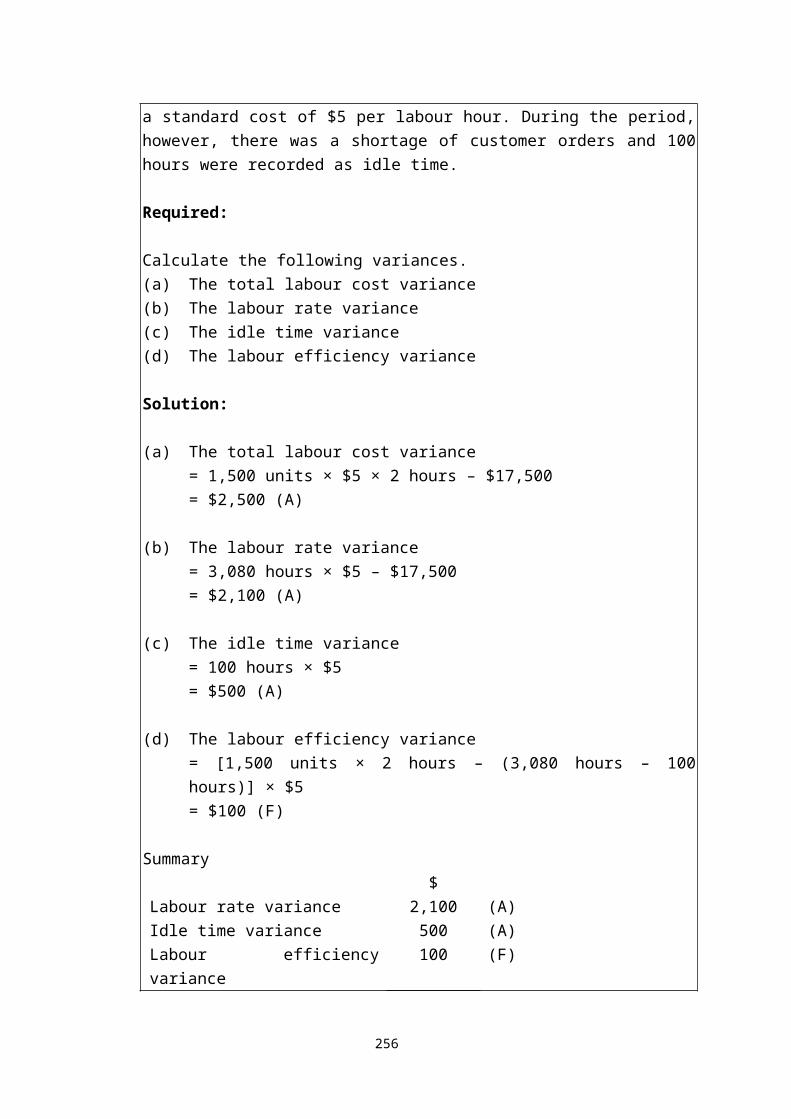
3.6.4 Example 3During December, 1,500 units of X were made and the cost of grade Z labour was $17,500 for 3,080 hours. A unit of product X is expected to use 2 hours of grade Z labour at a standard cost of $5 per labour hour. During the period, however, there was a shortage of customer orders and 100 hours were recorded as idle time.
Required:
Calculate the following variances.(a) The total labour cost variance(b) The labour rate variance(c) The idle time variance(d) The labour efficiency variance
Solution:
(a) The total labour cost variance= 1,500 units × $5 × 2 hours – $17,500= $2,500 (A)
(b) The labour rate variance= 3,080 hours × $5 – $17,500= $2,100 (A)
254
(c) The idle time variance= 100 hours × $5= $500 (A)
(d) The labour efficiency variance= [1,500 units × 2 hours – (3,080 hours – 100 hours)] × $5= $100 (F)
Summary$
Labour rate variance 2,100 (A)Idle time variance 500 (A)Labour efficiency variance 100 (F)Total labour cost variance 2,500 (A)
Remember that, if idle time is recorded, the actual hours used in the efficiency variance calculation are the hours worked and not the hours paid for.
3.6.5 Typical causes of labour variances(a) Labour rate variance
(i) Employing workers of different wage rates.(ii) Changes in the basic wage rates.(iii) Use of a different method of wages payment.(iv) New workers not being allowed full normal wage rates.(v) Unscheduled overtime.
(b) Labour efficiency variance(i) Operator’s ability and efficiency below standard.(ii) Incompetent supervision and incorrect instructions.(iii) Poor working conditions.(iv) Change in the method of operation.(v) Machine breakdowns.(vi) Increase in labour turnover.
3.7 Variable overhead variances
3.7.1 Overhead cost variance is the difference between the actual overheads incurred and the standard overheads. The overhead cost variance may be defined as ‘the difference
255

the standard cost of overhead absorbed for the output achieved and the actual overhead cost.’
3.7.2 Formulae for variable overhead cost variances
1. Variable overhead variance = SVO – AVO2. Variable overhead efficiency variance = (SH – AH) x SVOR3. Variable overhead expenditure variance = (SVOR – AVOR) x AH
Where:SVO = Standard Variable OverheadAVO = Actual Variable OverheadSH = Standard Hours of OutputAH = Actual Hours workedSVOR = Standard Variable Overhead RateAVOR = Actual Variable Overhead Rate
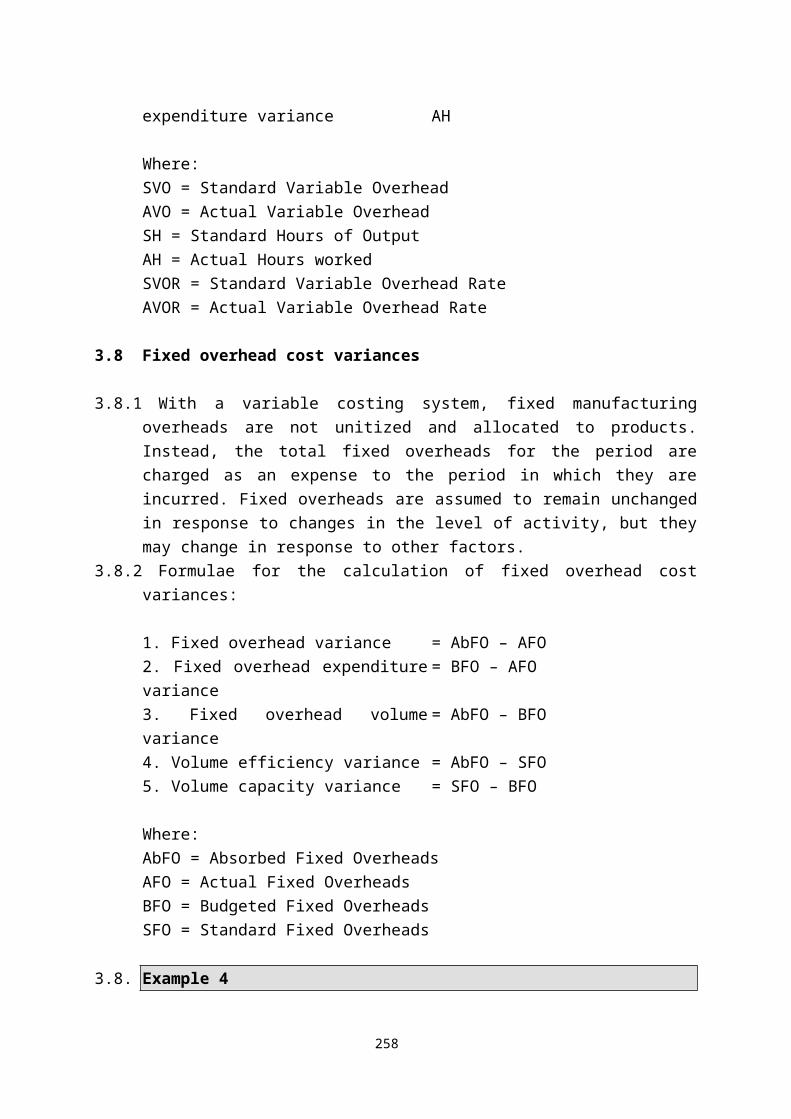
3.8 Fixed overhead cost variances
3.8.1 With a variable costing system, fixed manufacturing overheads are not unitized and allocated to products. Instead, the total fixed overheads for the period are charged as an expense to the period in which they are incurred. Fixed overheads are assumed to remain unchanged in response to changes in the level of activity, but they may change in response to other factors.
3.8.2 Formulae for the calculation of fixed overhead cost variances:
1. Fixed overhead variance = AbFO – AFO2. Fixed overhead expenditure variance = BFO – AFO3. Fixed overhead volume variance = AbFO – BFO4. Volume efficiency variance = AbFO – SFO 5. Volume capacity variance = SFO – BFO
Where:AbFO = Absorbed Fixed OverheadsAFO = Actual Fixed OverheadsBFO = Budgeted Fixed OverheadsSFO = Standard Fixed Overheads
256

3.8.3 Example 4The following information was obtained from the records of a manufacturing unit using Standard Costing System:
Budgeted ActualProduction per month 2,500 units 2,000 unitsAssume 8 hours/dayWorking days 25 26Fixed overhead $50,000 $45,000Variable overhead $15,000 $15,000
Required:
To calculate the following overhead variance.(a) Variable overhead variance(b) Fixed overhead variance
Solution:
Working hours available/day = 25 x 8 = 200 hours
Standard time = = 0.08 hr/unit
Variable overhead absorption rate =Budgeted variable overhead
Planned production in standard hours= $15,000 / 200 hours= $75/hour
Fixed overhead absorption rate =Budgeted fixed overhead
Planned production in standard hours= $50,000 / 200 hours= $250/hour
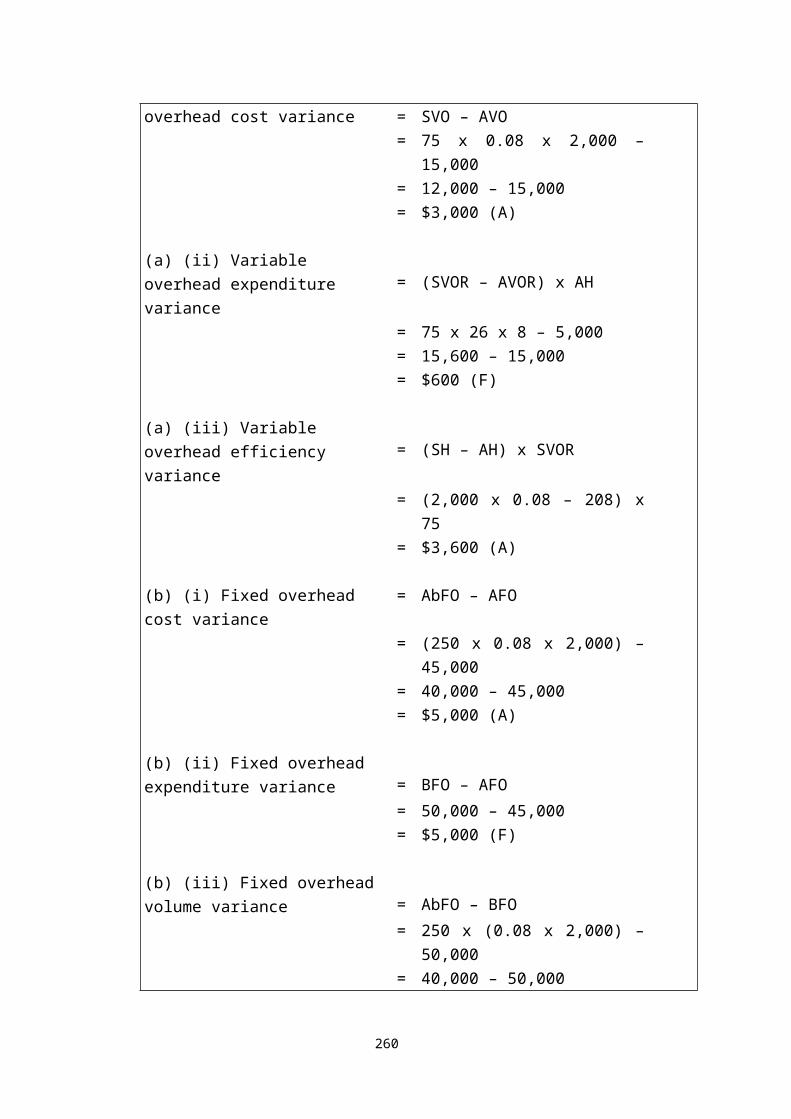
(a) (i) Variable overhead cost variance = SVO – AVO
= 75 x 0.08 x 2,000 – 15,000= 12,000 – 15,000= $3,000 (A)
257
(a) (ii) Variable overhead expenditure variance = (SVOR – AVOR) x AH
= 75 x 26 x 8 – 5,000= 15,600 – 15,000= $600 (F)
(a) (iii) Variable overhead efficiency variance = (SH – AH) x SVOR
= (2,000 x 0.08 – 208) x 75= $3,600 (A)
(b) (i) Fixed overhead cost variance = AbFO – AFO= (250 x 0.08 x 2,000) – 45,000= 40,000 – 45,000= $5,000 (A)
(b) (ii) Fixed overhead expenditure variance = BFO – AFO
= 50,000 – 45,000= $5,000 (F)
(b) (iii) Fixed overhead volume variance = AbFO – BFO
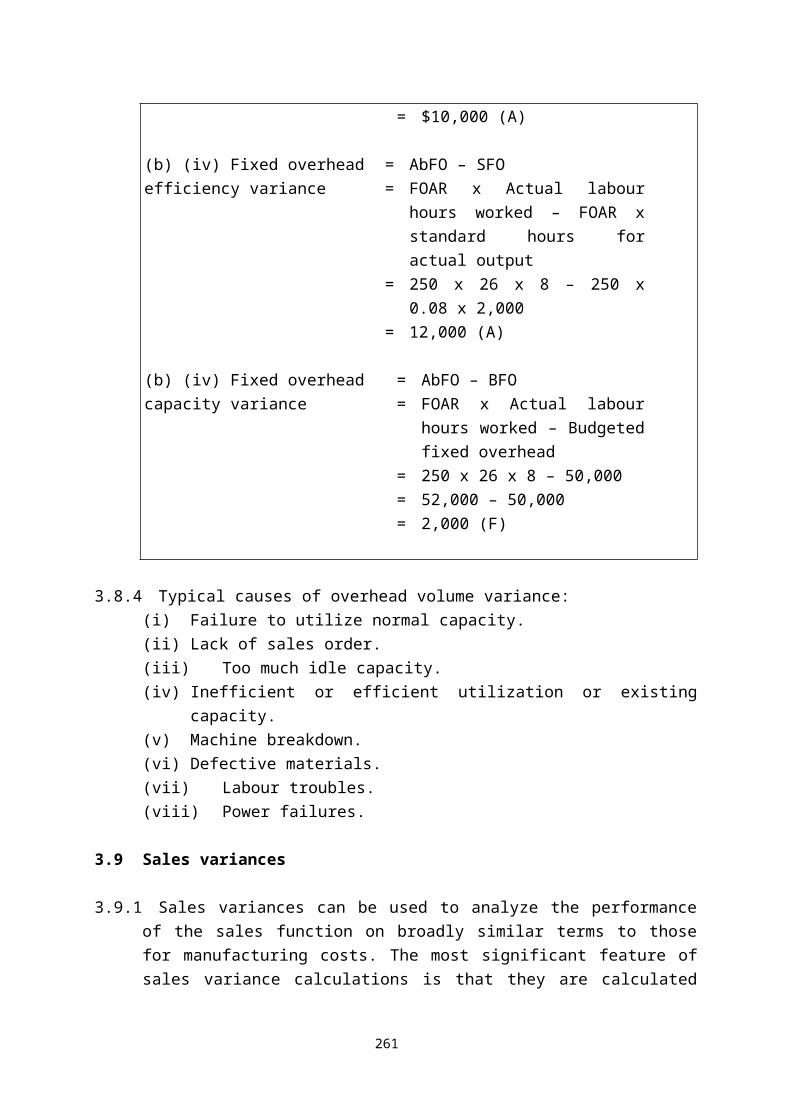
= 250 x (0.08 x 2,000) – 50,000= 40,000 – 50,000= $10,000 (A)
(b) (iv) Fixed overhead efficiency variance
==
AbFO – SFOFOAR x Actual labour hours worked – FOAR x standard hours for actual output
= 250 x 26 x 8 – 250 x 0.08 x 2,000= 12,000 (A)
(b) (iv) Fixed overhead capacity variance
==
AbFO – BFOFOAR x Actual labour hours
258

worked – Budgeted fixed overhead
= 250 x 26 x 8 – 50,000= 52,000 – 50,000= 2,000 (F)
3.8.4 Typical causes of overhead volume variance:(i) Failure to utilize normal capacity.(ii) Lack of sales order.(iii) Too much idle capacity.(iv) Inefficient or efficient utilization or existing capacity.(v) Machine breakdown.(vi) Defective materials.(vii) Labour troubles.(viii) Power failures.
3.9 Sales variances
3.9.1 Sales variances can be used to analyze the performance of the sales function on broadly similar terms to those for manufacturing costs. The most significant feature of sales variance calculations is that they are calculated in terms of profit or contribution margins rather than sales value.
3.9.2 It is important to understand the definition of standard sales margin before we approach sales margin variances. This is defined as the difference between the standard selling price of product of the product and the standard cost of the product. It is also referred to as the standard margin of the product.
3.9.3 Formulae for the calculation of sales variances
1. Total sales margin variance = AM – BM2. Sales margin price variance = (Am – Sm) x AV3. Sales margin quantity variance = (AQ – BQ) x SM4. Sales margin mix variance = (AQAm – AQSm) x SM5. Sales margin volume variance = (AQSm – BSSm) x SM
Where:AM = Actual Margin
259
BM = Budgeted MarginAm = Actual Margin per unitSm = Standard Margin per unitAV = Actual Sales VolumeAQ = Actual QuantityBQ = Budgeted QuantityAQAM = Actual Quantity in Actual MixAQSM = Actual Quantity in Standard MixAQSM = Actual Quantity in Standard MixBSSM = Budgeted Sales in Standard Mix
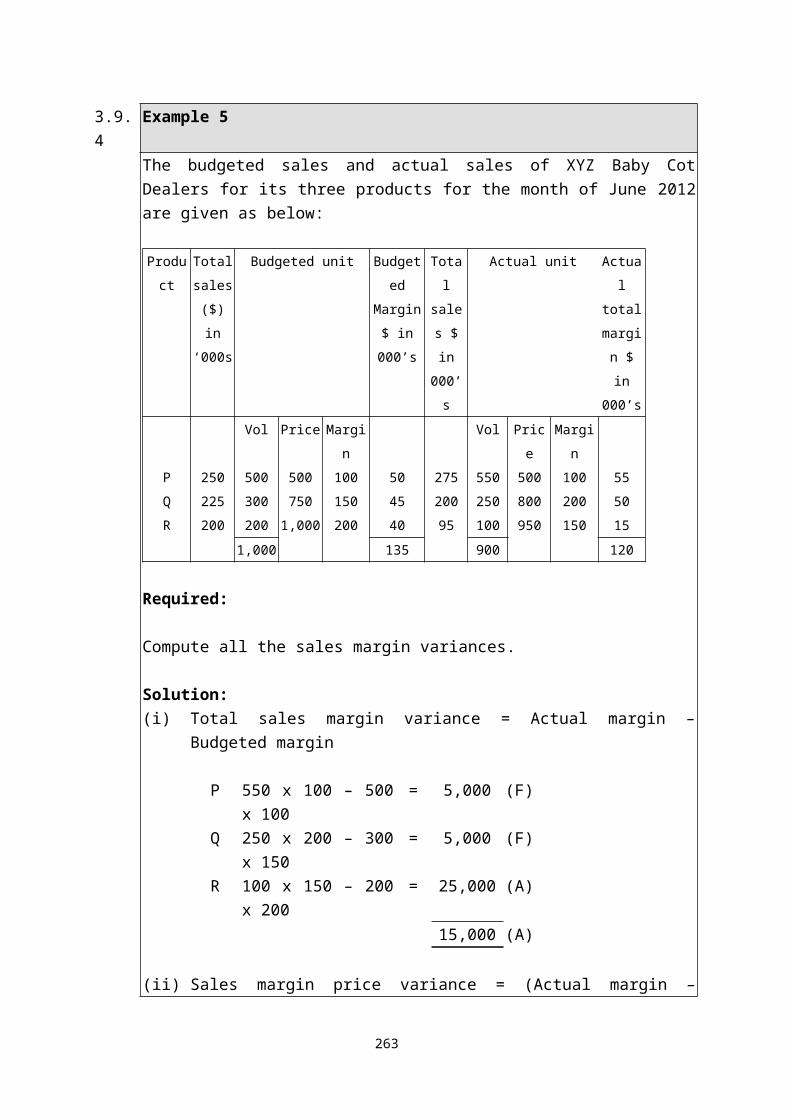
3.9.4 Example 5The budgeted sales and actual sales of XYZ Baby Cot Dealers for its three products for the month of June 2012 are given as below:
Product Total
sales
($) in
‘000s
Budgeted unit Budgeted
Margin $
in 000’s
Total
sales $
in
000’s
Actual unit Actual
total
margin
$ in
000’s
Vol Price Margin Vol Price Margin
P 250 500 500 100 50 275 550 500 100 55
Q 225 300 750 150 45 200 250 800 200 50
R 200 200 1,000 200 40 95 100 950 150 15
1,000 135 900 120
Required:
Compute all the sales margin variances.
Solution:(i) Total sales margin variance = Actual margin – Budgeted margin
P 550 x 100 – 500 x 100 = 5,000 (F)
260

Q 250 x 200 – 300 x 150 = 5,000 (F)R 100 x 150 – 200 x 200 = 25,000 (A)
15,000 (A)
(ii) Sales margin price variance = (Actual margin – Standard margin) x number of units sold in the period
P (100 – 100) x 550 = 0Q (200 – 150) x 250 = 12,500 (F)R (150 – 200) x 100 = 5,000 (A)
7,500 (F)
(iii) Sales margin quantity variance = (Actual quantity – Budgeted quantity) x Standard margin per unit
P (550 – 500) x 100 = 5,000 (F)Q (250 – 300) x 150 = 7,500 (A)R (100 – 200) x 200 = 20,000 (A)
22,500 (A)
(iv) Sales margin mix variance = (Actual quantity in actual mix – Actual quantity in standard mix) x standard margin per unit
P (550 – 450) x 100 = 10,000 (F)Q (250 – 270) x 150 = 3,000 (A)R (100 – 180) x 200 = 16,000 (A)
9,000 (A)
Actual number of units sold 900 at standard proportions, i.e. 50%, 30% and 20% is 450, 270 and 180.
(v) Sales margin volume variance = (Actual quantity in standard mix – Budgeted sales in standard mix) x standard margin per unit
P (450 – 500) x 100 = 5,000 (A)Q (270 – 300) x 150 = 4,500 (A)R (180 – 200) x 200 = 4,000 (A)
261
13,500 (A)
4. The Operating Statement
4.1 Top management will be interested in the reason for the actual profit being different from the budgeted profit. By adding the favourable production and sales variances to the budgeted profit and deducting the adverse variances, the reconciliation of budgeted and actual profit is shown as follow.
4.2 The following reconciliation of budgeted and actual profits (using a standard variable costing system) assumes that the company produces a single product consisting of a single operation and that the activities are performed by one responsibility centre. In practice, most companies make many products, which require operations to be carried out in different responsibility centers. A reconciliation statement such as that presented as follow will therefore normally represent a summary of the variances for many responsibility centers. The reconciliation statement thus represents a broad picture to top management that explains the major reasons for any difference between the budgeted and actual profits.
$ $ $Budgeted net profit XSales variances:
Sales margin price X (F/A)Sales margin quantity X (F/A) X (F/A)
Direct cost variances:Material:Price X (F/A)
Usage X (F/A) X (F/A)Labour: Rate X (F/A)
Efficiency X (F/A) X (F/A)Manufacturing OH variances:
Fixed OH expenditure X (F/A)Variable OH expenditure X (F/A)Variable OH efficiency X (F/A) X (F/A) X (F/A)
Actual profit X
5. “Backwards” Variances
262
5.1 Examination questions can be set in which the variances are already given and the requirements are to find actual, budget or other data. This implies that students need to have thorough detailed knowledge of how to calculate variances. Essentially the process involved is working backwards with the formula to find missing figures. There is no set approach since questions will not be identical, but the following can act as a guide.
5.2 To find actual production
$Actual cost X Variances X= Standard cost of actual production X Standard cost per unit X= Actual production X
5.3 To find budget productionUsing fixed overhead expenditure variance
$Actual fixed overhead XBudget fixed overhead XFixed overhead expenditure variance X
Budget production =Budgeted fixed overhead
Standard fixed overhead rate
5.4 To find actual data – Use the relevant variance formula containing the actual data required. For example, to find actual price paid per unit of material use material price variance.
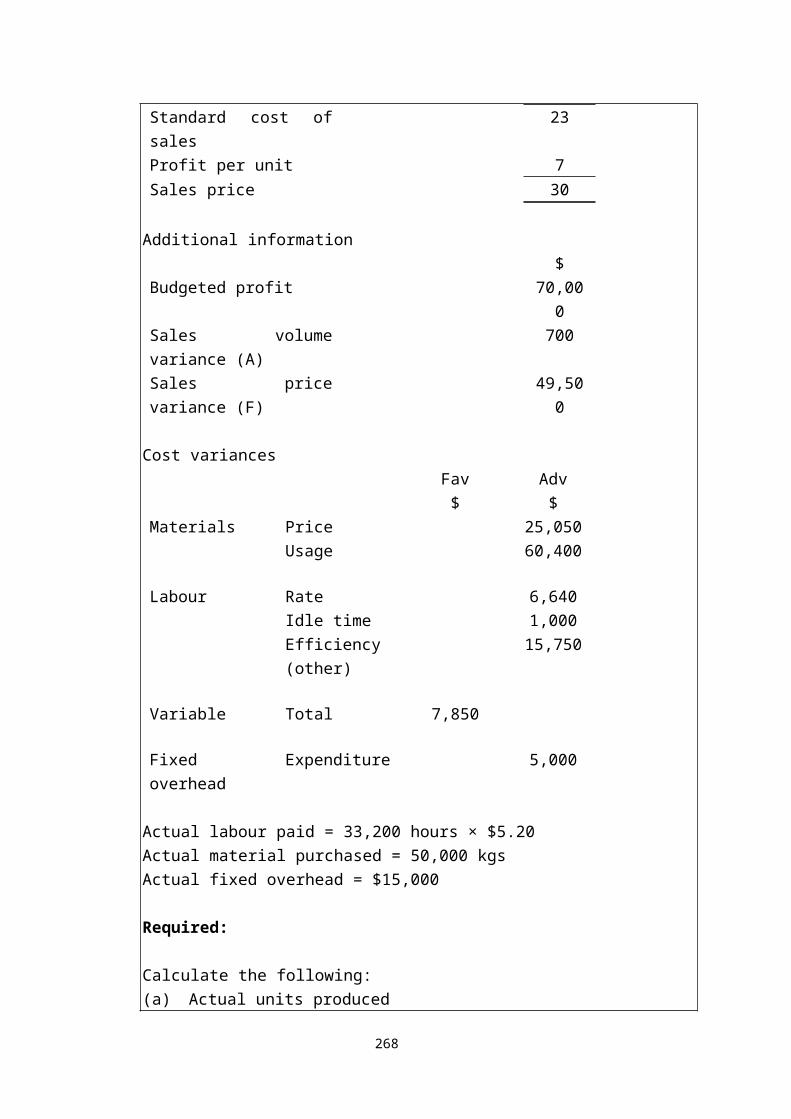
5.5 Example 6Standard cost card
$
263

Materials 2 kgs at $2 per kg 4Labour 3 hours at $5 per hour 15Variable overhead 3 hours at $1 per hour 3Fixed overhead 1Standard cost of sales 23Profit per unit 7Sales price 30
Additional information$
Budgeted profit 70,000Sales volume variance (A) 700Sales price variance (F) 49,500
Cost variancesFav Adv$ $
Materials Price 25,050Usage 60,400
Labour Rate 6,640Idle time 1,000Efficiency (other) 15,750
Variable Total 7,850
Fixed overhead Expenditure 5,000
Actual labour paid = 33,200 hours × $5.20Actual material purchased = 50,000 kgsActual fixed overhead = $15,000
Required:
Calculate the following:(a) Actual units produced(b) Actual price/kg of material(c) Budget units produced
264
(d) Actual units sold(e) Actual profit
Solution:
(a) Actual units produced$
Actual cost of labour (33,200 x 5.2) 172,640Labour rate (6,640)Idle time (1,000)Efficiency (15,750)Standard cost of actual production 149,250Standard labour cost/unit 15Actual production (units) 9,950
(b) Actual material price per kg$
Actual price (bal. fig.) 2.501Standard price 2.00
0.501x actual purchases 50,000Material price variance 25,050 A
(c) Budget production =
= (15,000 – 5,000) ÷ $1= 10,000
(d) Actual units sold$
Actual sales level (bal. fig.) 9,900Budget sales level 10,000
265

100x Standard profit/unit 7Sales volume variance 700 A
(e) Actual profit$
Budget profit 70,000Sales volume variance (700)Selling price variance 49,500Cost variancesMaterial
Price (25,050)Usage (60,400)
LabourRate (6,640)Efficiency (16,750)
Variable overhead 7,850Fixed overhead
Expenditure (5,000)Volume (W) (50)
Actual profit 12,760
WorkingUnits
Actual volume produced 9,950Budget volume produced 10,000
50x Standard fixed overhead rate $1Fixed overhead volume variance $50 A
266
Examination Style Questions
Question 1 – Flexible budgets and computation of labour and material VariancesJB plc operates a standard marginal cost accounting system. Information relating to product J, which is made in one of the company departments, is given below:
Product J
Standard marginal product cost per unit
($)Direct material (6 kgs at $4 per kg) 24Direct labour (1 hour at $7 per hour) 7Variable production overheada 3
34
aVariable production overhead varies with units producedBudgeted fixed production overhead, per month: $100,000.Budgeted production for product J: 20,000 units per month.
Actual production and costs for month 6 were as follows:Units of J produced (18,500 units) $Direct materials purchased and used: 113,500 kg 442,650Direct labour: 17,800 hours 129,940Variable production overhead incurred 58,800Fixed production overhead incurred 104,000
735,390
Required:
(a) prepare a columnar statement showing, by element of cost, the:(i) original budget;(ii) flexed budget;(iii) actual;(iv) total variance. (9 marks)
(b) subdivide the variances for direct material and direct labour shown in your answers to (a) (i) – (iv) above to be more informative for managerial purposes.
(4 marks)
267

Question 2 – Fixed overhead variance calculationA manufacturing company has provided you with the following data, which relate to component RYX for the period which has just ended:
Budget ActualNumber of labour hours 8,400 7,980Production units 1,200 1,100Overhead cost (all fixed) $22,260 $25,536
Overheads are absorbed at a rate per standard labour hour.
Required:
Calculate the fixed production overhead cost variance and the following subsidiary variances:(a) Expenditure(b) Efficiency(c) Capacity
(7 marks)
Question 3 – Material price, mix and yield variancesSimply Soup Limited manufactures and sells soups in a JIT environment. Soup is made in a manufacturing process by mixing liquidised vegetables, melted butter and stock (stock in this context is a liquid used in making soups). They operate a standard costing and variances system to control its manufacturing processes. At the beginning of the current financial year they employed a new production manager to oversee the manufacturing process and to work alongside the purchasing manager. The production manager will be rewarded by a salary and a bonus based on the directly attributable variances involved in the manufacturing process.
After three months of work there is doubt about the performance of the new production manager. On the one hand, the cost variances look on the whole favourable, but the sales director has indicated that sales are significantly down and the overall profitability is decreasing.
The table below shows the variance analysis results for the first three months of the manager’s work.
268

Table 1F = Favourable. A = Adverse
Month 1 Month 2 Month 3Material price variance $300 (F) $900 (A) $2,200 (A)Material mix variance $1,800 (F) $2,253 (F) $2,800 (F)Material yield variance $2,126 (F) $5,844 (F) $9,752 (F)Total variance $4,226 (F) $7,197 (F) $10,352 (F)
The actual level of activity was broadly the same in each month and the standard monthly material total cost was approximately $145,000.
The standard cost card is as follows for the period under review
$0.90 litres of liquidised vegetables @ $0.80/ltr = 0.720.05 litres of melted butter @ $4/ltr 0.201.10 litres of stock @ $0.50/ltr 0.55Total cost to produce 1 litre of soup 1.47
Required:
(a) Using the information in table 1:(i) Explain the meaning of each type of variances above (price, mix and yield but
excluding the total variance) and briefly discuss to what extent each type of variance is controllable by the production manager. (6 marks)
(ii) Evaluate the performance of the production manager considering both the cost variance results above and the sales director’s comments. (6 marks)
(iii) Outline two suggestions how the performance management system might be changed to better reflect the performance of the production manager.
(4 marks)(b) The board has asked that the variances be calculated for Month 4. In Month 4 the
production department data is as follows:
Actual result for Month 4Liquidised vegetables: Bought 82,000 litres Costing $69,700
269
Melted butter: Bought 4,900 litres Costing $21,070Stock: Bought 122,000 litres Costing $58,560
Actual production was 112,000 litres of soup
Required:Calculate the material price, mix and yield variances for Month 4. You are not required to comment on the performance that the calculations imply. Round variances to the nearest $. (9 marks)
(Total 25 marks)(ACCA F5 Performance Management Pilot Paper Q2)
Question 4 – Material, labour and sales variancesSticky Wicket (SW) manufactures cricket bats using high quality wood and skilled labour using mainly traditional manual techniques. The manufacturing department is a cost centre within the business and operates a standard costing system based on marginal costs.
At the beginning of April 2010 the production director attempted to reduce the cost of the bats by sourcing wood from a new supplier and de-skilling the process a little by using lower grade staff on parts of the production process. The standards were not adjusted to reflect these changes.
The variance report for April 2010 is shown below (extract).Adverse Favourable
Variances $ $Material price 5,100Material usage 7,500Labour rate 43,600Labour efficiency 48,800Labour idle time 5,400
The production director pointed out in his April 2010 board report that the new grade of labour required significant training in April and this meant that productive time was lower than usual. He accepted that the workers were a little slow at the moment but expected that an improvement would be seen in May 2010. He also mentioned that the new wood being used was proving difficult to cut cleanly resulting in increased waste levels.
Sales for April 2010 were down 10% on budget and returns of faulty bats were up 20% on the
270

previous month. The sales director resigned after the board meeting stating that SW had always produced quality products but the new strategy was bound to upset customers and damage the brand of the business.
Required:
(a) Assess the performance of the production director using all the information above taking into account both the decision to use a new supplier and the decision to de-skill the process. (7 marks)
In May 2010 the budgeted sales were 19,000 bats and the standard cost card is as follows:
Std cost Std cost$ $
Materials (2kg at $5/kg) 10Labour (3hrs at $12/hr) 36Marginal cost 46Selling price 68Contribution 22
In May 2010 the following results were achieved:
40,000kg of wood were bought at a cost of $196,000, this produced 19,200 cricket bats. No inventory of raw materials is held. The labour was paid for 62,000 hours and the total cost was $694,000. Labour worked for 61,500 hours.
The sales price was reduced to protect the sales levels. However, only 18,000 cricket bats were sold at an average price of $65.
Required:
(b) Calculate the materials, labour and sales variances for May 2010 in as much detail as the information allows. You are not required to comment on the performance of the business. (13 marks)
(Total 20 marks)(ACCA F5 Performance Management June 2010 Q2)
271

272

Question 5 – Reconciliation of Actual and Budgeted ProfitAsh plc recorded the following actual results for Product RS8 for the last month:
Product RS8 2,100 units produced and sold for $14.50 per unitDirect material M3 1,050 kg costing $1,680Direct material M7 1,470 kg costing $2,793Direct labour 525 hours costing $3,675Variable production overhead $1,260Fixed production overhead $4,725
Standard selling price and cost data for one unit of Product RS8 is as follows.Selling price $15.00Direct material M3 0.6 kg at $1.55 per kgDirect material M7 0.68 kg at $1.75 per kgDirect labour 14 minutes at $7.20 per direct labour hourVariable production overhead $2.10 per direct labour hourFixed production overhead $9.00 per direct labour hour
At the start of the last month, 497 standard labour hours were budgeted for production of Product RS8. No stocks of raw materials are held. All production of Product RS8 is sold immediately to a single customer under a just-in-time agreement.
Required:
(a) Prepare an operating statement that reconciles budgeted profit with profit for Product RS8 for the last month. You should calculate variances in as much detail as allowed by the information provided. (17 marks)
(b) Discuss how the operating statement you have produced can assist managers in:(i) controlling variable costs;(ii) controlling fixed production overhead costs. (8 marks)
(25 marks)(ACCA Paper 2.4 Financial Management and Control June 2006 Q3)
273

Question 6 – Backwards variancesThe following profit reconciliation statement has been prepared by the management accountant of ABC Ltd for March:
$Budgeted profit 30,000Sales volume profit variance 5,250 ASelling price variance 6,375 F
31,125Cost variances: A F
$ $Material:Price 1,985Usage 400Labour:Rate 9,800Efficiency 4,000Variable overhead:Expenditure 1,000Efficiency 1,500Fixed overhead:Expenditure 500Volume 24,500
31,985 11,70020,285 A
Actual profit 10,840
The standard cost card for the company’s only product is as follows:
$Materials 5 litres at $0.20 1.00Labour 4 hours at $4.00 16.00Variable overhead 4 hours at $1.50 6.00Fixed overhead 4 hours at $3.50 14.00
37.00Standard profit 3.00Standard selling price 40.00
274

The following information is also available:1. There was no change in the level of finished goods stock during the month.2. Budgeted production and sales volumes for March were equal.3. Stocks of materials, which are valued at standard price, decreased by 800 litres during
the month.4. The actual labour rate was $0.28 lower than the standard hourly rate.
Required:
(a) Calculate the following:(i) the actual production/sales volume; (4 marks)(ii) the actual number of hours worked; (4 marks)(iii) the actual quantity of materials purchased; (4 marks)(iv) the actual variable overhead cost incurred; (2 marks)(v) the actual fixed overhead cost incurred. (2 marks)
(b) ABC Limited uses a standard costing system whereas other organizations use a system of budgetary control. Explain the reasons why a system of budgetary control is often preferred to the use of standard costing in non-manufacturing environments. (9 marks)
(Total 25 marks)
275