chapter 11 - intermodal · pdf filechapter 11 - intermodal system background chapter 11 11-1...
TRANSCRIPT
Chapter 11 - Intermodal System
Background
Chapter 11 11-1
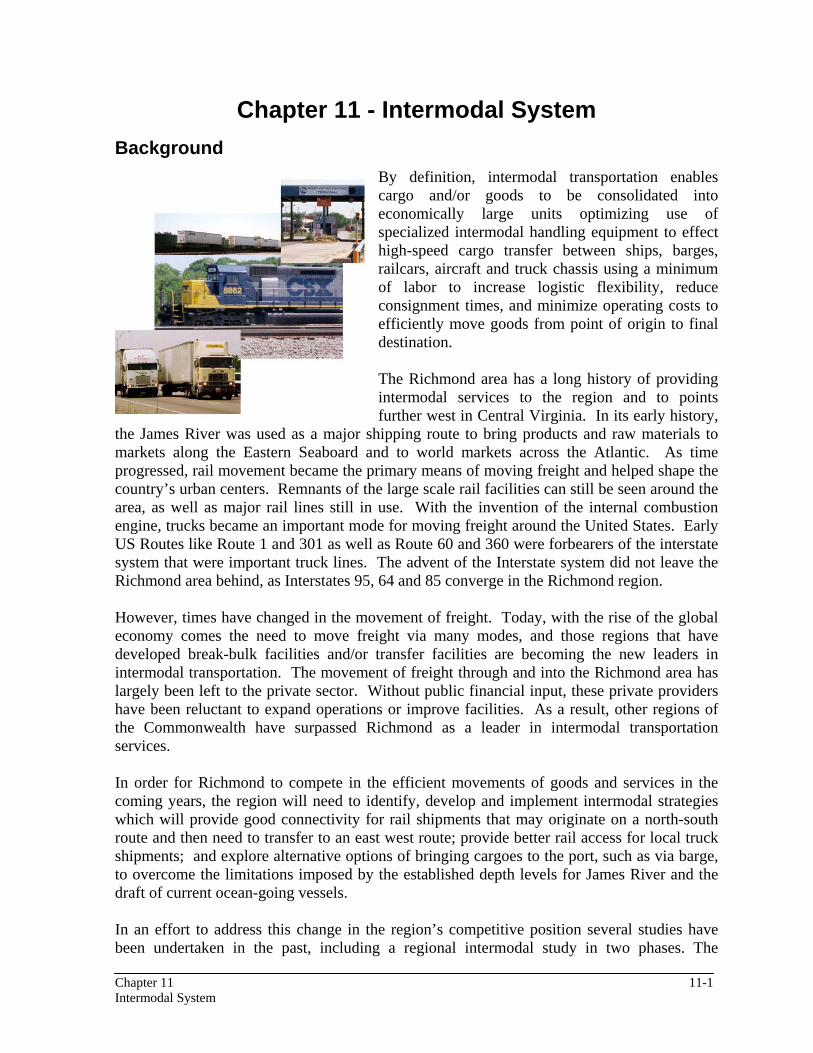
By definition, intermodal transportation enables cargo and/or goods to be consolidated into economically large units optimizing use of specialized intermodal handling equipment to effect high-speed cargo transfer between ships, barges, railcars, aircraft and truck chassis using a minimum of labor to increase logistic flexibility, reduce consignment times, and minimize operating costs to efficiently move goods from point of origin to final destination. The Richmond area has a long history of providing intermodal services to the region and to points further west in Central Virginia. In its early history,
the James River was used as a major shipping route to bring products and raw materials to markets along the Eastern Seaboard and to world markets across the Atlantic. As time progressed, rail movement became the primary means of moving freight and helped shape the country’s urban centers. Remnants of the large scale rail facilities can still be seen around the area, as well as major rail lines still in use. With the invention of the internal combustion engine, trucks became an important mode for moving freight around the United States. Early US Routes like Route 1 and 301 as well as Route 60 and 360 were forbearers of the interstate system that were important truck lines. The advent of the Interstate system did not leave the Richmond area behind, as Interstates 95, 64 and 85 converge in the Richmond region. However, times have changed in the movement of freight. Today, with the rise of the global economy comes the need to move freight via many modes, and those regions that have developed break-bulk facilities and/or transfer facilities are becoming the new leaders in intermodal transportation. The movement of freight through and into the Richmond area has largely been left to the private sector. Without public financial input, these private providers have been reluctant to expand operations or improve facilities. As a result, other regions of the Commonwealth have surpassed Richmond as a leader in intermodal transportation services. In order for Richmond to compete in the efficient movements of goods and services in the coming years, the region will need to identify, develop and implement intermodal strategies which will provide good connectivity for rail shipments that may originate on a north-south route and then need to transfer to an east west route; provide better rail access for local truck shipments; and explore alternative options of bringing cargoes to the port, such as via barge, to overcome the limitations imposed by the established depth levels for James River and the draft of current ocean-going vessels. In an effort to address this change in the region’s competitive position several studies have been undertaken in the past, including a regional intermodal study in two phases. The
Intermodal System
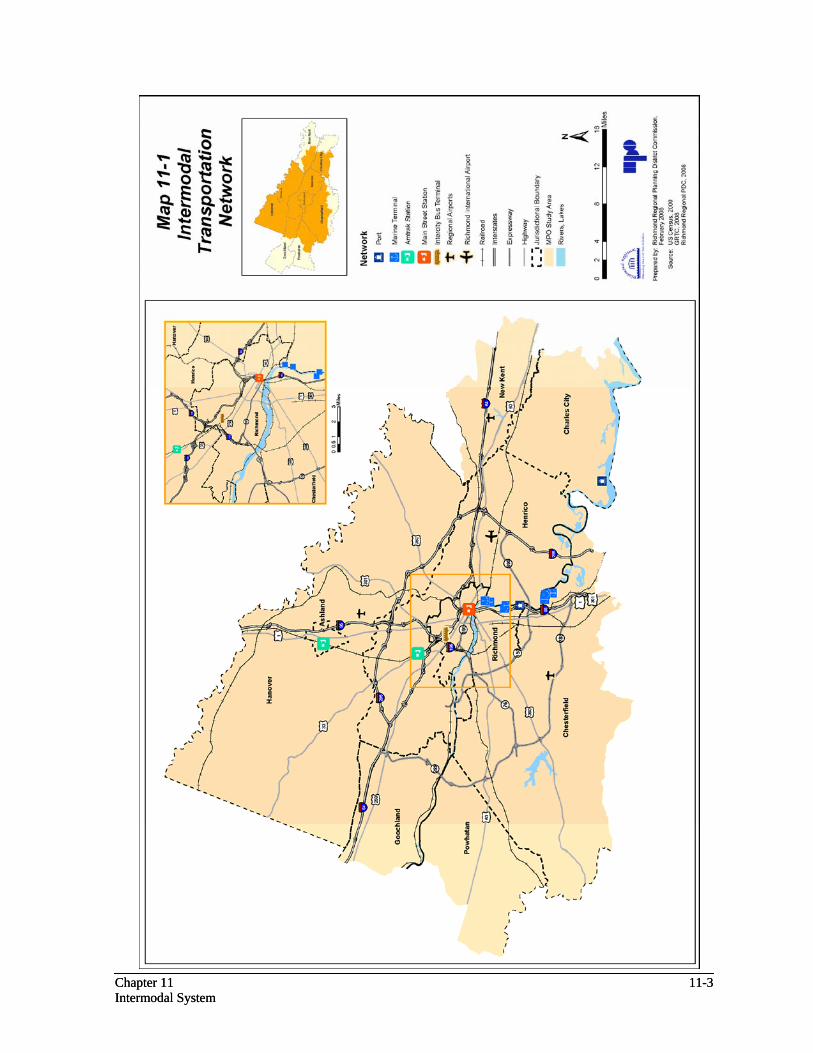
“Richmond Intermodal Transportation Study” was a cooperative effort between the Richmond International Airport and the Richmond Area Metropolitan Planning Organization (MPO). The study had a dual focus for the multi-county central Virginia area: to examine the potential for an intermodal freight center in the greater Richmond area, and to examine and recommend enhancements to the movements of goods both now and in the future, through the Richmond area by truck, rail, air and water. The study was completed in two phases (Phase I: Data Collection, 1999; Phase II: Forecasting and Summary Recommendations, 2002) and incorporated into our regional long-range plan. Many of the recommendations of the previous planning efforts have been implemented within our region; other recommendations seem less viable given changes in the private markets and the proposed intermodal centers planned for the Roanoke area and in Prince George County. Recognizing the need to re-assess our competitive market position and develop strategies to create the necessary intermodal connections, the region is undertaking a planning effort in conjunction with the Virginia Department of Transportation’s Multi-modal Planning Office to develop short and long-term strategies and actions. Working in partnership with the Crater Planning District Commission and the Hampton Roads Planning District Commission, the recommendations of this planning effort should be available in 2009. This project will build on the past efforts by our region and the efforts currently underway by the Commonwealth in developing a statewide freight plan. The goal is simple: improve the existing transportation system by reducing congestion and improving air quality while increasing the freight mobility options and opportunities within our region. By ensuring the continued performance of the regional transportation system, the prevention of environmental degradation, while encouraging and attracting economic opportunities, we will be promoting a high quality of life for our region. The study will also identify specific short term projects that can be incorporated into the regional Transportation Improvement Program (TIP) and long term implementable solutions that will be incorporated into our long-range transportation plan. This section will examine two aspects of transporting freight within and through the region: firstly, the existing facilities for rail, truck, water-borne, and air transportation of freight to and from the Richmond region; and secondly, regional transfer facilities and commodity flows by value, tons, and load. Locations of most of the region’s existing intermodal facilities are shown on Map 11-1.
11-2 Chapter 11 Intermodal System
Chapter 11 11-3
Chapter 11 11-3 Intermodal System
Intermodal System

EXISTING FACILITIES Rail Facilities
Two major railroad companies have operations and tracks in the Richmond area: CSX Corporation and Norfolk Southern Corporation. They account for the majority of the freight movement in the region; complimenting CSX and Norfolk Southern is the Old Buckingham Branch rail line which primarily carries coal. CSX maintains Acca Yard as their primary facility with approximately 20 tracks and provides such freight services as classification, staging, bulk transfer, rail car maintenance and industrial switching. CSX also maintains Fulton Yard with 13 tracks with staging being its primary function, and Collier Yard with 13 tracks and limited classification and storage services as well as bulk transfer, industrial switching, and staging. CSX also has rail sidings and spurs at Richmond International Airport and the Port of Richmond. Norfolk Southern maintains Washington Street Yard for industrial switching, bulk transfer, and storage on seven tracks, and the Wagner Road Autoramp facility for automotive transfers on five tracks. Generally, CSX operations are intended to serve north-south corridors while Norfolk-Southern services east-west corridors within our region. Truck Movements There are over 100 trucking firms with facilities in the Richmond region representing every type of trucking firm from small “mom and pop” operations specializing in short haul loads to subsidiaries of major trucking firms that can handle long haul loads as well. There are also a
number of trucking transportation brokers who specialize in finding customers the best “deal” to move shipments out of or into the region. Two major types of trucking operations are used for the vast majority of freight movements: private trucks and for-hire trucks. For-hire trucks are owned and operated by trucking firms such as Red Star, Southeastern Freight Lines, Cox Transportation, Certified Transportation, and Yellow Freight Systems, Inc. Private trucks are private owner-operators that rely on brokerage services and short-hauls for business.
Inland Port Facilities The largest marine facility in the Richmond region is the Port of Richmond (Port), “Central Virginia’s Multi-Modal Gateway.” The Port is a financially self-sufficient, free enterprise agency, publicly-owned by the City of Richmond. It is managed by the Port of Richmond
11-4 Chapter 11 Intermodal System
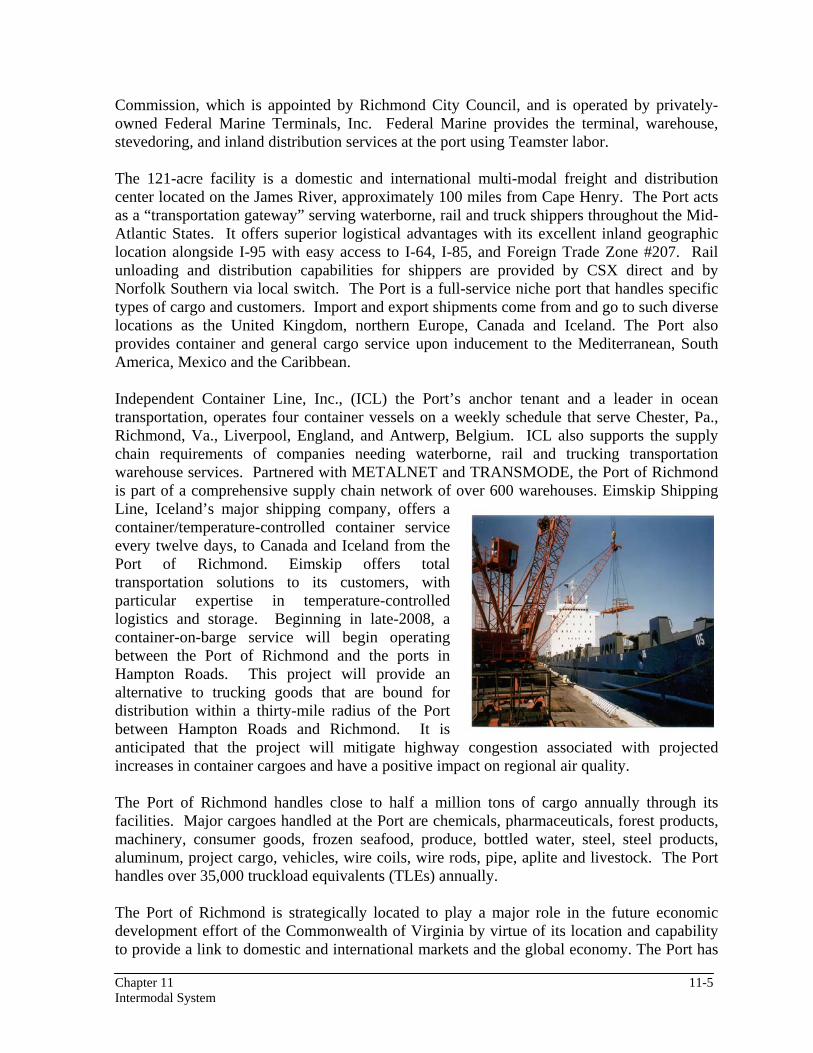
Commission, which is appointed by Richmond City Council, and is operated by privately-owned Federal Marine Terminals, Inc. Federal Marine provides the terminal, warehouse, stevedoring, and inland distribution services at the port using Teamster labor. The 121-acre facility is a domestic and international multi-modal freight and distribution center located on the James River, approximately 100 miles from Cape Henry. The Port acts as a “transportation gateway” serving waterborne, rail and truck shippers throughout the Mid-Atlantic States. It offers superior logistical advantages with its excellent inland geographic location alongside I-95 with easy access to I-64, I-85, and Foreign Trade Zone #207. Rail unloading and distribution capabilities for shippers are provided by CSX direct and by Norfolk Southern via local switch. The Port is a full-service niche port that handles specific types of cargo and customers. Import and export shipments come from and go to such diverse locations as the United Kingdom, northern Europe, Canada and Iceland. The Port also provides container and general cargo service upon inducement to the Mediterranean, South America, Mexico and the Caribbean. Independent Container Line, Inc., (ICL) the Port’s anchor tenant and a leader in ocean transportation, operates four container vessels on a weekly schedule that serve Chester, Pa., Richmond, Va., Liverpool, England, and Antwerp, Belgium. ICL also supports the supply chain requirements of companies needing waterborne, rail and trucking transportation warehouse services. Partnered with METALNET and TRANSMODE, the Port of Richmond is part of a comprehensive supply chain network of over 600 warehouses. Eimskip Shipping Line, Iceland’s major shipping company, offers a container/temperature-controlled container service every twelve days, to Canada and Iceland from the Port of Richmond. Eimskip offers total transportation solutions to its customers, with particular expertise in temperature-controlled logistics and storage. Beginning in late-2008, a container-on-barge service will begin operating between the Port of Richmond and the ports in Hampton Roads. This project will provide an alternative to trucking goods that are bound for distribution within a thirty-mile radius of the Port between Hampton Roads and Richmond. It is anticipated that the project will mitigate highway congestion associated with projected increases in container cargoes and have a positive impact on regional air quality. The Port of Richmond handles close to half a million tons of cargo annually through its facilities. Major cargoes handled at the Port are chemicals, pharmaceuticals, forest products, machinery, consumer goods, frozen seafood, produce, bottled water, steel, steel products, aluminum, project cargo, vehicles, wire coils, wire rods, pipe, aplite and livestock. The Port handles over 35,000 truckload equivalents (TLEs) annually. The Port of Richmond is strategically located to play a major role in the future economic development effort of the Commonwealth of Virginia by virtue of its location and capability to provide a link to domestic and international markets and the global economy. The Port has
Chapter 11 11-5 Intermodal System
spent over $4 million for infrastructure improvements since 2000 to continue its planned rehabilitation and expansion of the facilities and capabilities. In 2007 the Port completed a master plan update. One of the Port’s highest priorities for the future is the completion of the James River Deepwater Terminal Turning Basin Expansion Project, scheduled for construction in 2009. Currently, the turning basin provides a very small safety margin for turning the larger ships that make the Port of Richmond a port of call. The widening and deepening of the James River Navigation Channel is another project of interest to the Port of Richmond. At present, the narrow 25-foot deep channel, with a maximum 22-foot ship’s draft, limits the Port’s ability to grow in order to handle many of the larger ocean-going vessels. The Port Commission continues to work with the Army Corps of Engineers in improving channel maintenance, placement site conditions, and increasing the long-term capacity of dredged material placement sites. While the Port of Richmond is the largest public port in the region and handles the vast majority of waterborne freight, there are several other marine oil and bulk terminals in the region. These include: City of Richmond Shirley Plantation Intermediate Terminal Weanack Land Limited Partners Department of Public Works 501 Shirley Plantation Road Richmond, VA 23219 Charles City, VA 233030-2907 Kinder Morgan Energy Partners Vulcan Materials 3302 Deepwater Terminal Road 1300 Willis Road Richmond, VA 23234 Richmond, VA 23237 IMTT Richmond Flint Hills Resources 5500 Old Osborne Turnpike 4110 Deepwater Terminal Road Richmond, VA 23231 Richmond, VA 23234 Simsmetal America E.I. DuPont Drewry’s Bluff 3220 Deepwater Terminal Road 1201 Bellwood Road Richmond, VA 23234 Richmond, VA 23237
11-6 Chapter 11
Intermodal System
Airports Four airports (Richmond International Airport, Chesterfield County Airport, Hanover County Municipal Airport, and New Kent County Airport) serve the Richmond region. Only Richmond International Airport provides scheduled commercial airline service and major air cargo operations. The other airports support general aviation activities of various levels. Each of the airports is described below.
Richmond International Airport
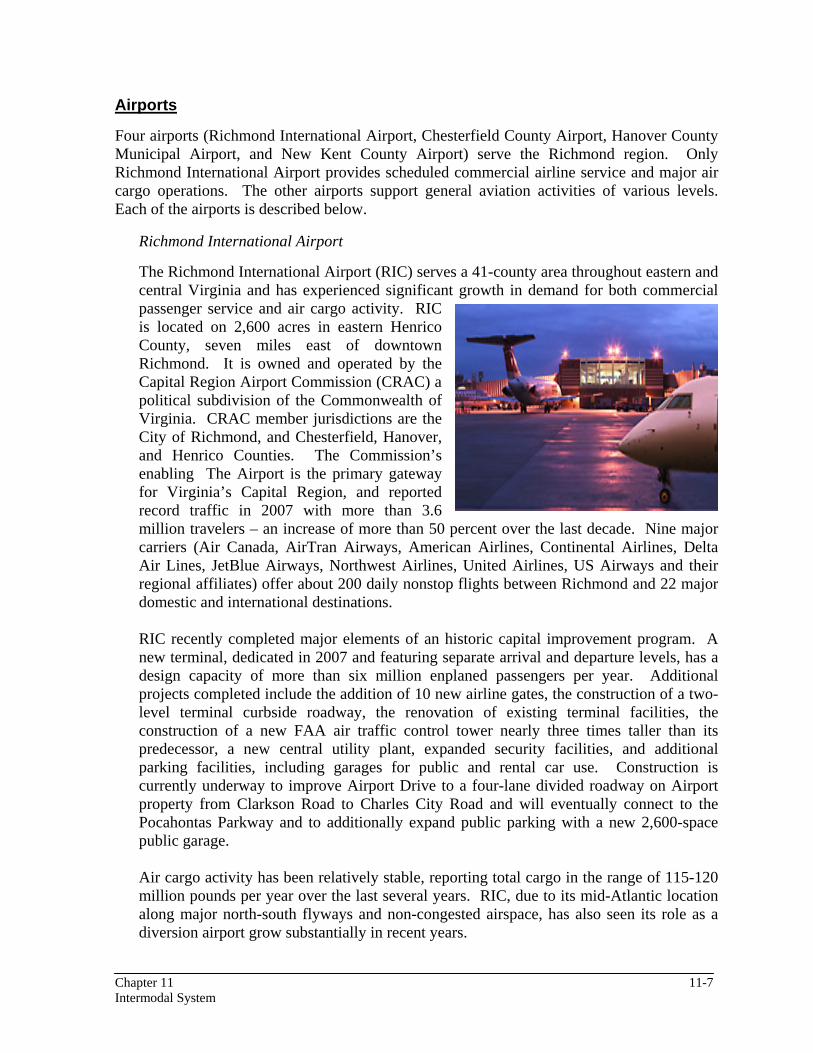
The Richmond International Airport (RIC) serves a 41-county area throughout eastern and central Virginia and has experienced significant growth in demand for both commercial passenger service and air cargo activity. RIC is located on 2,600 acres in eastern Henrico County, seven miles east of downtown Richmond. It is owned and operated by the Capital Region Airport Commission (CRAC) a political subdivision of the Commonwealth of Virginia. CRAC member jurisdictions are the City of Richmond, and Chesterfield, Hanover, and Henrico Counties. The Commission’s enabling The Airport is the primary gateway for Virginia’s Capital Region, and reported record traffic in 2007 with more than 3.6 million travelers – an increase of more than 50 percent over the last decade. Nine major carriers (Air Canada, AirTran Airways, American Airlines, Continental Airlines, Delta Air Lines, JetBlue Airways, Northwest Airlines, United Airlines, US Airways and their regional affiliates) offer about 200 daily nonstop flights between Richmond and 22 major domestic and international destinations.
RIC recently completed major elements of an historic capital improvement program. A new terminal, dedicated in 2007 and featuring separate arrival and departure levels, has a design capacity of more than six million enplaned passengers per year. Additional projects completed include the addition of 10 new airline gates, the construction of a two-level terminal curbside roadway, the renovation of existing terminal facilities, the construction of a new FAA air traffic control tower nearly three times taller than its predecessor, a new central utility plant, expanded security facilities, and additional parking facilities, including garages for public and rental car use. Construction is currently underway to improve Airport Drive to a four-lane divided roadway on Airport property from Clarkson Road to Charles City Road and will eventually connect to the Pocahontas Parkway and to additionally expand public parking with a new 2,600-space public garage. Air cargo activity has been relatively stable, reporting total cargo in the range of 115-120 million pounds per year over the last several years. RIC, due to its mid-Atlantic location along major north-south flyways and non-congested airspace, has also seen its role as a diversion airport grow substantially in recent years.
Chapter 11 11-7 Intermodal System
The Airport is currently conducting a Master Plan update to address forecasted passenger, cargo, and operational increases anticipated over the next 20 years.
Chesterfield County Airport
Chesterfield County Airport is a general aviation airport that provides facilities for privately-owned aircraft used for personal and business activities. It is also designated as a reliever airport to Richmond International Airport and is designated as a C-II facility, one which can handle airplane approach speeds of 121 to 140 knots and plane wingspans of 49 to 78 feet.
The airport is owned by Chesterfield County and operates as a department within the county. The airport encompasses 586 acres with an additional 28.5 acres of aviation easements. The airport has a 5,500-foot x 100-foot runway with a full-length parallel taxiway. Apron space is approximately 41,500 square yards with a total of 97 paved tie-downs. There are hangars for aircraft storage and a sophisticated lighting system for nighttime flights. The airport has facilities for both major and minor aircraft repair, fuel services and has an airplane base of 105 aircraft.
The airport’s Master Plan calls for the consideration of the following upgrades:
• A 3,500 foot crosswind runway • Construction of a parallel taxiway for the crosswind runway • Additional exit taxiways • Additional hangar spaces • Relocation of the airport lighting electrical vault
Hanover County Municipal Airport
The Hanover County Municipal Airport opened in 1971 and is strategically located on over 200 acres of land east of I-95, just north of the I-295 interchange between the Atlee and Lewistown Road I-95 exits. It is adjacent to the Hanover Industrial Airpark with over 550 businesses. As part of the National Transportation System, the airport provides general aviation services to corporate businesses, small package operators and the recreational pilot. The airport serves small single engine and multi-engine aircraft, as well as light business jets, and is designed to accommodate up to Category II Aircraft. It has a full service fixed base operator that provides air taxi/ charter service as well as flight instruction and aircraft maintenance.
The airport has been identified by the Federal Aviation Administration National Plan of Integrated Airport Systems (NPIAS) as a vital link to air service in the Richmond Metropolitan area. As such, the airport has been designated as an air carrier reliever airport to Richmond International Airport (RIC) in both the National System and the Virginia Air Transportation System. The airport has a 5,400-foot x 100-foot asphalt runway, lighting facilities, and corporate hangars as well as over 50 individual hangars with an additional 50 plus aircraft tie-down spaces. Full service fueling is available with both JET A and Avgas. There are approximately 125 aircraft based at the airport.
11-8 Chapter 11 Intermodal System
Based on the 2002 approved Airport Master Plan, all capital development focuses on improving the airport’s public facilities and continued improvement of operational safety in accordance with FAA regulations.
Improvements planned for the Hanover County Airport are intended to maintain its importance in the regional general aviation system, increase safety and accommodate increasing demand for hangar space and improved public facilities. In accordance with the Master Plan, obstructions to the airport approaches will continue to be mitigated. Safety will be improved with upgraded instrument approaches to both runways. An additional parallel taxiway is planned on the east side of the airport along with additional ramp apron, aircraft tie-downs, hangars, new terminal building, automobile parking, and above ground fuel storage area.
New Kent County Airport
Constructed in 1955, the New Kent County Airport is owned and operated by the county. The airport sits on 130 acres with an additional 63 acres of easements. The airport is included in both the National Plan of Integrated Airport Systems (NPIAS) and the Virginia Air Transportation System (VATS).
The airport has one recently rehabilitated 3,600-foot x 75-foot runway with adjacent parallel taxi way serving both recreational and corporate operations. There are 44 tie-downs, 46 T-hangar units and one maintenance hangar for minor repairs. Under the Airport Reference Codes, New Kent County Airport is considered a general aviation B-1 small aircraft airport. It is appropriate for airplanes with approach speeds of 91 to 120 knots with wing spans less than 48 feet.
According to the Airport Master Plan, the facility is expected to remain a B-1 small aircraft facility and will need only minor improvements through 2018. It is recommended that the airport install medium intensity taxiway lights, new Global Positioning System approaches to both runway ends, new runway lights, a relocated wind sock, a new or rehabilitated terminal building, replacement of T-hangars and a new above ground fueling facility. The county is actively seeking a new Fixed Base Operator to provide flight training, maintenance, and aircraft sales. The airport has land available for lease to commercial aviation businesses.
TRANSFER FACILITIES AND COMMODITY FLOWS Regional Transfer Facilities
Chapter 11 11-9
The region has intermodal connection opportunities with access to key interstates, rail and port; however, the Richmond-Petersburg region does not have an intermodal transfer facility, per se. Lacking these improvements places the region at a competitive disadvantage, which makes inducing, accommodating, or promoting intermodal growth and development more challenging. In order to take advantage of economic and environmental efficiencies inherent in shifting some portion of ever-growing highway truck mileage to alternative modes, the region will need to begin planning, encouraging, and facilitating development of an easily accessible intermodal interchange terminal or improving connections between modes.
Intermodal System
A study by Reynolds, Smith and Hills, Inc. (2002), identified seven locations within the Richmond-Petersburg MSA for potential sites of an intermodal transfer facility. Although three of the seven sites are located outside of the MPO study area boundary, much of the social, economic, and transportation inter-dependencies of the Richmond-Petersburg area suggest that the two regions work together as one. As each identified site has some limitations that have prevented the establishment of an intermodal transfer facility at that location, the opportunities, constraints and needed improvements associated with each of these proposed sites will be re-evaluated as part of the “Intermodal Strategies” study that the MPO will undertake in 2008-2009 in conjunction with the Virginia Department of Transportation’s Multi-modal Planning Office and the Tri-Cities Area MPO. The seven sites are:
• Acca Yard • Fulton Yard • Richmond International Airport • Port of Richmond • Washington Street Yard* • Wagner Road Autoramp Facility* • Collier Yard*
* Outside of the MPO study area.
Acca Yard
Acca Yard is physically constrained for expansion purposes. The costs to obtain the necessary land for expansion are prohibitively expensive. In addition, the yard is one of the most congested facilities on the east coast and serves CSX Railroad and Amtrak. Included at the site are staging, bulk transfer, maintenance facilities, and industrial switching. Another drawback to the site is that the other major rail company in the region, Norfolk-Southern, does not operate at this facility. Approximately 20 tracks are available within the Acca Yard. The yard must also accommodate several Amtrak passenger trains, which pass through the yard every day, complicating yard activity in order to meet scheduled train service. CSX officials have also raised concerns over moving train service which currently starts at the Staples Mill/Greendale Station to Main Street Station. Acca Yard is also on the federally designated Southeast High Speed Rail Corridor which will also require accommodating additional passenger rail traffic.
Fulton Yard Fulton Yard is smaller than Acca Yard and is limited to support facilities, staging, and limited industrial switching. The yard is used by CSX for train switching and as a staging area before trains are sent to Acca Yard for coordination into the freight movement queues. Fulton Yard is not served by Norfolk Southern. Finally, the proximity to a historic district in the City of Richmond may have additional negative impacts. There are 13 available tracks in Fulton Yard.
11-10 Chapter 11 Intermodal System
Richmond International Airport The Richmond International Airport is located between residential neighborhoods and commercial/industrial business parks. Adjacent to the airport’s southern boundary is the CSX mainline between Richmond and Newport News. The facility currently does not provide access to Norfolk Southern. Currently, only siding and industrial spurs are located in the area. A significant amount of cargo is handled through the airport. Future highway access to Route 895 (Pocahontas Parkway) will be provided by a connector from the southern entrance of the airport at Charles City Road to Route 895. This will provide a connection between I-295, I-64 and Route 895. Significant development potential exists on airport property on the southern portion of the airport and also east of runway 16-34. Port of Richmond The Port of Richmond, located along the James River is constrained by the river on the east and I-95 in the west and north. The port is connected to a CSX main north-south line by an industrial spur line known as the “Deepwater Terminal Railroad”. Service on this spur line is provided by CSX; in addition to serving the port, this rail line serves businesses in the Deepwater Terminal Road area requiring rail access. While the land surrounding the port is currently developed, the port should evaluate the redevelopment and acquisition opportunities of the surrounding lands over time to support expansion opportunities and/or the development of an intermodal facility. The port is served by a single track, a side track and three spur lines with service provided through a lease agreement with CSX. The port can be served by Norfolk Southern by switching across the CSX line and onto Deepwater Terminal Railroad. Washington Street Yard The Washington Street Yard is located east of the central business district in Petersburg. The site is used and maintained by Norfolk Southern and serves as a support yard for local industrial switching operations. To the north is a landfill and there are several public crossings east of the yard. The yard contains the mainline from Norfolk to Roanoke and a branch leading to Hopewell. There are no CSX facilities at the site, and surrounding land uses may make expansion difficult. There are seven available tracks in the Washington Street Yard. Wagner Road Autoramp The Wagner Road Autoramp is used as an eastern distribution point for automobiles. Nearby, there are numerous archaeologically significant areas, natural habitat for rare and endangered species and wetlands that limit site expansion. The Wagner Road autoramp has five tracks all owned by Norfolk Southern. The yard is not served by CSX. Collier Yard Collier Yard is located near the crossing of the CSX and Norfolk Southern lines south of the central business district in Petersburg. The yard is 1.5 miles long and has a total of 13 tracks and serves as an interchange between CSX and Norfolk Southern. In addition, the yard provides storage areas, staging areas, bulk transfer and industrial switching facilities.
Chapter 11 11-11 Intermodal System
Land use adjacent to the site is primarily industrial with scattered residential lots to the east. Petersburg Battlefield National Park is located to the south of the yard. Arthur Swamp is located to the west.
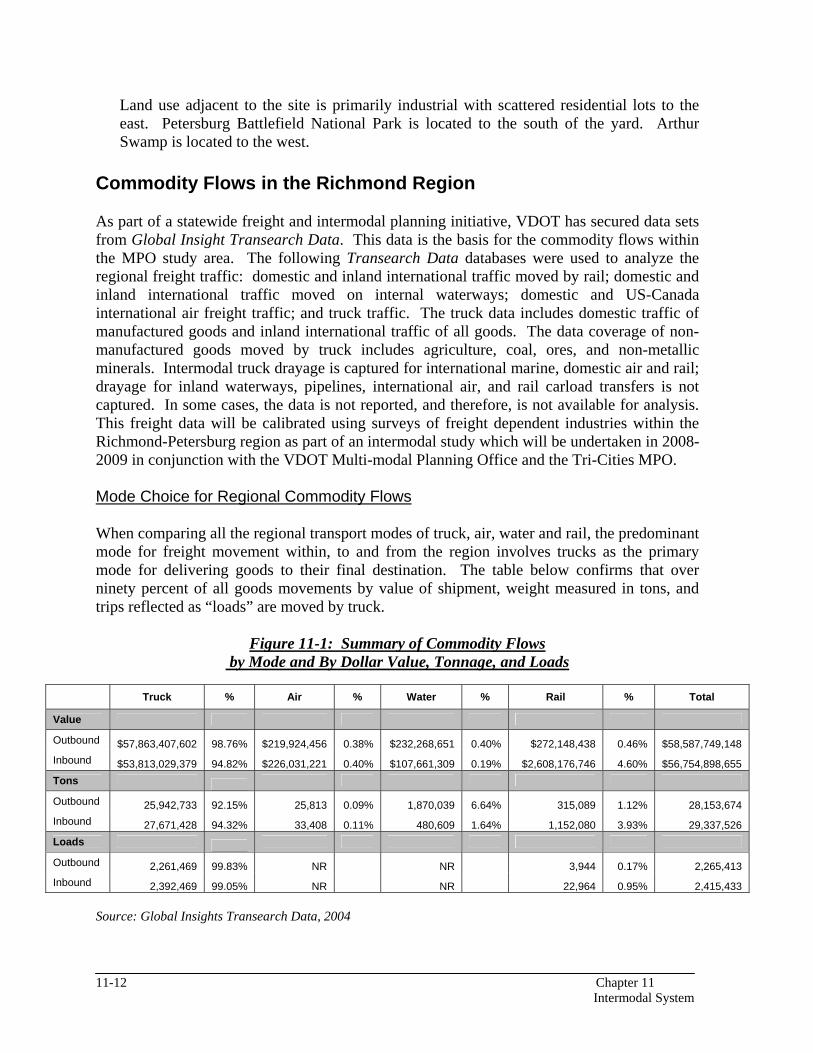
Commodity Flows in the Richmond Region As part of a statewide freight and intermodal planning initiative, VDOT has secured data sets from Global Insight Transearch Data. This data is the basis for the commodity flows within the MPO study area. The following Transearch Data databases were used to analyze the regional freight traffic: domestic and inland international traffic moved by rail; domestic and inland international traffic moved on internal waterways; domestic and US-Canada international air freight traffic; and truck traffic. The truck data includes domestic traffic of manufactured goods and inland international traffic of all goods. The data coverage of non-manufactured goods moved by truck includes agriculture, coal, ores, and non-metallic minerals. Intermodal truck drayage is captured for international marine, domestic air and rail; drayage for inland waterways, pipelines, international air, and rail carload transfers is not captured. In some cases, the data is not reported, and therefore, is not available for analysis. This freight data will be calibrated using surveys of freight dependent industries within the Richmond-Petersburg region as part of an intermodal study which will be undertaken in 2008-2009 in conjunction with the VDOT Multi-modal Planning Office and the Tri-Cities MPO. Mode Choice for Regional Commodity Flows When comparing all the regional transport modes of truck, air, water and rail, the predominant mode for freight movement within, to and from the region involves trucks as the primary mode for delivering goods to their final destination. The table below confirms that over ninety percent of all goods movements by value of shipment, weight measured in tons, and trips reflected as “loads” are moved by truck.
Figure 11-1: Summary of Commodity Flows by Mode and By Dollar Value, Tonnage, and Loads
Truck % Air % Water % Rail % Total
Value
Outbound $57,863,407,602 98.76% $219,924,456 0.38% $232,268,651 0.40% $272,148,438 0.46% $58,587,749,148 Inbound $53,813,029,379 94.82% $226,031,221 0.40% $107,661,309 0.19% $2,608,176,746 4.60% $56,754,898,655 Tons
Outbound 25,942,733 92.15% 25,813 0.09% 1,870,039 6.64% 315,089 1.12% 28,153,674 Inbound 27,671,428 94.32% 33,408 0.11% 480,609 1.64% 1,152,080 3.93% 29,337,526 Loads
Outbound 2,261,469 99.83% NR NR 3,944 0.17% 2,265,413 Inbound 2,392,469 99.05% NR NR 22,964 0.95% 2,415,433
Source: Global Insights Transearch Data, 2004
11-12 Chapter 11 Intermodal System
There are five types of truck movements within the Richmond area:
Long Haul
Long-haul traffic is defined as trips into or out of the area with destinations more than 250 miles away from point of origin. The market favors the use of for-hire trucks because of the expense related to empty truck miles. For-hire trucks can coordinate trips to haul materials into or out of Richmond and pick-up another shipment within the destination area for freight haul to another destination. Because of the difficulty in finding qualified drivers and high labor costs, some of the long-haul trucking companies subcontract the line-haul to rail companies. The trailers are then transported via rail on flatbed cars and picked up at a predetermined destination.
Short Haul
Short-haul extra-regional traffic is defined as freight movements within a 250-mile radius of the origin. The traffic consists primarily of delivery movements from a wholesale distribution warehouse to outlying regional establishments. These trips are generally delivery trips with an empty back-haul, and are done by private fleets with the driver returning home each night.
Local Traffic Local traffic produces the greatest number of freight trips in an area. They typically involve small shipments from wholesale distribution centers to retail stores or local manufacturers. Multiple shipments destined to several receivers are loaded on the same truck for multiple deliveries on a single trip. They also include shipment of manufactured components to another manufacturer who incorporates the component into a finished product. Transit Traffic Transit traffic movements are trips that neither originate nor end in the Richmond area, but the through movement includes some type of processing within the region. This may include containers that are received at the port and loaded onto rail cars, or storage of items at some location until it can be moved outside the region by rail, truck, or ship. Through Traffic As the name implies, through traffic trips are those that neither originate nor terminate in the region. The most visible examples are trucks which travel through Richmond via I-95, I-295, and I-64.
Chapter 11 11-13 Intermodal System
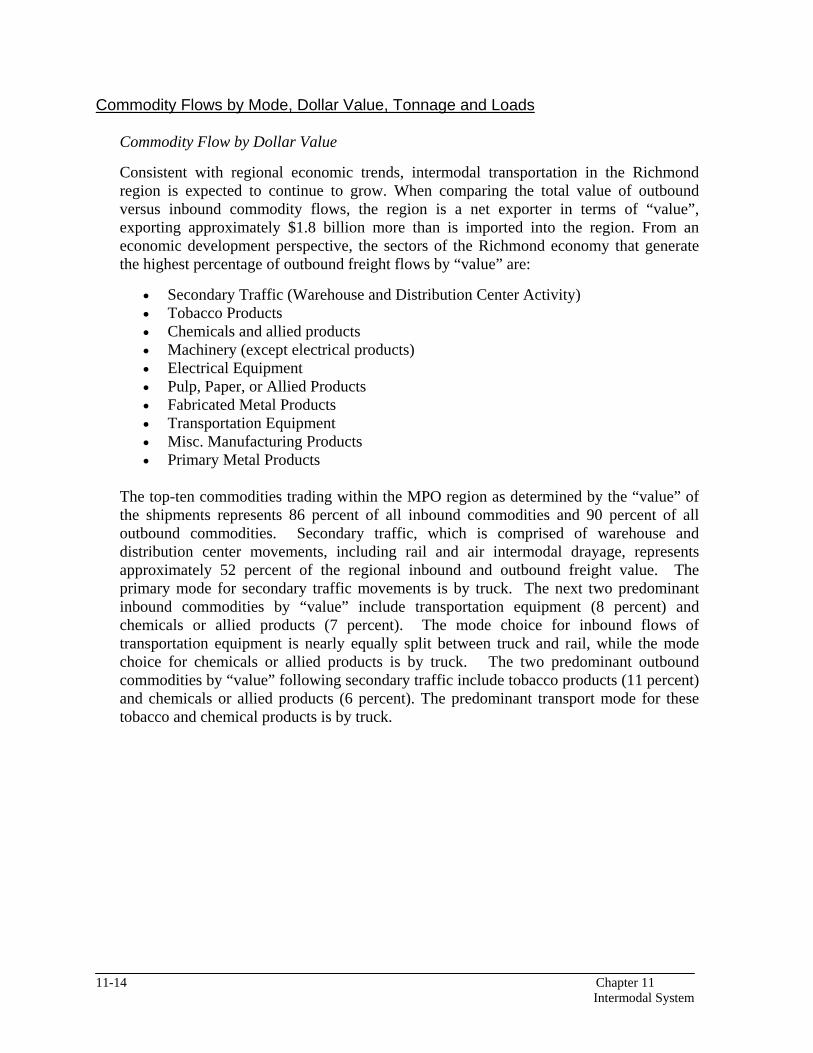
Commodity Flows by Mode, Dollar Value, Tonnage and Loads
Commodity Flow by Dollar Value
Consistent with regional economic trends, intermodal transportation in the Richmond region is expected to continue to grow. When comparing the total value of outbound versus inbound commodity flows, the region is a net exporter in terms of “value”, exporting approximately $1.8 billion more than is imported into the region. From an economic development perspective, the sectors of the Richmond economy that generate the highest percentage of outbound freight flows by “value” are:
• Secondary Traffic (Warehouse and Distribution Center Activity) • Tobacco Products • Chemicals and allied products • Machinery (except electrical products) • Electrical Equipment • Pulp, Paper, or Allied Products • Fabricated Metal Products • Transportation Equipment • Misc. Manufacturing Products • Primary Metal Products
The top-ten commodities trading within the MPO region as determined by the “value” of the shipments represents 86 percent of all inbound commodities and 90 percent of all outbound commodities. Secondary traffic, which is comprised of warehouse and distribution center movements, including rail and air intermodal drayage, represents approximately 52 percent of the regional inbound and outbound freight value. The primary mode for secondary traffic movements is by truck. The next two predominant inbound commodities by “value” include transportation equipment (8 percent) and chemicals or allied products (7 percent). The mode choice for inbound flows of transportation equipment is nearly equally split between truck and rail, while the mode choice for chemicals or allied products is by truck. The two predominant outbound commodities by “value” following secondary traffic include tobacco products (11 percent) and chemicals or allied products (6 percent). The predominant transport mode for these tobacco and chemical products is by truck.
11-14 Chapter 11 Intermodal System
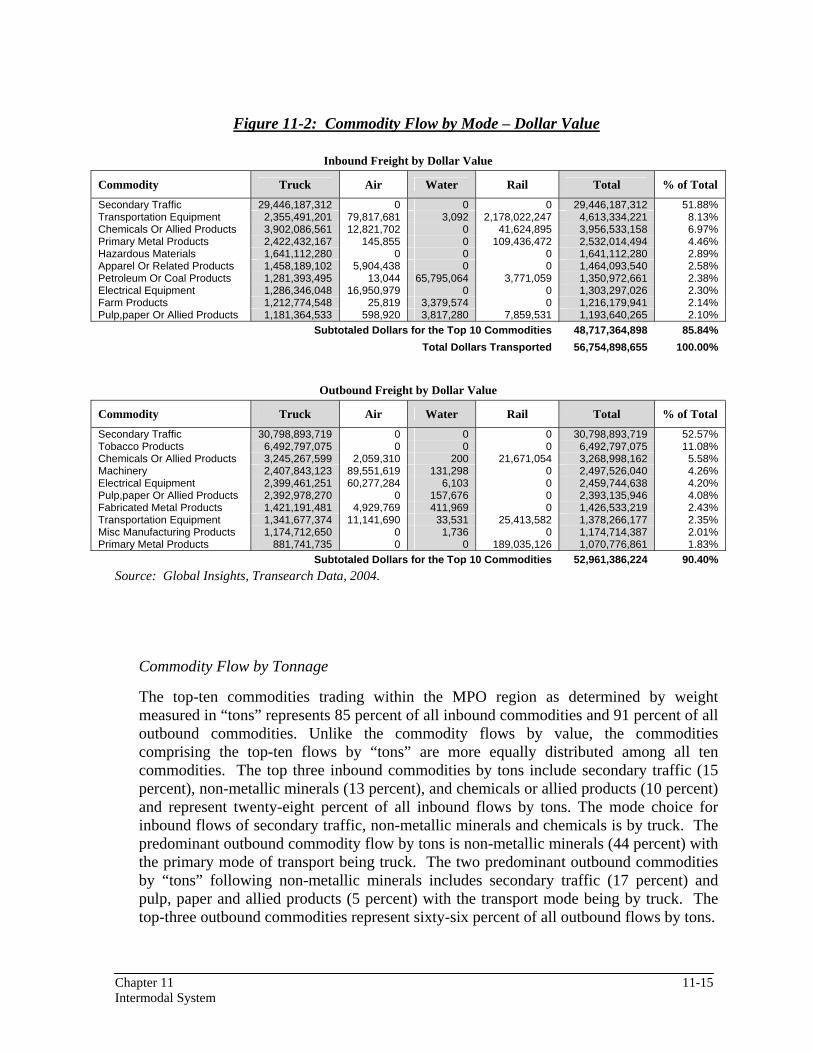
Figure 11-2: Commodity Flow by Mode – Dollar Value
Inbound Freight by Dollar Value
Commodity Truck Air Water Rail Total % of Total
Secondary Traffic 29,446,187,312 0 0 0 29,446,187,312 51.88% Transportation Equipment 2,355,491,201 79,817,681 3,092 2,178,022,247 4,613,334,221 8.13% Chemicals Or Allied Products 3,902,086,561 12,821,702 0 41,624,895 3,956,533,158 6.97% Primary Metal Products 2,422,432,167 145,855 0 109,436,472 2,532,014,494 4.46% Hazardous Materials 1,641,112,280 0 0 0 1,641,112,280 2.89% Apparel Or Related Products 1,458,189,102 5,904,438 0 0 1,464,093,540 2.58% Petroleum Or Coal Products 1,281,393,495 13,044 65,795,064 3,771,059 1,350,972,661 2.38% Electrical Equipment 1,286,346,048 16,950,979 0 0 1,303,297,026 2.30% Farm Products 1,212,774,548 25,819 3,379,574 0 1,216,179,941 2.14% Pulp,paper Or Allied Products 1,181,364,533 598,920 3,817,280 7,859,531 1,193,640,265 2.10%
Subtotaled Dollars for the Top 10 Commodities 48,717,364,898 85.84% Total Dollars Transported 56,754,898,655 100.00%
Outbound Freight by Dollar Value
Commodity Truck Air Water Rail Total % of Total
Secondary Traffic 30,798,893,719 0 0 0 30,798,893,719 52.57% Tobacco Products 6,492,797,075 0 0 0 6,492,797,075 11.08% Chemicals Or Allied Products 3,245,267,599 2,059,310 200 21,671,054 3,268,998,162 5.58% Machinery 2,407,843,123 89,551,619 131,298 0 2,497,526,040 4.26% Electrical Equipment 2,399,461,251 60,277,284 6,103 0 2,459,744,638 4.20% Pulp,paper Or Allied Products 2,392,978,270 0 157,676 0 2,393,135,946 4.08% Fabricated Metal Products 1,421,191,481 4,929,769 411,969 0 1,426,533,219 2.43% Transportation Equipment 1,341,677,374 11,141,690 33,531 25,413,582 1,378,266,177 2.35% Misc Manufacturing Products 1,174,712,650 0 1,736 0 1,174,714,387 2.01% Primary Metal Products 881,741,735 0 0 189,035,126 1,070,776,861 1.83%
Subtotaled Dollars for the Top 10 Commodities 52,961,386,224 90.40% Source: Global Insights, Transearch Data, 2004.
Commodity Flow by Tonnage
The top-ten commodities trading within the MPO region as determined by weight measured in “tons” represents 85 percent of all inbound commodities and 91 percent of all outbound commodities. Unlike the commodity flows by value, the commodities comprising the top-ten flows by “tons” are more equally distributed among all ten commodities. The top three inbound commodities by tons include secondary traffic (15 percent), non-metallic minerals (13 percent), and chemicals or allied products (10 percent) and represent twenty-eight percent of all inbound flows by tons. The mode choice for inbound flows of secondary traffic, non-metallic minerals and chemicals is by truck. The predominant outbound commodity flow by tons is non-metallic minerals (44 percent) with the primary mode of transport being truck. The two predominant outbound commodities by “tons” following non-metallic minerals includes secondary traffic (17 percent) and pulp, paper and allied products (5 percent) with the transport mode being by truck. The top-three outbound commodities represent sixty-six percent of all outbound flows by tons.
Chapter 11 11-15 Intermodal System
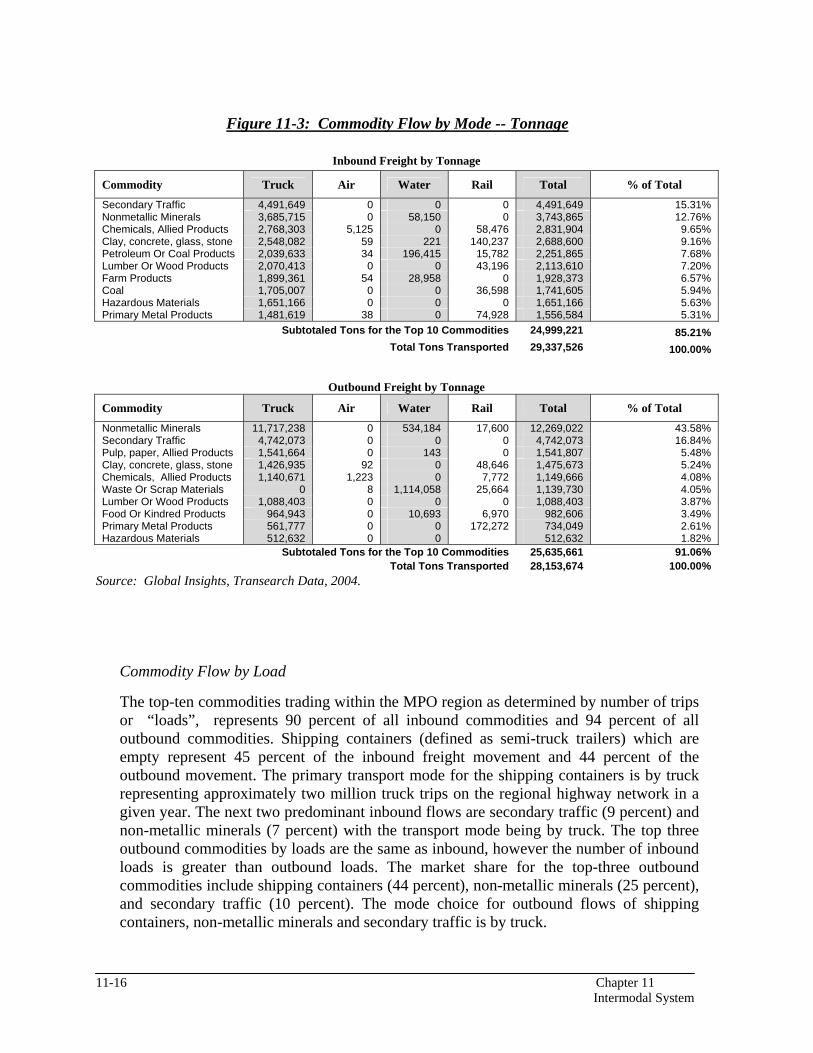
Figure 11-3: Commodity Flow by Mode -- Tonnage
Inbound Freight by Tonnage
Commodity Truck Air Water Rail Total % of Total
Secondary Traffic 4,491,649 0 0 0 4,491,649 15.31% Nonmetallic Minerals 3,685,715 0 58,150 0 3,743,865 12.76% Chemicals, Allied Products 2,768,303 5,125 0 58,476 2,831,904 9.65% Clay, concrete, glass, stone 2,548,082 59 221 140,237 2,688,600 9.16% Petroleum Or Coal Products 2,039,633 34 196,415 15,782 2,251,865 7.68% Lumber Or Wood Products 2,070,413 0 0 43,196 2,113,610 7.20% Farm Products 1,899,361 54 28,958 0 1,928,373 6.57% Coal 1,705,007 0 0 36,598 1,741,605 5.94% Hazardous Materials 1,651,166 0 0 0 1,651,166 5.63% Primary Metal Products 1,481,619 38 0 74,928 1,556,584 5.31%
Subtotaled Tons for the Top 10 Commodities 24,999,221 85.21% Total Tons Transported 29,337,526 100.00%
Outbound Freight by Tonnage
Commodity Truck Air Water Rail Total % of Total
Nonmetallic Minerals 11,717,238 0 534,184 17,600 12,269,022 43.58% Secondary Traffic 4,742,073 0 0 0 4,742,073 16.84% Pulp, paper, Allied Products 1,541,664 0 143 0 1,541,807 5.48% Clay, concrete, glass, stone 1,426,935 92 0 48,646 1,475,673 5.24% Chemicals, Allied Products 1,140,671 1,223 0 7,772 1,149,666 4.08% Waste Or Scrap Materials 0 8 1,114,058 25,664 1,139,730 4.05% Lumber Or Wood Products 1,088,403 0 0 0 1,088,403 3.87% Food Or Kindred Products 964,943 0 10,693 6,970 982,606 3.49% Primary Metal Products 561,777 0 0 172,272 734,049 2.61% Hazardous Materials 512,632 0 0 512,632 1.82%
Subtotaled Tons for the Top 10 Commodities 25,635,661 91.06% Total Tons Transported 28,153,674 100.00%
Source: Global Insights, Transearch Data, 2004.
Commodity Flow by Load
The top-ten commodities trading within the MPO region as determined by number of trips or “loads”, represents 90 percent of all inbound commodities and 94 percent of all outbound commodities. Shipping containers (defined as semi-truck trailers) which are empty represent 45 percent of the inbound freight movement and 44 percent of the outbound movement. The primary transport mode for the shipping containers is by truck representing approximately two million truck trips on the regional highway network in a given year. The next two predominant inbound flows are secondary traffic (9 percent) and non-metallic minerals (7 percent) with the transport mode being by truck. The top three outbound commodities by loads are the same as inbound, however the number of inbound loads is greater than outbound loads. The market share for the top-three outbound commodities include shipping containers (44 percent), non-metallic minerals (25 percent), and secondary traffic (10 percent). The mode choice for outbound flows of shipping containers, non-metallic minerals and secondary traffic is by truck.
11-16 Chapter 11 Intermodal System
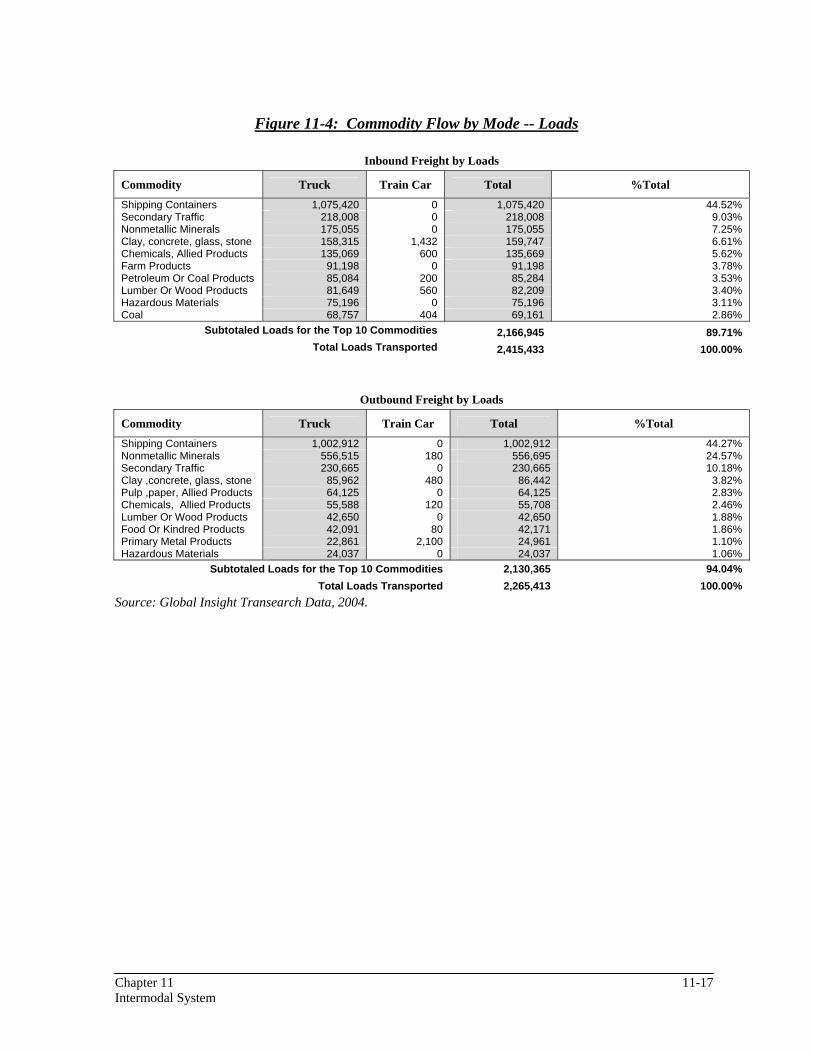
Figure 11-4: Commodity Flow by Mode -- Loads
Inbound Freight by Loads
Commodity Truck Train Car Total %Total
Shipping Containers 1,075,420 0 1,075,420 44.52% Secondary Traffic 218,008 0 218,008 9.03% Nonmetallic Minerals 175,055 0 175,055 7.25% Clay, concrete, glass, stone 158,315 1,432 159,747 6.61% Chemicals, Allied Products 135,069 600 135,669 5.62% Farm Products 91,198 0 91,198 3.78% Petroleum Or Coal Products 85,084 200 85,284 3.53% Lumber Or Wood Products 81,649 560 82,209 3.40% Hazardous Materials 75,196 0 75,196 3.11% Coal 68,757 404 69,161 2.86%
Subtotaled Loads for the Top 10 Commodities 2,166,945 89.71% Total Loads Transported 2,415,433 100.00%
Outbound Freight by Loads
Commodity Truck Train Car Total %Total
Shipping Containers 1,002,912 0 1,002,912 44.27% Nonmetallic Minerals 556,515 180 556,695 24.57% Secondary Traffic 230,665 0 230,665 10.18% Clay ,concrete, glass, stone 85,962 480 86,442 3.82% Pulp ,paper, Allied Products 64,125 0 64,125 2.83% Chemicals, Allied Products 55,588 120 55,708 2.46% Lumber Or Wood Products 42,650 0 42,650 1.88% Food Or Kindred Products 42,091 80 42,171 1.86% Primary Metal Products 22,861 2,100 24,961 1.10% Hazardous Materials 24,037 0 24,037 1.06%
Subtotaled Loads for the Top 10 Commodities 2,130,365 94.04% Total Loads Transported 2,265,413 100.00%
Source: Global Insight Transearch Data, 2004.
Chapter 11 11-17 Intermodal System