chapter 11 inference for distributions of categorical … · chapter 11! inference for...
TRANSCRIPT

The Practice of Statistics, 5th Edition Starnes, Tabor, Yates, Moore
Bedford Freeman Worth Publishers
CHAPTER 11!Inference for Distributions of Categorical Data 11.2 Inference for Two-Way Tables
Learning Objectives After this section, you should be able to:
The Practice of Statistics, 5th Edition 2
ü COMPARE conditional distributions for data in a two-way table. ü STATE appropriate hypotheses and COMPUTE expected counts
for a chi-square test based on data in a two-way table. ü CALCULATE the chi-square statistic, degrees of freedom, and P-
value for a chi-square test based on data in a two-way table. ü PERFORM a chi-square test for homogeneity. ü PERFORM a chi-square test for independence. ü CHOOSE the appropriate chi-square test.
Inference for Two-Way Tables
The Practice of Statistics, 5th Edition 3
Introduction The two-sample z procedures of Chapter 10 allow us to compare the proportions of successes in two populations or for two treatments. What if we want to compare more than two samples or groups? More generally, what if we want to compare the distributions of a single categorical variable across several populations or treatments? We need a new statistical test. The new test starts by presenting the data in a two-way table.
Two-way tables have more general uses than comparing distributions of a single categorical variable. They can be used to describe relationships between any two categorical variables.
The Practice of Statistics, 5th Edition 4
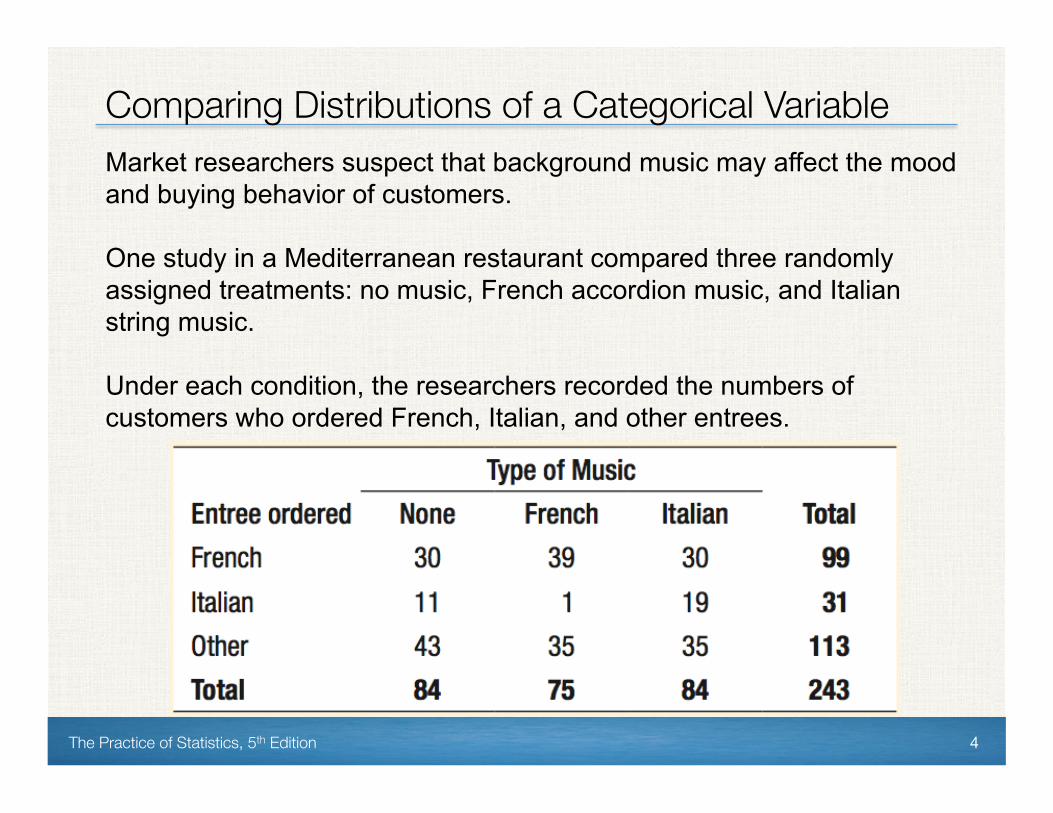
Comparing Distributions of a Categorical Variable Market researchers suspect that background music may affect the mood and buying behavior of customers. One study in a Mediterranean restaurant compared three randomly assigned treatments: no music, French accordion music, and Italian string music. Under each condition, the researchers recorded the numbers of customers who ordered French, Italian, and other entrees.
The Practice of Statistics, 5th Edition 5
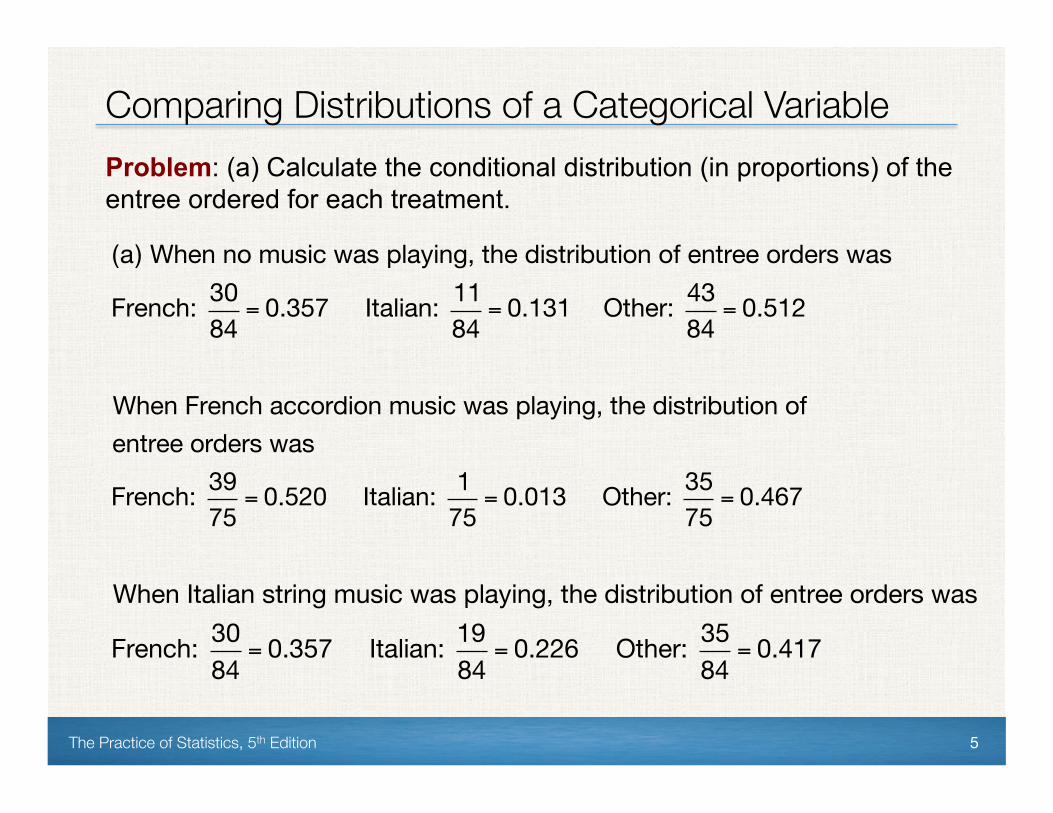
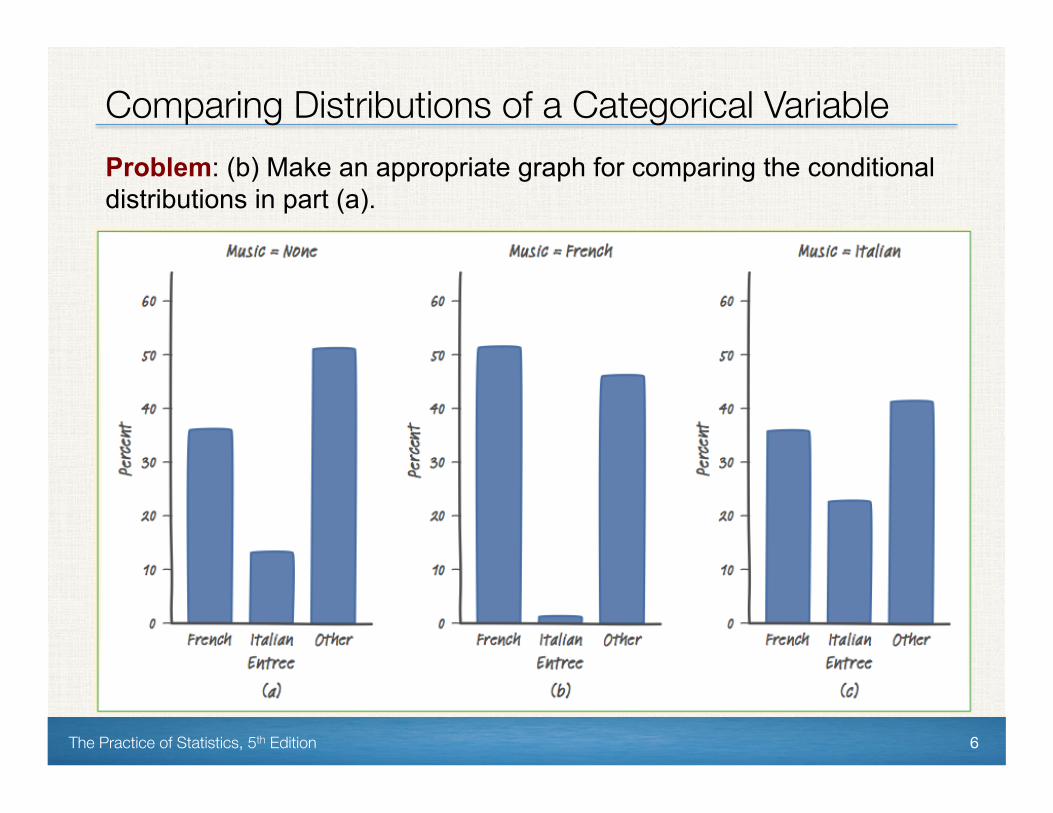
Comparing Distributions of a Categorical Variable Problem: (a) Calculate the conditional distribution (in proportions) of the entree ordered for each treatment. (a) When no music was playing, the distribution of entree orders was
French: 3084
= 0.357 Italian: 1184
= 0.131 Other: 4384
= 0.512
When French accordion music was playing, the distribution of entree orders was
French: 3975
= 0.520 Italian: 175
= 0.013 Other: 3575
= 0.467
When Italian string music was playing, the distribution of entree orders was
French: 3084
= 0.357 Italian: 1984
= 0.226 Other: 3584
= 0.417
The Practice of Statistics, 5th Edition 6
Comparing Distributions of a Categorical Variable Problem: (b) Make an appropriate graph for comparing the conditional distributions in part (a).
The Practice of Statistics, 5th Edition 7
Comparing Distributions of a Categorical Variable Problem: (c) Write a few sentences comparing the distributions of entrees ordered under the three music treatments. The type of entrée that customers buy seems to differ considerably across the three music treatments. Orders of Italian entrees are very low (1.3%) when French music is playing but are higher when Italian music (22.6%) or no music (13.1%) is playing. French entrees seem popular in this restaurant, as they are ordered frequently under all music conditions but notably more often when French music is playing. For all three music treatments, the percent of Other entrees ordered was similar.
The Practice of Statistics, 5th Edition 8
Comparing Distributions of a Categorical Variable The problem of how to do many comparisons at once with an overall measure of confidence in all our conclusions is common in statistics. This is the problem of multiple comparisons. Statistical methods for dealing with multiple comparisons usually have two parts:
1. An overall test to see if there is good evidence of any differences among the parameters that we want to compare.
2. A detailed follow-up analysis to decide which of the parameters differ and to estimate how large the differences are.
The overall test uses the familiar chi-square statistic and distributions.
The Practice of Statistics, 5th Edition 9
Expected Counts and the Chi-Square Statistic A chi-square test for homogeneity begins with the hypotheses
H0: There is no difference in the distribution of a categorical variable for several populations or treatments.
Ha: There is a difference in the distribution of a categorical variable for several populations or treatments.
We compare the observed counts in a two-way table with the counts we would expect if H0 were true.
The Practice of Statistics, 5th Edition 10
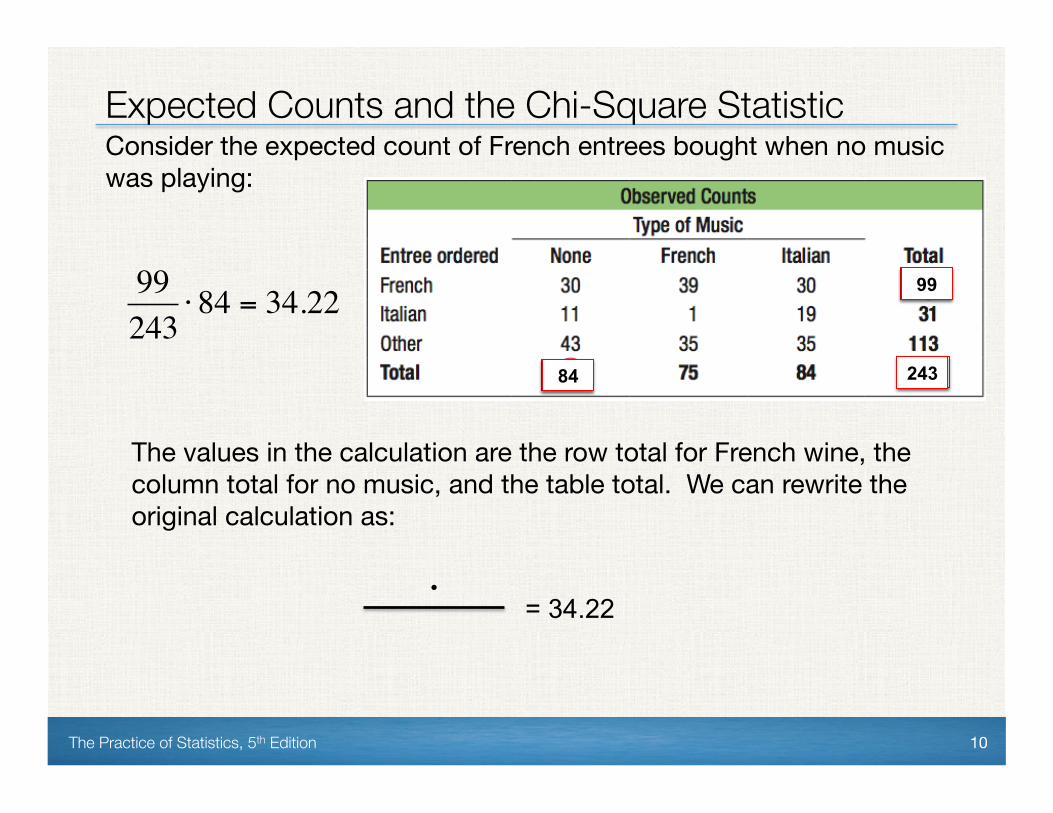
Expected Counts and the Chi-Square Statistic Consider the expected count of French entrees bought when no music was playing:
€
99243
⋅ 84 = 34.22
The values in the calculation are the row total for French wine, the column total for no music, and the table total. We can rewrite the original calculation as:
84 84
99 99
243 243
= 34.22 •

The Practice of Statistics, 5th Edition 11
Expected Counts and the Chi-Square Statistic
Finding Expected Counts When H0 is true, the expected count in any cell of a two-way table is
€
expected count = row total ⋅ column total
table total
Condi1ons for Performing a Chi-‐Square Test for Homogeneity • Random: The data come a well-designed random sample or from a
randomized experiment.
o 10%: When sampling without replacement, check that
n ≤ (1/10)N.
• Large Counts: All expected counts are greater than 5
The Practice of Statistics, 5th Edition 12
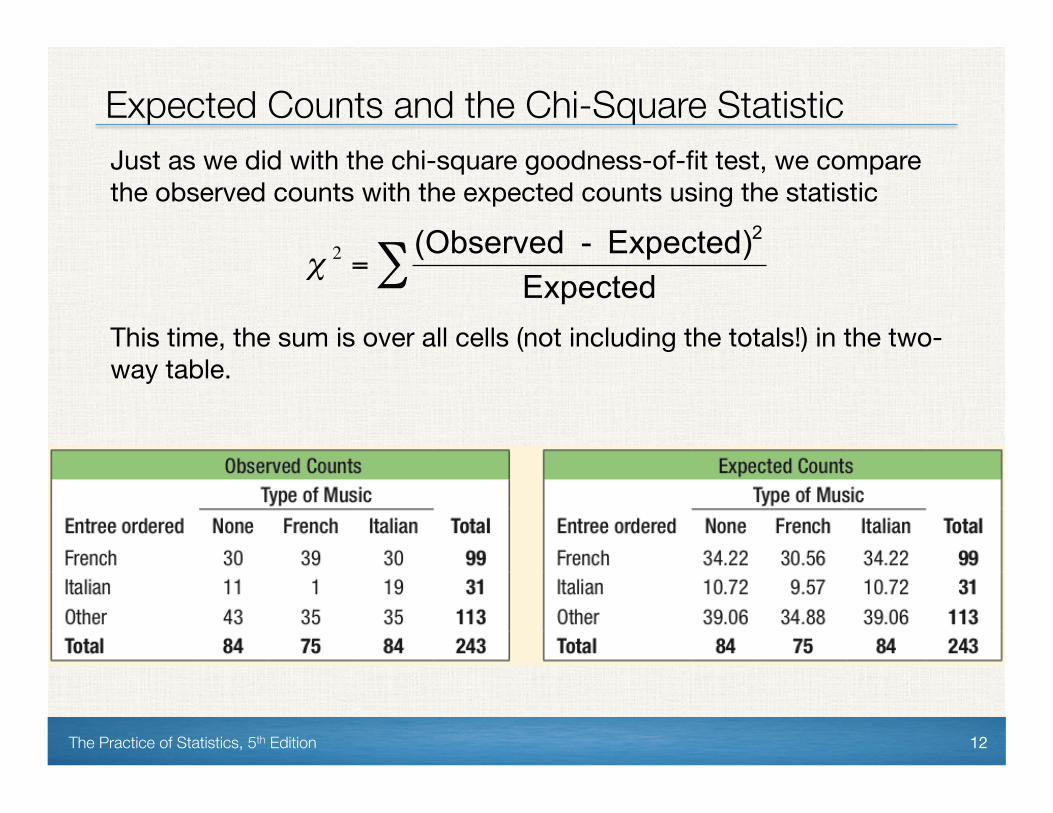
Expected Counts and the Chi-Square Statistic Just as we did with the chi-square goodness-of-fit test, we compare the observed counts with the expected counts using the statistic
This time, the sum is over all cells (not including the totals!) in the two-way table.
€
χ 2 =(Observed - Expected)2
Expected∑
The Practice of Statistics, 5th Edition 13
Expected Counts and the Chi-Square Statistic
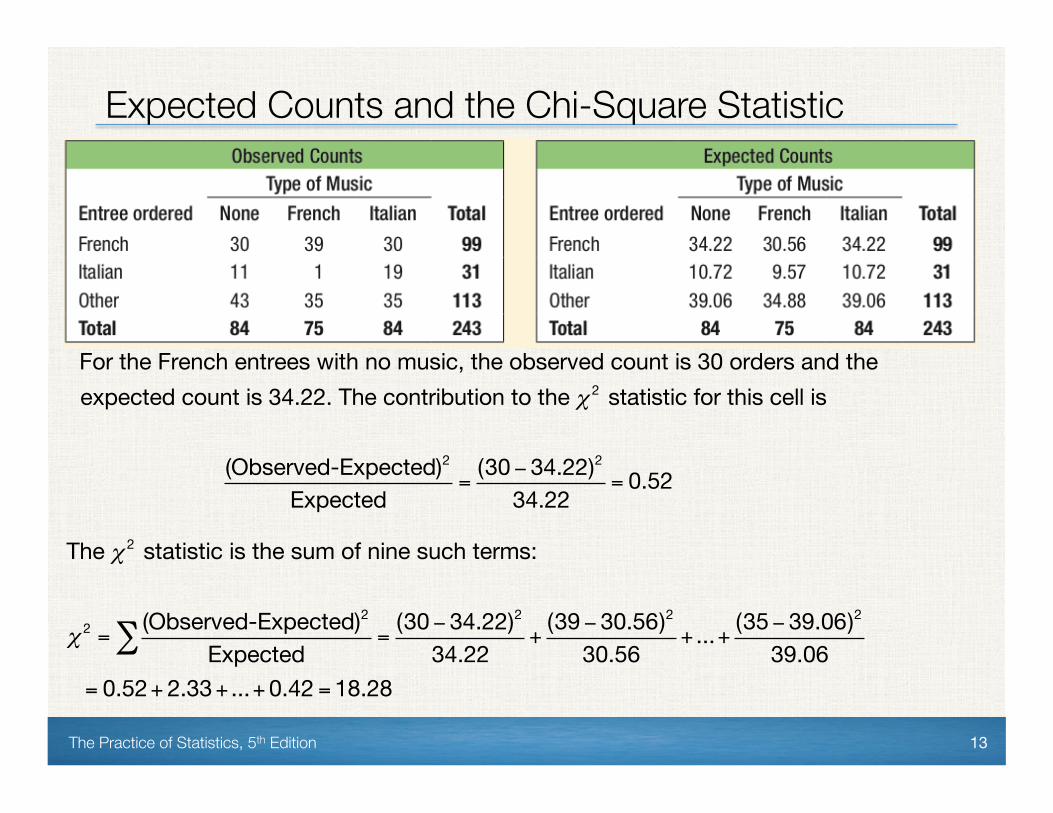
For the French entrees with no music, the observed count is 30 orders and the expected count is 34.22. The contribution to the χ 2 statistic for this cell is
(Observed-Expected)2
Expected=
(30− 34.22)2
34.22= 0.52
The χ 2 statistic is the sum of nine such terms:
χ 2 =(Observed-Expected)2
Expected∑ =(30− 34.22)2
34.22+
(39− 30.56)2
30.56+ ...+ (35− 39.06)2
39.06 = 0.52+ 2.33+ ...+0.42 =18.28
The Practice of Statistics, 5th Edition 14
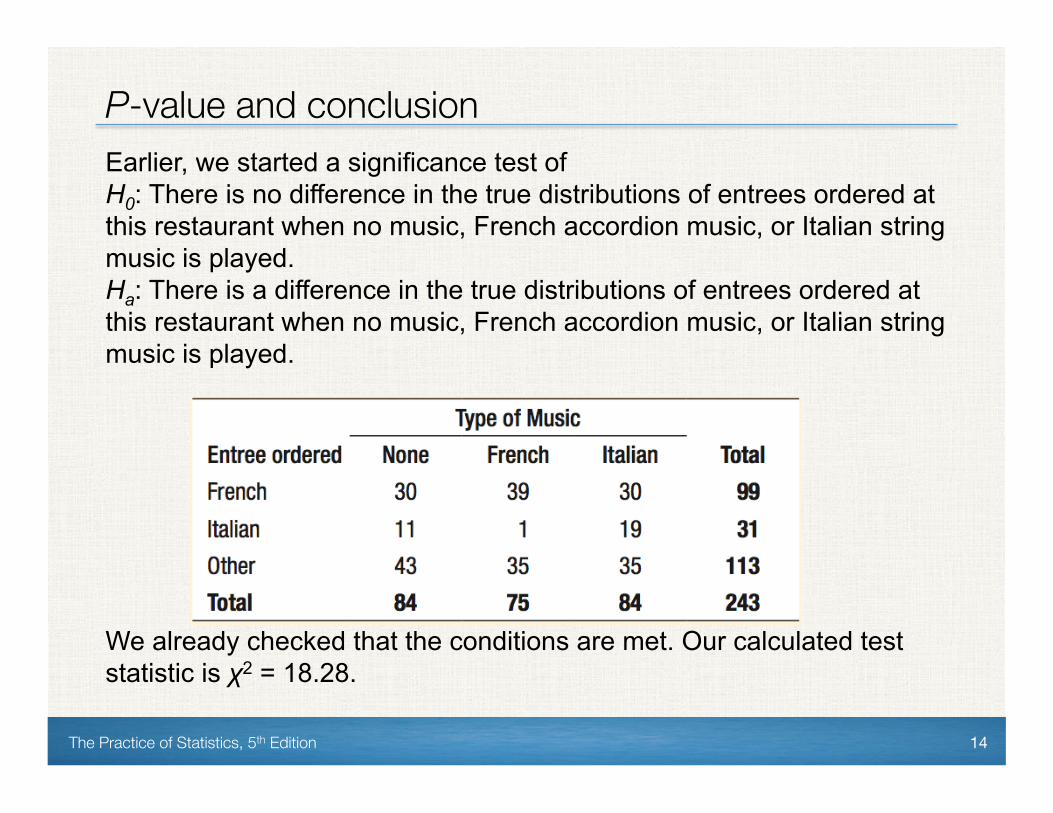
P-value and conclusion Earlier, we started a significance test of H0: There is no difference in the true distributions of entrees ordered at this restaurant when no music, French accordion music, or Italian string music is played. Ha: There is a difference in the true distributions of entrees ordered at this restaurant when no music, French accordion music, or Italian string music is played. We already checked that the conditions are met. Our calculated test statistic is χ2 = 18.28.

The Practice of Statistics, 5th Edition 15
Example: P-value and conclusion
(a) Because the two-way table has three rows and three columns that contain the data from the study, we use a chi-square distribution with df = (3 - 1)(3 - 1) = 4 to find the P-value.
P df .0025 .001 4 16.42 18.47
The value χ 2=18.28 falls between the critical values 16.42 and 18.47.
The corresponding P-value is between 0.0025 and 0.01.
Calculator: The command χ2cdf(18.28,1000,4) gives 0.0011.
Problem: (a) Use Table C to find the P-value. Then use your calculator’s χ2cdf command.
The Practice of Statistics, 5th Edition 16
Example: P-value and conclusion
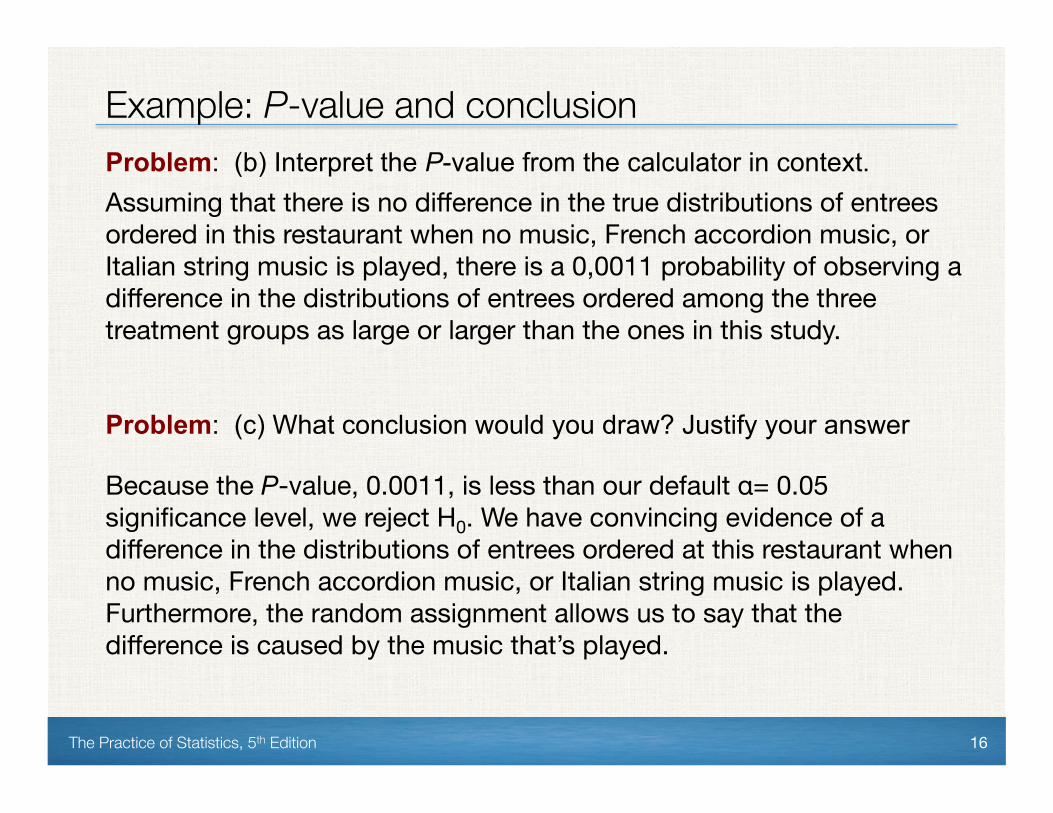
Assuming that there is no difference in the true distributions of entrees ordered in this restaurant when no music, French accordion music, or Italian string music is played, there is a 0,0011 probability of observing a difference in the distributions of entrees ordered among the three treatment groups as large or larger than the ones in this study.
Problem: (b) Interpret the P-value from the calculator in context.
Because the P-value, 0.0011, is less than our default α= 0.05 significance level, we reject H0. We have convincing evidence of a difference in the distributions of entrees ordered at this restaurant when no music, French accordion music, or Italian string music is played. Furthermore, the random assignment allows us to say that the difference is caused by the music that’s played.
Problem: (c) What conclusion would you draw? Justify your answer
The Practice of Statistics, 5th Edition 17
Chi-Square Test for Homogeneity Chi-‐Square Test for Homogeneity
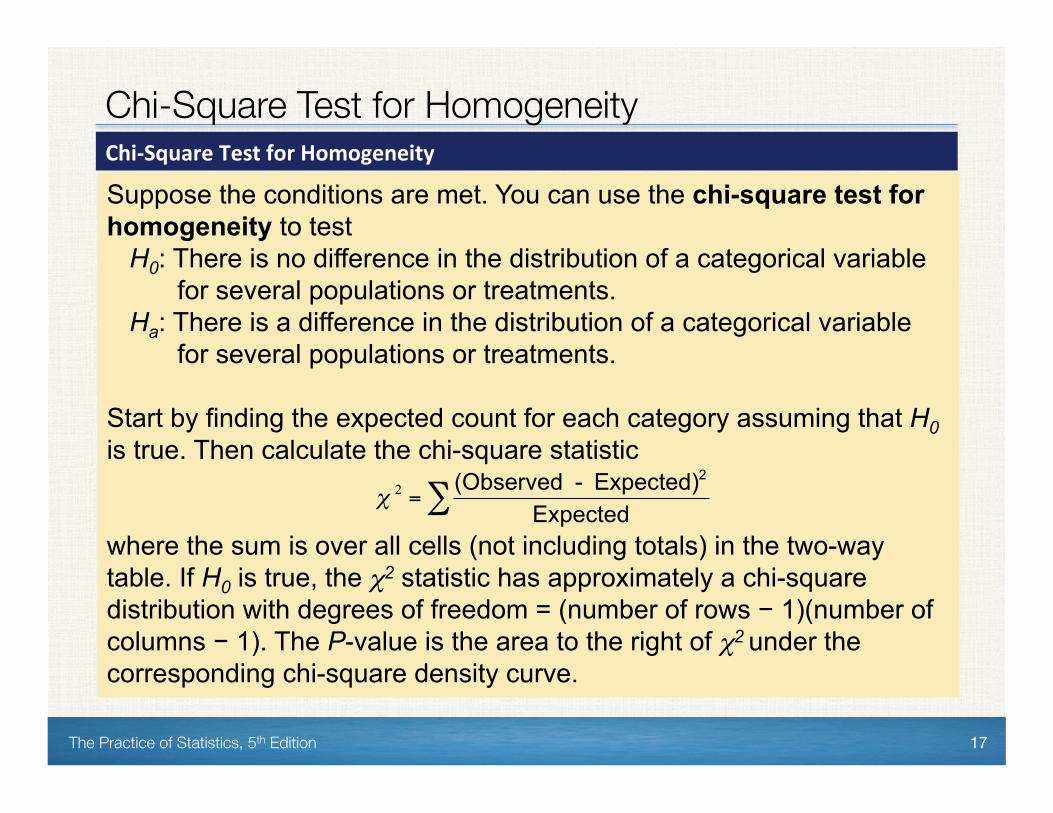
Suppose the conditions are met. You can use the chi-square test for homogeneity to test
H0: There is no difference in the distribution of a categorical variable for several populations or treatments.
Ha: There is a difference in the distribution of a categorical variable for several populations or treatments.
Start by finding the expected count for each category assuming that H0 is true. Then calculate the chi-square statistic where the sum is over all cells (not including totals) in the two-way table. If H0 is true, the χ2 statistic has approximately a chi-square distribution with degrees of freedom = (number of rows − 1)(number of columns − 1). The P-value is the area to the right of χ2 under the corresponding chi-square density curve.
€
χ 2 =(Observed - Expected)2
Expected∑
The Practice of Statistics, 5th Edition 18
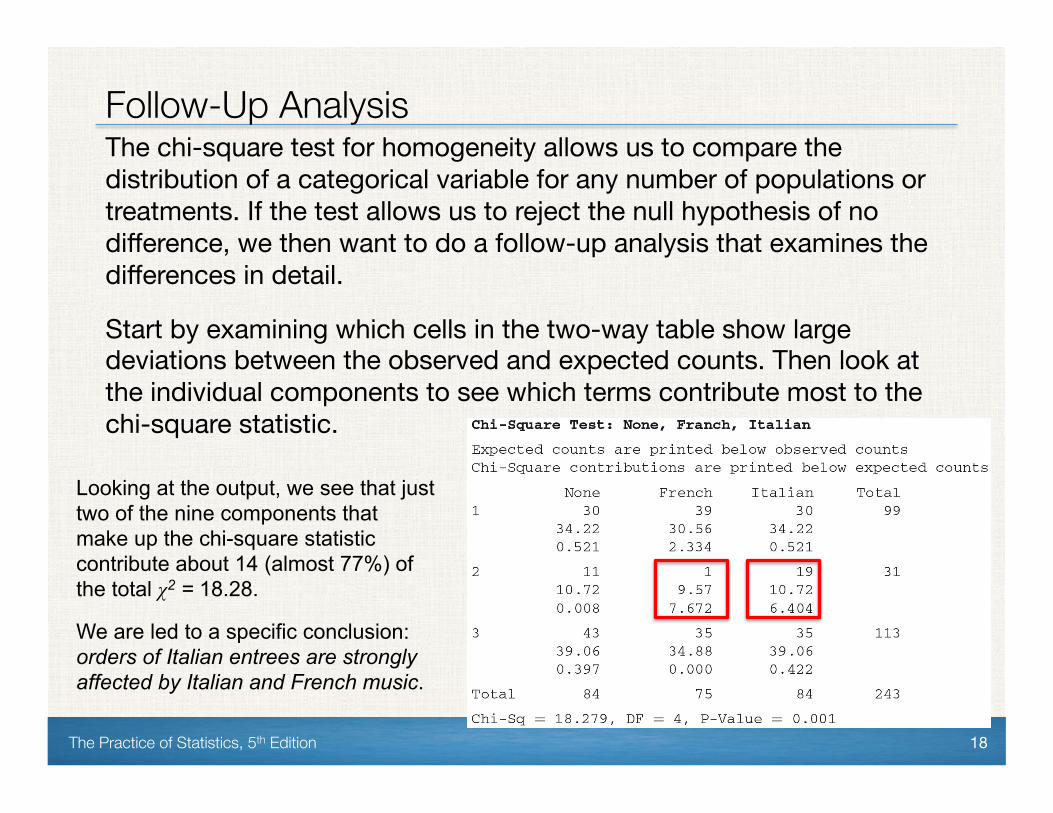
Follow-Up Analysis The chi-square test for homogeneity allows us to compare the distribution of a categorical variable for any number of populations or treatments. If the test allows us to reject the null hypothesis of no difference, we then want to do a follow-up analysis that examines the differences in detail.
Start by examining which cells in the two-way table show large deviations between the observed and expected counts. Then look at the individual components to see which terms contribute most to the chi-square statistic.
Looking at the output, we see that just two of the nine components that make up the chi-square statistic contribute about 14 (almost 77%) of the total χ2 = 18.28.
We are led to a specific conclusion: orders of Italian entrees are strongly affected by Italian and French music.
The Practice of Statistics, 5th Edition 19
Relationships Between Categorical Variables Another common situation that leads to a two-way table is when a single random sample of individuals is chosen from a single population and then classified based on two categorical variables.
In that case, our goal is to analyze the relationship between the variables.
Our null hypothesis is that there is no association between the two categorical variables in the population of interest.
The alternative hypothesis is that there is an association between the variables.
The Practice of Statistics, 5th Edition 20
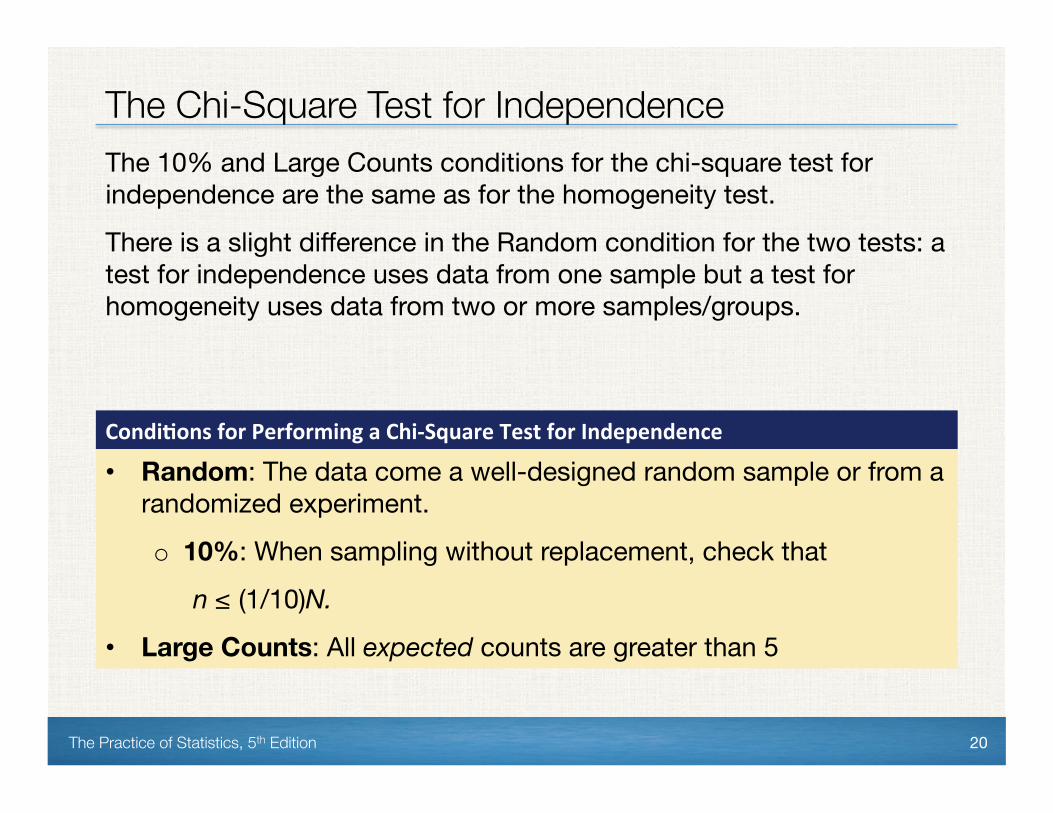
The Chi-Square Test for Independence The 10% and Large Counts conditions for the chi-square test for independence are the same as for the homogeneity test.
There is a slight difference in the Random condition for the two tests: a test for independence uses data from one sample but a test for homogeneity uses data from two or more samples/groups.
Condi1ons for Performing a Chi-‐Square Test for Independence • Random: The data come a well-designed random sample or from a
randomized experiment.
o 10%: When sampling without replacement, check that
n ≤ (1/10)N.
• Large Counts: All expected counts are greater than 5

The Practice of Statistics, 5th Edition 21
Chi-Square Test for Independence Chi-‐Square Test for Independence
Suppose the conditions are met. You can use the chi-square test for independence to test
H0: There is no association between two categorical variables in the population of interest.
Ha: There is an association between two categorical variables in the population of interest.
Start by finding the expected count for each category assuming that H0 is true. Then calculate the chi-square statistic where the sum is over all cells (not including totals) in the two-way table. If H0 is true, the χ2 statistic has approximately a chi-square distribution with degrees of freedom = (number of rows − 1)(number of columns − 1). The P-value is the area to the right of χ2 under the corresponding chi-square density curve.
€
χ 2 =(Observed - Expected)2
Expected∑
The Practice of Statistics, 5th Edition 22
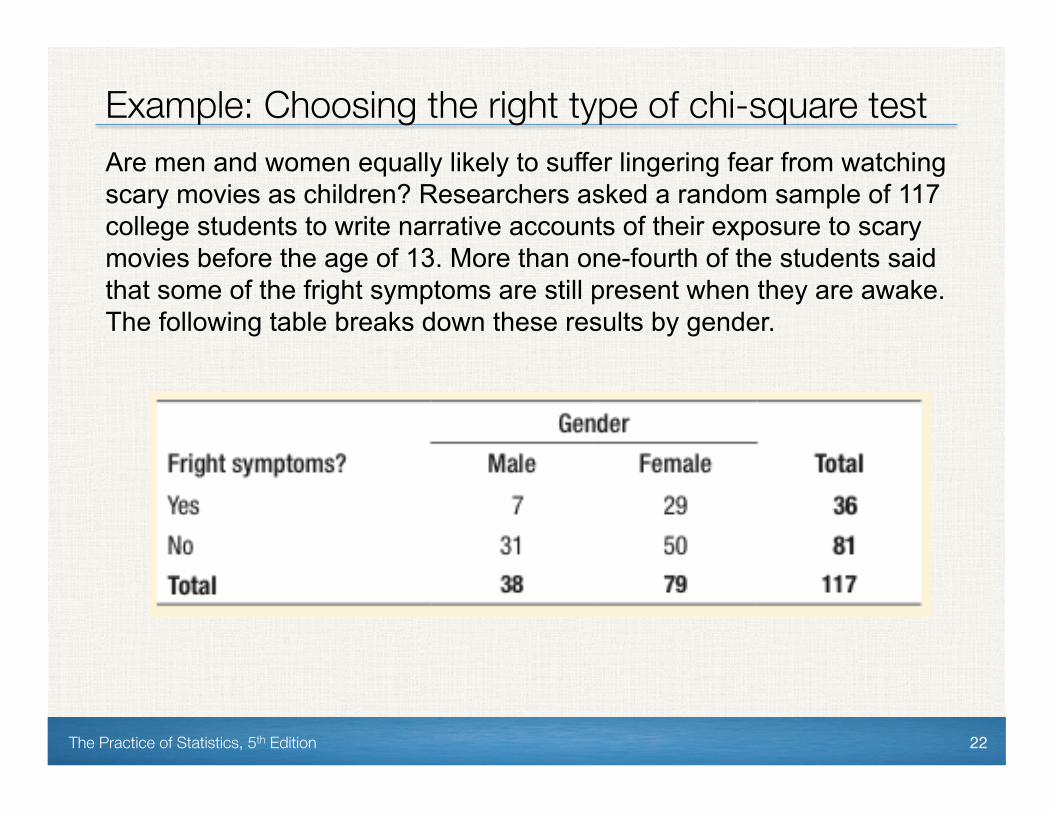
Example: Choosing the right type of chi-square test Are men and women equally likely to suffer lingering fear from watching scary movies as children? Researchers asked a random sample of 117 college students to write narrative accounts of their exposure to scary movies before the age of 13. More than one-fourth of the students said that some of the fright symptoms are still present when they are awake. The following table breaks down these results by gender.

The Practice of Statistics, 5th Edition 23
Example: Choosing the right type of chi-square test Minitab output for a chi-square test using these data is shown below.
The Practice of Statistics, 5th Edition 24
Example: Choosing the right type of chi-square test Problem: Assume that the conditions for performing inference are met. (a) Explain why a chi-square test for independence and not a chi-square test for homogeneity should be used in this setting.
The data were produced using a single random sample of college students, who were then classified by gender and whether or not they had lingering fright symptoms. The chi-square test for homogeneity requires independent random samples from each population.
The Practice of Statistics, 5th Edition 25
Example: Choosing the right type of chi-square test Problem: Assume that the conditions for performing inference are met. (b) State an appropriate pair of hypotheses for researchers to test in this setting.
The null hypothesis is H0: There is no association between gender and ongoing fright symptoms
in the population of college students. The alternative hypothesis is Ha: There is an association between gender and ongoing fright symptoms
in the population of college students.
The Practice of Statistics, 5th Edition 26
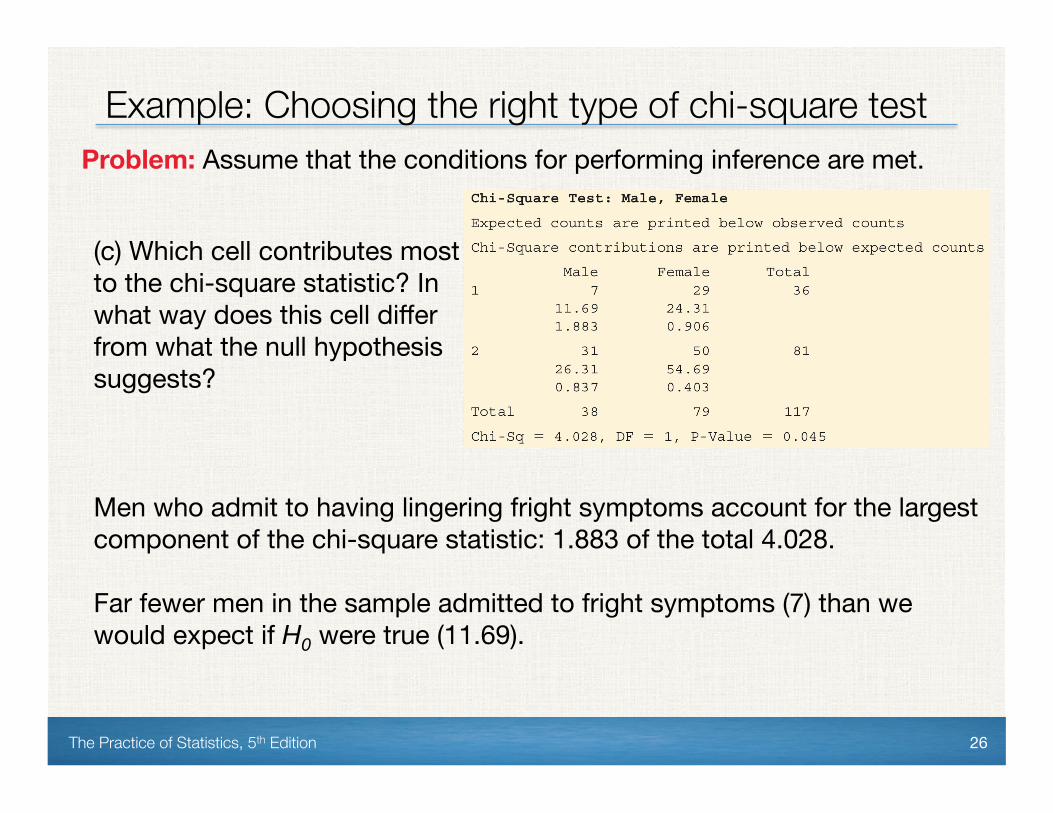
Example: Choosing the right type of chi-square test Problem: Assume that the conditions for performing inference are met.
Men who admit to having lingering fright symptoms account for the largest component of the chi-square statistic: 1.883 of the total 4.028. Far fewer men in the sample admitted to fright symptoms (7) than we would expect if H0 were true (11.69).
(c) Which cell contributes most to the chi-square statistic? In what way does this cell differ from what the null hypothesis suggests?
The Practice of Statistics, 5th Edition 27
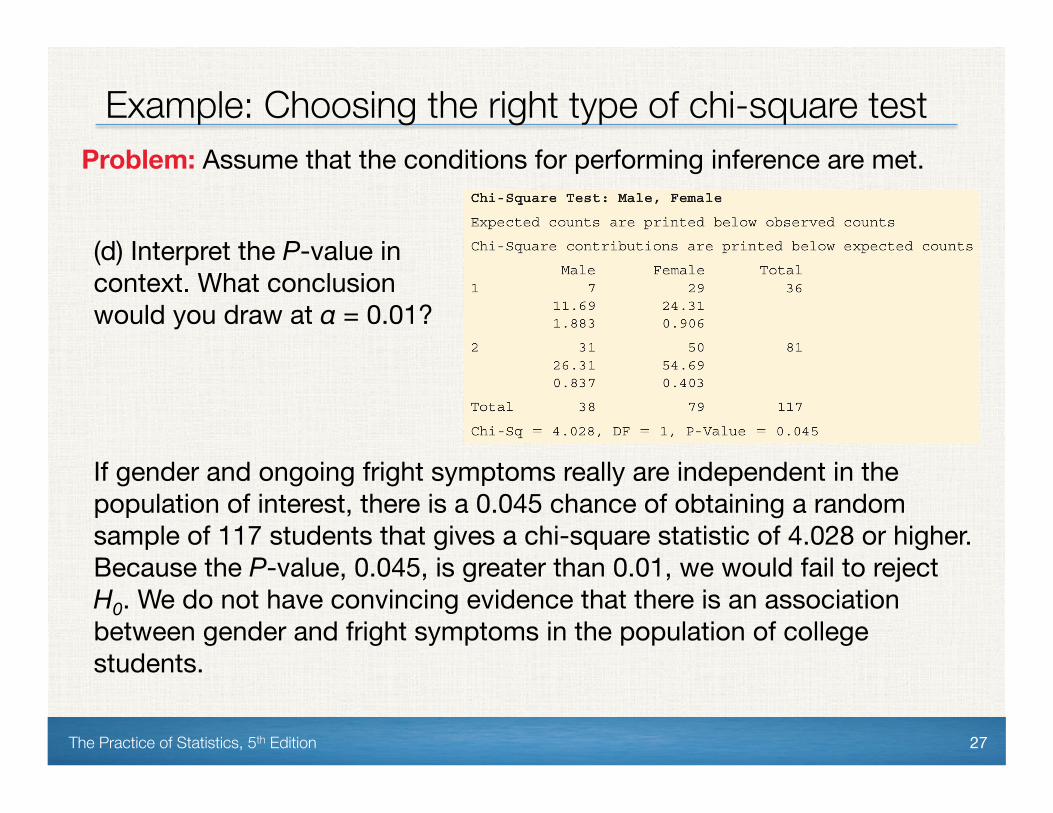
Example: Choosing the right type of chi-square test Problem: Assume that the conditions for performing inference are met.
If gender and ongoing fright symptoms really are independent in the population of interest, there is a 0.045 chance of obtaining a random sample of 117 students that gives a chi-square statistic of 4.028 or higher. Because the P-value, 0.045, is greater than 0.01, we would fail to reject H0. We do not have convincing evidence that there is an association between gender and fright symptoms in the population of college students.
(d) Interpret the P-value in context. What conclusion would you draw at α = 0.01?
Section Summary In this section, we learned how to…
The Practice of Statistics, 5th Edition 28
ü COMPARE conditional distributions for data in a two-way table. ü STATE appropriate hypotheses and COMPUTE expected counts for a
chi-square test based on data in a two-way table. ü CALCULATE the chi-square statistic, degrees of freedom, and P-value
for a chi-square test based on data in a two-way table. ü PERFORM a chi-square test for homogeneity. ü PERFORM a chi-square test for independence. ü CHOOSE the appropriate chi-square test.
Inference for Two-Way Tables