chapter 11. hazardous waste
TRANSCRIPT

Sources and Effects
11.1HAZARDOUS WASTE DEFINED Purpose and Scope Definition of Solid Waste Definition of Hazardous Waste
Exclusions Small Quantity Generators Recyclable Materials Container Residue
11.2HAZARDOUS WASTE SOURCES Hazardous Waste from Specific
Sources Wood Preservation Inorganic Pigments Organic Chemicals Inorganic Chemicals Pesticides Explosives Petroleum Refining Iron and Steel Secondary Lead Veterinary Pharmaceuticals Ink Formulation Coking
Hazardous Wastes from NonspecificSources
11.3EFFECTS OF HAZARDOUS WASTE Human Health Hazards
Site Safety Environmental Contamination
Characterization, Sampling,and Analysis
11.4HAZARDOUS WASTE CHARACTER-IZATION Criteria Characteristics
Characteristic of Ignitability Characteristic of Corrosivity Characteristic of Reactivity Characteristic of Toxicity
Specific Compounds
11.5SAMPLING AND ANALYSIS Sampling Equipment and Procedures
Safety Sampling Equipment Procedures Sample Preservation
Quality Assurance and QualityControl
Sample Custody Precision and Accuracy
Analysis
11.6COMPATIBILITY
11Hazardous WastePaul A. Bouis | Mary A. Evans | Lloyd H. Ketchum, Jr. | David H.F.Liu | William C. Zegel
©1999 CRC Press LLC

Risk Assessment and WasteManagement
11.7THE HAZARD RANKING SYSTEM AND THENATIONAL PRIORITY LIST
11.8RISK ASSESSMENT Review of Basic Chemical Properties RA Paradigms
Hazard Identification Dose-Response Relationship Exposure Analysis Risk Characterization Public Perception of Risk
Risk Management Pure-Risk Standards Technology-Based Standards No Unreasonable Risk
11.9WASTE MINIMIZATION AND REDUC-TION Source Reduction and Control
Input Materials Technology Changes Procedural Changes Product Changes Waste Exchange
Recycling and Reuse Direct On-Site Reuse Additional On-Site Recovery Off-Site Recovery Sale for Reuse Off-Site
11.10HAZARDOUS WASTE TRANSPORTATION Generator Requirements
EPA ID Number Pretransport Regulations Waste Accumulation The Manifest Recordkeeping and Reporting Export and Import of Hazardous
Waste Transporters and Carriers
Hazardous Materials Transportation Actand Other Regulations
Modes of Transport
Treatment and Disposal
11.11TREATMENT, STORAGE, AND DISPOSALREQUIREMENTS General Facility Standards
Preparedness and Prevention Contingency Plan and Emergency
Procedure General Technical Standards for Interim
Status Facilities Groundwater Monitoring Closure Financial Requirements
11.12STORAGE Containers Tanks Surface Impoundments Waste Piles Landfills Underground Injection
11.13TREATMENT AND DISPOSAL ALTER-NATIVES 1302Available Processes Process Selection
11.14WASTE DESTRUCTION TECHNOLOGY Incineration
Incinerator System Design Liquid Injection Incinerators Rotary Kiln Incinerators Fixed Hearth Incinerators Fluidized Bed Incinerators Process Performance
Wet Air Oxidation Process Description Process Characteristics Applicability/Limitations
Supercritical Water Oxidation Process Description Applicability/Limitations
11.15WASTE CONCENTRATION TECHNOLOGY Gravity Separation
Sedimentation
©1999 CRC Press LLC
©1999 CRC Press LLC
Centrifugation Flocculation Oil/Water Separation Dissolved Air Flotation Heavy Media Separation
Phase Change Evaporation Air Stripping Steam Stripping Distillation
Dissolution Soil Flushing/Soil Washing Chelation Liquid/Liquid Extraction Supercritical Extraction
Size/Adsorptivity/Ionic Characteristics Filtration Carbon Adsorption Reverse Osmosis Ion Exchange Electrodialysis
Chemical Treatment Processes Neutralization Chemical Precipitation Oxidation and Reduction Hydrolysis Chemical Oxidation Electrolytic Oxidation Alkaline Metal Dechlorination Alkaline Metal/Polyethylene Glycol
(APEG) Based-Catalyzed Decomposition
11.16SOLIDIFICATION AND STABILIZATIONTECHNOLOGIES Applications Technology Description
Cement-based Processes Pozzolanic Processes Thermoplastic Processes Organic Polymer Processes
Technology Limitations Performance Testing
11.17BIOLOGICAL TREATMENT Aerobic Biological Treatment
Description Applicability/Limitations
Activated Sludge Description Applicability/Limitations
Rotating Biological Contractors
Description Applicability/Limitations
Bioreclamation Description Applicability/Limitations
Anaerobic Digestion Description Applicability/Limitations
White Rot Fungus Description Applicability/Limitations
11.18BIOTREATMENT BY SEQUENCING BATCHREACTORS Process Description Modes of Operation
Idle Static, Mixed, and Aerated Fill React Settle Draw
Laboratory Treatability Studies
Storage and LeakDetection
11.19UNDERGROUND STORAGE TANKS Problems and Causes
Galvanic Corrosion Faulty Installation Piping Failures Spills and Overfills Compatibility of UST and
Contents UST Regulations
Design, Construction, andInstallation
Spills and Overfills Control Repairs Leak Detection Out of Service Systems and
Closure Financial Responsibility
11.20LEAK DETECTION AND REMEDIATION Tank Monitoring
Volumetric Leak Testing Nonvolumetric Leak Testing Inventory Monitoring Environmental Monitoring
Corrective Technologies

Radioactive Waste
11.21PRINCIPLES OF RADIOACTIVITYTypes of Radioactivity
Alpha Particles Beta Particles Gamma Rays
Half-Life and Decay of Radioisotopes
11.22SOURCES OF RADIOACTIVITY IN THEENVIRONMENT Nuclear Fuel Cycle Mining Activities Medical and Laboratory Facilities Nuclear Weapons Testing Natural Deposits
11.23SAFETY STANDARDS Protection from Exposure Basic Radiation Safety
External Radiation Internal Radiation
11.24DETECTION AND ANALYSIS Radiation Monitoring
Survey Instruments Device Calibration
Radioactivity Analysis Analytical Counting Instruments Analytical Methods
11.25MINING AND RECOVERY OF RADIOACTIVEMATERIALS
11.26LOW-LEVEL RADIOACTIVE WASTE Waste Classification Sources of Low-Level Radioactive
Waste Nuclear Fuel Cycle Waste
Industrial Waste Government Waste Medical Waste Academic Waste Greater Than Class C Waste Below Regulatory Concern Waste Mixed Waste
Quantities of LLRW Generated LLRW Commercial Disposal Sites LLRW Reduction Processes
Waste Minimization Segregation Decay Sewage Disposal Deregulation Dewatering Compaction Incineration
Liquid and Gaseous EffluentTreatment
Liquid Effluents Gaseous Effluents
Conditioning Techniques Cementation Bituminization Polymerization Vitrification
Disposal Techniques Shallow Land Burial Disposal Vaults Earth-Mounded Concrete Bunkers
11.27HIGH-LEVEL RADIOACTIVE WASTE
11.28TRANSPORT OF RADIOACTIVEMATERIALS Materials Subject to DOT Regula-
tions Regulations for Safe Transport Quantity Limits and Packaging External Radiation and Contamination
Levels
©1999 CRC Press LLC

Purpose and ScopeHazardous waste is often defined as waste material thateveryone wants picked up but no one wants put down.The legal and scientific definitions have become more com-plex as more compounds are found and more is learnedabout the toxicity of compounds and elements. TheResource Conservation and Recovery Act (RCRA) haz-ardous waste regulations (40 CFR §261 1987) provide thelegal definition of hazardous waste. This definition is notalways clear because the regulations are written in lan-guage general enough to apply to all possible situations,including unusual terminology, several exemptions, andexclusions.
The purpose of this section is to present the various de-finitions of hazardous waste in a manner useful to the en-vironmental engineer. To be a hazardous waste, materialmust first conform to the definition of waste; second, itmust fit the definition of solid waste; and third, it must fitthe definition of hazardous waste. The environmental en-gineer must test the material against each of these defini-tions. This section assumes that the generator can demon-strate whether the material is indeed a waste.
Definition of Solid WasteSolid waste need not literally be a solid. It may be a solid,a semisolid, a liquid, or a contained gaseous material. Inaccordance with RCRA regulations, a solid waste is anydiscarded material that is not specifically excluded by theregulation or excluded by granting of a special varianceby the regulatory agency. Discarded material is consideredabandoned, recycled, or inherently wastelike. Materials areconsidered abandoned if they are disposed of, burned orincinerated, or accumulated, stored, or treated (but not re-cycled) before being abandoned.
Materials are considered recycled if they are recycled oraccumulated, stored, or treated before recycling. However,materials are considered solid waste if they are used in amanner constituting disposal, burned for energy recovery,reclaimed, or accumulated speculatively. Table 11.1.1 pre-sents various classes of materials and general situations inwhich they would be considered solid wastes.
Inherently wastelike materials are solid wastes whenthey are recycled in any manner. This includes:
• Certain wastes associated with the manufacturingof tri-, tetra-, or pentachlorophenols or tetra-,penta-, or hexachlorobenzenes (for listed wastesF020, F021, F022, F023, F026, and F028, see thefollowing section for an explanation of F desig-nations
• Secondary materials that, when fed to a halogenacid furnace, exhibit characteristics of hazardouswaste or are listed as hazardous waste (see section2.2)
• Other wastes that are ordinarily disposed of,burned, or incinerated
• Materials posing a substantial hazard to humanhealth and the environment when they are recy-cled.
For a material to be considered recycled and not a solidwaste, the material must be used or reused in making aproduct without reclamation. The material is also consid-ered recycled if it is used as an effective substitute for com-mercial products or returned to the process from which itwas generated without reclamation. In this latter case, thematerial must be a substitute for raw material feedstock,and the process must use raw materials as its principalfeedstocks.
The process for determining whether a waste is a solidwaste is summarized in Figure 11.1.1.
Definition of Hazardous WasteA solid waste is classified as a hazardous waste and is sub-ject to regulation if it meets any of the following four con-ditions:
The waste is a characteristic hazardous waste, exhibitingany of the four characteristics of a hazardous waste: ig-nitability, corrosivity, reactivity, or toxicity (see Section11.4 Hazardous Waste Characterization).
The waste is specifically listed as hazardous in one of thefour tables in Part 261, Subpart D of the RCRA regu-lations: Hazardous Wastes From Nonspecific Sources,
©1999 CRC Press LLC
Sources and Effects
11.1HAZARDOUS WASTE DEFINED

Hazardous Wastes From Specific Sources, AcuteHazardous Wastes, or Toxic Wastes.
The waste is a mixture of a listed hazardous waste and anonhazardous waste.
The waste is declared hazardous by the generator of thewaste. This is true even if the waste is not hazardousby any other definition and was declared hazardous inerror.
The environmental engineer is referred to Section 261.3 ofthe RCRA regulations (40 CFR §261.3) for more infor-mation on exceptions to these criteria. A hazardous wastemust be a solid waste and thus may be in the form of asolid, semisolid, liquid, or contained gas.
The EPA developed listed wastes by examining differ-ent types of wastes and chemical products to see if theyexhibited one of the characteristics of a hazardous waste,then determining whether these met the statutory defini-tion of hazardous waste, were acutely toxic or acutely haz-ardous, or were otherwise toxic. The following series let-ters denote the origins of such wastes.
F Series includes hazardous wastes from nonspecificsources (e.g., halogenated solvents, nonhalogenatedsolvents), electroplating sludges, cyanide solutionsfrom plating batches). These are generic wastes com-
©1999 CRC Press LLC
TABLE 11.1.1 CONDITIONS UNDER WHICH COMMON MATERIALS ARE SOLID WASTES
Use Constituting Energy SpeculativeMaterial Disposal* Recovery Fuel† Reclamation‡ Accumulation§
Spent Materials Solid Waste Solid Waste Solid Waste Solid Waste
Sludge Solid Waste Solid Waste Solid Waste Solid Waste
Sludge Solid Waste Solid Waste NOT a Solid Waste Solid WasteExhibitingCharacteristics ofHazardous Waste
By-products Solid Waste Solid Waste Solid Waste Solid Waste
By-products Solid Waste Solid Waste NOT a Solid Waste Solid WasteExhibitingCharacteristics ofHazardous Waste
Commercial Solid Waste Solid Waste NOT a Solid Waste NOT a Solid WasteChemicalProducts
Scrap Metal Solid Waste Solid Waste Solid Waste Solid Waste
*Use constituting disposal includes application to or placement on the land, and use in the production of (or incorporation in) products that are applied to orplaced on the land. Exceptions are made for materials that are applied to the land in ordinary use.
†Energy recovery fuel includes direct burning, use in producing a fuel, and incorporation in a fuel. However, selected commercial chemical products are not solidwastes if their common use is fuel.
‡Reclamation includes materials processed to recover useable products, or regenerated. Examples are recovery of lead from old automobile batteries or used wheelweights and regeneration of spent catalysts or spent solvents.
§Speculative accumulation refers to materials accumulated before the precise mechanism for recycle is known. This designation can be avoided if: the material is po-tentially recyclable; a feasible means for recycle is available; and during each calendar year the amount of material recycled or transferred to another site for recyclingequals at least 75% of the material accumulated at the beginning of the period.
All Materials
YES
NO
Does §261.4(a) exclude your materialfrom regulation under RCRA becauseit is one of the following: 1. Domestic sewage 2. CWA point source discharge 3. Irrigation return flow 4. AEC source, special nuclear or by-product material 5. In situ mining waste
THE MATERIALIS NOT A RCRASOLID WASTE
THE MATERIAL IS A RCRA SOLID WASTEwhether it is: 1. Discarded 2. Used 3. Reused 4. Recycled 5. Reclaimed 6. Stored or accumulated for purposes 1-5 above
Solid, liquid, semi-solid or containedgaseous material that is: 1. Discarded 2. Used for its intended purpose 3. A manufacturing or mining by-product
Garbage, refuseor sludge
Other
FIG. 11.1.1 Definition of a solid waste.

monly produced by manufacturing and industrialprocesses.
K Series is composed of hazardous waste from specificsources (e.g., brine purification muds from the mercurycell process in chlorine production where separated, pu-rified brine is not used and API separator sludges). Theseare wastes from specifically identified industries, suchas wood preserving, petroleum refining and organicchemical manufacturing.
P Series denotes acutely hazardous waste of specific com-mercial chemical products (e.g., potassium silvercyanide, toxaphene, or arsenic oxide) including dis-carded and off-specification products, containers, andspill residuals.
U Series includes toxic hazardous wastes that are chemi-cal products, (e.g., xylene, DDT, and carbon tetrachlo-ride) including discarded products, off-specificationproducts, containers, and spill residuals.
Acute hazardous wastes are defined as fatal to humans inlow doses, or capable of causing or contributing to seri-ous irreversible, or incapacitating reversible illness. Theyare subject to more rigorous controls than other listed haz-ardous wastes.
Toxic hazardous wastes are defined as containing chem-icals posing substantial hazards to human health or theenvironment when improperly treated, stored, transported,or disposed of. Scientific studies show that they have toxic,carcinogenic, mutagenic, or teratogenic effects on humansor other life forms.
The environmental engineer needs to understand whena waste becomes a hazardous waste, since this changeinitiates the regulatory process. A solid waste that is notexcluded from regulation (see previous sections) becomesa hazardous waste when any of the following events occur:
• For listed wastes—when the waste first meets thelisting description
• For mixtures of solid waste and one or more listedwastes—when a listed waste is first added to themixture
• For other wastes—when the waste first exhibitsany of the four characteristics of a hazardouswaste
After a waste is labeled hazardous, it generally remains ahazardous waste forever. Some characteristic hazardouswastes may be declared no longer hazardous if they ceaseto exhibit any characteristics of a hazardous waste.However, wastes that exhibit a characteristic at the pointof generation may still be considered hazardous even ifthey no longer exhibit the characteristic at the point ofland disposal.
Figures 11.1.2 and 11.1.3 summarize the process usedto determine whether a solid waste is a hazardous wasteand whether it is subject to special provisions for certainhazardous wastes.
EXCLUSIONS
The regulations allow several exemptions and exclusionswhen determining whether a waste is hazardous. These ex-clusions center on recycled wastes and several large-vol-
©1999 CRC Press LLC
YES
NO
Is the solid wasteexcluded from regulation
under §261.4(b)?
Is the solid waste listed inPart 261, Subpart D, or is it
a mixture that contains a wastelisted in Subpart D?
Has the waste or mixturebeen excluded from the lists in
Subpart D or §261.3 in accordancewith §§260.20 and 260.22?
Does the waste exhibitany of the characteristics
specified in Part 261,Subpart C?
THE WASTE ISSUBJECT TO CONTROL
UNDER SUBTITLE D(if land disposed)
THE WASTE ISA HAZARDOUS WASTE
(see Figure 12.1)
YES
NO
YES NO
NO
YES
YES
YES
Is it generated by asmall quantity generatoras defined in §261.5?
Is it intendedto be legitimately and
beneficially used, re-used,recycled, or reclaimed?
Is it a sludge or is it listed in Part 261, Subpart Dor is it a mixture containinga waste listed in Part 261,
Subpart D?
IT IS SUBJECT TO THE FOLLOWINGREQUIREMENTS WITH RESPECT TOITS TRANSPORTATION OR STORAGE: —Notification under Section 3010 —Parts 262 and 263 —Parts 264, Subparts A through E —Part 265, Subparts A through E, and G,H,I,J,& L —Parts 270 and 124
It is subject to thespecial requirements of §261.5
Therefore, it must beintended to be discarded.IT IS SUBJECT TO THE
SUBTITLE C REGULATIONS
IT IS NOT SUBJECT TOREGULATION UNDER
SUBTITLE C
THE WASTE IS AHAZARDOUS WASTE
(see Figure 12.2)
NO
YES
YES
NO
NO
FIG. 11.1.2 Definition of a hazardous waste.
FIG. 11.1.3 Special provisions for certain hazardous waste.

ume or special-interest wastes. Wastes specifically excludedfrom regulation include industrial wastewater discharges,nuclear materials, fly ash, mining overburden, drilling flu-ids, and ore processing wastes. A major exemption is alsogranted to small-quantity generators of hazardous wastes(i.e., those generating less than 100 kg/month [220lb/month] of hazardous wastes).
The exclusions cover materials that are not solid wastes,solid wastes that are not hazardous wastes, hazardouswastes that are exempt from certain regulations, and sam-ples associated with chemical and physical testing or treata-bility studies. For regulatory purposes, the following arenot considered solid wastes:
Domestic sewage, or any mixture of domestic sewage andother wastes, passing through a sewer system to a pub-licly-owned treatment works
Industrial wastewater point discharges regulated underSection 402 of the Clean Water Act
Irrigation return flowsSource, special nuclear, or by-product material as defined
by the Atomic Energy Act of 1954, as amendedMaterials subject to in situ mining techniques but not re-
moved from the ground as part of the extraction processPulping liquids that are reclaimed in a pulping liquor re-
covery furnace and reused in the pulping processSpent sulfuric acid used to produce virgin sulfuric acidSecondary materials that are reclaimed and, with certain
restrictions, returned to their original generationprocess(es) and reused in the production process
Spent wood-preserving solutions that are reclaimed andreused for their original intended purpose
Wastewaters from the wood-preserving process that arereclaimed and reused to treat wood
Listed hazardous wastes from coking and coke by-prod-ucts processes that are hazardous only because they ex-hibit toxicity characteristics when, after generation, theyare (1) recycled to coke ovens, (2) recycled to the tar re-covery process as a feedstock to produce coal tar, or (3)mixed with coal tar prior to the tar’s sale or refining
Nonwastewater splash condenser dross residue resultingfrom treating emission control dust and sludge in high-temperature metals-recovery units in primary steel pro-duction (a listed waste)
The following solid wastes are not considered hazardousby the RCRA regulations:
Household wastes, including garbage, trash, and sanitarywastes in septic tanks
Solid wastes generated in growing and harvesting agricul-tural crops or raising animals; this includes animal ma-nures that are returned to the soil as fertilizers
Mining overburden returned to the mine siteFly ash waste, bottom ash waste, slag waste, and flue gas
emission control waste, generated from coal or otherfossil fuels combustion
Drilling fluids, produced waters, and other wastes associ-ated with the exploration, development, or productionof crude oil, natural gas, or geothermal energy
Waste that could be considered hazardous based on thepresence of chromium if it can be demonstrated thatthe chromium is not in the hexavalent state. Such ademonstration is based on information showing onlytrivalent chromium in the processing and handling ofthe waste in a non-oxidizing environment, or a specificlist of waste sources known to contain only trivalentchromium.
Solid waste from extracting, beneficiating, and processingof ores and minerals
Cement kiln dust waste, unless the kiln is used to burn orprocess hazardous waste
Before an environmental engineer concludes a company orconcern is not subject to regulation under RCRA, the en-gineer should confirm this conclusion via the RCRAHotline (1-800-424-9346). Preferably, the decision shouldalso be confirmed by an attorney or other qualified pro-fessional familiar with RCRA regulations.
SMALL-QUANTITY GENERATORS (40CFR §261.5)
A small-quantity generator is conditionally exempt if itgenerates no more than 100 kg of hazardous waste in acalendar month. In determining the quantity of hazardouswaste generated in a month, the generator does not needto include hazardous waste removed from on-site storage,only waste generated that month. Also excluded is wastethat is counted more than once. This includes hazardouswaste produced by on-site treatment of already-countedhazardous waste, and spent materials that are generated,reclaimed, and subsequently reused on site, so long as suchspent materials have been counted once.
The limits on generated quantities of hazardous wasteare different for acute hazardous waste (P list). The limitis equal to the total of one kg of acute hazardous wasteor a total of 100 kg of any residue or contaminated soil,waste, or other debris resulting from the clean-up of anyspilled acute hazardous wastes.
With exceptions, wastes generated by conditionally ex-empt small-quantity generators are not subject to regula-tion under several parts of RCRA (Parts 262 through 266,268, and Parts 270 and 124 of Chapter 2, and the notifi-cation requirements of section 3010). The primary excep-tion is compliance with section 262.11, hazardous wastedetermination. Hazardous wastes subject to these reducedrequirements may be mixed with nonhazardous wastes andremain conditionally exempt, even though the mixture ex-ceeds quantity limits. However, if solid waste is mixed witha hazardous waste that exceeds the quantity exclusionlevel, the mixture is subject to full regulation. If hazardouswastes are mixed with used oil and this mixture is to be
©1999 CRC Press LLC

burned for energy recovery, the mixture is subject to usedoil management standards (Part 279 of RCRA).
RECYCLABLE MATERIALS (40 CFR§261.6)
Recycled hazardous wastes are known as recyclable ma-terials. These materials remain hazardous, and their iden-tification as recyclable materials does not exempt themfrom regulation. With certain exceptions, recyclable ma-terials are subject to the requirements for generators, trans-porters, and storage facilities. The exceptions are wastesregulated by other sections of the regulations and wastesthat are exempt, including: waste recycled in a mannerconstituting disposal; waste burned for energy recovery inboilers and industrial furnaces; waste from which preciousmetals are reclaimed; or spent lead-acid batteries being re-claimed. Wastes generally exempt from regulation are re-claimed industrial ethyl alcohol, used batteries or cells re-turned to a battery manufacturer for regeneration, scrapmetal, and materials generated in a petroleum refining fa-cility. Recycled used oil is subject to used oil managementstandards (Part 279 of RCRA).
CONTAINER RESIDUE (40 CFR §261.7)
Any hazardous waste remaining in a container or an in-ner liner removed from an empty container is not subjectto regulation. The problem is determining whether a con-
tainer is empty or not. RCRA regulations consider a con-tainer empty when all possible wastes are removed usingcommon methods for that type of container, and no morethan an inch (2.5 cm) of residue remains on the bottom ofthe container or liner. Alternately, a container with a vol-ume of 110 gal or less can be considered empty if no morethan 3% of the capacity, by weight, remains in the con-tainer or liner. Larger containers are considered emptywhen no more than 0.3% of capacity, by weight, remainsin the container or liner. If the material in the containerwas a compressed gas, the container is considered emptywhen its pressure is reduced to atmospheric pressure.
Regarding acute hazardous waste (P list), the test for anempty container is much more stringent. The container orinner liner must be triple-rinsed using a solvent capable ofremoving the commercial chemical product or manufac-turing chemical intermediate. Alternative cleaning methodscan be used if they are demonstrated to be equivalent to orbetter than triple rinsing. Of course, a container can alsobe considered empty if a contaminated liner is removed.
—Mary A. EvansWilliam C. Zegel
ReferencesCode of Federal Regulations. (1 July 1987): Title 40, sec. 261.U.S. Environmental Protection Agency (EPA). 1986. RCRA orientation
manual.” Office of Solid Waste, Washington, D.C.
©1999 CRC Press LLC
11.2HAZARDOUS WASTE SOURCES
The reported quantities of hazardous waste generated inthe U.S. remained in the range of 250–270 million metrictn per year through most of the 1980s. Figure 11.2.1 in-dicates which industrial sectors generate these wastes. Themajority of hazardous waste is generated by the chemicalmanufacturing, petroleum, and coal processing industries.As Figure 11.2.2 shows, waste generation is not broadlydistributed throughout these industries; instead, a fewdozen facilities account for most waste generation. Whileit is striking that a few dozen manufacturing facilities gen-erate most of the country’s hazardous wastes, these wastegeneration rates must be viewed in context. Figure 11.2.3shows that 250–270 million tn of hazardous waste gener-ated annually are over 90% wastewater. Thus, the rate ofgeneration of hazardous constituents in the waste is prob-
��������
Chemical Products
Petroleum/Coal
Electrical/Gas/Sanitary
Primary Metals
Machinery
Other���������
���
FIG. 11.2.1. Hazardous waste generation in 1986, classifiedby industry sector. (Reprinted from U.S. EnvironmentalProtection Agency (EPA), 1988, 1986 national survey of haz-ardous waste treatment, storage, disposal and recycle facilities,EPA/530-SW-88/035.)

ably on the order of 10 to 100 million tons per year. Inrelation to the 3001 million tons of commodity chemicalsproduced annually and the 1000 million tons of petroleumrefined annually (C&E News 1991), the mass of hazardousconstituents in waste is probably less than 5% of all chem-ical production.
Examples of basic industries and types of hazardouswastes produced are listed in Table 11.2.1, illustrating the
©1999 CRC Press LLC
FIG. 11.2.3 Flow of industrial hazardous waste treatment operations (1986 data in tn per yr).
Top 50 Units
Top 40 Units
Top 30 Units
Top 20 Units
Top 10 Units�����
��
100
80
60
40
20
0 ���
������
��
���
���
��
Per
cent
age
of H
azar
dous
Was
te M
anag
ed
FIG. 11.2.2 Percentages of hazardous waste managed in the50 largest facilities in 1986. (Reprinted from U.S. EPA, 1988.)
U.SIndustry
(Aggregated)
1.18
1.44
0.96
1.44
1.09
40
488
0.3
0.2
0.3
Air Emissions - 1
Discharge
0.77
0.38
3.17
0.68
28.73
Land Treatment
Solidification
FuelBlending
ReuseAs Fuel
SolventRecovery
MetalsRecovery
OtherRecovery
Incineration
Landfills
Waste Piles
WastewaterTreatment
SurfaceImpoundments
UndergroundInjection
Discharge
wide range and complexity of the wastes. However, thesefew examples do not adequately suggest the numbers andkinds of hazardous chemical constituents in hazardouswastes to be managed. There are approximately 750 listedwastes in 40 CFR Part 261, and countless more charac-teristic wastes. The intensity of industrial competition con-stantly engenders the introduction of new products, thuswastes are generated at an awesome pace.
Hazardous Waste from SpecificSources (40 CFR §261.32)The following solid wastes are listed as hazardous wastesfrom a specific source unless they meet an exclusion. Exceptfor K044, K045, and K047, which are reactive wastes, theyare toxic wastes.
WOOD PRESERVATION
Bottom sediment sludge from wastewater treatment inwood-preserving processes using creosote or pentachloro-phenol (K001) is a hazardous waste.

©1999 CRC Press LLC
TABLE 11.2.1 TYPES OF HAZARDOUS WASTE
Industry Wastes Produced
Chemical Manufacturing • Spent solvents and still bottomsWhite spirits, kerosene, benzene, xylene, ethyl benzene, toluene, isopropanol, toluene diisocyanate, ethanol, acetone, methyl ethyl ketone, tetrahydrofuran, methylene chloride, 1,1,1-trichloroethane, trichloroethylene
• Ignitable wastes not otherwise specified (NOS)• Strong acid/alkaline wastes
Ammonium hydroxide, hydrobromic acid, hydrochloric acid, potassium hydroxide,nitric acid, sulfuric acid, chromic acid, phosphoric acid
• Other reactive wastesSodium permanganate, organic peroxides, sodium perchlorate, potassium perchlorate,potassium permanganate, hypochlorite, potassium sulfide, sodium sulfide
• Emission control dusts and sludges• Spent catalysts
Construction • Ignitable paint wastesEthylene dichloride, benzene, toluene, ethyl benzene, methyl isobutyl ketone, methyl ethyl ketone, chlorobenzene
• Ignitable wastes not otherwise specified (NOS)• Spent solvents
Methyl chloride, carbon tetrachloride, trichlorotrifluoroethane, toluene, xylene,kerosene, mineral spirits, acetone
• Strong acid/alkaline wastesAmmonium hydroxide, hydrobromic acid, hydrochloric acid, hydrofluoric acid, nitric acid, phosphoric acid, potassium hydroxide, sodium hydroxide, sulfuric acid
Metal Manufacturing • Spent solvents and solvent still bottomsTetrachloroethylene, trichloroethylene, methylene chloride, 1,1,1-trichloroethane,carbon tetrachloride, toluene, benzene, trichlorofluoroethane, chloroform,trichlorofluoromethane, acetone, dichlorobenze, xylene, kerosene, white spirits, butyl alcohol
• Strong acid/alkaline wastesAmmonium hydroxide, hydrobromic acid, hydrochloric acid, hydrofluoric acid, nitric acid, phosphoric acid, nitrates, potassium hydroxide, sodium hydroxide, sulfuric acid, perchloric acid, acetic acid
• Spent plating wastes• Heavy metal wastewater sludges• Cyanide wastes• Ignitable wastes not otherwise specified (NOS)• Other reactive wastes
Acetyl chloride, chromic acid, sulfides, hypochlorites, organic peroxides, perchlorates,permanganates
• Used oilsPaper Industry • Halogenated solvents
Carbon tetrachloride, methylene chloride, tetrachloroethylene, trichloroethylene,1,1,1-trichloroethane, mixed spent halogenated solvents
• Corrosive wastesCorrosive liquids, corrosive solids, ammonium hydroxide, hydrobromic acid,hydrochloric acid, hydrofluoric acid, nitric acid, phosphoric acid, potassium hydroxide,sodium hydroxide, sulfuric acid
• Paint wastesCombustible liquid, flammable liquid, ethylene dichloride, chlorobenzene, methyl ethyl ketone, paint waste with heavy metals
• SolventsPetroleum distillates
Source: Reprinted from U.S. Environmental Protection Agency (EPA), Does your business produce hazardous wastes? (Office of Solid Waste and EmergencyResponse, (EPA/530-SW-010, Washington, D.C.)

©1999 CRC Press LLC
INORGANIC PIGMENTS
Hazardous wastes include wastewater treatment sludgefrom the production of various metal-based pigments:chrome yellow and orange (K002), molybdate orange(K003), zinc yellow (K004), chrome green from the sol-vent recovery column in the production of toluene di-iosocyanate via phosgenation of toluenediamine (K005),anhydrous and hydrated chrome-oxide green (K006), ironblue (K008), and oven residue from the production ofchrome-oxide green (K008).
ORGANIC CHEMICALS
Numerous hazardous wastes occur in organic chemical pro-duction facilities. In the production of acetaldehyde fromethylene, distillation bottoms (K009) and distillation sidecuts (K010) are hazardous wastes. In acrylonitrile produc-tion, the bottom streams from the wastewater stripper(K011), the acetonitrile column (K013), and the acetonitrilepurification column (K014) are hazardous wastes. In 1,1,1-trichlorethane production, hazardous wastes include spentcatalyst from the hydrochlorinator reactor (K028), wastefrom the product steam stripper (K029), distillation bottoms(K095), and heavy ends from the heavy end column (K096).
In the production of toluenediamine via hydrogenationof dinitrotoluene, hazardous wastes are generated in reac-tion by-product water from the drying column (K112) andcondensed liquid light ends (K113), vicinals (K114), andheavy ends (K115) from the purification of toluenediamine.
In the production of ethylene dibromide via bromina-tion of ethylene, hazardous wastes result from reactor ventgas scrubber wastewater (K117), spent adsorbent solids(K118), and still bottoms (K136) from purification.
Hazardous wastes are found in heavy ends or still bot-toms from benzyl chloride distillation (K015), ethylenedichloride in ethylene dichloride production (K019), andvinyl chloride in vinyl chloride monomer production(K020). Heavy ends or distillation residues from carbontetrachloride production (K016); the purification column inthe production of epichlorohydrin (K017); the fractiona-tion column in ethyl chloride production (K018); the pro-duction of phenol/acetone from cumene (K022); the pro-duction of phthalic anhydride from naphthalene (K024);the production of phthalic anhydride from ortho-xylene(K094); the production of nitro-benzene by the nitrationof benzene (K025); the combined production oftrichloroethylene and perchloroethylene (K030); the pro-duction of aniline (K083); and the production of chloroben-zenes (K085) are also hazardous wastes.
Other sources of hazardous wastes include distillationlight ends from the production of phthalic anhydride fromortho-xylene (K093) or naphthalene (K024); aqueousspent antimony catalyst waste from fluoromethanes pro-duction (K021); stripping still tails from the production ofmethyl ethyl pyridines (K026); centrifuge and distillation
residues from toluene diisocyanate production (K027);process residues from aniline extraction in aniline pro-duction (K103); combined wastewater streams generatedfrom nitrobenzene/aniline production (K104); the sepa-rated aqueous stream from the reactor product washingstep in the production of chlorobenzenes (K105); and theorganic condensate from the solvent recovery column inthe production of toluene diisocyanate via phosgenationof toluenediamine.
INORGANIC CHEMICALS
Chlorinated hydrocarbon waste from the purification stepof the diaphragm cell process using graphite anodes(K073); wastewater treatment sludge from the mercury cellprocess (K106); and brine purification muds from the mer-cury cell process where separately prepurified brine is notused (K071) are hazardous wastes related to the produc-tion of chlorine.
PESTICIDES
Hazardous wastes are generated in the production of ninepesticides: MSMA and cacodylic acid, chlordane, creosote,disulfoton, phorate, toxaphene, 2,4,5–T, 2,4–D, and eth-ylenebisdithiocarbamic acid and its salts. In MSMA andcacodylic acid production, hazardous waste is generatedas by-product salts (K031). In chlordane production, haz-ardous wastes include: wastewater treatment sludge(K032); wastewater and scrub water from the chlorinationof cyclopentadiene (K033); filter solids from the filtrationof hexachlorocyclopentadiene (K034); and vacuum strip-per discharge from the chlordane chlorinator (K097).Wastewater treatment sludges generated in creosote pro-duction (K035) are also defined as hazardous waste.Hazardous wastes from the production of disulfoton arestill bottoms from toluene reclamation distillation (K036),and wastewater treatment sludges (K037). Phorate pro-duction generates hazardous wastes from washing andstripping wastewater (K038), wastewater treatment sludge(K040), and filter cake from filtration of diethylphospho-rodithioic acid (K039).
Wastewater treatment sludge (K041) and untreatedprocess wastewater (K098) from toxaphene productionand heavy ends, or distillation residues from tetra-chlorobenzene in 2,4,5–T production (K042) are haz-ardous wastes. Similarly, 2,6–dichlorophenol waste(K043) and untreated wastewater (K099) from 2,4–D pro-duction are hazardous wastes.
Hazardous wastes from the production of ethylenebis-dithiocarbamic acid and its salts are: process wastewaters(including supernates, filtrates, and washwaters) (K123);reactor vent scrubber water (K124); filtration, evapora-tion, and centrifugation solids (K125); and baghouse dustand floor sweepings in milling and packaging operations(K126).
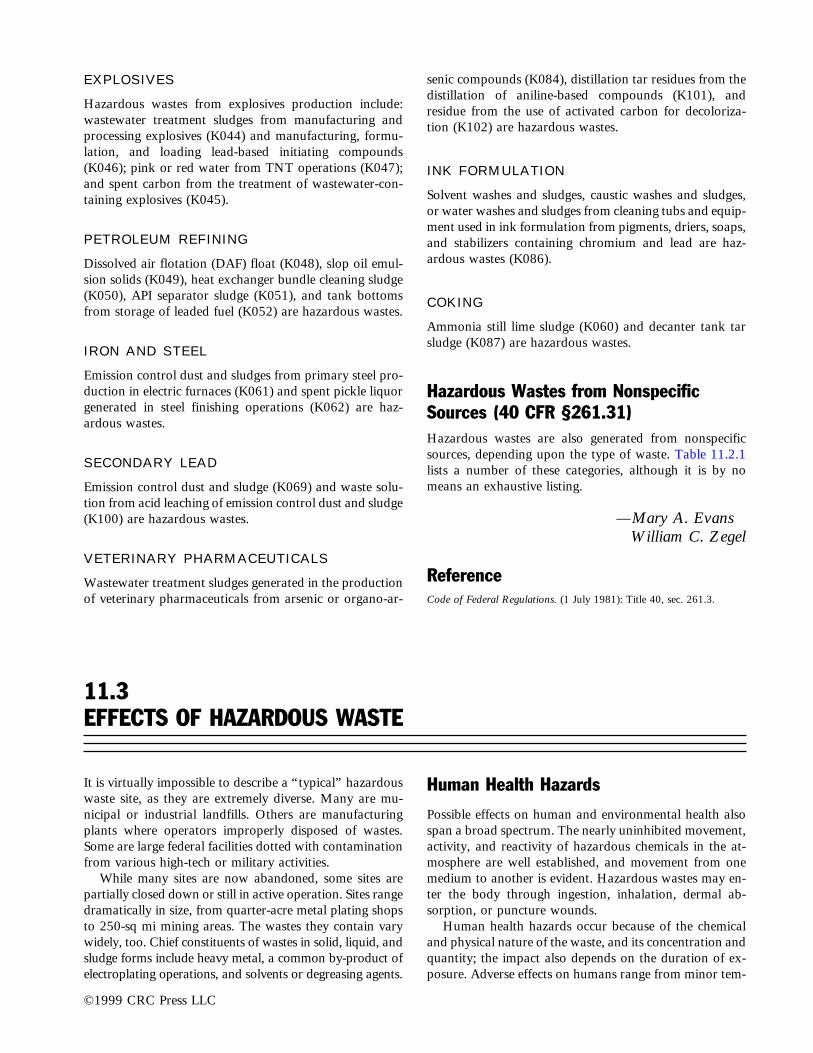
EXPLOSIVES
Hazardous wastes from explosives production include:wastewater treatment sludges from manufacturing andprocessing explosives (K044) and manufacturing, formu-lation, and loading lead-based initiating compounds(K046); pink or red water from TNT operations (K047);and spent carbon from the treatment of wastewater-con-taining explosives (K045).
PETROLEUM REFINING
Dissolved air flotation (DAF) float (K048), slop oil emul-sion solids (K049), heat exchanger bundle cleaning sludge(K050), API separator sludge (K051), and tank bottomsfrom storage of leaded fuel (K052) are hazardous wastes.
IRON AND STEEL
Emission control dust and sludges from primary steel pro-duction in electric furnaces (K061) and spent pickle liquorgenerated in steel finishing operations (K062) are haz-ardous wastes.
SECONDARY LEAD
Emission control dust and sludge (K069) and waste solu-tion from acid leaching of emission control dust and sludge(K100) are hazardous wastes.
VETERINARY PHARMACEUTICALS
Wastewater treatment sludges generated in the productionof veterinary pharmaceuticals from arsenic or organo-ar-
senic compounds (K084), distillation tar residues from thedistillation of aniline-based compounds (K101), andresidue from the use of activated carbon for decoloriza-tion (K102) are hazardous wastes.
INK FORMULATION
Solvent washes and sludges, caustic washes and sludges,or water washes and sludges from cleaning tubs and equip-ment used in ink formulation from pigments, driers, soaps,and stabilizers containing chromium and lead are haz-ardous wastes (K086).
COKING
Ammonia still lime sludge (K060) and decanter tank tarsludge (K087) are hazardous wastes.
Hazardous Wastes from NonspecificSources (40 CFR §261.31)Hazardous wastes are also generated from nonspecificsources, depending upon the type of waste. Table 11.2.1lists a number of these categories, although it is by nomeans an exhaustive listing.
—Mary A. EvansWilliam C. Zegel
ReferenceCode of Federal Regulations. (1 July 1981): Title 40, sec. 261.3.
©1999 CRC Press LLC
It is virtually impossible to describe a “typical” hazardouswaste site, as they are extremely diverse. Many are mu-nicipal or industrial landfills. Others are manufacturingplants where operators improperly disposed of wastes.Some are large federal facilities dotted with contaminationfrom various high-tech or military activities.
While many sites are now abandoned, some sites arepartially closed down or still in active operation. Sites rangedramatically in size, from quarter-acre metal plating shopsto 250-sq mi mining areas. The wastes they contain varywidely, too. Chief constituents of wastes in solid, liquid, andsludge forms include heavy metal, a common by-product ofelectroplating operations, and solvents or degreasing agents.
Human Health Hazards
Possible effects on human and environmental health alsospan a broad spectrum. The nearly uninhibited movement,activity, and reactivity of hazardous chemicals in the at-mosphere are well established, and movement from onemedium to another is evident. Hazardous wastes may en-ter the body through ingestion, inhalation, dermal ab-sorption, or puncture wounds.
Human health hazards occur because of the chemicaland physical nature of the waste, and its concentration andquantity; the impact also depends on the duration of ex-posure. Adverse effects on humans range from minor tem-
11.3EFFECTS OF HAZARDOUS WASTE

©1999 CRC Press LLC
TABLE 11.3.1 HEALTH EFFECTS OF SELECTED HAZARDOUS SUBSTANCES
Chemical Source Health Effects
Pesticides
DDT Insecticides Cancer; damage to liver, embryos, bird eggs
BHC Insecticides Cancer, embryo damage
Petrochemicals
BENZENE Solvents, pharmaceuticals Headaches, nausea, loss of muscle coordination, leukemia,and detergents damage to bone marrow
VINYL CHLORIDE Plastics Lung and liver cancer, depression of central nervoussystem, suspected embryotoxin
Other OrganicChemicals
DIOXIN Herbicides, waste incineration Cancer, birth defects, skin disease
PCBs Electronics, hydraulic fluid, Skin damage, possible gastro-intestinal damage,fluorescent lights possibly cancer-causing
Heavy Metals
LEAD Paint, gasoline Neurotoxic; causes headaches, irritability, mental impairmentin children; brain, liver, and kidney damage
CADMIUM Zinc, batteries, fertilizer Cancer in animals, damage to liver and kidneys
Source: World Resources Institute and International Institute for Environment and Development, 1987; World Resources 1987, (New York, N.Y.: Basic Books, pp.205–06.
TABLE 11.3.2 SITE SAFETY PLANS
• Name key personnel and alternates responsible for site safety.• Describe the risks associated with each operation conducted.• Confirm that personnel are adequately trained to perform their job responsibilities and to handle the specific hazardous situations
they may encounter.• Describe the protective clothing and equipment to be worn by personnel during various site operations.• Describe any site-specific medical surveillance requirements.• Describe the program for periodic air monitoring, personnel monitoring, and environmental sampling, if needed.• Describe the actions to be taken to mitigate existing hazards (e.g., containment of contaminated materials) to make the work en-
vironment less hazardous.• Define site control measures and include a site map.• Establish decontamination procedures for personnel and equipment.• Set forth the site’s standard operating procedures for those activities that can be standardized, and where a checklist can be used.• Set forth a contingency plan for safe and effective response to emergencies.
porary physical irritation, dizziness, headaches, and nauseato long-term disorders, cancer or death. For example, theorganic solvent carbon tetrachloride (CCl4) is a central nervesystem depressant as well as an irritant and can cause ir-reversible liver or kidney damage. Table 11.3.1 shows thepotential effects of selected hazardous substances.
Site SafetyTransportation spills and other industrial process or stor-age accidents account for some hazardous waste releases.Such releases can result in fires, explosions, toxic vapors,and contamination of groundwater used for drinking.
Danger arises from improper handling, storage, and dis-posal practices (refer to Section 11.11 on Treatment,Storage, and Disposal Requirements). At hazardous wastesites, fires and explosions may result from investigative orremedial activities such as mixing incompatible contentsof drums or from introduction of an ignition source, suchas a spark from equipment.
A site safety plan is needed to establish policies andprocedures for protecting workers and personnel duringclean-up and day-to-day waste-handling activities. Theminimum contents of a site safety plan are listed in Table11.3.2.

©1999 CRC Press LLC
TABLE 11.3.3 ENVIRONMENTAL PERFORMANCE GUIDELINES
Prevention of adverse effects on air quality considering1. Volume and physical and chemical characteristics of facility waste, including potential for volatilization and wind dispersal2. Existing quality of the air, including other sources of contamination and their cumulative impact on the air3. Potential for health risks caused by human exposure to waste constituents4. Potential damage to wildlife, crops, vegetation, and physical structures caused by exposure to waste constituents5. Persistence and permanence of the potential adverse effects
Prevention of adverse effects on surface water quality considering1. Volume and physical and chemical characteristics of facility waste2. Hydrogeological characteristics of the facility and surrounding land, including topography of the area around the facility3. Quantity, quality, and directions of groundwater flow4. Patterns of rainfall in the region5. Proximity of facility to surface waters6. Uses of nearby surface waters and any water quality standards established for those surface waters7. Existing quality of surface water, including other sources of contamination and their cumulative impact on surface water8. Potential for health risks caused by human exposure to waste constituents9. Potential damage to wildlife, crops, vegetation, and physical structures caused by exposure to waste constituents
10. Persistence and permanence of the potential adverse effects
Prevention of adverse effects on groundwater quality considering1. Volume and physical and chemical characteristics of the waste in the facility, including its potential for migration through soil
or through synthetic liner materials2. Geologic characteristics of the facility and surrounding land3. Patterns of land use in the region4. Potential for migration of waste constituents into subsurface physical structures5. Potential for migration of waste constituents into the root zone of food-chain crops and other vegetation6. Potential for health risks through human exposure to waste constituents7. Potential damage to wildlife, crops, vegetation, and physical structures through exposure to waste constituents8. Persistence and permanence of potential adverse effects
Particulates, Combustion Products Particulates, Combustion Products
Volatile Reaction
Products
Volatile ComponentsDiffuse Through
Soil Pores Products
Volatile Decomposition
Volatile
Reactive Biodegradable
Water-reactive
FiresExplosions
SpontaneousCombustion
Water-Soluble
Reaction Products
Soluble
Decomposition Products
Migrates to Atmosphere
Migrates Laterally UndergroundPrecipitation
Surface WaterGroundwater
Chemical Reactionswith Other
Waste Materials
Aerobic and/orAnaerobic
Decomposition
Soluble ComponentsInfiltrated Water from
Leachate
Travels to Groundwateror Seeps to Surface
Waste Carried asParticulate Matterin Surface Flows
W ASTE
FIG. 11.3.1 Initial transport processes at waste disposal sites (EPA).
©1999 CRC Press LLC
Characterization, Sampling,and Analysis
11.4HAZARDOUS WASTE CHARACTERIZATION
CriteriaThe EPA applies two criteria in selecting four characteris-tics as inherently hazardous in any substance:
The characteristics must be listed in terms of physical,chemical, or other properties causing the waste to meetthe definition of a hazardous waste in the act; and
The properties defining the characteristics must be mea-surable by standardized, available testing protocols.
The second criterion was adopted because generatorshave the primary responsibility for determining whethera solid waste exhibits any of the characteristics. EPAregulation writers believed that unless generators wereprovided with widely available and uncomplicatedmethods for determining whether their wastes exhibitedthe characteristics, the identification system would notwork (U.S. EPA 1990).
Because of this second criterion, the EPA did not addcarcinogenicity, mutagenicity, bioaccumulation potential,or phytotoxicity to the characteristics. The EPA consid-ered the available protocols for measuring these charac-teristics either insufficiently developed, too complex, or toohighly dependent on skilled personnel and professionalequipment. In addition, given the current knowledge ofsuch characteristics, the EPA could not confidently definethe numerical threshold levels where characteristic wasteswould present a substantial hazard (U.S. EPA 1990).
CharacteristicsAs testing protocols become accepted and confidence insetting minimum thresholds increases, more characteristicsmay be added. To date, waste properties exhibiting anyor all of the existing characteristics are defined in 40 CFR§261.20–261.24.
Environmental ContaminationHazardous waste disposers need to understand the poten-tial toxic effects of these wastes and realize how strictlythe wastes must be contained. Dangerous chemicals oftenmigrate from uncontrolled sites, percolating from holdingponds and pits into underlying groundwater, then flowinginto lakes, streams, and wetlands. Produce and livestockin turn become contaminated, then enter the food chain.Hazardous chemicals then build up, or bioaccumulate,when plants, animals, and people consume contaminatedfood and water.
Most groundwater originates as surface water. Greatquantities of land-deposited hazardous wastes evaporateinto the atmosphere, runoff to surface waters, then per-colate to groundwaters (Figure 11.3.1). Atmospheric andsurface water waste releases commingle with other releasesor are lost to natural processes, but groundwater conta-mination may remain highly concentrated, relatively lo-
calized, and persistent for decades or centuries. Althoughcurrent quantities of waste are being reduced, any addi-tional releases together with previously released materialswill continue contaminating aquifers in many areas, andmany groundwater supplies are now impaired.
Table 11.3.3 presents EPA guidelines for hazardoushandling facilities performance with respect to humanhealth and the environment.
—David H.F. Liu
ReferencesU.S. Environmental Protection Agency (U.S. EPA). 1981. Interim stan-
dard for owners and operators of new hazardous waste land disposalfacilities. Code of Federal Regulations. Title 40, Part 267.Washington, D.C.: U.S. Government Printing Office.
———. 1985. Protecting health and safety at hazardous waste sites: anoverview. Technology Transfer, EPA 625/9–25/006, Cincinnati, OH.

CHARACTERISTIC OF IGNITABILITY
Ignitability is the characteristic used to define as hazardousthose wastes that could cause a fire during transport, stor-age, or disposal. Examples of ignitable wastes includewaste oils and used solvents.
A waste exhibits the characteristics of ignitability if arepresentative sample of the waste has any of the follow-ing properties:
1. It is a liquid, other than an aqueous solution con-taining less than 24% alcohol by volume, and hasflash point less than 60°C (140°F), as determinedby a Pensky-Martens Closed Cup Tester (using thetest method specified in ASTM Standard D-93-79or D-93-80) or by a Setaflash Closed Cup Tester(using the test method specified in ASTM StandardD-3278-78).
2. It is not a liquid and is capable, under standard tem-perature and pressure, of causing fire through friction,absorption of moisture, or spontaneous chemicalchanges and, when ignited, burns so vigorously and per-sistently that it creates a hazard.
3. It is an ignitable compressed gas as defined in the 49Code of Federal Regulations 173.300 DOT regulations.
4. It is an oxidizer as defined in the 49 Code of FederalRegulations 173.151 DOT regulations.
A waste that exhibits the characteristic of ignitabilitybut is not listed as a hazardous waste in Subpart D ofRCRA has the EPA hazardous waste number of D001.
CHARACTERISTIC OF CORROSIVITY
Corrosivity, as indicated by pH, was chosen as an identi-fying characteristic of a hazardous waste because wasteswith high or low pH can react dangerously with otherwastes or cause toxic contaminants to migrate from cer-tain wastes. Examples of corrosive wastes include acidicwastes and used pickle liquor from steel manufacture. Steelcorrosion is a prime indicator of a hazardous waste sincewastes capable of corroding steel can escape from drumsand liberate other wastes.
A waste exhibits the characteristic of corrosivity if arepresentative sample of the waste has either of the fol-lowing properties:
1. It is aqueous and has a pH less than or equal to 2 orgreater than or equal to 11.5, as determined by a pHmeter using an EPA test method. The EPA test methodfor pH is specified as Method 5.2 in “Test Methods forthe Evaluation of Solid Waste, Physical/ChemicalMethods.”
2. It is a liquid and corrodes steel (SAE 1020) at a rategreater than 6.35 mm (0.250 inch) per year at a testtemperature of 55°C (130°F), as determined by the testmethod specified in NACE (National Association of
Corrosion Engineers) Standard TM-01-69 and stan-dardized in “Test Methods for the Evaluation of SolidWaste, Physical/Chemical Methods.”
A waste that exhibits the characteristic of corrosivitybut is not listed as a hazardous waste in Subpart D hasthe EPA hazardous waste number of D002.
CHARACTERISTIC OF REACTIVITY
Reactivity was chosen as an identifying characteristic of ahazardous waste because unstable wastes can pose an ex-plosive problem at any stage of the waste management cy-cle. Examples of reactive wastes include water from TNToperations and used cyanide solvents.
A waste exhibits the characteristic of reactivity if a rep-resentative sample of the waste has any of the followingproperties:
1. It is normally unstable and readily undergoes violentchange without detonating.
2. It reacts violently with water.3. It forms potentially explosive mixtures with water.4. When mixed with water, it generates toxic gases, va-
pors, or fumes in a quantity sufficient to present a dan-ger to human health or the environment.
5. It is a cyanide- or sulfide-bearing waste which, whenexposed to pH conditions between 2 and 11.5, can gen-erate toxic gases, vapors, or fumes in a quantity suffi-cient to present a danger to human health or the envi-ronment.
6. It is capable of detonation or explosive reaction if sub-jected to a strong initiating source or if heated underconfinement.
7. It is readily capable of detonation or explosive decom-position or reaction at standard temperature and pres-sure.
8. It is a forbidden explosive as defined in the 49 Code ofFederal Regulations 173.51, or a Class A explosive asdefined in the 49 Code of Federal Regulations 173.53,or a Class B explosive as defined in the 49 Code ofFederal Regulations 173.88 DOT regulations.
A waste that exhibits the characteristic of reactivity butis not listed as a hazardous waste in Subpart D has theEPA hazardous waste number of D003.
CHARACTERISTIC OF TOXICITY
The test, toxicity characteristic leaching procedure (TCLP),is designed to identify wastes likely to leach hazardous con-centrations of particular toxic constitutents into thegroundwater as a result of improper management. Duringthe TCLP, constituents are extracted from the waste tostimulate the leaching actions that occur in landfills. If theconcentration of the toxic constituent exceeds the regula-tory limit, the waste is classified as hazardous.
©1999 CRC Press LLC

If the extract from a representative waste sample con-tains any of the contaminants listed in Table 11.4.1 at aconcentration equal to or greater than the respective valuegiven, the waste exhibits the toxicity characteristic. Wherethe waste contains less than 0.5 percent filterable solids,the waste itself is considered to be the extract. A wastethat exhibits the toxicity characteristic but is not a listedhazardous waste has the EPA hazardous waste numberspecified in Table 11.4.1. The TCLP test replaced the EPtoxicity test in September 1990 and added 25 organic com-pounds to the eight metals and six pesticides that weresubject to the EP toxicity test.
Specific CompoundsInformation about waste is needed to evaluate the healtheffects, determine the best method of handling, and eval-uate methods of storage, treatment or disposal. Items ofinterest include:
• Physical properties such as density or viscosity• Toxicity in water• Permissible exposure limits (PELs) in the air
• Health hazards• Precautions• Controls• Emergency and first aid procedures• Disposal methods
There are a number of references that define the proper-ties of specific compounds (Sax 1984, Sittig 1985, Weiss1986), however, no current source defines the impact ofhazardous mixtures.
—David H.F. Liu
ReferencesSax, N. 1984. Dangerous properties of hazardous materials. 6th ed. New
York, N.Y.: Van Nostrand Reinhold.Sittig, M. 1985. Handbook of toxic and hazardous chemicals and car-
cinogens. 2d ed. Park Ridge, N.J.: Noyes Publications.U.S. Environmental Protection Agency (EPA). 1990. RCRA orientation
manual. Office of Solid Waste. Washington, D.C.Weiss, G. 1986. Hazardous chemical data book. 2d ed. Park Ridge, N.J.:
Noyes Publications.
©1999 CRC Press LLC
TABLE 11.4.1 MAXIMUM CONCENTRATION OF CONTAMINANTS FOR RCRA TOXICITY CHARACTERISTICS
EPA EPAHazardous Maximum Hazardous MaximumWaste Concentration Waste ConcentrationNumber Contaminant (mg/L) Number Contaminant (mg/L)
D004 Arsenica 5.0 D036 Hexachloro-1,3- 0.5D005 Bariuma 100.0 butadieneD019 Benzene 0.5 D037 Hexachloroethane 3.0D006 Cadmiuma 1.0 D008 Leada 5.0D022 Carbon tetrachloride 0.5 D013 Lidanea 0.4D023 Chlordane 0.03 D009 Mercurya 0.2D024 Chlorobenzene 100.0 D014 Methoxychlora 10.0D025 Chloroform 6.0 D040 Methyl ethyl ketone 200.0D007 Chromium 5.0 D041 Nitrobenzene 2.0D026 o-Cresol 200.0 D042 Pentachlorophenol 100.0D027 m-Cresol 200.0 D044 Pyridine 5.0D028 p-Cresol 200.0 D010 Selenium 1.0D016 2,4-Da 10.0 D011 Silvera 5.0D030 1,4-Dichloroben- 7.5 D047 Tetrachloroethylene 0.7
zene D015 Toxaphenea 0.5D031 1,2-Dichloroethane 0.5 D052 Trichloroethylene 0.5D032 1,1-Dichloroethy- 0.7 D053 2,4,5-Trichloro- 400.0
lene phenolD033 2,4-Dinitrotoluene 0.13 D054 2,4,6-Trichloro- 2.0D012 Endrina 0.02 phenolD034 Heptachlor (and its 0.008 D017 2,4,5-TP (Silvex)a 1.0
hydroxide) D055 Vinyl chloride 0.2D035 Hexachlorobenzene 0.13
aFormerly EP Toxicity Contaminants.Source: Code of Federal Regulations, Title 40, sec. 261.24.

Safety and data quality are the two major concerns whensampling hazardous waste. Where environmental data arecollected, quality assurance provides the means to deter-mine data quality. This entails planning, documentationand records, audits, and inspections. Data quality is knownwhen there are verifiable and defensible documentationand records associated with sample collection, trans-portation, sample preservation and analysis, and othermanagement activities.
Sampling Equipment and ProceduresSAFETY
Samples must be secured in a manner ensuring the safetyof the sampler, all others working in the area, and the sur-roundings.
If the source and nature of the hazardous waste areknown, the sampler should study the properties of thematerial to determine the necessary safety precautions,including protective clothing and special handling pre-cautions.
If the nature of the hazardous waste is unknown, such asat an abandoned waste disposal site, then the samplershould take additional precautions to prevent directcontact with the hazardous waste. Stored, abandoned,or suspect waste will often be containerized in drumsand tanks. Such containers and materials buried underabandoned waste sites pose special safety problems (DeVera, Simmons, Stephens, Storn, 1980; EPA 1985).Care must be exercised in opening drums or tanks toprevent sudden releases of pressurized materials, fire,explosions, or spillage.
SAMPLING EQUIPMENT
Drums should be opened using a spark-proof brass bungwrench. Drums with bulged heads are particularly dan-gerous. The bulge indicates that the contents are under ex-treme pressure. To sample a bulged drum, a remotely op-erated drum opening device should be used, enabling thesampler to open the drum from a safe distance. Such op-erations should be carried out only by fully trained tech-nicians in full personnel protective gear.
Liquid waste in tanks must be sampled in a mannerthat represents the contents of the tank. The EPA specifiesthat the colawassa sampler is used for such sampling. The
colawassa is a long tube with a stopper at the bottom thatopens or closes using the handle at the top. This deviceenables the sampler to retrieve representative material atany depth within the tank. The colawassa has many short-comings, including the need for completely cleaning it andremoval of all residues between each sampling. This is dif-ficult, and it also creates another batch of hazardous wasteto be managed.
A glass colawassa, which eliminates sample contami-nation by metals and stopper materials, is availablethrough technical and scientific supply houses. In most sit-uations, ordinary glass tubing can be used to obtain a rep-resentative sample, and can be discarded after use.
Bomb samplers that are lowered into a liquid waste con-tainer, then opened at the selected depth, are also usefulin special situations.
Long-handled dippers can be used to sample ponds, im-poundments, large open tanks, or sumps: however thesedevices cannot cope with stratified materials. Makeshiftdevices using tape or other porous or organic materials in-troduce the likelihood of sample contamination.
Dry solid samples may be obtained using a thief or trier,or an augur or dipper. Sampling of process units, liquiddischarges, and atmospheric emissions all require special-ized equipment training.
The EPA has published several guidance documents de-tailing hazardous waste, soil, surface water and ground-water and waste stream sampling (EPA 1985a, 1985b; DeVera et al. 1980; Evans and Schweitzer 1984).
Procedures used or materials contacting the sampleshould not cause gain or loss of pollutants. Sampling equip-ment and sample containers must be fabricated from in-ert materials and must be thoroughly cleaned before use.Equipment that comes into contact with samples to be an-alyzed for organic compounds should be fabricated of (inorder of preference):
• Glass (amber glass for organics; clear glass formetals, oil, cyanide, BOD, TOC, COD, sludges,soil, and solids, and others)
• Teflon (Teflon lid liners should be inserted in capsto prevent contamination normally supplied withbottles)
• Stainless steel• High-grade carbon steel• Polypropylene• Polyethylene (for common ions, such as fluoride,
chloride, and sulfate)
©1999 CRC Press LLC
11.5SAMPLING AND ANALYSIS
Classic commercial analytic schedules require a sample ofmore than 1,500 ml. Commercial field samplers collectsamples of 500 to 1,000 ml. If such volumes are insuffi-cient, multibottle samples can be collected. Special con-tainers may be designed to prolong sample duration.
PROCEDURES
Representative samples should be obtained to determinethe nature of wastes.
If the waste is in liquid form in drums, it should be com-pletely mixed (if this is safe) before sampling, and analiquot should be taken from each container. Within agroup of drums containing similar waste, random sam-pling of 20% of the drums is sufficient to characterizethe wastes. If the sampler is unsure of the drum con-tents, each must be sampled and analyzed.
If the waste source is a manufacturing or waste treatmentprocess solid, composite sampling and analysis are rec-ommended. In such cases, an aliquot is periodically col-lected, composited, and analyzed.
If the solid waste is in a lagoon, abandoned disposal fa-cility, tank, or similar facility, three-dimensional sam-pling is recommended. Although samples collectedthree-dimensionally are sometimes composited, they areusually analyzed individually. This process character-izes the solid waste and aids in determining whether theentire quantity of material is hazardous.
If the source and nature of the material is known, sam-pling and analysis are limited to the parameters of con-cern. When the waste is unknown, a full analysis for129 priority pollutants is often required.
SAMPLE PRESERVATION
Aqueous samples are susceptible to rapid chemical andphysical reactions between the sampling time and analy-sis. Since the time between sampling and analysis could begreater than 24 hours, the following preservation tech-niques are recommended to avoid sample changes result-ing in errors: all samples except metals must be refriger-ated. Refrigeration of samples to 4°C is common infieldwork, and helps stabilize samples by reducing biolog-ical and chemical activity (EPA 1979).
In addition to refrigeration, specific techniques are re-quired for certain parameters (see section 10.9). Thepreservation technique for metals is the addition of nitricacid (diluted 1:1) to adjust the pH to less than 2, whichwill stabilize the sample up to 6 months; for cyanide, theaddition of 6N caustic will adjust the pH to greater than12, and refrigeration to 4°C, which will stabilize the sam-ple for up to 14 days. Little other preservation can be per-formed on solid samples.
Quality Assurance and Quality ControlQuality assurance has emerged significantly during the pastdecade. Permit compliance monitoring, enforcement, andlitigation are now prevalent in the environmental arena.Only documented data of known quality will be sustainedunder litigation. This section focuses on two areas.
SAMPLE CUSTODY
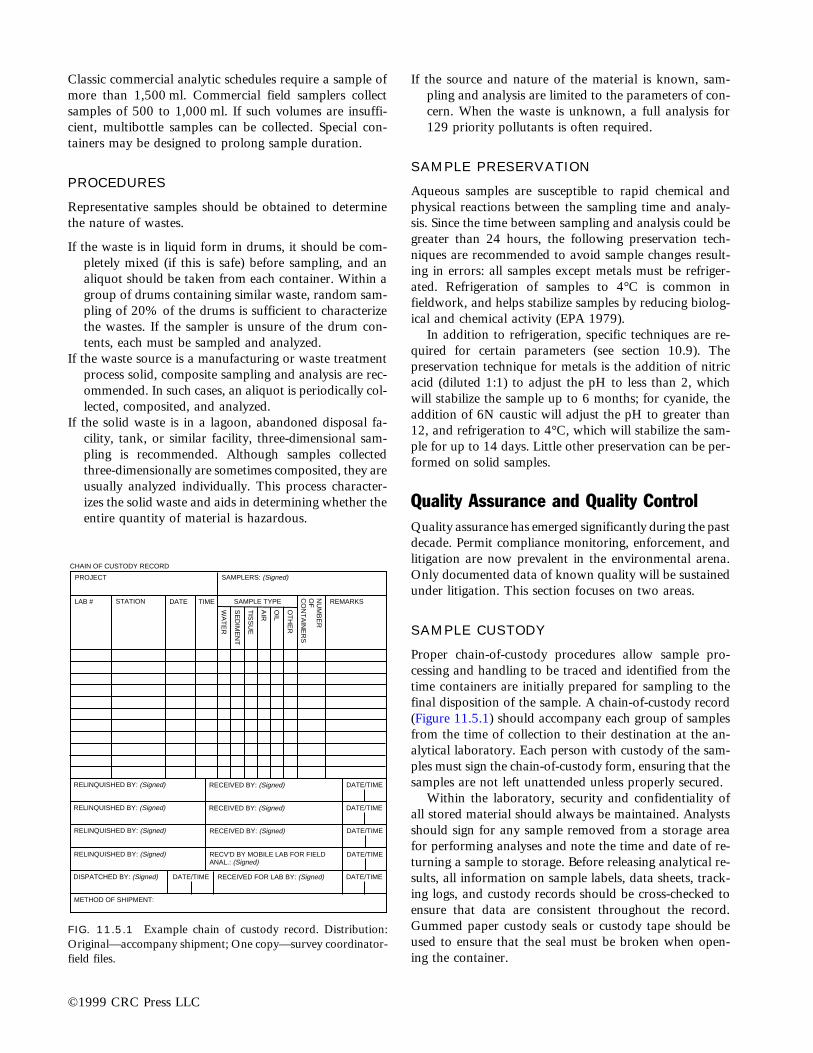
Proper chain-of-custody procedures allow sample pro-cessing and handling to be traced and identified from thetime containers are initially prepared for sampling to thefinal disposition of the sample. A chain-of-custody record(Figure 11.5.1) should accompany each group of samplesfrom the time of collection to their destination at the an-alytical laboratory. Each person with custody of the sam-ples must sign the chain-of-custody form, ensuring that thesamples are not left unattended unless properly secured.
Within the laboratory, security and confidentiality ofall stored material should always be maintained. Analystsshould sign for any sample removed from a storage areafor performing analyses and note the time and date of re-turning a sample to storage. Before releasing analytical re-sults, all information on sample labels, data sheets, track-ing logs, and custody records should be cross-checked toensure that data are consistent throughout the record.Gummed paper custody seals or custody tape should beused to ensure that the seal must be broken when open-ing the container.
©1999 CRC Press LLC
FIG. 11.5.1 Example chain of custody record. Distribution:Original—accompany shipment; One copy—survey coordinator-field files.
CHAIN OF CUSTODY RECORD
PROJECT SAMPLERS: (Signed)
LAB # STATION DATE TIME REMARKS
NU
MB
ER
OF
CO
NT
AIN
ER
S
OT
HE
R
OIL
AIR
TIS
SU
E
SE
DIM
EN
T
WA
TE
R
SAMPLE TYPE
RELINQUISHED BY: (Signed) RECEIVED BY: (Signed) DATE/TIME
RECV'D BY MOBILE LAB FOR FIELDANAL.: (Signed)
DISPATCHED BY: (Signed) RECEIVED FOR LAB BY: (Signed)
METHOD OF SHIPMENT:
DATE/TIME DATE/TIME
RELINQUISHED BY: (Signed) RECEIVED BY: (Signed) DATE/TIME
RELINQUISHED BY: (Signed) RECEIVED BY: (Signed) DATE/TIME
RELINQUISHED BY: (Signed) DATE/TIME

PRECISION AND ACCURACY
One of the objectives of the QA or QC plan is to ensurethat there is no contamination from initial sampling throughfinal analysis. For this reason, duplicate, field blank, andtravel blank samples should be prepared and analyzed.
Duplicate sampling requires splitting one field sample intotwo aliquots for laboratory analysis. Typically, 10% ofthe samples should be collected in duplicate. Duplicatesdemonstrate the reproducibility of the sampling proce-dure.
A travel blank is a contaminant-free sample prepared in thelaboratory that travels with empty sample bottles to thesampling site and returns to the laboratory with thesamples. Typically, two travel blanks are prepared andshipped. Travel blanks identify contamination in the prep-aration of sample containers and shipping procedures.
Field blanks are empty sampling bottles prepared usingcontaminant-free water following general field samplingprocedures for collection of waste samples. These arereturned to the laboratory for analysis. Field blanksidentify contamination associated with field samplingprocedures.
For liquid samples, all three types of the above QA/QCsamples are prepared. For soils, semi-soils, sludges, andsolids, only duplicate samples are typically prepared.
The field supervisor of sample collection should main-tain a bound logbook so that field activity can be com-pletely reconstructed without relying on the memory of thefield crew. Items noted in the logbook should include:
• Date and time of activity• Names of field supervisor and team members• Purpose of sampling effort
©1999 CRC Press LLC
Volatile Organicsacroleinacrylonitrilebenzenebis(chloromethyl)etherbromoformcarbon tetrachloridechlorobenzenechlorodibromomethanepentachlorophenol2-chloroethyl vinyl ether
chloroformdichlorobromomethane1,2-dichloroethane1,1-dichloroethane1,1,-dichloroethylene1,2-dichloropropane1,2-dichloropropyleneethylbenzenemethyl bromidemethyl chloridemethylene chloride1,1,2,3-tetrachloroethanetetrachloroethylenetoluene1,2-trans-dichloroethylene1,1,1-trichloroethane1,1,2-trichloroethanetrichloroethylenevinyl chloride
Acid-Extractable Organics2-chlorophenol2,4-dichlorophenol2,4-dimethylphenol4,6-dinitro-o-cresol
2-nitrophenol4-nitrophenolparachlorometacresol1,2,4-trichlorobenzene
phenol2,4,6-trichlorophenol
Base and Neutral Organicsacenaphtheneacenaphtyleneanthracenebenzidinebenzo(a)anthracenebenzo(a)pyrenebenzo(ghi)perylenebenzo(k)fluoranthene3,4-benzo-fluoranthenebis(2-chloroethoxy) methanebis(2-chloroethyl)etherbis(2-chloroisopropyl)-
etherbis(2-ethylhexyl)phthalate4-bromophenyl phenyl
etherbutyl benzyl phthalate2-chloro-naphthalene4-chlorophenyl phenyl
etherchrysenedi-n-butyl phthalatedi-n-octyl phthalatedibenzo(a,h)anthracene1,2-dichlorobenzene4,49-DDT1,4-dichlorobenzenediethyl phthalate
dimethyl phthalate2,4-dinitrotoluene2,6-dinitrotoluene1,2-diphenylhyrazinefluoranthenefluorenehexachlorobenzenehexachlorobutadienehexachlorocyclo-
pentadienehexachloroethaneindeno(1,2,3-cd)-pyreneisophoronenaphthalenenitrobenzeneN-nitrosodi-n-
propylamineN-nitrosodimethylamineN-nitrosodiphenylaminephenathrenepyrene2,3,7,8-tetrachloro-
dibenso-p-dioxin
Pesticides and PCBsaldrinalpha-BHCbeta-BHCgamma-BHCdelta-BHCchlordane4,49-DDD4,49-DD chloroethanedieldrinalpha-endosulfanbeta-endosulfan
endosulfan sulfateendrinendrin aldehydeheptachlorheptachlor epoxidePCB-1016PCB-1221PCB-1232PCB-1242PCB-1248PCB-1254PCB-1260toxaphene
Metalsantimonyarsenicberylliumcadmiumchromiumcopperleadmercurynickelseleniumsilverthalliumzinc
Cyanides
Asbestos
TABLE 11.5.1 CATEGORIZATION OF PRIORITY POLLUTANTS
Source: Reprinted from U.S. Environmental Protection Agency (EPA), 1980–1988, National Pollutant Discharge Elimination System, Code of Federal Regulations,Title 40, Part 122. (Washington, D.C.: U.S. Government Printing Office).

• Description of sampling site• Location of sampling site• Sampling equipment used• Deviation(s) from standard operating procedures• Reason for deviations• Field observations• Field measurements• Results of any field measurements• Sample identification• Type and number of samples collected• Sample handling, packaging, labeling, and ship-
ping information
The logbook should be kept in a secure place until the pro-ject activity is completed, when the logbook should be keptin a secured project file.
AnalysisIf the source and nature of the waste is known, samplingand analysis are limited to the parameters of concern. Ifthe waste is unknown, a full spectrum analysis is often re-quired, including analysis for the 129 priority pollutants.Table 11.5.1 divides priority pollutants into seven cate-gories (EPA 1980–1988).
Table 11.5.2 presents the recommended analyticalprocedures for the following categories: volatile organics,acid-extractable organics, base and neutral organics,pesticides and PCBs, metals, cyanides, asbestos, andothers. Typically, organic analysis is performed usinggas chromatography and mass spectrometry (GC/MS).Typical sensitivity is on the order of 1–100 parts perbillion (ppb), depending on the specific organic com-pound and the concentration of compounds that mayinterfere with the analysis. This technique gives goodquantification and excellent qualification about theorganics in the waste.
A number of references should be consulted before de-termining the analytical protocols for the waste sample(EPA 1979; EPA 1977; EPA 1985a; EPA 1979a; APHA1980).
Because analysis of hazardous waste samples is costly,it is beneficial to prepare several samples and subject themto one of several screening procedures. Depending on thedata obtained, the analytical program can then focus onthe major constituents of concern, resulting in cost sav-ings. Recommended screening tests include: pH; conduc-tivity; total organic carbon (TOC); total phenols; organicscan (via GC with flame ionization detector); halogenated(via GC with electron capture detector); volatile organic
©1999 CRC Press LLC
TABLE 11.5.2 RECOMMENDED METHOD FOR ANALYSIS
Analytical Category Recommended Method for Analysis*
Volatile organics GC/MS (USEPA Method 624)Acid-extractable organics GC/MS (USEPA Method 625)Base and neutral organics GC/MS (USEPA Method 625)TCDD (dioxin) GC/MS (USEPA Method 608)Pesticides and PCBs GC/MS (USEPA Method 625)Metals Atomic absorption (flame or graphite)†Mercury Cold vapor atomic absorption spectroscopyCyanide EPA colorimetric methodAsbestos Fibrous asbestos methodAnions (SO4
22, F2, Cl2) Ion chromatographyOil and grease Freon extraction and gravimetric measurementPurgeable halocarbons GC (USEPA Method 601)Purgeable aromatics GC (USEPA Method 602)Acrolein and acrylonitrile GC (USEPA Method 603)Phenols GC (USEPA Method 604)Benzidine GC (USEPA Method 605)Pthalate esters GC (USEPA Method 606)Nitrosamines GC (USEPA Method 607)Pesticides and PCBs GC (USEPA Method 608)Nitroaromatics and isophorone GC (USEPA Method 609)Polynuclear aromatic hydrocarbons GC (USEPA Method 610)Chlorinated hydrocarbons GC (USEPA Method 611)TCDD (dioxin screening) GC (USEPA Method 612)
*GC/MS 5 gas chromatography/mass spectrometry; GC 5 gas chromatography.†Graphite furnace is a more sensitive technique.Source: Reprinted from U.S. EPA, 1980–1988.

scan; nitrogen-phosphorous organic scan; and metals (viainductively coupled plasma or atomic emission spec-troscopy).
—David H.F. Liu
ReferencesAmerican Public Health Association (APHA). 1980. Standard methods
for the examination of water and wastewater. 15th ed. APFA. NewYork, N.Y.
De Vera, E.R., B.P. Simmons, R.D. Stephens, and D.L. Storn, 1980.Samplers and sampling procedures in hazardous waste streams. EPA600–2–80–018, Cincinnati, Oh.
Evans, R.B., and G.E. Schweitzer. 1984. Assessing hazardous waste prob-lems, Environmental science and technology. 18(11).
U.S. Environmental Protection Agency (EPA). 1977. Sampling and analy-sis procedure for screening of industrial effluent for priority pollu-tants. Effluent Guideline Division. Washington, D.C.
———. 1979. Method for chemical analysis of water and waste. EPA600–4–79–020. Washington, D.C.
———. 1979a. Guidelines establishing procedures for analysis of pollu-tants. Code of Federal Regulations, Title 40, Part 136. Washington,D.C.: U.S. Government Printing Office.
———. 1980–1988. National pollutant discharge elimination system.Code of Federal Regulations, Title 40, Part 122. Washington, D.C.:U.S. Government Printing Office.
———. 1985. Protecting health and safety at hazardous waste sites: anoverview, Technology Transfer EPA, 625–9–85–006. Cincinnati, Oh.
———. 1985a. Characterization of hazardous waste sites—a methodsmanual; vol II, available sampling methods. EPA 600–4–84–075.Washington, D.C.
———. 1985b. Test methods for evaluating solid waste, physical/chem-ical methods. 2d ed. SW-846. Washington, D.C.
©1999 CRC Press LLC
11.6COMPATIBILITY
Wasteloads are frequently consolidated before transportfrom point of generation to point of treatment or disposal.Accurate waste identification and characterization is nec-essary to:
• Determine whether wastes are hazardous as de-fined by regulations
• Establish compatibility grouping to prevent mix-ing incompatible wastes
• Identify waste hazard classes as defined by theDepartment of Transportation (DOT) to enablewaste labeling and shipping in accordance withDOT regulations
• Provide identification to enable transporters ordisposal operators to operate as prescribed by reg-ulations.
Most wastes are unwanted products of processes involv-ing known reactants. Thus, the approximate compositionsof these wastes are known. Wastes of unknown origin mustundergo laboratory analysis to assess their RCRA status,including testing for the hazardous properties of ignitabil-
ity, reactivity, corrosivity, or toxicity in accordance withmethods specified in the regulations (See Section 11.4).
Once a waste is identified, it is assigned to a compati-bility group. One extensive reference for assigning groupsis a study of hazardous wastes performed for the EPA byHatayama et al (1980). A waste can usually be placed eas-ily in one of the groups shown in Figure 11.6.1, based onits chemical or physical properties. The compatibility ofvarious wastes is shown in Figure 11.6.1, which indicatesthe consequences of mixing incompatible wastes.Complete compatibility analysis should be carried out byqualified professionals to ascertain whether any waste canbe stored safely in proximity to another waste.
—William C. Zegel
ReferenceHatayama et al. 1980. A method for determining the compatibility
of hazardous wastes. U.S. Environmental Protection Agency (EPA).Office of Research and Development. EPA 600–2–80–076.Cincinnati, Oh.

FIG. 11.6.1 Hazardous waste compatibility chart. (Reprinted from Hatayama et al. 1980, A method for determining the compat-ibility of hazardous wastes, U.S. Environmental Protection Agency [EPA] [Office of Research and Development. EPA 600–2–80–076,Cincinnati, Oh].)
Reactivitygroup no.
Reactivity group name
1
2
3
4
5
6
7
8
9
10
11
12
13
14
15
16
17
18
19
20
21
22
23
24
25
26
27
28
29
30
31
32
33
34
101
102
103
104
105
106
107
H GF F
Acids, mineral, nonoxidizing
Acids, mineral, oxidizing
Acids, organic
Alcohols and glycols
Aldehydes
Amides
Amines, aliphatic and aromatic
Azo compounds, diazo compounds, and hydrazines
Carbamates
Caustics
Cyanides
Dithiocarbamates
Esters
Ethers
Flourides, inorganic
Hydrocarbons, aromatic
Halogenated organics
Isocyanates
Ketones
Mercaptans and other organic sulfides
Metals, alkali and alkaline earth, elemental
Metals, other elemental & alloys as powders, vapors, or sponges
Metals, other elemental & alloys as sheets, rods, drops, moldings, etc.
Metals and metal compounds, toxic
Nitrides
Nitriles
Nitro compounds, organic
Hydrocarbons, aliphatic, unsaturated
Hydrocarbons, aliphatic, saturated
Peroxides and hydroperoxides, organic
Phenols and cresols
Organophosphates, phosphothioates, phosphodithioates
Sulfides, inorganic
Epoxides
Combustible and flammable materials, miscellaneous
Explosives
Polymerizable compounds
Oxidizing agents, strong
Reducing agents, strong
Water and mixtures containing water
Water reactive substances
1 2 3 4 5 6 7 8 9 10 11 12 13 14 15 16 17 18 19 20 21 22 23 24 25 26 27 28 29 30 31 32 33 34 101 102 103 104 105 106 107
107
1
2
3
4
5
6
7
8
9
10
11
12
13
14
15
16
17
18
19
20
21
22
23
24
25
26
27
28
29
30
31
32
33
34
101
102
103
104
105
106
H P
H F
G H
H P
H F
H GT
H GT
H GT
H GT
H
GT GF
H F
H F
GT
H F
H F GT
H F GT
H F
H F GT
GF H F
GF H F
GF H F
S
H F E
H F GT
H F GT
H F
H F
H E
H F
H GT
HF GT
H P
H F GT
H E
P H
H F GT
H
H
H P
H
H G
H
H GF
H GT
P H
P H
H E
H E
H G
H P
GT GF
H GT
H
H G
H
H GT GF
GF HF
S S
GF H F
GF H F
GF H F
GF H F
GF H F
GF H F
GF
GT GF
H
H G
H GT
GT GT
H
H
H GF F
GT GF
H
H
H G
H
H G
H
GT GF
H GF GT
H G
GF H
GF H
GF H
GF H
GF H
GF H
GF H
GF GT H
HHH G
H G
H G
H G
H P
H P
H GT
H GF H
H P G
H G
H
H
H
GF GT U
U
H G
H G H
H G
G
G H
HHH
H F GT
H F G
U
S S S
H G U GF
HGF H
GF H
U
H E
H GF
GF H E
GF H
H
H
H F
H G
H GT
H F E
H F GT
H G
U
E
H P
H E
P H
H E
H G
G
H GF
GF H
GF H F
H GF
H GF F
H GT
H F
H F
H F GT
H F GT
H P
H P U H
PH P
H P U
H GT
H F
UP H
P H
H F GT
H E GT
H F GT
H F
H F
H F
H E
H E
H E
H F
GF H
GF H
GF H
GF H
H GF F
EGF H
GF HU
GF H
H P
H GF E
H E
S GF H
H GF E
H P
H P GT
H GF E
H G
P G
H E
H F GT
EHH E
H E GT
H F GT
H P
GF H
H
H P
H P
H P
H P
H P
H PUH
PH P
U
H
H GT
H E
H E
H E
H E
H EEE
H GF E
H G F
H E
H E
H E
P H
P H
P H
P H
P H
H F E
H F
H F E
H F E
H F
H F GT
H GT
H F GT
GF H
GF H
GF H
H G
GF H
GF H S GF
H
H F
H E
H F GT
H G
H F
H F GT
H F G
H F GT
H F G
H E
H F GT
H F
H F E
H P GF
H E
GF GT
GT GF
H E
GF H
GT GF H
GF HH
H E
P H
P H
P H
H F GT
H GF
H E
GT H
H E
H E
H E
H
GF H
H
U GF H
H G
Reactivity Code Consequences
Heat generationFireInnocuous and nonflammable gas generationToxic gas generationFlammable gas generation ExplosiveViolent polymerizationSolubilization of toxic substancesMay be hazardous but unknown
Example:
Heat generation, fire, andtoxic gas generation
HFG
GTGFEPSU
H F
GT
EXTREMELY REACTIVE!DO NOT MIX WITH ANY CHEMICAL OR WASTE MATERIAL!EXTREMELY REACTIVE!

The Comprehensive Environmental Response, Compen-sation, and Liability Act (CERCLA) of 1980, better knownas Superfund, became law “to provide for liability, com-pensation, cleanup and emergency response for hazardoussubstances released into the environment and the cleanupof inactive hazardous waste disposal sites.” CERCLA wasintended to give the EPA authority and funds to clean upabandoned waste sites and to respond to emergencies re-lated to hazardous waste.
If a site poses a significant threat, the EPA uses itsHazard Ranking System (HRS) to measure the relative risk.Based upon this ranking system, sites warranting the high-est priority for remedial action become part of the NationalPriority List (NPL).
The HRS ranks the potential threat posed by facilitiesbased upon containment of hazardous substances, routeof release, characteristics and amount of substances, andlikely targets. HRS methodology provides a quantitativeestimate of the relative hazards posed by a site, taking intoaccount the potential for human and environmental ex-posure to hazardous substances. The HRS score is basedon the probability of contamination from three sources—groundwater, surface water, and air—on the site in ques-tion. The HRS score assigned to a hazardous site reflectsthe potential hazards relative to other sites (Hallstedt,Puskar & Levine 1986).
SM is the potential for harm to humans or the environ-ment from migration of a hazardous substance togroundwater, surface water, or air; it is a composite ofscores of each of the three routes
SFE is the potential for harm from flammable or explosivesubstances
SDC is the potential for harm from direct contact with haz-ardous substances at the site
The score for each of these hazard modes is obtained froma set of factors characterizing the facility’s potential tocause harm as shown in Table 11.7.1. Each factor is as-signed a numerical value according to the prescribed cri-
teria. This value is then multiplied by a weight factor, yield-ing the factor score.
The factor scores are then combined: scores within afactor category are added together, then the total scoresfor each factor category are multiplied together. SM isa composite of the scores of three possible migrationroutes:
SM 5 }1.
173} S2
gwww 1w Sw2sww 1w Sw2
aw 11.7(1)
Figure 11.7.1 shows a typical worksheet for calculatingthe score for groundwater. Other worksheets are includedin 40 CFR Part 300, Appendix A (1987).
Use of the HRS requires considerable information aboutthe site, its surroundings, the hazardous substances pre-sent, and the geology in relation to the aquifers. If the dataare missing for more than one factor in connection withthe evaluation of a route, then that route score becomes0, and there is no need to assign scores to factors in a routeset at 0.
The factors that most affect an HRS site score arethe proximity to a densely populated area or source ofdrinking water, the quantity of hazardous substancespresent, and toxicity of those hazardous substances. TheHRS methodology has been criticized for the followingreasons:
There is a strong bias toward human health effects, withonly slight chance of a site in question receiving a highscore if it represents only a threat or hazard to the en-vironment.
Because of the human health bias, there is an even strongerbias in favor of highly populated affected areas.
The air emission migration route must be documented byactual release, while groundwater and surface waterroutes have no such documentation requirement.
The scoring for toxicity and persistence of chemicals may bebased on site containment, which is not necessarily re-lated to a known or potential release of toxic chemicals.
©1999 CRC Press LLC
Risk Assessment and Waste Management
11.7THE HAZARD RANKING SYSTEM AND THE NATIONAL PRIORITY LIST
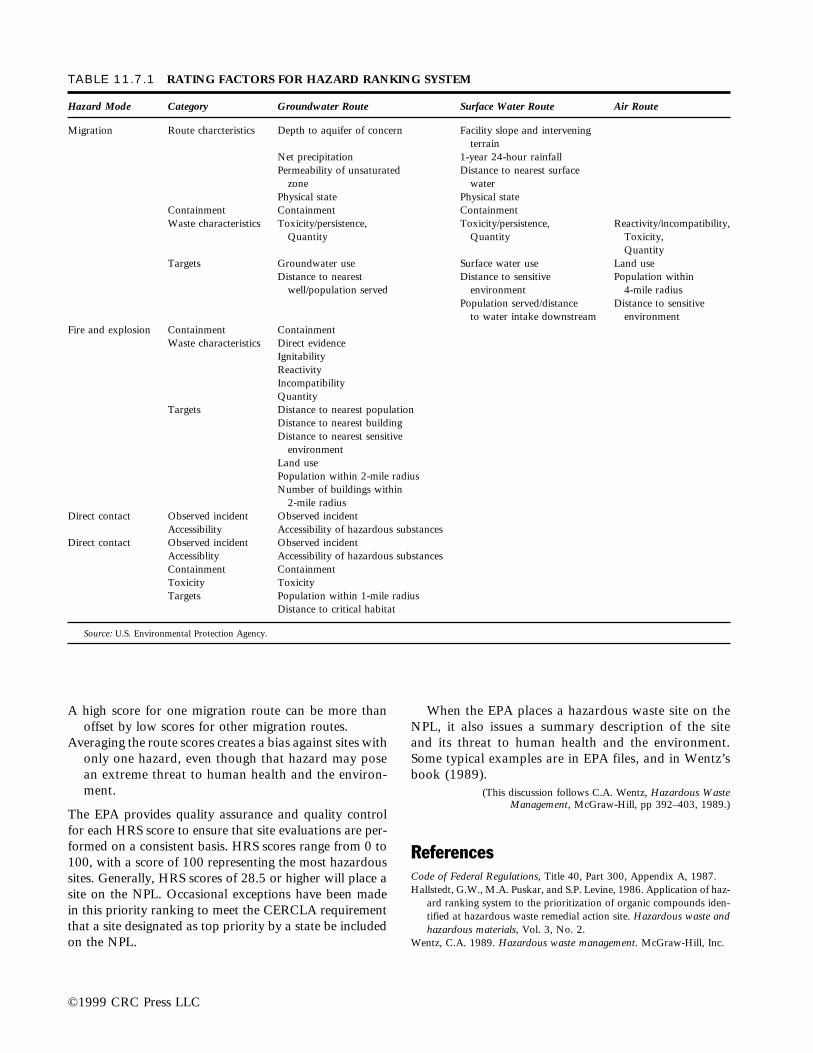
A high score for one migration route can be more thanoffset by low scores for other migration routes.
Averaging the route scores creates a bias against sites withonly one hazard, even though that hazard may posean extreme threat to human health and the environ-ment.
The EPA provides quality assurance and quality controlfor each HRS score to ensure that site evaluations are per-formed on a consistent basis. HRS scores range from 0 to100, with a score of 100 representing the most hazardoussites. Generally, HRS scores of 28.5 or higher will place asite on the NPL. Occasional exceptions have been madein this priority ranking to meet the CERCLA requirementthat a site designated as top priority by a state be includedon the NPL.
When the EPA places a hazardous waste site on theNPL, it also issues a summary description of the siteand its threat to human health and the environment.Some typical examples are in EPA files, and in Wentz’sbook (1989).
(This discussion follows C.A. Wentz, Hazardous WasteManagement, McGraw-Hill, pp 392–403, 1989.)
ReferencesCode of Federal Regulations, Title 40, Part 300, Appendix A, 1987.Hallstedt, G.W., M.A. Puskar, and S.P. Levine, 1986. Application of haz-
ard ranking system to the prioritization of organic compounds iden-tified at hazardous waste remedial action site. Hazardous waste andhazardous materials, Vol. 3, No. 2.
Wentz, C.A. 1989. Hazardous waste management. McGraw-Hill, Inc.
©1999 CRC Press LLC
TABLE 11.7.1 RATING FACTORS FOR HAZARD RANKING SYSTEM
Hazard Mode Category Groundwater Route Surface Water Route Air Route
Migration Route charcteristics Depth to aquifer of concern Facility slope and intervening terrain
Net precipitation 1-year 24-hour rainfallPermeability of unsaturated Distance to nearest surface
zone waterPhysical state Physical state
Containment Containment ContainmentWaste characteristics Toxicity/persistence, Toxicity/persistence, Reactivity/incompatibility,
Quantity Quantity Toxicity,Quantity
Targets Groundwater use Surface water use Land useDistance to nearest Distance to sensitive Population within
well/population served environment 4-mile radiusPopulation served/distance Distance to sensitive
to water intake downstream environmentFire and explosion Containment Containment
Waste characteristics Direct evidenceIgnitabilityReactivityIncompatibilityQuantity
Targets Distance to nearest populationDistance to nearest buildingDistance to nearest sensitive
environmentLand usePopulation within 2-mile radiusNumber of buildings within
2-mile radiusDirect contact Observed incident Observed incident
Accessibility Accessibility of hazardous substancesDirect contact Observed incident Observed incident
Accessiblity Accessibility of hazardous substancesContainment ContainmentToxicity ToxicityTargets Population within 1-mile radius
Distance to critical habitat
Source: U.S. Environmental Protection Agency.

The term “risk” refers to the probability that an event willhave an adverse effect, indirectly or directly, on humanhealth or welfare. Risk is expressed in time or unit activ-ity, e.g., cancer cases per pack of cigarettes smoked. Riskassessment takes into account the cumulative effects of allexposure. For example, in assessing the risk that a personwill suffer from air pollution, both indoor and outdoorpollution must be taken into account.
The function of an effective hazardous materials man-agement program is to identify and reduce major risks.This involves both risk assessment and risk management.The flowchart in Figure 11.8.1 shows the factors affectingthe hazardous waste risk assessment procedure. This pro-cedure begins with identification of the waste and the lawsand regulations pertaining to that waste. When the wasteis identified, its toxicity and persistence must be determined
to evaluate the risk of human and the environmental ex-posure. The risk management process involves selecting acourse of action based on the risk assessment.
One way to highlight differences between risk assess-ment and risk management is to look at differences in theinformation content of the two processes. Data on tech-
©1999 CRC Press LLC
Surface Water Route Work Sheet
Rating FactorAssigned Value
(Circle One)Multi-plier Score
Max.Score
Ref.(Section)
1
2
3
4
5
6
7
Observed Release 0 45 1 45 4.1
If observed release is given a value of 0, proceed to line .
If observed release is given a value of 45, proceed to line .4
2
Route CharacteristicsFacility Slope and Intervening Terrain1-yr 24-hr RainfallDistance to Nearest Surface WaterPhysical State
0000
1111
2222
3333
1121
3363
4.2
Total Route Characteristics Score 15
Containment 0 1 2 3 1 3 4.3
Toxicity/PersistenceHazardous Waste Quantity
Waste Characteristics
TargetsSurface Water UseDistance to a Sensitive EnvironmentPopulation Served/ Distance to Water Intake Downstream
00
31
62
93
124
156
187 85
11
188
4.4
Total Waste Characteristics Score
Total Targets Score
000
1224
114
1630
226
1832
338
2035
10
40
321
96
40
4.5
55
64,350
If line 1 is 45, multiply 1 ¥ 4 ¥ 5
If line 1 is 0, multiply 2 ¥ 3 ¥ 4 ¥ 5
Divide line by 64,350 and multiply by 1006
26
Ssw =
Facility Name: Date:
FIG. 11.7.1 Surface water route worksheet.
11.8RISK ASSESSMENT
FIG. 11.8.1 Factors affecting the risk assessment of hazardouswaste.
Laws Regulations Liabilities
Hazardouswaste
Risks tohumans and
the environment
Financial risk
Management ofhazardous waste

nological feasibility, on costs, and on the economic andsocial consequences of possible regulatory decisions are ofcritical importance to risk management but not to risk as-sessment. As statutes require, risk managers consider thisinformation with risk assessment outcomes to evaluate riskmanagement options and make environmental decisions(Figure 11.8.2).
Environmental risk assessment is a multi-disciplinaryprocess. The risk assessment procedure is an iterative loopthat the assessor may travel several times. It draws on data,information, and principles from many scientific disci-plines, including biology, chemistry, physics, medicine, ge-ology, epidemiology, and statistics. After evaluating indi-vidual studies for conformity with standard practiceswithin each discipline, the most relevant information fromeach is combined and examined to determine the risk.Although studies from single disciplines are used to de-velop risk assessment, such studies alone are not regardedas risk assessment or used to generate risk assessments.
Review of Basic Chemical PropertiesBefore exploring the major components of risk assessment,some basic chemical properties and their relationships tobiological processes must be reviewed.
Chemical Structure. The chemical structure of a sub-stance is the arrangement of its atoms. This structure de-termines the chemical’s properties, including how a chem-
ical will combine with another substance. Because differ-ent structural forms of a chemical may exhibit differentdegrees of toxicity, the chemical structure of the substancebeing assessed is critical. For example, the free cyanide iondissolved in water is highly toxic to many organisms (in-cluding humans); the same cyanide combined with iron ismuch less toxic (blue pigment). Cyanide combined withan organic molecule may have completely different toxicproperties.
Solubility. Solubility is a substance’s ability to blend uni-formly with another. The degree of water and lipid (fat)solubility of a chemical is important in risk assessment.Solubility has significant implications for activities as di-verse as cooking or chemical spill cleanup. To estimate thedegree of potential water contamination from a chemicalspill, it is necessary to know the chemical makeup of thematerial spilled to judge the extent that chemical contam-ination will be dispersed by dissolving in water. Likewise,the degree of lipid solubility has important implications,particularly in such processes as bioaccumulation.
Bioaccumulation. The process of chemical absorptionand retention within organisms is called bioaccumulation.For example, a fat-soluble organic compound ingested bya microorganism is passed along the food chain when anorganism eats the microorganism, then another predatoreats the organism. The organic compound, because it isfat-soluble, will concentrate in the fat tissue of each ani-mal in the food chain. The pesticide DDT is an exampleof a chemical that bioaccumulates in fish, and then in hu-mans and birds eating those fish.
Transformation. Biotransformation and transformationcaused by physical factors exemplify how chemical com-pounds are changed into other compounds. Biotransfor-mation is the change of one compound to another by themetabolic action of a living organism. Sometimes such atransformation results in a less toxic substance, other timesin a more toxic substance.
Chemical transformation is prompted by physicalagents such as sunlight or water. A pesticide that is con-verted into a less toxic component by water in a few daysfollowing application (e.g., malathion) carries a differentlong-term risk than a pesticide that withstands naturaldegradation or is biotransformed into a toxic compoundor a metabolite (e.g., DDT). The ability to withstand trans-formation by natural processes is called persistence.
Understanding basic chemical and physical propertieshelps to determine how toxic a chemical can be in drink-ing water or in the food chain, and whether the substancecan be transported through the air and into the lungs. Forexample, when assessing the risk of polychlorinatedbiphenyls (PCBs), it must be recognized that they biode-grade very slowly and that they are strongly fat-soluble,so they readily bioaccumulate. When monitoring their
©1999 CRC Press LLC
FIG. 11.8.2 Disciplines contributing to environmental deci-sions.
Risk Management
Multiple disciplines: natural sciences,physical sciences, social sciences:· Risk assessment· Economics· Politics· Law· Social values, concerns
Multiple scientific disciplines: · Chemistry, biology, etc.· Statistics· Medicine· Models· Science policy
Discipline-based: · Chemistry· Biology· Geology· Toxicology· Epidemiology
Risk Assessment
LaboratoryandField Work

presence, it must also be recognized that they are negligi-bly soluble in water: concentrations will always be muchhigher in the fat tissue of a fish, cow, or human than inthe blood, which has a higher water content.
RA ParadigmsThe risk assessment paradigm published in Risk Assess-ment in the Federal Government: Managing the Process(National Academy of Science [NAS] 1983), provides auseful system for organizing risk science information fromthese many different sources. In the last decade, the EPAhas used the basic NAS paradigm as a foundation for itspublished risk assessment guidance and as an organizingsystem for many individual assessments. The paradigm de-fines four fields of analysis describing the use and flow ofscientific information in the risk assessment process (Figure11.8.3).
The following paragraphs detail those four fields ofanalysis. Each phase employs different parts of the infor-mation database. For example, hazard identification reliesprimarily on data from biological and medical sciences.Dose-response analysis uses these data in combination withstatistical and mathematical modeling techniques, so thatthe second phase of the risk analysis builds on the first.
HAZARD IDENTIFICATION
The objective of hazard identification is to determinewhether available scientific data describes a causal rela-tionship between an environmental agent and demon-strated injury to human health or the environment. In hu-mans, observed injuries may include birth defects,
neurological damage, or cancer. Ecological hazards mightresult in fish kills, habitat destruction, or other environ-mental effects. If a potential hazard is identified, three otheranalyses become important for the overall risk assessment.
Chemical toxicities are categorized according to the var-ious health effects resulting from exposure. The health ef-fects, often referred to as endpoints, are classified as acute(short-term) and chronic (long-term). Acute toxic effectsoccur over a short period of time (from seconds to days),for example: skin burns from strong acids and poisoningsfrom cyanide. Chronic toxic effects last longer and developover a much longer period of time, and include cancer,birth defects, genetic damage, and degenerative illnesses.
A wide variety of reference materials provide basic tox-icity data on specific chemicals, including:
Registry of Toxic Effects of Chemical Substances (RTECS),(U.S. Department of Health and Human Services)
Health Assessment Guidance Manual (U.S. Department ofHealth and Human Services 1990)
The Handbook of Toxic and Hazardous Chemicals andCarcinogens (Sittig 1985)
Threshold Limit Values (TLVs) for Chemical Substancesand Physical Agents and Biological Exposure Indices(BEIs) American Conference of GovernmentalIndustrial Hygienists (ACGIH 1990)
Integrated Risk Information System (IRIS), a database sup-ported by EPA Office of Research and Development,Environmental Criteria and Assessment Office (MS-190), Cincinnati, Oh. 45268, Telephone: 513-569-7916
The U.S. Environmental Protection Agency has classifiedsome 35,000 chemicals as definitely or potentially harm-ful to human health. However, the risk resulting from ex-
©1999 CRC Press LLC
FIG. 11.8.3 Elements of risk assessment and risk management. (Reproduced with permission from Risk Assessment inthe Federal Government: Managing the Process, 1983, The National Academy of Science [NAS], Washington, D.C.: TheNational Academy Press.
Field measurements,estimated exposures,characterization ofpopulations
Dose-ResponseAssessment (What isthe relationshipbetween dose andincidence in humans?)
Exposure Assessment(What exposures arecurrently experiencedor anticipated underdifferent conditions?)
Risk Characterization(What is the estimatedincidence of theadverse effect in agiven population?)
Development ofregulatory options
Evaluation of publichealth, economic,social, politicalconsequences ofregulatory options
Agency decisions andactions
Laboratory and fieldobservations of adverse health effects andexposures to particularagents
Information onextrapolation methodsfor high to low dose andanimal to human
Hazard identification(Does the agent causethe adverse effect?)
RESEARCH RISK ASSESSMENT RISK MANAGEMENT

posure to more than one of these substances at the sametime is not known (Enger, Kormelink, Smith & Smith1989).
The following estimation techniques are commonlyused to learn about human toxicity (Nally 1984).
Clinical Studies
The strongest evidence of chemical toxicity to humanscomes from observing individuals exposed to the chemi-cal in clinical studies. Scientists can determine direct causeand effect relationships by comparing the control groups(individuals not exposed to the chemical) to the exposedindividuals. For obvious moral and ethical reasons, thereis a limit to testing toxicity directly on humans. For ex-ample, tests for acute toxicity, such as allergic skin reac-tions, might be permissible, but tests for chronic toxicity,such as cancer, would be unacceptable.
Epidemiological Studies
As clinical studies frequently cannot be performed, scien-tists gather data on the incidence of disease or other ill ef-fects associated with human exposure to chemicals in real-life settings. The field of epidemiology studies the incidenceand distribution of disease in a population. This type ofinformation is after the fact and in the case of cancer,comes many years after the exposure. Nevertheless, whileepidemiological studies cannot unequivocally demonstratedirect cause and effect, they often can establish convinc-ing and statistically significant associations. Evidence of apositive association carries the most weight in risk assess-ment.
Many factors limit the number of chemicals examinedin epidemiological studies. Often there is no mechanismto verify the magnitude, the duration, or even the route ofindividual exposure. Control groups for comparing the in-cidence of disease between exposed and unexposed popu-lations are difficult to identify. In addition, a long latencyperiod between exposure and the onset of disease makestracking exposure and outcome especially difficult.
On the other hand, epidemiological studies are very use-ful in revealing patterns of disease or injury distribution,whether these are geographical (i.e., the incidence of stom-ach cancer in Japan), for a special risk group (i.e., womenof child-bearing age), or for an occupation (i.e., the inci-dence of cancer in asbestos workers). When available, validepidemiological data are given substantial scientific weight.
Animal Studies
Since evidence from human exposure to a chemical is notusually available, scientists often rely on animal studies todetermine the toxicity of a chemical. The objective of an-imal studies is to determine, under controlled laboratoryconditions, the chemical dose that will produce toxic ef-fects in an animal. This information is used to predict what
may occur in humans under normal exposure conditions.Toxic effects that occur in laboratory animals often occurin humans exposed to the same agents. Scientists recog-nize, however, that animal tests may not be conclusive forhumans.
Routes of exposure in animal studies are designed tomimic the routes of possible human exposure. Ideally, asuspected food contaminant would be tested in a feedingstudy, a suspected skin surface irritant in a dermal irrita-tion study, and a potential air contaminant in an inhala-tion study. However, it is not always possible to adminis-ter a test dose of the chemical to an animal via the expectedroute of exposure in humans (for instance, if it alters thecolor or odor of feed) so other methods must be devised.
Test-Tube Studies
Test-tube or in vitro studies involving living cells are par-ticularly useful in testing whether a chemical is a potentialcarcinogen. Some of these tests are for mutagenicity or theability to alter genetic material. Mutagenicity is believedto be one way in which carcinogens initiate cancer. Theseare often referred to as short-term tests because they re-quire only a few hours or days, as opposed to several yearsrequired for long-term carcinogenicity studies in labora-tory animals. The Ames mutagenicity test, which uses bac-teria strains that reproduce only in the presence of a mu-tagen, is the best-known short-term test.
One of the major drawbacks of these cellular tests isthat even with the addition of enzyme mixtures and otheruseful modifications, they are far simpler than the com-plex human organism. The human body’s sensitive bio-logical systems and remarkable defense mechanisms pro-tect against chemical attack. The cellular tests lack thecomplexities of whole, integrated organisms, thus, theyyield a significant number of false results. Nevertheless,they remain a useful screening process in deciding whichchemicals should undergo more meaningful, but far morelengthy and expensive animal testing for carcinogenicity.Cellular tests can also provide insight into a carcinogen’smode of action.
Structure-Activity Relationships
When limited (or no) data are available from the estima-tion methods above, scientists often turn to structure-ac-tivity studies for evidence of chemical toxicity. This tech-nique is based on the principle that chemicals with similarstructures may have similar properties. For example, manypotential carcinogens are found within categories of struc-turally similar chemicals.
At present, this method of predicting toxicity is not anexact science; it provides only an indication of potentialhazard. However, as the technique develops along withthe understanding of biological mechanisms, structure-ac-tivity relationships will evolve into a more precise predic-tive tool.
©1999 CRC Press LLC

Animal studies are currently the preferred method fordetermining chemical toxicity. Although they are less con-vincing than human studies, animal studies are more con-vincing than test-tube and structure-activity studies. Theyare also easier to schedule, an industry has evolved aroundperforming them.
The uncertainties associated with animal toxicity stud-ies are discussed below.
The Testing Scheme
The selection of toxicological tests is crucial to any ex-perimental program. Similarly, decisions regarding: theamount of chemical to be tested; the route of exposure;the test animal species; the composition of the test popu-lation (homogeneous or heterogeneous); the effects to beobserved; and the duration of the study affect the useful-ness and reliability of the resulting data. Although basedon scientific judgment, all such decisions introduce ele-ments of subjectivity into the testing scheme. The outcomeof the test may be shaped by the specific nature of the testitself. For example, the decision to conduct an inhalationstudy might preclude discovering toxic effects via a dif-ferent route of exposure. For this reason, a route of ex-posure is selected to approximate real-life conditions.
Demonstration of carcinogenicity requires strict obser-vance of analytical protocols. NCI (IRLG 1979) presentscriteria for evaluating experimental designs (see Table11.8.1). Laboratory data not developed in compliance withthese protocols are questionable.
Synergism/Antagonism
In vivo animal experiments are controlled studies that al-low the isolation of individual factors to determine a spe-cific cause and effect relationship. However, critics point
out that such tests, although useful, are not absolute indi-cators of toxicity. As such tests are specific, synergistic ef-fects from human exposure to more than one chemical arenot detected. These tests may also overlook antagonisticeffects where one chemical reduces the adverse effect ofanother.
DOSE-RESPONSE RELATIONSHIP
When toxicological evaluation indicates that a chemicalmay cause an adverse effect, the next step is to determinethe potency of the chemical. The dose-response analysisdetermines the relationship between the degree of chemi-cal exposure (or dose) and the magnitude of the effect (re-sponse) in the exposed organism. Scientists use this analy-sis to determine the amount of a chemical that causestumor development in skin irritation, animals, or death inanimals.
Dose-response curves are generated from various acuteand chronic toxicity tests. Depending on chemical action,the curve may rise with or without a threshold. As Figure11.8.4 shows, the TD50 and TD100 points indicate the dosesassociated with 50% and 100% occurrence of the mea-sured toxic effect; also shown are the No ObservableAdverse Effect Level (NOAEL) and Lowest ObservableAdverse Effect Level (LOAEL). The NOAEL is assumedto be the basis for the Acceptable Daily Intake (ADI).
Figure 11.8.5 illustrates the threshold and no-thresholddose-response curve. In both cases, the response normallyreaches a maximum, after which the dose-response curvebecomes flat.
To estimate the effects of low doses, scientists extrap-olate from the observed dose-response curve. Extrapo-lation models extend laboratory results into ranges whereobservations are not yet available or possible. Most cur-rent models are not based exclusively upon known biol-
©1999 CRC Press LLC
TABLE 11.8.1 CRITERIA FOR EVALUATING CARCINOGEN EXPERIMENTS ON ANIMALS
Criteria Recommendations
Experimental design Two species of rats, and both sexes of each; adequate controls; sufficient animals to resolve anycarcinogenic effect; treatment and observation throughout animal lifetimes at range of doseslikely to yield maximum cancer rates; detailed pathological examination; statistical analyses ofresults for significance
Choice of animal model Genetic homogenity in test animals, especially between exposed and controls; selection of specieswith low natural-tumor incidence when testing that type of tumor
Number of animals Sufficient to allow for normal irrelevant attrition along the way and to demonstrate an effectbeyond the level of cancer in the control group
Route of administration Were tumors found remote from the site of administration? No tumors observed shoulddemonstrate that absorption occurred
Identity of the Exposure to chemicals frequently involves mixtures of impurities. What effect did this have onsubstance tested results? What is the significance of pure compound results? Also, consider the carrier used in
administrationDose levels Sufficient to evoke maximum tumor incidenceAge of treatment Should be started earlyConduct and duration Refer to NCI’s “Guidelines for Carcinogen in Small Rodents”
of bioassays

ogy or toxicology, but are largely mathematical constructsbased upon assumptions carrying varying degrees of un-certainty. How accurately these extrapolated low-dose re-sponses correspond to true human risk remains a scien-tific debate.
Animal to Human Extrapolation
In extrapolating from animal data to potential human tox-icity, a number of conversion factors are used to accountfor the differences between humans and animals. Factorsmust consider individual differences within a species; ac-count for different sensitivities (Table 11.8.2); and note thevariations between the two species, such as differences inweight, surface area, metabolism, and absorption.
Extrapolation from animal species to humans has ele-ments of both science and art. It serves as a best estimate,neither invalid nor absolute truth. Although each step ofassessment is laden with controversy, animal testing is thegenerally accepted approach for predicting human toxic-ity.
EXPOSURE ANALYSIS
Determining toxicity and exposure is necessary in a chem-ical risk assessment. Exposure to a chemical can occurthrough direct or indirect routes. Direct exposure is easierto identify, for example, exposure to nicotine and carbonmonoxide from smoking cigarettes, or exposure to a pes-ticide from swimming in a contaminated lake. Indirect ex-posure can be somewhat more elusive, for example, mer-cury exposure by eating fish from mercury-contaminatedwaters. Whether direct or indirect, human exposure tochemicals will be dermal (skin contact), oral (contact byingestion), and/or inhaled (contact by breathing).
Assessing human exposure to a chemical involves firstdetermining the magnitude, duration, frequency, and routeof exposure; and second, estimating the size and nature ofthe exposed population. Questions include to what con-centration of chemical is a person exposed? How oftendoes exposure occur—is it long-term or short-term, con-tinuous or varied? What is the route of exposure—is thechemical in foods, consumer products, or in the work-place? Is the chemical bioactive, or is it purged from thehuman system without causing any harmful effects? Arespecial risk groups, such as pregnant women, children, orthe elderly, exposed?
Sources of Uncertainty
Exposure measurements and estimates are difficult to ob-tain, and full of uncertainty. Often, less data exists abouthuman exposure to chemicals than about chemicals’ in-herent toxicities. When estimating chemical exposure, it isimportant to be aware that exposure can come from dif-ferent sources at varying rates—some intermittent, otherscontinuous. Frequently, people assume that exposurecomes from only one source and that they only need tomonitor levels from that source. However, people may beexposed to different sources at various times and in vari-ous quantities. These considerations make estimating ex-posure very difficult. Below are some sources of uncer-tainty in estimating chemical exposure.
Monitoring Techniques
When chemical contamination is suspected, it is necessaryto identify the baseline, or background concentration, ofthe chemical before onset of contamination. Subtractingthe background concentration from the total concentra-tion detected provides an accurate measure of the expo-sure resulting from contamination.
©1999 CRC Press LLC
FIG. 11.8.4 Hypothetical dose-response curve. (Adapted fromICAIR Life Systems, Inc., 1985, Toxicology Handbook, preparedfor EPA Office of Waste Programs Enforcement, Washington,D.C.)
FIG. 11.8.5 Hypothetical dose-response curves. (Adaptedfrom ICAIR Life Systems, Inc., 1985.)
NOAEL
LOAEL
100
75
50
25
00 1 3 10 30
TD50
TD100
Adv
erse
Res
pons
e, %
Max
imum
Dose, Arbitrary Units (Logarithmic Scale)
No Threshold Value
Threshold Value
100
80
60
40
20
00 20 40 60 80 100 120
Dose, Arbitrary Units
Res
pons
e, %
Max
imum

It should be noted that scientists cannot measure zeroconcentration of a chemical—zero concentration is not ascientifically verifiable number. Instead, the terms “noth-ing detected” or “below the limit of measurement tech-niques” are used.
Sampling Techniques
In determining the location and number of samples foranalysis, samples must accurately represent exposure lev-els at the place and time of exposure. There may be a dif-ference between soil sampled at the surface or at a depthof six inches. Proper scientific methods must be observed,as an error in sampling will be propagated throughout theentire analysis. Furthermore, enough samples must betaken to allow statistical analysis crucial to ensuring datareliability.
Past Exposure
It is often difficult to determine the past exposure to achemical. Most epidemiological studies are initiated aftersymptoms associated with exposure have occurred and af-ter the amount or duration of exposure has changed.Unless detailed records are maintained, as in some work-place environments, the exact amount of exposure mustbe estimated.
Extrapolation to Lifetime Exposure
When initial exposure is measured (e.g., an industrialworker exposed to about 50 ppm of ethylene oxide for 8hr per day), an extrapolation is made to determine the ex-posure over a lifetime of such activity. Information gath-ered from a small population segment must be extrapo-lated to the entire population. Such extrapolation often
does not account for individual variability in exposureswithin the population.
RISK CHARACTERIZATION
Although the preceding analyses examine all relevant datato describe hazards, dose-response, or exposure, no con-clusions are drawn about the overall risk. The final analy-sis addresses overall risk by examining the preceding analy-ses to characterize the risk. This process fully describes theexpected risk through examining exposure predictions forreal-world conditions, in light of the dose-response infor-mation from animals, people, and special test systems.
Risk is usually identified as a number. When the riskconcern is cancer, the risk number represents the proba-bility of additional cancer cases. For example, an estimatefor pollutant X might be expressed as 1 3 1026 or sim-ply 1026. This means one additional case of cancer pro-jected in a population of one million people exposed to acertain level of Pollutant X over their lifetimes.
A numerical estimate is only as good as the data it isbased on. Scientific uncertainty is a customary and ex-pected factor in all environmental risk assessment.Measurement uncertainty refers to the usual variances ac-companying scientific measurement, such as the range (106 1). Sometimes the data gap exists because specific mea-surements or studies are missing. Sometimes the data gapis more broad, revealing a fundamental lack of under-standing about a scientific phenomenon.
The 1983 paradigm and EPA risk assessment guidelinesstress the importance of identifying uncertainties and pre-senting them as part of risk characterization.
The major sources of uncertainty are: (1) difficulty inestimating the amount of chemical exposure to an indi-vidual or group; (2) limited understanding of the mecha-nisms determining chemical absorption and distribution
©1999 CRC Press LLC
TABLE 11.8.2 FACTORS INFLUENCING HUMAN RESPONSE TO TOXIC COMPOUNDS
Factor Effect
Dose Larger doses correspond to more immediate effectsMethod of administration Some compounds nontoxic by one route and lethal by another (e.g., phosgene)Rate of administration Metabolism and excretion keep pollutant concentrations below toxic levelsAge Elderly and children more susceptibleSex Each sex has hormonally controlled hypersensitivitiesBody weight Inversely proportional to effectBody fat Fat bioconcentrates some compounds (large doses can occur in dieters due to stored
pollutants)Psychological status Stress increases vulnerabilityImmunological status Influences metabolismGenetic Different metabolic ratesPresence of other diseases Similar to immunological status; could be a factor in cancer recurrencePollutant pH and ionic states Interferes or facilitates absorption into the bodyPollutant physical state Compounds absorbed on particulates may be retained at higher rateChemical milieau Synergisms, antagonisms, cancer “promoters,” enhanced absorptionWeather conditions Temperature, humidity, barometric pressure, and season enhance absorption
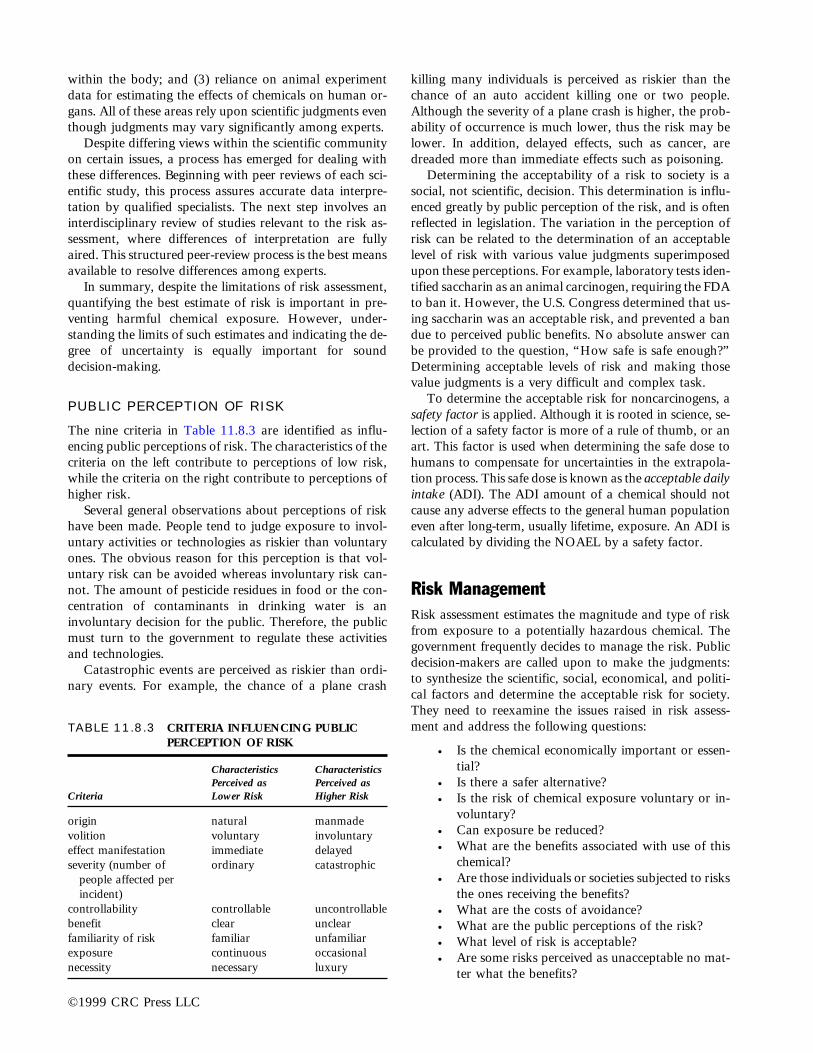
within the body; and (3) reliance on animal experimentdata for estimating the effects of chemicals on human or-gans. All of these areas rely upon scientific judgments eventhough judgments may vary significantly among experts.
Despite differing views within the scientific communityon certain issues, a process has emerged for dealing withthese differences. Beginning with peer reviews of each sci-entific study, this process assures accurate data interpre-tation by qualified specialists. The next step involves aninterdisciplinary review of studies relevant to the risk as-sessment, where differences of interpretation are fullyaired. This structured peer-review process is the best meansavailable to resolve differences among experts.
In summary, despite the limitations of risk assessment,quantifying the best estimate of risk is important in pre-venting harmful chemical exposure. However, under-standing the limits of such estimates and indicating the de-gree of uncertainty is equally important for sounddecision-making.
PUBLIC PERCEPTION OF RISK
The nine criteria in Table 11.8.3 are identified as influ-encing public perceptions of risk. The characteristics of thecriteria on the left contribute to perceptions of low risk,while the criteria on the right contribute to perceptions ofhigher risk.
Several general observations about perceptions of riskhave been made. People tend to judge exposure to invol-untary activities or technologies as riskier than voluntaryones. The obvious reason for this perception is that vol-untary risk can be avoided whereas involuntary risk can-not. The amount of pesticide residues in food or the con-centration of contaminants in drinking water is aninvoluntary decision for the public. Therefore, the publicmust turn to the government to regulate these activitiesand technologies.
Catastrophic events are perceived as riskier than ordi-nary events. For example, the chance of a plane crash
killing many individuals is perceived as riskier than thechance of an auto accident killing one or two people.Although the severity of a plane crash is higher, the prob-ability of occurrence is much lower, thus the risk may belower. In addition, delayed effects, such as cancer, aredreaded more than immediate effects such as poisoning.
Determining the acceptability of a risk to society is asocial, not scientific, decision. This determination is influ-enced greatly by public perception of the risk, and is oftenreflected in legislation. The variation in the perception ofrisk can be related to the determination of an acceptablelevel of risk with various value judgments superimposedupon these perceptions. For example, laboratory tests iden-tified saccharin as an animal carcinogen, requiring the FDAto ban it. However, the U.S. Congress determined that us-ing saccharin was an acceptable risk, and prevented a bandue to perceived public benefits. No absolute answer canbe provided to the question, “How safe is safe enough?”Determining acceptable levels of risk and making thosevalue judgments is a very difficult and complex task.
To determine the acceptable risk for noncarcinogens, asafety factor is applied. Although it is rooted in science, se-lection of a safety factor is more of a rule of thumb, or anart. This factor is used when determining the safe dose tohumans to compensate for uncertainties in the extrapola-tion process. This safe dose is known as the acceptable dailyintake (ADI). The ADI amount of a chemical should notcause any adverse effects to the general human populationeven after long-term, usually lifetime, exposure. An ADI iscalculated by dividing the NOAEL by a safety factor.
Risk ManagementRisk assessment estimates the magnitude and type of riskfrom exposure to a potentially hazardous chemical. Thegovernment frequently decides to manage the risk. Publicdecision-makers are called upon to make the judgments:to synthesize the scientific, social, economical, and politi-cal factors and determine the acceptable risk for society.They need to reexamine the issues raised in risk assess-ment and address the following questions:
• Is the chemical economically important or essen-tial?
• Is there a safer alternative?• Is the risk of chemical exposure voluntary or in-
voluntary?• Can exposure be reduced?• What are the benefits associated with use of this
chemical?• Are those individuals or societies subjected to risks
the ones receiving the benefits?• What are the costs of avoidance?• What are the public perceptions of the risk?• What level of risk is acceptable?• Are some risks perceived as unacceptable no mat-
ter what the benefits?
©1999 CRC Press LLC
TABLE 11.8.3 CRITERIA INFLUENCING PUBLICPERCEPTION OF RISK
Characteristics CharacteristicsPerceived as Perceived as
Criteria Lower Risk Higher Risk
origin natural manmadevolition voluntary involuntaryeffect manifestation immediate delayedseverity (number of ordinary catastrophic
people affected perincident)
controllability controllable uncontrollablebenefit clear unclearfamiliarity of risk familiar unfamiliarexposure continuous occasionalnecessity necessary luxury

Over the years, many laws have been enacted to protecthuman health, safety, and the environment, providing abasic framework for risk management decisions. Each lawreflects state-of-the-art understanding at the time of its en-actment, as well as the political concerns and the publicperceptions at that time. Regulators must make their de-cisions within the constraints of the applicable laws. Theselaws generally do not prescribe risk assessment method-ologies. However, many environmental laws do providevery specific risk management directives.
Statutory risk management mandates can be dividedinto roughly three categories: pure-risk; technology-basedstandards; and reasonableness of risks balanced with ben-efits.
PURE-RISK STANDARDS
Pure-risk standards, sometimes termed zero-risk, are man-dated or implied by only a few statutory provisions.Following are two examples of such standards:
The “Delaney clause” of the Federal Food, Drug, andCosmetic Act prohibits the approval of any food addi-tive that has been found to induce cancer in humans oranimals.
The provisions of the Clean Air Act pertaining to nationalambient air quality standards require standards forlisted pollutants that “protect the public health allow-ing an adequate margin of safety,” i.e., that assure pro-tection of public health without regard to technologyor cost factors.
TECHNOLOGY-BASED STANDARDS
Technology-based laws, such as parts of the Clean Air Actand the Clean Water Act, impose pollution controls basedon the best economically available or practical technology.Such laws tacitly assume that benefits accrue from the useof the medium (water or air) into which toxic or hazardoussubstances are discharged, and that complete eliminationof discharge of some human and industrial wastes intosuch media currently is not feasible. The basis for impos-ing these controls is to reduce human exposure, which in-directly benefits health and environment. The goal is toprovide an ample margin of safety to protect public healthand safety.
NO UNREASONABLE RISK
A number of statutes require balancing risks against ben-efits in making risk management decisions. Two examplesinclude:
The Federal Insecticide, Fungicide, and Rodenticide Act re-quires the EPA to register pesticides that will not cause“unreasonable adverse effects on environment.” The
phrase refers to “any unreasonable risks to man or theenvironment taking into account the economic, social,and environmental costs and benefits of the use of anypesticide.”
The Toxic Substances Control Act mandates that the EPAis to take action if a chemical substance “presents orwill present an unreasonable risk of injury to health orthe environment.” This includes considering the sub-stance’s effects on human health and the environment;the magnitude of human and environmental exposure;the benefits and availability of such substances for var-ious uses; and the reasonably ascertainable economicconsequences of the rule.The RCRA embodies both technology-based and pure-
risk-based standards. Congress and the EPA have at-tempted to craft RCRA regulations in pure-risk-based ra-tionales, but the large numbers of mixtures and the varietyof generator/source operations have made that approachexceedingly difficult. As a result, the RCRA focuses on thefollowing regulatory mechanisms:
• Identifying wastes that are hazardous to humanhealth and the environment, and capturing themin a cradle-to-grave management system
• Creating physical barriers to isolate the publicfrom contact with identified hazardous wastes
• Minimizing generation of hazardous wastes• Encouraging reuse, recycling, and treatment of
hazardous wastes• Providing secure disposal for wastes that cannot
otherwise be safely managed
—David H.F. Liu
ReferencesAmerican Conference of Governmental Industrial Hygienists. 1990.
Threshold limit values for chemical substances and physical agentsand biological exposure indices (BEIs). Cincinnati, Oh.
Enger, E.D., R. Kormelink, B.F. Smith, and Smith, R.J. 1989.Environmental science: the study of Interrelationships, Dubuque,Iowa: Wm. C. Brown Publishers.
Interagency Regulatory Liaison Group (IRLG). 1979. Scientific bases foridentification of potential carcinogens and estimation of risk. Journalof The Cancer Institute 63(1).
Nally, T.L. 1984. Chemical risk: a primer, Department of GovernmentRelations and Science Policy, American Chemical Society,Washington, D.C.
National Academy of Science (NAS). 1983. Risk Assessment in FederalGovernment: Managing the Process, Washington, D.C.: NationalAcademy Press.
Patton, D. 1993. The ABC of risk assessment, EPA Journal,February/March.
Sittig, M. 1985. Handbook of toxic and hazardous chemicals and car-cinogens, 2nd ed. Park Ridge, N.J.: Noyes Publications.
U.S. Department of Health and Human Services. 1990. Health assess-ment guidance manual. Published by the Agency for Toxic Substancesand Disease Registry. Atlanta, Ga.
U.S. Department of Health and Human Services, Registry of toxic effectsof chemical substances. Superintendent of Documents. Washington,D.C.: U.S. Government Printing Office.
©1999 CRC Press LLC

The first step in establishing a waste minimization strat-egy is to conduct a waste audit. The key question at theonset of a waste audit is “why is this waste present?” Theenvironmental engineer must establish the primary cause(s)of waste generation before seeking solutions.Understanding the primary cause is critical to the successof the entire investigation. The audit should be waste-stream oriented, producing specific options for additionalinformation or implementation. Once the causes are un-derstood, solution options can be formulated. An efficientmaterials and waste trucking system that allows compu-tation of mass balances is useful in establishing priorities.Knowing how much raw material is going into a plant andhow much is ending up as waste allows the engineer todecide which plant and which waste to address first.
The first four steps of a waste audit allow the engineerto generate a comprehensive set of waste management op-tions. These should follow the hierarchy of source reduc-tion first, waste exchange second, recycling third, and treat-ment last.
In the end, production may be abandoned because theproduct or resulting by-product poses an economic haz-ard that the corporation is not willing to underwrite. Theseinclude cases where extensive testing to meet the TSCA(Toxic Substance Control Act) is required. Other suchcases include the withdrawal of pre-manufacturing noticeapplications for some phthalate esters processes, and thediscontinuation of herbicide and pesticide productionwhere dioxin is a by-product.
Source Reduction and ControlINPUT MATERIALS
Source control investigations should focus on changes toinput materials, process technology, and the human aspectof production. Input material changes can be classified intothree elements: purification, substitution, and dilution.
Purification of input materials prevents inert or impurematerials from entering the production process. Such im-purities cause waste because the process must be purgedto prevent undesirable accumulation. Examples of purifiedinput materials include diionized water in electroplatingand oxygen instead of air in oxychlorination reactors forethylene dichloride production.
Substitution involves replacing a toxic material with aless toxic or more environmentally desirable material.Industrial applications of substitution include: using phos-phates instead of dichromates as cooling water corrosion
inhibitors; using alkaline cleaners instead of chlorinatedsolvents for degreasing; using solvent-based inks insteadof water-based inks; and replacing cyanide cadmium plat-ing bath with noncyanide bath.
Dilution is a minor component of input materialchanges. An example of dilution is the use of a more di-lute solution to minimize dragouts in metal parts cleaning.
TECHNOLOGY CHANGES
Technology changes are made to the physical plant.Examples include process changes; equipment, piping orlayout changes; changes to operating settings; additionalautomation; energy conservation; and water conservation.
Process Change
Innovative technology is often used to develop newprocesses to achieve the same products, while reducingwaste. Process redesign includes alteration of existingprocesses by adding new unit operations or implementa-tion of new technology to replace outmoded operations.For example, a metal manufacturer modified a process touse a two-stage abrasive cleaner and eliminated the needfor a chemical cleaning bath.
A classic example of a process change is the staged useof solvent. An electronics firm switched from using threedifferent solvents—mineral spirits for machine parts, per-chloroethylene for computer housings, and a fluorocar-bon-mineral blend for printed circuit boards—to a singlesolvent system. Currently, fresh solvent is used for theprinted circuit boards, then reused to degrease the com-puter housings, and finally, to degrease the machine parts.This practice not only reduces solvent consumption andwaste, it eliminates potential cross-contamination of sol-vents, regenerates a single stream for recycling, and sim-plifies safety and operating procedures (U.S. EPA 1989).
Equipment, Piping, or Layout Changes
Equipment changes can reduce waste generation by re-ducing equipment–related inefficiencies. The capital re-quired for more efficient equipment is justified by higherproductivity, reduced raw material costs, and reducedwaste materials costs. Modifications to certain types ofequipment can require a detailed evaluation of processcharacteristics. In this case, equipment vendors should beconsulted for information on the applicability of equip-
©1999 CRC Press LLC
11.9WASTE MINIMIZATION AND REDUCTION
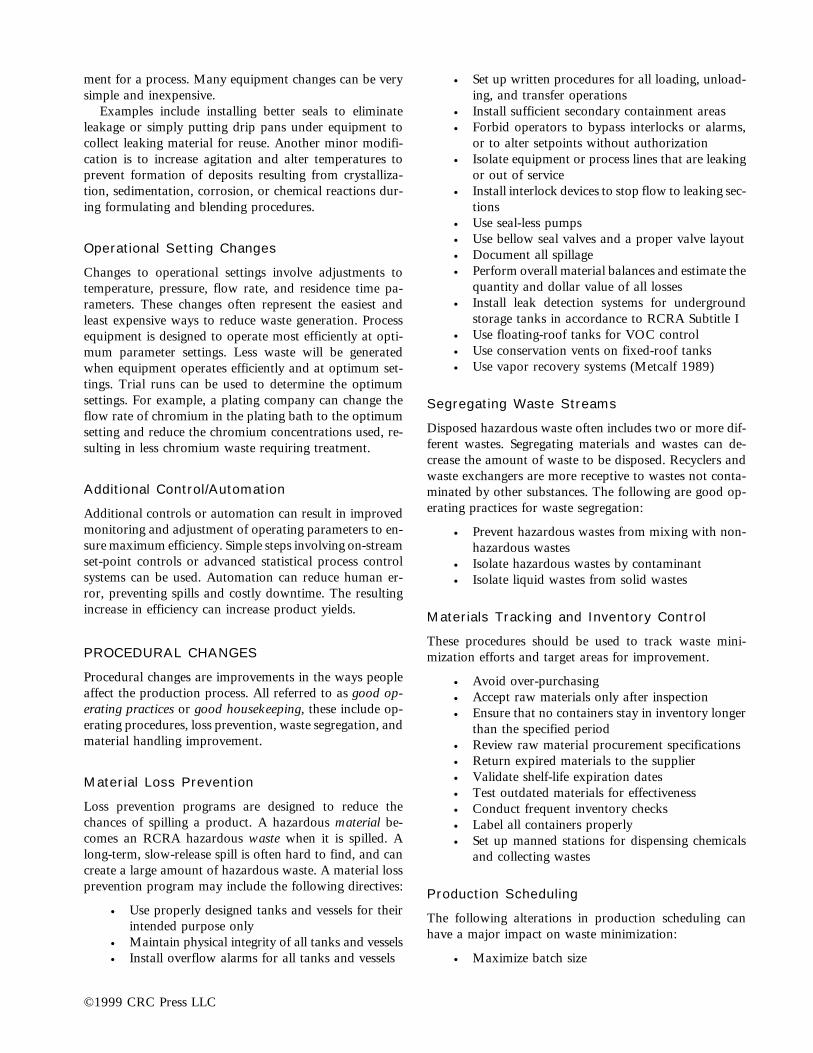
ment for a process. Many equipment changes can be verysimple and inexpensive.
Examples include installing better seals to eliminateleakage or simply putting drip pans under equipment tocollect leaking material for reuse. Another minor modifi-cation is to increase agitation and alter temperatures toprevent formation of deposits resulting from crystalliza-tion, sedimentation, corrosion, or chemical reactions dur-ing formulating and blending procedures.
Operational Setting Changes
Changes to operational settings involve adjustments totemperature, pressure, flow rate, and residence time pa-rameters. These changes often represent the easiest andleast expensive ways to reduce waste generation. Processequipment is designed to operate most efficiently at opti-mum parameter settings. Less waste will be generatedwhen equipment operates efficiently and at optimum set-tings. Trial runs can be used to determine the optimumsettings. For example, a plating company can change theflow rate of chromium in the plating bath to the optimumsetting and reduce the chromium concentrations used, re-sulting in less chromium waste requiring treatment.
Additional Control/Automation
Additional controls or automation can result in improvedmonitoring and adjustment of operating parameters to en-sure maximum efficiency. Simple steps involving on-streamset-point controls or advanced statistical process controlsystems can be used. Automation can reduce human er-ror, preventing spills and costly downtime. The resultingincrease in efficiency can increase product yields.
PROCEDURAL CHANGES
Procedural changes are improvements in the ways peopleaffect the production process. All referred to as good op-erating practices or good housekeeping, these include op-erating procedures, loss prevention, waste segregation, andmaterial handling improvement.
Material Loss Prevention
Loss prevention programs are designed to reduce thechances of spilling a product. A hazardous material be-comes an RCRA hazardous waste when it is spilled. Along-term, slow-release spill is often hard to find, and cancreate a large amount of hazardous waste. A material lossprevention program may include the following directives:
• Use properly designed tanks and vessels for theirintended purpose only
• Maintain physical integrity of all tanks and vessels• Install overflow alarms for all tanks and vessels
• Set up written procedures for all loading, unload-ing, and transfer operations
• Install sufficient secondary containment areas• Forbid operators to bypass interlocks or alarms,
or to alter setpoints without authorization• Isolate equipment or process lines that are leaking
or out of service• Install interlock devices to stop flow to leaking sec-
tions• Use seal-less pumps• Use bellow seal valves and a proper valve layout• Document all spillage• Perform overall material balances and estimate the
quantity and dollar value of all losses• Install leak detection systems for underground
storage tanks in accordance to RCRA Subtitle I• Use floating-roof tanks for VOC control• Use conservation vents on fixed-roof tanks• Use vapor recovery systems (Metcalf 1989)
Segregating Waste Streams
Disposed hazardous waste often includes two or more dif-ferent wastes. Segregating materials and wastes can de-crease the amount of waste to be disposed. Recyclers andwaste exchangers are more receptive to wastes not conta-minated by other substances. The following are good op-erating practices for waste segregation:
• Prevent hazardous wastes from mixing with non-hazardous wastes
• Isolate hazardous wastes by contaminant• Isolate liquid wastes from solid wastes
Materials Tracking and Inventory Control
These procedures should be used to track waste mini-mization efforts and target areas for improvement.
• Avoid over-purchasing• Accept raw materials only after inspection• Ensure that no containers stay in inventory longer
than the specified period• Review raw material procurement specifications• Return expired materials to the supplier• Validate shelf-life expiration dates• Test outdated materials for effectiveness• Conduct frequent inventory checks• Label all containers properly• Set up manned stations for dispensing chemicals
and collecting wastes
Production Scheduling
The following alterations in production scheduling canhave a major impact on waste minimization:
• Maximize batch size
©1999 CRC Press LLC

• Dedicate equipment to a single product• Alter batch sequencing to minimize cleaning fre-
quency (light-to-dark batch sequence, for example)• Schedule production to reduce cleaning frequency
Preventive Maintenance
These programs cut production costs and decrease equip-ment downtime, in addition to preventing waste releasedue to equipment failure.
• Use equipment data cards on equipment location,characteristics, and maintenance
• Maintain a master preventive maintenance (PM)schedule
• Maintain equipment history cards• Maintain equipment breakdown reports• Keep vendor maintenance manuals handy• Maintain a manual or computerized repair history
file
Cling
The options for minimizing wastes that cling to contain-ers include:
• Use large containers instead of small condenserswhenever possible
• Use containers with a one-to-one height-to-diam-eter ratio to minimize wetted area
• Empty drums and containers thoroughly beforecleaning or disposal
PRODUCT CHANGES
Product Substitution
Changing the design, composition, or specifications of endproducts allows fundamental change in the manufactur-ing process or in the end use of raw materials. This canlead directly to waste reduction. For example, the manu-facture of water-based paints instead of solvent-basedpaints involves no hazardous toxic solvents. In addition,the use of water-based paints reduces volatile organic emis-sions to the atmosphere.
Product Reformulation
Product reformulation or composition changes involvesreducing the concentration of hazardous substances orchanging the composition so that no hazardous substancesare present. Reformulating a product to contain less haz-ardous material reduces the amount of hazardous wastegenerated throughout the product’s lifespan. Using a lesshazardous material within a process reduces the overallamount of hazardous waste produced. For example, a
company can use nonhazardous solvents in place of chlo-rinated solvents.
Dow Chemical Company achieved waste reductionthrough changes in product packaging. A wettable pow-der insecticide, widely used in landscape maintenance andhorticulture, was originally sold in 2-lb metal cans. Thecans had to be decontaminated before disposal, creating ahazardous waste. Dow now packages the product in 4-ozwater-soluble packages which dissolve when the productis mixed with water for use (U.S. Congress 1986).
Product Conservation
One of the most successful methods of product conserva-tion is the effective management of inventory with specificshelf-lives. The Holston Army Ammonium Plant reducedwaste pesticide disposal from 440 to 0 kg in one year bybetter management of stocks (Mill 1988).
WASTE EXCHANGE
Waste exchange is a reuse function involving more thanone facility. An exchange matches one industry’s outputto the input requirement of another. Waste exchange or-ganizations act as brokers of hazardous materials by pur-chasing and transporting them as resources to anotherclient. Waste exchanges commonly deal in solvents, oils,concentrated acids and alkalis, and catalysts. Limitationsinclude transport distance, purity of the exchange prod-uct, and reliability of supply and demand.
Waste exchanges were first implemented and are nowfairly common in Europe; there are few in the U.S.Although more exchanges have recently been set up in thiscountry, they are not widely accepted because of liabilityconcerns. Even when potential users of waste are found,they must be located fairly close to the generator. Wastetransportation requires permits and special handling, in-creasing the cost.
Recycling and ReuseRecycling techniques allow reuse of waste materials forbeneficial purposes. A recycled material is used, reused, orreclaimed [40 CFR §261.1 (c)(7)]. Recycling through useor reuse involves returning waste material to the originalprocess as a substitute for an input material, or to anotherprocess as an input material. Recycling through reclama-tion involves processing a waste for recovery of a valuablematerial or for regeneration. Recycling can help eliminatewaste disposal costs, reduce raw material costs, and pro-vide income from saleable waste.
Recycling is the second option in the pollution preven-tion hierarchy and should be considered only when allsource reduction options have been investigated and im-plemented. Recycling options are listed in the followingorder:
©1999 CRC Press LLC

• Direct reuse on-site• Additional recovery on-site• Recovery off-site• Sale for reuse off-site (waste exchange)
It is important to note that recycling can increase a gen-erator’s risk or liability as a result of the associated mate-rial handling and management. Recycling effectiveness de-pends upon the ability to separate recoverable waste fromother process waste.
DIRECT ON-SITE REUSE
Reuse involves finding a beneficial purpose for a recov-ered waste. Three factors to consider when determiningthe potential for reuse are:
• The chemical composition of the waste and its ef-fect on the reuse process
• The economic value of the reuse waste andwhether this justifies modifying a process to ac-commodate it
• The availability and consistency of the waste tobe reused
• Energy recovery
For example, a newspaper advertising printer purchased arecycling unit to produce black ink from various wasteinks. Blending different colors of ink with fresh black inkand black toner, the unit creates black ink. This mixtureis filtered to remove flakes of dried ink, and is used in lieuof fresh black ink. The need to ship waste ink for offsitedisposal is eliminated. The price of the recycling unit wasrecovered in nine months, based on savings in fresh inkpurchases and costs of waste ink disposal (U.S. EPA 1989).
In another example, an oil skimmer in a holding tankenables annual capture and recycling of 3000 gallons ofwaste oil from 30,000 gallons of oily waste water disposedto waste landfills. (Metcalf 1989).
ADDITIONAL ON-SITE RECOVERY
Recycling alternatives can be accomplished either on-siteor off-site and may depend on a company’s staffing or eco-nomic constraints. On-site recycling alternatives result inless waste leaving a facility. The disadvantages of on-siterecycling lie in the capital outlay for recycling equipment,the need for operator training, and additional operatingcosts. In some cases, the waste generated does not war-rant the installation costs for in-plant recycling systems.However, since on-site alternatives do not involve trans-portation of waste materials and the resulting liabilities,they are preferred over off-site alternatives.
For instance, sand used in casting processes at foundriescontains heavy metal residues such as copper, lead, andzinc. If these concentrations exceed Toxicity Characteris-
tics Leaching Procedure (TCLP) standards, the sand is ahazardous waste. Recent experiments demonstrated that95% of the copper could be precipitated and recovered(McCoy and Associates 1989). In another example, a pho-toprocessing company uses an electrolytic deposition cellto recover silver from rinse water used in film processingequipment. By removing the silver from the wastewater,the wastewater can be discharged to the sewer withoutadditional pretreatment.
OFFSITE RECOVERY
If the amount of waste generated on-site is insufficient fora cost-effective recovery system, or if the recovered mate-rial cannot be reused on-site, off-site recovery is preferable.Materials commonly reprocessed off-site are oils, solvents,electroplating sludges and process baths, scrap metal, andlead-acid batteries. The cost of off-site recycling dependsupon the purity of the waste and the market for the re-covered materials.
The photoprocessing company mentioned above alsocollects used film and sells it to a recycler. The recyclerburns the film and collects the silver from residual ash. Byremoving the silver from the ash, the fly ash becomes non-hazardous (EPA 1989).
SALE FOR REUSE OFF-SITE
See the preceding discussions on waste exchange. The mostcommon reuses of hazardous waste include wastewaterused for irrigation and oil field pressurization; sludges usedas fertilizers or soil matrix; and sulfuric acid from smelters.
Recycling methods, including numerous physical, chem-ical and biological technologies will be discussed inSection(s) 11.15 and 11.18.
—David H.F. Liu
ReferencesCode of Federal Regulations, Title 40, sec. 261.1.McCoy and Associates, Inc. 1989. The hazardous waste consultant.
(March-April).Metcalf, C., ed. 1989. Waste reduction assessment and technology trans-
fer (WRATT) training manual. The University of Tennessee Centerfor Industrial Services. Knoxville, Tenn.
Mill, M.B. 1988. Hazardous waste minimization in the manufacture ofexplosives, in Hazardous waste minimization in the department ofdefense. Edited by J.A. Kaminski. Office of the Deputy AssistantSecretary of Defense (Environment). Washington, D.C.
U.S. Congress, Office of Technology Assessment. 1986. Serious reduc-tion of hazardous waste. Superintendent of Documents. Washington,D.C.: Government Printing Office.
U.S. Environmental Protection Agency (EPA). 1989. Waste minimizationin metal parts cleaning. Office of Solid Waste and EmergencyResponse, Report No. EPA/530-SW-89-049. Washington, D.C.
©1999 CRC Press LLC

The EPA’s cradle-to-grave hazardous waste managementsystem attempts to track hazardous waste from generationto ultimate disposal. The system requires generators to es-tablish a manifest or itemized list form for hazardous wasteshipments. This procedure is designed to ensure that wastesare direct to, and actually reach, permitted disposal sites.
Generator RequirementsThe generator is the first element of the RCRA cradle-to-grave concept, which includes generators, transporters,
treatment plants, storage facilities, and disposal sites.Generators of more than 100 kg of hazardous waste or 1kg of acutely hazardous waste per month must, with a fewexceptions, comply with all generator regulations.
Hazardous waste generators must comply with all DOTlegislation regulating transport of hazardous materials, aswell as other hazardous waste regulations promulgated byboth DOT and the EPA. Table 11.10.1 summarizes therequirements, indicates the agency responsible for compli-ance, and provides a reference to the Code of FederalRegulations.
©1999 CRC Press LLC
11.10HAZARDOUS WASTE TRANSPORTATION
TABLE 11.10.1 EPA AND DOT HAZARDOUS WASTE TRANSPORTATION REGULATIONS
Required of Agency Code of Federal Regulations
Generator/Shipper1. Determine if waste is hazardous according to EPA listing EPA 40 CFR 261 and 262.11
criteria2. Notify EPA and obtain I.D. number; determine that trans- EPA 40 CFR 262.12
porter and designated treatment, storage, or disposal facil-ity have I.D. numbers
3. Identify and classify waste according to DOT Hazardous DOT 49 CFR 172.101Materials Table and determine if waste is prohibited fromcertain modes of transport
4. Comply with all packaging, marking, and labeling require- EPA 40 CFR 262.32 (b),ments
DOT 49 CFR 173,49 CFR 172, subpart D, and49 CFR 172, subpart E
5. Determine whether additional shipping requirements DOT 49 CFR 174–177must be met for the mode of transport used.
6. Complete a hazardous waste manifest EPA 40 CFR 262, subpart B7. Provide appropriate placards to transporter DOT 49 CFR 172, subpart F8. Comply with record-keeping and reporting requirements EPA 40 CFR 262, subpart D
Transporter/Carrier1. Notify EPA and obtain I.D. number EPA 40 CFR 263.112. Verify that shipment is properly identified, packaged, DOT 49 CFR 174–177
marked, and labeled and is not leaking or damaged3. Apply appropriate placards DOT 49 CFR 172.5064. Comply with all manifest requirements (e.g., sign the DOT 49 CFR 174–177
manifest, carry the manifest, and obtain signature from next EPA 40 CFR 263.20transporter or owner/operator of designated facility)
5. Comply with record-keeping and reporting requirements EPA 50 CFR 263.226. Take appropriate action (including cleanup) in the event EPA 40 CFR 263.30–31
of a discharge and comply with the DOT incident reporting DOT 49 CFR 171.15–17requirements
Source: Reprinted from U.S. Environmental Protection Agency.

The regulatory requirements for hazardous waste gen-erators contained in 40 CFR Part 262 include:
• Obtaining an EPA ID number• Proper handling of hazardous waste before trans-
port• Establishing a manifest of hazardous waste• Recordkeeping and reporting
EPA ID NUMBER
The EPA and primacy states monitor and track generatoractivity by an identification number to each generator.Without this number, the generator is barred from treat-ing, storing, disposing of, transporting, or offering fortransportation any hazardous waste. Furthermore, the gen-erator is forbidden from offering the hazardous waste toany transporter, or treatment, storage, or disposal (TSD)facility that does not also have an EPA ID number.Generators obtain ID numbers by notifying the EPA ofhazardous waste activity, using the standard EPA notifi-cation form.
PRETRANSPORT REGULATIONS
Pretransport regulations are designed to ensure safe trans-portation of a hazardous waste from origin to ultimatedisposal; to minimize the environmental and safety impactsof accidental releases; and to facilitate control of any re-leases that may occur during transportation. In develop-ing these regulations, the EPA adopted those used by theDepartment of Transportation (DOT) for transportinghazardous materials (49 CFR 172, 173, 178 and 179).These DOT regulations require:
Proper packaging to prevent hazardous waste leakage un-der normal or potentially dangerous transport condi-tions such as when a drum of waste falls from a truckor loading dock;
Labeling, marking, or placarding of the package to iden-tify characteristics and dangers associated with thewaste.
These pretransport regulations apply only to generatorsshipping waste off-site.
Briefly, individual containers are required to display“Hazardous Waste” markings, including the proper DOTshipping name, using the standardized language of 49 CFRSections 172.101 and .102. The labels on individual con-tainers must display the correct hazard class as prescribedby Subpart E of Part 172. Examples of DOT labels andplacards are shown in Figures 11.10.1 and 11.10.2.Placards are important in case of accidents because theyare highly visible. Efforts are now in progress for interna-tional adoption of hazardous marking, labeling and plac-arding conventions.
WASTE ACCUMULATION
A generator may accumulate hazardous waste on-site for90 days or less, provided the following requirements aremet:
Proper Storage. The waste must be properly stored in con-tainers or tanks marked “Hazardous Waste” with thedate accumulation began.
Emergency Plan. A contingency plan and emergency pro-cedures are developed. Generators must have a writtenemergency plan.
Personnel Training. Facility personnel must be trained inthe proper handling of hazardous waste.
The 90-day period allows more cost effective transporta-tion. Instead of paying to haul several small shipments ofwaste, the generator can accumulate enough for one bigshipment.
©1999 CRC Press LLC
BLASTING AGENTEXPLOSIVE CEXPLOSIVE BEXPLOSIVE A
1 1 1
POISON GAS
2
FLAMMABLE GAS
2
FLAMMABLE LIQUID
4
DANGEROUS
4
WHENWET
CHLORINE
2
NON-FLAMMABLE GAS
2
POISON
6
IRRITANT
6
7
RADIOACTIVE III
7
RADIOACTIVE II
7
RADIOACTIVE I
OXYGEN
OXIDIZER ORGANIC PEROXIDE
2
5 5
FLAMMABLE SOLID
3
BIOMEDICALMATERIAL
6
MAGNETIZEDMATERIAL
KEEP AWAY FROM AIRCRAFT COMPASS
N
E
S
W
DO NOT LOAD IN PASSENGER AIRCRAFT
DANGER
CORROSIVE
8
FIG. 11.10.1 DOT labels for hazardous materials packages.Source: Reprinted from U.S. Department of Transportation.

If hazardous waste is accumulated on-site for more than90 days, the generator is considered an operator of a stor-age facility and becomes subject to Subtitle C requirementsincluding permitting. Under temporary, unforeseen, or un-controllable circumstances, the 90-day period may be ex-tended for up to 30 days by the EPA Regional Adminis-trator on a case-by-case basis.
Small quantity generators (SQGs), defined as those pro-ducing 100–1000 kg of hazardous waste per month, areaccorded an exception to this 90-day accumulation period.The Hazardous and Solid Waste Amendments (HSWA)require, and the EPA developed, regulations allowing suchgenerators to accumulate waste for 180 days, or 270 daysif waste must be shipped over 200 miles, before SQGs areconsidered to be operating a storage facility.
THE MANIFEST
The Uniform Hazardous Waste Manifest is the key to thecradle-to-grave management system (Figure 11.10.3).Using the manifest, generators and regulators can track themovement of hazardous waste from the point of genera-tion to the point of ultimate treatment, storage, or disposal(TSD).
The HSWA requires manifests to certify that generatorshave programs in place to reduce waste volume and tox-icity to the degree the generator determines economicallypracticable. In addition, the treatment, storage, or disposalmethod chosen by the generator must be the best methodcurrently available to minimize risks to human health andthe environment.
Generators must prepare manifests properly since theyare responsible for the production and ultimate disposi-tion of hazardous wastes. Some common mistakes foundon manifests are (Turner 1992):
Omission of the 24-hr emergency response telephone num-ber. As of December 31, 1990, the DOT required in-clusion of a 24-hr telephone number for use if an inci-dent should occur during transportation. Shippers andcarriers should look closely at this section to ensure itsproper completion.
Omission of the manifest document number. Many gen-erators use this control number to indicate the numberof shipments made during a specified period. Othersuse it to indicate shipments from a specific section oftheir facility.
Misunderstanding of the generator name and mailing ad-dress. The address listed should be the location man-aging the return manifest form. The 12-digit EPA iden-tification number is site specific in that it is assigned tothe physical location where the hazardous waste is gen-erated.
Improper entry of shipping name, hazard class or UN/NAnumbers. 49 CFR Sec. 172.202 specifies the proper or-der for entering a basic description on a shipping doc-ument. The technical or chemical group names may beentered in parentheses between the proper shippingname and hazard class.
The manifest is part of a controlled tracking system. Eachtime waste is transferred from a transporter to a desig-nated facility or to another transporter, the manifest mustbe signed to acknowledge receipt of the waste. A copy ofthe manifest is retained by each link in the transportationchain. Once the waste is delivered to the designated facil-ity, the owner or operator of the facility must send a copyof the manifest back to the generator. This system ensuresthat the generator has documentation that the hazardouswaste has reached its destination.
The multiple-copy manifest is initially completed andsigned by the hazardous waste generator. The genera-tor retains Part 6 of the manifest, sends Part 5 to theEPA or the appropriate state agency, and provides theremainder to the transporter. The transporter retainsPart 4 of the manifest and gives the remaining parts tothe TSD facility upon arrival. The TSD facility retainsPart 3 and sends Parts 1 and 2 to the generator and theregulatory agency, or agencies, respectively. Throughoutthis transition, the hazardous waste shipment is gener-
©1999 CRC Press LLC
FIG. 11.10.2 DOT placards for hazardous substances.(Source: Reprinted from U.S. Department of Transportation.)
BLASTINGAGENTS
EXPLOSIVESB
EXPLOSIVESA
1 1
POISONGAS
2
FLAMMABLEGAS
2
COMBUSTIBLE
3
CHLORINE
2
NON-FLAMMABLEGAS
2
POISON
6
7
RADIOACTIVE
OXYGEN
OXIDIZER ORGANICPEROXIDE
2
5 55
CORROSIVE
8
FLAMMABLE
3
FLAMMABLESOLID
3
1
FLAMMABLESOLID
W
DANGEROUS
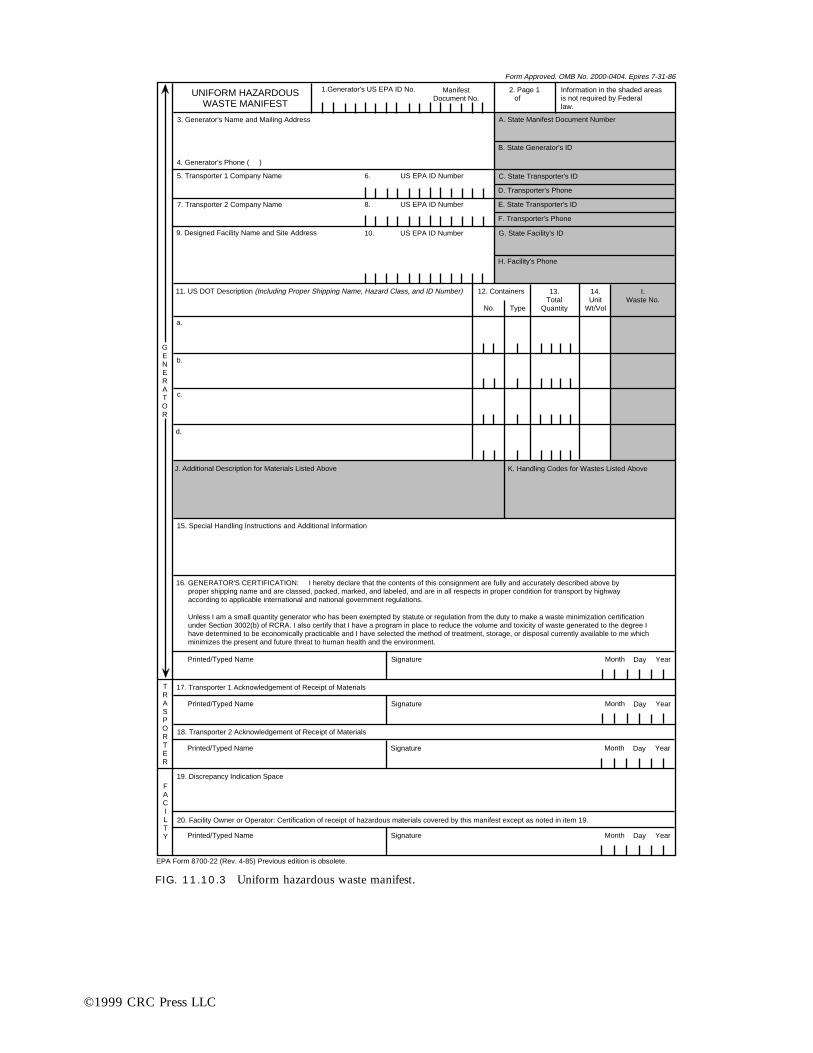
©1999 CRC Press LLC
FIG. 11.10.3 Uniform hazardous waste manifest.
UNIFORM HAZARDOUSWASTE MANIFEST
1.Generator's US EPA ID No. ManifestDocument No.
2. Page 1of
Information in the shaded areasis not required by Federallaw.
3. Generator's Name and Mailing Address
4. Generator's Phone ( )
5. Transporter 1 Company Name 6. US EPA ID Number
7. Transporter 2 Company Name
9. Designed Facility Name and Site Address
A. State Manifest Document Number
B. State Generator's ID
C. State Transporter's ID
11. US DOT Description (Including Proper Shipping Name, Hazard Class, and ID Number) 12. Containers
No. Type
13.Total
Quantity
14.Unit
Wt/Vol
I.Waste No.
a.
b.
c.
d.
J. Additional Description for Materials Listed Above K. Handling Codes for Wastes Listed Above
15. Special Handling Instructions and Additional Information
16. GENERATOR'S CERTIFICATION: I hereby declare that the contents of this consignment are fully and accurately described above by proper shipping name and are classed, packed, marked, and labeled, and are in all respects in proper condition for transport by highway according to applicable international and national government regulations.
Unless I am a small quantity generator who has been exempted by statute or regulation from the duty to make a waste minimization certificationunder Section 3002(b) of RCRA. I also certify that I have a program in place to reduce the volume and toxicity of waste generated to the degree Ihave determined to be economically practicable and I have selected the method of treatment, storage, or disposal currently available to me whichminimizes the present and future threat to human health and the environment.
Printed/Typed Name Signature Month Day Year
17. Transporter 1 Acknowledgement of Receipt of Materials
18. Transporter 2 Acknowledgement of Receipt of Materials
19. Discrepancy Indication Space
20. Facility Owner or Operator: Certification of receipt of hazardous materials covered by this manifest except as noted in item 19.
FACILTY
TRASPORTER
D. Transporter's Phone
E. State Transporter's ID
F. Transporter's Phone
G. State Facility's ID
H. Facility's Phone
8. US EPA ID Number
10. US EPA ID Number
Printed/Typed Name Signature Month Day Year
Printed/Typed Name Signature Month Day Year
Printed/Typed Name Signature Month Day Year
GENERATOR
Form Approved. OMB No. 2000-0404. Epires 7-31-86
EPA Form 8700-22 (Rev. 4-85) Previous edition is obsolete.

ally considered to be in the custody of the last signa-tory on the manifest.
If 35 days pass from the date when the waste was ac-cepted by the initial transporter and the generator has notreceived Part 1 of the manifest form from the designatedfacility, the generator must contact the transporter or thedesignated facility to determine the whereabouts of thewaste. If 45 days pass and the manifest still has not beenreceived, the generator must file an exception report withthe EPA regional office. The report must detail the effortsof the generator to locate the waste, and the results of theseefforts.
RECORDKEEPING AND REPORTING
Generators are subject to extensive recordkeeping and re-porting requirements by 40 CFR Part 262, Subpart D.Generators who transport hazardous wastes off site mustsubmit an annual report to the EPA regional administra-tor on EPA form 8700-13A. This report covers generatoractivities during the previous year, and requires detailedaccounting of wastes generated and their disposition.Generators must keep copies of each signed manifest for3 years from the date signed, copies of each exception re-port, each annual report, copies of analyses, and relateddeterminations made in accord with generator regulations(40 CFR Part 262).
Generators that treat, store, or dispose of their haz-ardous waste on-site must also notify the EPA of hazardouswaste activity, obtain an EPA ID, apply for a permit, andcomply with permit conditions. They too must submit anannual report containing a description of the type andquantity of hazardous waste handled during the year, andthe method(s) of treatment, storage, or disposal used.
EXPORT AND IMPORT OF HAZARDOUSWASTE
Export of hazardous waste from the U.S. to another coun-try is prohibited unless:
• Notification of intent to export has been providedto the EPA at least 60 days in advance of ship-ment;
• The receiving country has consented to accept thewaste;
• A copy of the EPA “Acknowledgment of Consent”accompanies the shipments; and
• The hazardous waste shipment conforms to theterms of the receiving country’s consent (40 CFR§262.52).
Any import of hazardous waste from another country intothe U.S. must comply with the requirements of 40 CFRPart 262, i.e., the importer becomes the generator, forRCRA regulatory purposes.
Transporters and CarriersHAZARDOUS MATERIALSTRANSPORTATION ACT AND OTHERREGULATIONS
Transporters of hazardous waste are the critical link be-tween the generator and the ultimate off-site treatment,storage, or disposal of hazardous waste. Transporterregulations were developed jointly by the EPA and DOTto avoid contradictory requirements. Although the reg-ulations are integrated, they are not contained under thesame act. A transporter must comply with regulationsunder 49 CFR Parts 171–179, The Hazardous MaterialsTransportation Act, and 40 CFR Part 263 (Subtitle Cof RCRA).
A transporter is defined under RCRA as any person orfirm engaged in the off-site transportation of hazardouswaste within the United States, if such transportation re-quires a manifest under 40 CFR Part 262. This definitioncovers transport by air, highway, or water. Transporterregulations do not apply to on-site transportation of haz-ardous waste by generators with their own TSDs, or TSDstransporting waste within a facility. However, generatorsand TSD owners or operators must avoid transportingwaste over public roads that pass through or alongsidetheir facilities (Figure 11.10.4).
Under certain circumstances a transporter may be sub-ject to regulatory requirements other than those containedin 40 CFR Post 263. Once a transporter accepts hazardouswaste from a generator or another transporter, the trans-porter can store it for up to 10 days without being sub-ject to any new regulations. However, if storage time ex-ceeds 10 days, the transporter is considered to be operatinga storage facility and must comply with the regulations forsuch a facility. In addition, transporters who bring haz-ardous waste into the United States or mix hazardouswastes of different DOT shipping descriptions by placing
©1999 CRC Press LLC
GeneratorMay Not . . .
Collection Point
Public Roadway
Satellite Accumulation Point
FIG. 11.10.4 Off-site transportation of hazardous waste.

them in the same container are classified as generators andmust comply with the generator regulations.
A transporter is subject to regulations including ob-taining an EPA ID number, complying with the manifestsystem, and dealing with hazardous waste discharges.
The transporter is required to deliver the entire quan-tity of waste accepted from either the generator or anothertransporter to the facility designated on the manifest. If thewaste cannot be delivered as the manifest directs, the trans-porter must inform the generator and receive further in-structions, such as returning the waste or taking it to an-other facility. Before handing the waste over to a TSD, thetransporter must have the TSD facility operator sign anddate the manifest. One copy of the manifest remains at theTSD facility while the other stays with the transporter. Thetransporter must retain a copy of the manifest for threeyears from the date the hazardous waste was accepted.
Even if generators and transporters of hazardous wastecomply with all appropriate regulations, transporting haz-ardous waste can still be dangerous. There is always thepossibility of an accident. To deal with this possibility, reg-ulations require transporters to take immediate action toprotect health and the environment if a release occurs bynotifying local authorities and/or closing off the dischargearea.
The regulations also give officials special authority todeal with transportation accidents. Specifically, if a fed-eral, state, or local official, with appropriate authority, de-termines that immediate removal of the waste is necessaryto protect human health or the environment, the officialcan authorize waste removal by a transporter without anEPA ID or a manifest.
MODES OF TRANSPORT
A 1981 report, prepared for the EPA, estimated that 96%of the 264 million tn of hazardous wastes generated each
year were disposed at the site where they were generated.By 1989, the National Solid Wastes Management Asso-ciation (NSWMA 1989) stated that trucks traveling overpublic highways move over 98% of hazardous wastes thatare treated off-site. Another perspective can be gained fromstatistics for hazardous materials transportation. Rail trans-portation moves about 8% of the hazardous materialsshipped, but 57% of the ton-miles of hazardous materialsshipped (U.S. Office of Technology Assessment 1986).
The highway transport mode is regarded as the mostversatile, and is the most widely used. Tank trucks can ac-cess most industrial sites and TSD facilities. Rail shippingrequires expensive sidings, and is suitable for very largequantity shipments. Cargo tanks are the main carriers ofbulk hazardous materials; however, large quantities of haz-ardous wastes are shipped in 55-gal drums.
Cargo tanks are the main carriers of bulk hazardousmaterials over roads. Cargo tanks are usually made of steelor aluminum alloy, or other materials such as titanium,nickel, or stainless steel. They range in capacity from 4,000to 12,000 gal. Federal road weight laws usually limit mo-tor vehicle weights to 80,000 lb gross. Table 11.10.2 listsDOT cargo tank specifications for bulk shipment of com-mon hazardous materials and example cargos.
As stated above, rail shipments account for about 8%of the hazardous materials transported annually, withabout 3,000 loads each day. However, the proportion ofhazardous waste shipments is unknown.
The major classifications of rail tank cars are pressureand nonpressure (for transporting both gases and liquids).Both categories have several subclasses, which differ in testpressure, presence or absence of bottom discharge valves,type of pressure relief system, and type of thermal shield-ing. Ninety percent of tank cars are steel; aluminum is alsocommon.
DOT tank car design specifications are detailed in 49CFR Part 179. Rail car specification numbers for trans-
©1999 CRC Press LLC
TABLE 11.10.2 CARGO TANK TABLE
Cargo Tank Types ofSpecification Number Commodities Carried Examples
MC-306 (MC-300, 301, 302, 303, 305)a Combustible and flammable Fuel oil, gasolineliquids of lowvapor pressure
MC-307 (MC-304) Flammable liquids, Poison B Toluene, diisocyanatematerials with moderatevapor pressure
MC-312 (MC-310, 311) Corrosives Hydrochloric acid,caustic solution
MC-331 (MC-330) Liquified compressed gases Chlorine, anhydrousammonia
MC-338 Refrigerated liquified gases Oxygen, methane
aThe numbers in parentheses designate older versions of the specifications; the older versions may continue in service but all newly constructed cargo tanks mustmeet current specifications. (Source: Code of Federal Regulations, Title 49, sections 172.101 and 178.315–178.343).

porting pressurized hazardous materials are DOT 105,112, and 114 (Table 11.10.3); for unpressurized ship-ments the numbers are DOT 103, 104, and 111 (Table11.10.4). Specifications call for steel jacket plate and thick-ness ranging from 11 ga (approximately 1/8 in.) to 3/4 in andaluminum jacket plate thickness of 1/2 to 5/8 in. Capacitiesfor tank cars carrying hazardous materials are limited to34,500 gal or 263,000 lb gr wt. It is proposed that thegross rail load (GRL) limits on 100-tn trucks be increasedto 286,000 lb gr.
Because of regulations and industry initiatives, the tankcar of the future may be only three to five years away(Snelgrove 1995). This tank car design will most likely bebased on non-accident release (NAR) products. Changeswill probably include safety valves or surge devices to re-place the safety vent; elimination of bottom loading; im-proved versions of today’s manway design; and the equiv-alent of pressure heads for non-pressure DOT 111A-specification tank cars.
In recent years, the DOT has significantly revised haz-ardous materials classifications, hazard communications,and packaging requirements to agree with other nationaland international United Nations (UN) codes. In the com-ing years, these regulations will cover every shipping con-tainer, from drums and intermediate bulk containers(IBCs), to tractor trailers, and rail tank cars.
—David H.F. Liu
ReferencesCode of Federal Regulations, Title 40, Part 262.Code of Federal Regulations, Title 49, Parts 172, 173, 178 and 179.National Solid Waste Management Association (NSWMA). 1989. Manag-
ing hazardous waste: fulfilling the public trust. Washington, D.C.Turner, P.L. 1992. Preparing hazwaste transport manifests. Environmen-
tal protection, December 1992.U.S. Environmental Protection Agency (EPA) (1986). RCA Orientation
Manual. Office of Solid Waste. Publication No. EPA 530-SW-86-001.Washington, D.C.: U.S. Government Printing Office.
©1999 CRC Press LLC
TABLE 11.10.3 PRESSURE RAIL CARS
ReliefTest valve
Class Material Insulation pressure setting Notes
DOT 105 Steel, Required 100 75 No bottom outlet or washout;aluminum 200 150 only one opening in tank;
300 225 chlorine400 300500 375600 450
DOT 112 Steel None 200 150 No bottom outlet or washout;340 225 anhydrous ammonia
280400 300
330500 375
DOT 114 Steel None 340 255 Similar to DOT 105; optional400 300 bottom outlet; liquefied
petroleum gas
Source: Reprinted from Office of Technology Assessment, 1986, Transportation of Hazardous Materials (U.S. Congress, Washington, D.C.).
TABLE 11.10.4 NONPRESSURE RAIL CARS
ReliefTest valve
Class Material Insulation pressure setting Notes
DOT 103 Steel, aluminium, Optional 60 35 Optional bottom outlet;stainless steel, nickel whiskey
DOT 104 Steel Required 60 35 Similar to DOT 103DOT 111 Steel, aluminum Optional 60 35 Optional bottom outlet
and bottom washoutDOT 111A Steel, aluminum Optional 100 75 Hydrochloric acid
Source: Reprinted from Office of Technology Assessment, 1986.

Treatment, storage, and disposal facilities (TSDs) are thelast link in the cradle-to-grave hazardous waste manage-ment system. All TSDs handling hazardous waste must ob-tain operating permits and abide by treatment, storage,and disposal regulations. TSD regulations establish per-formance standards for owners and operators to minimizethe release of hazardous waste into the environment.
The original RCRA establishes two categories of TSDsbased on permit status. Section 3005(a) of the act speci-fies that TSDs must obtain a permit to operate. The firstcategory consists of interim status facilities that have notyet obtained permits. Congress recognized that it wouldtake many years for the EPA to issue all permits, there-fore, the interim status was established. This allows thosewho own or operate facilities existing as of November 19,1980, and who are able to meet certain conditions, to con-tinue operating as if they have a permit until their permitapplication is issued or denied. The second category con-sists of facilities with permits.
Under Section 3004(a) of the act, the EPA was requiredto develop regulations for all TSDs. Although only one setwas required, the EPA developed two sets of regulations,one for interim status TSDs and the other for permittedTSDs. While developing TSD regulations, the EPA decidedthat owners and operators of interim status facilities shouldmeet only a portion of the requirements for permitted fa-cilities.
General Facility StandardsBoth interim status and permit standards consist of ad-ministrative and nontechnical requirements, and technicaland non-specific requirements. The interim status stan-dards, found in 40 CFR Part 265, are primarily goodhousekeeping practices that owners and operators mustfollow to properly manage hazardous wastes. The permitstandards found in 40 CFR Part 264 are design and op-erating criteria for facility-specific permits.
As detailed in Section 11.10, all facilities handling haz-ardous wastes must obtain an EPA ID number. Ownersand operators must ensure that wastes are correctly iden-tified and managed according to the regulations. They
must also ensure that facilities are secure and operatingproperly. Personnel must be trained to perform their du-ties correctly, safely, and in compliance with all applicablelaws, regulations, and codes. Owners and operators must:
Conduct waste analyses before starting treatment, storage,or disposal in accord with a written waste analysis plan.The plan must specify tests and test frequencies pro-viding sufficient information on the waste to allow man-agement in accordance with the laws, regulations, andcodes.
Install security measures to prevent inadvertant entry ofpeople or animals into active portions of the TSDF. Thefacility must be surrounded by a barrier with controlentry systems or 24-hr surveillance. Signs carrying thewarning “Danger—Unauthorized Personnel Keep Out”must be posted at all entrances. Precautions must betaken to avoid fires, explosions, toxic gases, or any otherevents threatening human health, safety, and the envi-ronment.
Conduct inspections according to a written schedule toassess facility compliance status and detect potentialproblem areas. Observations made during inspectionsmust be recorded in the facility’s operating log andkept on file for 3 years. All problems noted must beremedied.
Conduct training to reduce the potential for mistakes thatmight threaten human health and the environment. Inaddition, the Occupational Safety and Health Adminis-tration (OSHA) now requires each TSD to implementa hazard communication plan, a medical surveillanceprogram, and a health and safety plan. Decontaminationprocedures must be in place and employees must re-ceive a minimum of 24 hr of health and safety training.
Properly manage ignitable, reactive, or incompatiblewastes. Ignitable or reactive wastes must be protectedfrom sources of ignition or reaction, or be treated toeliminate the possibility. Owners and operators mustensure that treatment, storage, or disposal of ignitable,reactive, or incompatible waste does not result in dam-age to the containment structure, or threaten humanhealth or the environment. Separation of incompatiblewastes must be maintained.
©1999 CRC Press LLC
Treatment and Disposal
11.11TREATMENT, STORAGE, AND DISPOSALREQUIREMENTS

Comply with local standards to avoid siting new facilitiesin locations where floods or seismic events could affectwaste management units. Bulk liquid wastes are pro-hibited from placement in salt domes, salt beds, or un-derground mines or caves.
PREPAREDNESS AND PREVENTION
Facilities must be designed, constructed, maintained, andoperated to prevent fire, explosion, or any unplanned re-lease of hazardous wastes that could threaten humanhealth and the environment. Facilities must be equippedwith:
An internal communication or alarm system for immedi-ate emergency instructions to facility personnel
Telephone or two-way radio capable of summoning emer-gency assistance from local police, fire, and emergencyresponse units
Portable fire extinguishers, along with fire, spill control,and contamination equipment
Water at adequate volume and pressure to supply waterhoses, foam-producing equipment, automatic sprin-klers, or water spray systems
All communication and emergency equipment must betested regularly to ensure proper emergency operation. Allpersonnel must have immediate access to the internal alarmor emergency communication system. Aisle space must al-low unobstructed movement of personnel and equipmentduring an emergency.
Owners and operators of TSDs must make arrange-ments to:
Familiarize police, fire, and emergency response teams withthe facility, wastes handled and their properties, workstations, and access and evacuation routes
Designate primary and alternate emergency responseteams where more than one jurisdiction might respond
Familiarize local hospitals with the properties of hazardouswastes handled at the facility, and the type of injuriesor illnesses that could result from events at the facility
CONTINGENCY PLAN AND EMERGENCYPROCEDURE
A contingency plan must be in effect at each TSDF. Theplan must minimize hazards from fires, explosions, or anyrelease of hazardous waste constituents. The plan must beimplemented immediately whenever there is a fire, explo-sion or release that would threaten human health or theenvironment.
The contingency plan must
Describe personnel actions to implement the planDescribe arrangements with local police, fire, and hospi-
tal authorities, as well as contracts with emergency re-sponse teams to coordinate emergency services
List names, addresses, and phone numbers of all personsqualified to act as emergency coordinators for the fa-cility
List all emergency equipment, communication, and alarmsystems, and the location of each item
Include an evacuation plan for facility personnel
The contingency plan must be maintained at the facilityand at all emergency response facilities that might provideservices. It must be reviewed and updated whenever anyitem affecting the plan is changed. A key requirement isdesignating an emergency coordinator to direct responsemeasures and reduce the adverse impacts of hazardouswaste releases.
General Technical Standards forInterim Status FacilitiesThe objective of the RCRA interim status technical re-quirements is to minimize the potential for environmentaland public health threats resulting from hazardous wastetreatment, storage, and disposal at existing facilities wait-ing for an operating permit. The general standards coverthree areas:
• Groundwater monitoring requirements (Sub-part F)
• Closure, postclosure requirements (Subpart G)• Financial requirements (Subpart H)
GROUNDWATER MONITORING
Groundwater monitoring is required for owners or oper-ators of surface impoundments, landfills, land treatmentfacilities, or waste piles used to manage hazardous wastes.These requirements assess the impact of a facility on thegroundwater beneath it. Monitoring must be conductedfor the life of the facility, except at land disposal facilities,which must monitor for up to 30 years after closing.
The groundwater monitoring program requires in-stalling a system of four monitoring wells: one up-gradi-ent from the waste management unit and three down-gra-dient. The down-gradient wells must be placed to interceptany waste from the unit, should a release occur. The up-gradient wells must provide data on groundwater that isnot influenced by waste coming from the waste manage-ment unit (called background data). If the wells are prop-erly located, data comparisons from up-gradient anddown-gradient wells should indicate if contamination isoccurring.
After the wells are installed, the owner or operator mon-itors them for one year to establish background concen-trations for selected chemicals. These data form the basisfor all future comparisons. There are three sets of param-eters for background concentrations: drinking water,groundwater quality, and groundwater contamination.
©1999 CRC Press LLC
If a significant increase or decrease in pH is detectedfor any of the indicator parameters, the owner or opera-tor must implement a groundwater assessment programto determine the nature of the problem. If the assessmentshows contamination by hazardous wastes, the owner oroperator must continue assessing the extent of ground-water contamination until the problem is ameliorated, oruntil the facility is closed.
CLOSURE
Closure is the period when wastes are no longer accepted,during which owners or operators of TSD facilities com-plete treatment, storage, and disposal operations, apply fi-nal covers to or cap landfills, and dispose of or decontam-inate equipment, structures, and soil.
Following the closure, a 30-yr postclosure period is es-tablished for facilities that do not close clean as describedbelow. Postclosure care consists of the following at mini-mum:
• Groundwater monitoring and reporting• Maintenance and monitoring of waste contain-
ment systems• Continued site security
Clean closure may be accomplished by removing all con-taminants from impoundments and waste piles. At a min-imum, owners and operators of surface impoundmentsand waste piles that wish to close clean must conduct soilanalyses and groundwater monitoring to confirm that allwastes have been removed from the unit. The EPA or stateagency may establish additional clean closure requirementson a case-by-case basis. A successful demonstration ofclean closure eliminates the requirement for postclosurecare of the site.
FINANCIAL REQUIREMENTS
Financial requirements were established to ensure fundsare available to pay for closing a facility, for renderingpostclosure care at disposal facilities, and to compensate
third parties for bodily injury and property damage causedby accidents related to the facility’s operation. There aretwo kinds of financial requirements:
• Financial assurance for closure and postclosure• Liability coverage for injury and property damage
To meet financial assurance requirements, owners and op-erators must first prepare written cost estimates for clos-ing their facilities. If postclosure care is required, a cost es-timate for providing this care must also be prepared. Thesecost estimates must reflect the actual cost of the activitiesoutlined in the closure and postclosure plans, and are ad-justed annually for inflation. The cost estimate for closureis based on the point in the facility’s operating life whenclosure would be most expensive. Cost estimates for post-closure monitoring and maintenance are based on pro-jected costs for the entire postclosure period.
The owner or operator must demonstrate to the EPAor state agency an ability to pay the estimated amounts.This is known as financial assurance. The owner/operatormay use one or a combination of the following six mech-anisms to comply with financial assurance requirements:trust fund, surety bond, letter of credit, closure/postclosureinsurance, corporate guarantee for closure, and financialtest. All six mechanisms are adjusted annually for infla-tion or more frequently if cost estimates change.
The Subpart H requirements for these mechanisms areextensive. Readers with particular interest in the detailsshould examine 40 CFR Parts 264 and 265, Subpart H.Liability insurance requirements include coverage of atleast $1 million (annual aggregate of at least $2 million)per sudden accidental occurrence, such as fire or explo-sion. Owners and operators must also maintain coverageof at least $3 million per occurrence (annual aggregate ofat least $6 million), exclusive of legal defense costs, fornonsudden occurrences such as groundwater contamina-tion. Liability coverage may be demonstrated using any ofthe six mechanisms allowed for assurance of closure orpostclosure funds.
—David H.F. Liu
©1999 CRC Press LLC

Many early disasters and current Superfund sites grewfrom uncontrolled accumulation of hazardous wastes.Congress and the EPA sought to impose rigorous controlsand accountability on all who accumulate and storehazardous wastes through the RCRA statutes and EPAregulations.
The RCRA defines storage as holding hazardouswaste for a temporary period, after which the hazardouswaste is treated, disposed of, or stored elsewhere. Theaccumulation of hazardous waste beyond a prescribedperiod, usually 90 days, is considered storage. The owneror operator of a facility where waste is held for morethan 90 days must apply for a permit before startingaccumulation, and must comply with regulations per-taining to storage facilities.
Since the primary function of containers and tanks isstorage, this overview of 40 CFR Parts 264/265 SubpartsI and J includes permitted and interim status standards forcontainer and tank use. The four general types of land dis-posal or long-term storage facilities—surface impound-ments, waste piles, landfills, and underground injection,are discussed briefly.
Many concerns about storage facilities can be addressedby following proper procedures for storage of materials.Table 11.12.1 lists fundamental storage and handlingprocedures.
ContainersThe 55-gal drum remains a standard container for haz-ardous waste. The several DOT-specified 55-gal drums arethe most frequently used container for collection, storage,shipment, and disposal of liquid hazardous wastes (EPA1990).
Selecting the proper drum or container requires con-sulting DOT regulations. The process begins with the 49CFR Sec. 172.101 Hazardous Materials TransportationAct (MHTA), which is frequently referred to as the heartof MHTA. About 16,000 materials and substances arelisted, followed by twelve columns with transport, pack-aging, and identification requirements.
Drums used in hazardous waste management must bein good condition, clean, free of rust, dents, and creases.In addition, the regulations require:
Containers holding hazardous wastes must always beclosed, except when wastes are added or removed
Wastes must be compatible with containers (i.e., corrosivewastes should not be stored in metal containers)
Wastes in leaking or damaged containers must be recon-tainerized
Containers must be handled properly to prevent rupturesand leaks
Incompatible wastes must be prevented from mixingInspections must be conducted to assess container condi-
tion
Containers holding ignitable or reactive wastes must be lo-cated at least 15 m (50 ft) from the facility’s property line.
Permit requirements for containers are similar to the in-terim status requirements with the following exceptions:
Liquid hazardous waste containers must be placed in acontainment system capable of containing leaks andspills. This system must have sufficient capacity to con-tain 10% of the volume of all containers, or the vol-ume of the largest container, whichever is greater.
When closing a container, all hazardous waste and haz-ardous waste residues must be removed, unless the con-tainer is to be disposed of as hazardous waste.
TanksSubpart J regulations apply to stationary tanks storingwastes that are hazardous under Subtitle C of the RCRA.General operating requirements fall into five basic areas:
©1999 CRC Press LLC
11.12STORAGE
TABLE 11.12.1 PROPER PROCEDURES FORSTORAGE OF HAZARDOUSMATERIALS
Use personal protective equipmentBe familiar with specific hazards of material being handledObey all safety rulesDo not smoke while handling materialsStore chemicals according to manufacturer’s instructions, away
from other chemicals or environmental conditions that couldcause reactions
Face labels on containers outKeep stacks straight and alignedCheck for location accuracyDo not stack containers too highCheck for loose closuresPlace into proper locations as soon as possibleDo not block exits or emergency equipmentReport all spills or leaks immediately

Tank assessment must be completed to evaluate structuralintegrity and compatibility with the wastes that the tanksystem is expected to hold. The assessment covers de-sign standards, corrosion protection, tank tests, wastecharacteristics, and tankage.
Secondary containment and release detection is requiredunless the tank does not contain free liquids and is lo-cated in a building with impermeable floors. A sec-ondary containment system must be designed, installed,and operated to prevent liquid migration out of the tanksystem, and to detect and collect any releases that oc-cur. Containment systems include liners, vaults, anddouble-walled tanks.
Operating and maintenance requirements require the man-agement of tanks to avoid leaks, ruptures, spills, andcorrosion. This includes a freeboard or containmentstructure to prevent and contain escaping wastes. Ashut-off or bypass system must be installed to preventliquid from flowing into a leaking tank.
Response to releases must include immediate removal ofthe leaking tank contents. The areas surrounding thetank must be visually inspected for leaks and spills.Based on the inspection, further migration of spilledwaste must be stopped, and contaminated soils and sur-face water must be disposed of in accordance withRCRA requirements. All major leaks must be reportedto the EPA or state agency.
Closure and postclosure requirements include removing allcontaminated soils and other hazardous waste residuesfrom the tank storage area at the time of closure. If de-contamination is impossible, the storage area must beclosed following the requirements for landfill (EPA1990).
Surface ImpoundmentsSurface impoundments are used to reduce waste volumethrough evaporation, while containing and concentratingresidue within liners. Wastes are added directly to lined
depressions in the ground known as pits, lagoons, treat-ment basins, or ponds. Long-term storage more accuratelydescribes the process.
All surface impoundments are required to have at leastone liner and be located on an impermeable base. Newsurface impoundments, replacements, or lateral expan-sions must include:
• Two or more liners• A leachate collection system between the liners• Groundwater monitoring as prescribed in Subpart
F
Requirements include preventing liquid from escaping dueto overfilling or runoff, and preventing erosion of dikes anddams. Liners must meet permit specifications for materialsand thickness. During construction and installation, linersmust be inspected for uniformity, damage, and imperfection.
The double-liner system for an impoundment facility isshown in Figure 11.12.1.
Waste PilesHazardous waste piles now exist on many industrial sites.Volatile components in such waste piles are available forevaporation and subject to wind and water erosion. Theymay be leached by percolation of rainfall and runoff. Pilescontaining minerals or metal values may be leached withweak acid or caustic to recover the value. Unless carefullyconstructed over an impervious base, leachate escapes tothe subsurface, contaminating groundwater or emergingas base flow in streams.
The waste pile has become accepted practice, followedby landfilling, when pile size becomes a problem. Recentdeterminations of EP or TCLP toxicity will bring manydross and fluff piles within RCRA control. RCRA regula-tions for waste piles are similar to those for landfills.
Owners or operators of waste piles used for treatmentor storage of noncontainerized accumulations of solid,nonflowing hazardous wastes may choose to comply with
©1999 CRC Press LLC
���������������������������
���
���
���
���
Composite Liner
Leak Detection/Collection Layer
Compacted Soil
Liquid
FML
Dike
Protective Soil Cover
Dike
Native Soil
FIG. 11.12.1 Schematic—cross section of a liquid waste impoundment double liner system.(Reprinted, with permission, from W.C. Blackman, 1992, Basic Hazardous Waste Management[Boca Raton, Fla.: Lewis Publishers].)
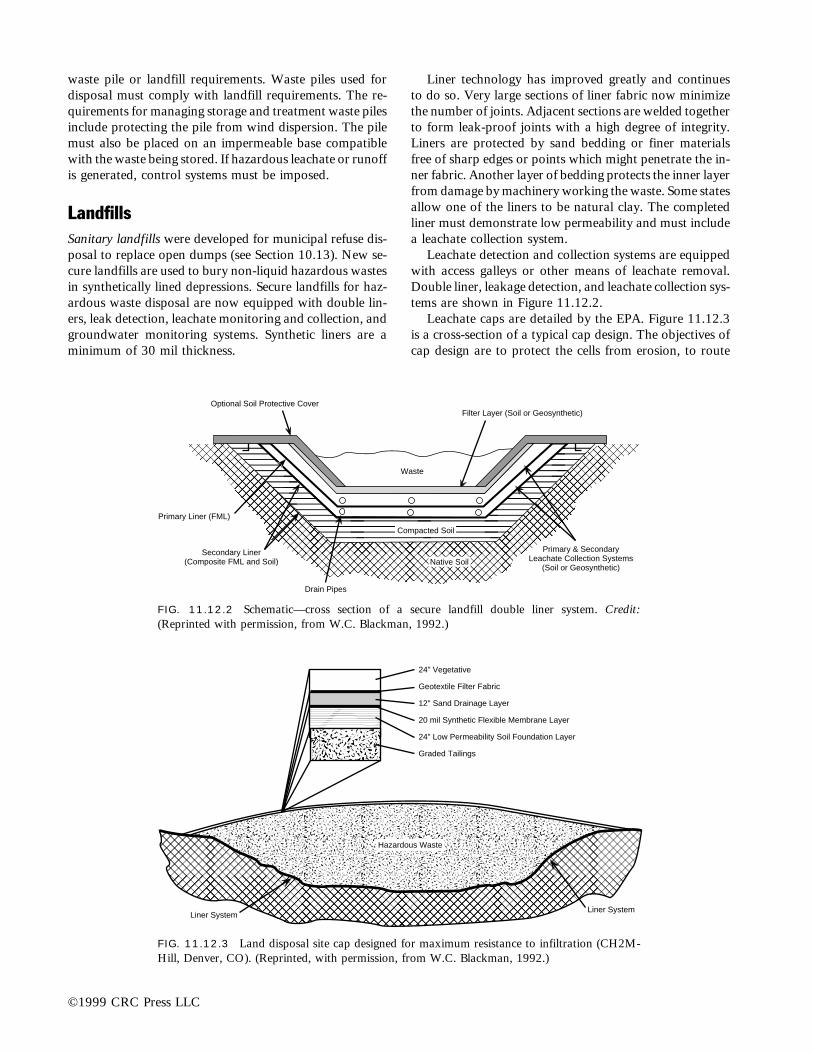
waste pile or landfill requirements. Waste piles used fordisposal must comply with landfill requirements. The re-quirements for managing storage and treatment waste pilesinclude protecting the pile from wind dispersion. The pilemust also be placed on an impermeable base compatiblewith the waste being stored. If hazardous leachate or runoffis generated, control systems must be imposed.
LandfillsSanitary landfills were developed for municipal refuse dis-posal to replace open dumps (see Section 10.13). New se-cure landfills are used to bury non-liquid hazardous wastesin synthetically lined depressions. Secure landfills for haz-ardous waste disposal are now equipped with double lin-ers, leak detection, leachate monitoring and collection, andgroundwater monitoring systems. Synthetic liners are aminimum of 30 mil thickness.
Liner technology has improved greatly and continuesto do so. Very large sections of liner fabric now minimizethe number of joints. Adjacent sections are welded togetherto form leak-proof joints with a high degree of integrity.Liners are protected by sand bedding or finer materialsfree of sharp edges or points which might penetrate the in-ner fabric. Another layer of bedding protects the inner layerfrom damage by machinery working the waste. Some statesallow one of the liners to be natural clay. The completedliner must demonstrate low permeability and must includea leachate collection system.
Leachate detection and collection systems are equippedwith access galleys or other means of leachate removal.Double liner, leakage detection, and leachate collection sys-tems are shown in Figure 11.12.2.
Leachate caps are detailed by the EPA. Figure 11.12.3is a cross-section of a typical cap design. The objectives ofcap design are to protect the cells from erosion, to route
©1999 CRC Press LLC
��������������������
�������������������� �
������������� Waste
Filter Layer (Soil or Geosynthetic)
Primary & SecondaryLeachate Collection Systems
(Soil or Geosynthetic)Native Soil
Drain Pipes
Secondary Liner(Composite FML and Soil)
Primary Liner (FML)
Optional Soil Protective Cover
Compacted Soil
������������������������
���������������������������������
Liner SystemLiner System
24" Vegetative
Geotextile Filter Fabric
12" Sand Drainage Layer
20 mil Synthetic Flexible Membrane Layer
24" Low Permeability Soil Foundation Layer
Graded Tailings
Hazardous Waste
��
���
��
���������
FIG. 11.12.2 Schematic—cross section of a secure landfill double liner system. Credit:(Reprinted with permission, from W.C. Blackman, 1992.)
FIG. 11.12.3 Land disposal site cap designed for maximum resistance to infiltration (CH2M-Hill, Denver, CO). (Reprinted, with permission, from W.C. Blackman, 1992.)

potential runoff around and away from the cap, and toprevent buildup of gases generated within the landfill.
Groundwater monitoring schemes are designed to pro-vide up-gradient (background) water quality data, and todetect down-gradient differences in critical water qualityparameters. The RCRA requires a minimum of one up-gradient and three down-gradient monitoring wells to de-tect leakage from landfills (EPA 1981, 1987).
Landfills present two general classes of problems. Thefirst class includes fires, explosions, production of toxicfumes, and related problems from the improper manage-ment of ignitable, reactive, or incompatible wastes. Thus,owners and operators are required to analyze wastes toprovide enough information for proper management. Theymust control the mixing of incompatible wastes in land-fill cells, and place ignitable and reactive wastes in land-fills only when the waste has been rendered unignitable ornonreactive (EPA 1990).
The second class of landfill problems concerns the con-tamination of surface and groundwater. To deal with prob-lems, interim status regulations require diversion of runoffaway from the active face of the landfill; treatment of liq-uid or semisolid wastes so they do not contain free liquids;proper closure and preclosure care to control erosion andthe infiltration of rainfall; and crushing or shredding land-fill containers so they cannot collapse later leading to sub-sidence and breaching of the cover. Groundwater moni-toring as described in Subpart F is required, as is collectionof rainwater and other runoff from other active faces ofthe landfill. Segregation of waste such as acids, that wouldmobilize, make soluble, or dissolve other wastes or wasteconstituents is required (EPA 1990).
In the HSWA, Congress prohibited disposal of non-containerized liquid hazardous waste, and hazardouswaste containing free liquids, in landfills.
Such landfills should be situated away from ground-water sources. These safeguards should be followed be-cause there is no guarantee that engineering solutions willbe able to contain the wastes in perpetuity. A well-builtfacility may allow sufficient leadtime for remedial actionbefore environmental damage occurs.
Secure landfills meeting new RCRA standards may, un-der temporary variances, be able to accept a few hazardouswastes for which alternative disposal methods have notbeen developed. Secure landfills may also accept hazardouswastes that are treated to the best demonstrated availabletechnology.
Underground InjectionUnderground injection involves using specially designedwells to inject liquid hazardous waste into deep earth stratacontaining non-potable water. Through this method, awide variety of waste liquids are pumped underground intodeep permeable rocks that are separated from fresh wateraquifers by impermeable layers of rock above, below, and
lateral to the waste layer. The depth of an injection rangesfrom 1,000 to 8,000 ft and varies according to the geo-graphical factors of the area. HSWA prohibits the disposalof hazardous waste within Af mi of an underground sourceof drinking water.
Figure 11.12.4 is a cross-section of a typical injectionwell. To prevent plugging of the injection equipment,wastes are usually pretreated to remove solids greater thanone micron. The well must be constructed to assure thatpotable water zones are isolated and protected. At mini-mum, well casings must be cemented and must extendthrough all potable water zones.
Deep-well disposal uses limited formation space, is ex-pensive in construction and operation, and the subject ofever-tightening regulations. For hazardous liquid waste tobe deep-well injected, the following criteria must apply:the hazardous liquid waste must have a low volume anda high concentration of waste, cannot cause an unfavor-able reaction with material in the disposal zone, must bebiologically inactive, must be noncorrosive, and must be
©1999 CRC Press LLC
��������������������������������������������������������
������������
���������
����������������
������������
�����������������������������������
��������������������������������������������������������
���������������������
������������
Injection Gauge
Waste Stream
Annulus PressureGauge
Well Head
Annulus Area Filled withBiocides and Corrosion
Inhibitors
Surface Hole
Cement
Surface Casing
Protection Casing
Cement
Injection Tubing
Sealing Packet
Protection CasingSetting Depth
Limestone orDolomite Disposal Zone
Source: Adapted from Wentz
Shale
Limestone
Shale
Potable
Gravel andPotable Water
Water Sand
Limestone
FIG. 11.12.4 Schematic cross section design of a hazardouswaste injection well. (Reprinted and adapted, with permission,from C.A. Wentz, 1989, Hazardous Waste Management[McGraw-Hill, Inc.].

difficult to treat by other methods. Thus, the methodshould be used only for those wastes with no other feasi-ble management options.
Due to faulty construction or deterioration, there is apotential for leakage from some old wells. Detection of aleak and remedial action may not be feasible because ofthe nature and location of the leakage. Because of the dif-ficulty associated with monitoring subsurface migration ofliquid waste, the potential for geographical disturbancesto the underground injection system, or the geographicalnature of the land, underground injection wells are severelyrestricted in most states.
—David H.F. Liu
ReferencesU.S. Environmental Protection Agency (EPA). 1981. Guidance document
for subpart F air emission monitoring—land disposal toxic air emis-sions evaluation guidelines. Report No. PB87-155578. NationalTechnical Information Service. Springfield, Va.
———. 1987. Background document on bottom liner performance indouble-lined landfills and surface impoundments. Report PB87-182291. National Technical Information Service. Springfield, Va.
——— 1987. Background information on proposed liner and leak de-tection rule. Report No. PB87-191383. National TechnicalInformation Service. Springfield, Va.
——— 1990. RCRA orientation manual, 1990 Edition, Superintendentof Documents. Washington, D.C.: Government Printing Office.
©1999 CRC Press LLC
11.13TREATMENT AND DISPOSAL ALTERNATIVES
Hazardous waste treatment is a rapidly growing, innova-tive industry. This innovation is driven by the need for ef-fective and economical processes for treating wastes ratherthan placing waste in landfills without treatment. Amongwaste management options (Table 11.13.1), the most de-sirable is source reduction through process modification(Combs 1989). The less desirable options follow.
If waste can be eliminated or reduced significantly, sub-sequent treatment processes become unnecessary or are re-duced in scope. These highly desirable waste minimizationalternatives must be carefully considered as reasonabletechnical and economic solutions to hazardous waste man-agement.
Available ProcessesNot all wastes can be eliminated through source reductionor recycling. Most manufacturing waste products requiretreatment to destroy the wastes or render them harmless
to the environment. Technological options for waste han-dling depend upon waste type, amount, and operating cost.Figure 11.13.1 aligns categories of industrial wastes withthe treatment and disposal processes usually applied.
Numerous chemical, physical, and biological treatmentsare applicable to hazardous wastes. Many such treatmentprocesses are used in by-product recovery and volume re-duction processes. All wastes should first be surveyed andcharacterized to determine which treatment or destructionprocess should be used.
Hazardous wastes may be organic or inorganic. Waterwill dissolve many of these substances, while others havelimited solubility. Sodium, potassium, and ammoniumsalts are water soluble, as are mineral acids. Most halo-genated inorganics, except fluoride, are soluble; whilemany carbonates, hydroxides, and phosphates are onlyslightly soluble. Alcohols are highly soluble, but aromat-ics and long-chained petroleum-based organics are of lowsolubility. Solubility is critical in chemical treatmentprocesses.
The following treatment alternatives are detailed inFigure 11.13.1.
Low-concentration effluents and other wastewaters usu-ally require modest capital and operating costs to treatbefore discharging into municipal sewers.
Strong acids and alkalis can be neutralized to prevent char-acterization as hazardous wastes under the RCRA cor-rosivity criteria. Frequently, industrial water may beacid or basic, requiring neutralization before any othertreatment. It may be feasible to mix an acidic wastestream with a basic stream to change the pH to a moreneutral level of 6 to 8.
TABLE 11.13.1 WASTE MANAGEMENT OPTIONSAND PRIORITIES
• Source reduction (process modification)• Separation and volume reduction• Exchange/sale as raw material• Energy recovery• Treatment• Secure ultimate disposal (landfill)
Source: Reprinted with permisstion from G.D. Combs, 1989, Emerging treat-ment technologies for hazardous waste, Section XV, Environmental SystemsCompany (Little Rock, AR).
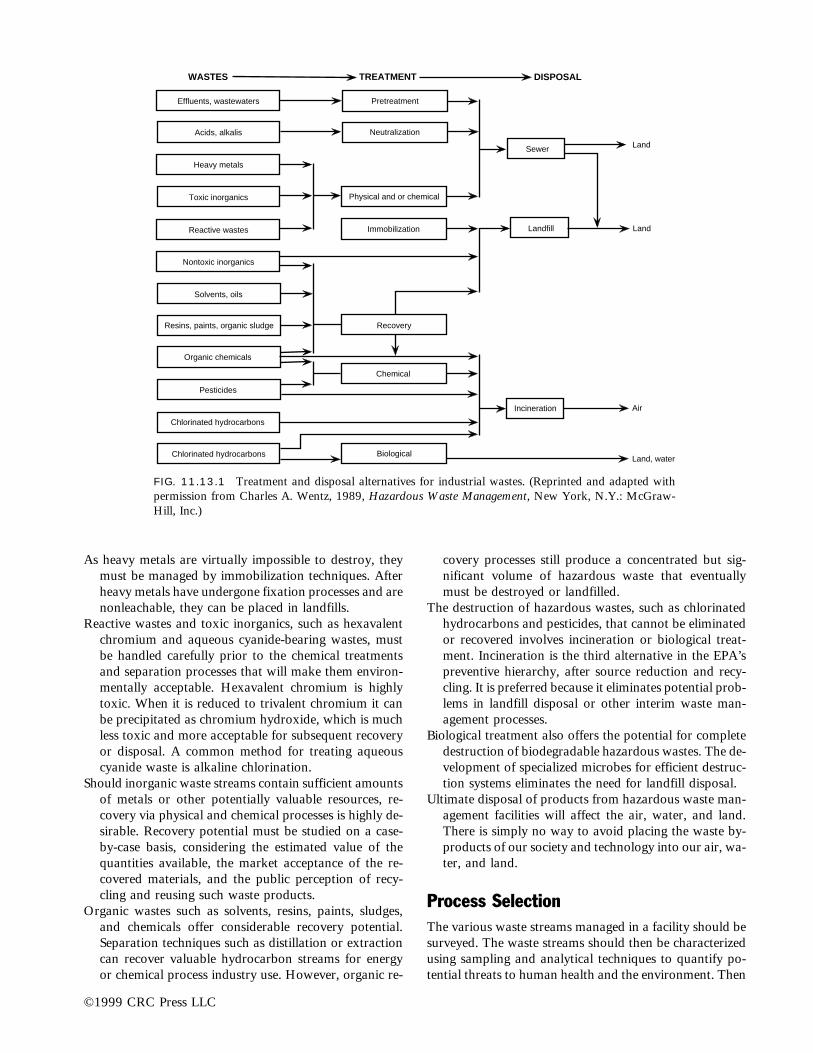
As heavy metals are virtually impossible to destroy, theymust be managed by immobilization techniques. Afterheavy metals have undergone fixation processes and arenonleachable, they can be placed in landfills.
Reactive wastes and toxic inorganics, such as hexavalentchromium and aqueous cyanide-bearing wastes, mustbe handled carefully prior to the chemical treatmentsand separation processes that will make them environ-mentally acceptable. Hexavalent chromium is highlytoxic. When it is reduced to trivalent chromium it canbe precipitated as chromium hydroxide, which is muchless toxic and more acceptable for subsequent recoveryor disposal. A common method for treating aqueouscyanide waste is alkaline chlorination.
Should inorganic waste streams contain sufficient amountsof metals or other potentially valuable resources, re-covery via physical and chemical processes is highly de-sirable. Recovery potential must be studied on a case-by-case basis, considering the estimated value of thequantities available, the market acceptance of the re-covered materials, and the public perception of recy-cling and reusing such waste products.
Organic wastes such as solvents, resins, paints, sludges,and chemicals offer considerable recovery potential.Separation techniques such as distillation or extractioncan recover valuable hydrocarbon streams for energyor chemical process industry use. However, organic re-
covery processes still produce a concentrated but sig-nificant volume of hazardous waste that eventuallymust be destroyed or landfilled.
The destruction of hazardous wastes, such as chlorinatedhydrocarbons and pesticides, that cannot be eliminatedor recovered involves incineration or biological treat-ment. Incineration is the third alternative in the EPA’spreventive hierarchy, after source reduction and recy-cling. It is preferred because it eliminates potential prob-lems in landfill disposal or other interim waste man-agement processes.
Biological treatment also offers the potential for completedestruction of biodegradable hazardous wastes. The de-velopment of specialized microbes for efficient destruc-tion systems eliminates the need for landfill disposal.
Ultimate disposal of products from hazardous waste man-agement facilities will affect the air, water, and land.There is simply no way to avoid placing the waste by-products of our society and technology into our air, wa-ter, and land.
Process SelectionThe various waste streams managed in a facility should besurveyed. The waste streams should then be characterizedusing sampling and analytical techniques to quantify po-tential threats to human health and the environment. Then
©1999 CRC Press LLC
Effluents, wastewaters
Air
Land
Land
Land, water
Resins, paints, organic sludge
Solvents, oils
Nontoxic inorganics
Reactive wastes
Toxic inorganics
Heavy metals
Acids, alkalis
Organic chemicals
Pesticides
Chlorinated hydrocarbons
Chlorinated hydrocarbons
Physical and or chemical
Immobilization
Recovery
Biological
Chemical
Incineration
Neutralization
Pretreatment
Landfill
Sewer
WASTES TREATMENT DISPOSAL
FIG. 11.13.1 Treatment and disposal alternatives for industrial wastes. (Reprinted and adapted withpermission from Charles A. Wentz, 1989, Hazardous Waste Management, New York, N.Y.: McGraw-Hill, Inc.)
the most cost-effective and environmentally safe mannerof managing these wastes should be determined.
The hazardous waste activities of other firms providesinsight into what needs to be done within an industry to becompetitive. Information based on competitive activities isgenerally accessible and can lead to a shorter learning curvefor companies needing to achieve regulatory compliance.
The adaptability of various process technologies to spe-cific hazardous wastes should help to define the limitationsof any proposed treatment system. This critique should bemade early in the decision-making process to ensure theselection of a technology that is compatible with the wastestream to be controlled (Grisham 1986; Long & Schweitzer1982).
The selection of treatment systems and ultimate disposaloptions is usually based on the following considerations.
• Federal, state, and local environmental regulations• Potential environmental hazards• Liabilities and risks• Geography• Demography
The selection of waste control technologies is based, inpart, upon economics (Smith, Lynn & Andrews 1986).Government regulations, adaptability of process technol-ogy, public relations and geographic locations are also con-siderations. The final decision, in the end, can be largelyinfluenced by subjective political reasons.
—David H.F. Liu
ReferencesCombs, G.D. 1989. Emerging treatment technologies for hazardous
waste. Section XV. Environmental Systems Company. Little Rock,Ar.
Grisham, J.W. 1986. Health aspects of the disposal of waste chemicals.New York, N.Y.: Pergamon.
Long, F.A., and G.E. Schweitzer. 1982. Risk assessment at hazardouswaste sites. ACS Symposium Series. Washington, D.C.
Smith, M.A., F.M. Lynn, and R.N.L. Andrews. 1986. Economic impactsof hazardous waste facilities. Hazardous Waste and HazardousMaterials, Vol. 3, no. 2.
©1999 CRC Press LLC
11.14WASTE DESTRUCTION TECHNOLOGY
PARTIAL LIST OF SUPPLIERS
Liquid Injection IncineratorsEnsco Environmental Services: TRANE Thermal Co.; Coen Co.Inc.; John Zink Co.; Vent-o-Matic Incinerator Corp.; Lotepro Co.
Rotary Kiln IncineratorsS.D. Myers, Inc.; American Industrial Waste of ENCSO, Inc. (mo-bile); Exceltech, Inc.; Coen Co.; International Waste EnergySystems; Thermal, Inc.; Lurgi Corp.; Komline Sanderson; WinstonTechnology, Inc. (mobile); Volland, U.S.A.; Von Roll: DETOXCOInc.
Fluidized Bed IncineratorsLurgi Corp.; G.A. Technologies; Waste-Tech Services, Inc.: Dorr-Oliver; Combustion Power; Niro Atomizer
Wet Air OxidationZimpro Inc.; Modar Inc.; Vertox Treatment Systems
Supercritical Water OxidationVertox Corporation; Modar Inc.
Incineration offers advantages over other hazardous wastetreatment technologies, and certainly over landfill opera-tions. Incineration is an excellent disposal technology forall substances with high heat release potentials. Liquid andsolid hydrocarbons are well adapted to incineration.Incineration of bulk materials greatly reduces the volume
of wastes. Any significant reduction in waste volumemakes management simpler and less subject to uncertainty.
If wastewater is too dilute to incinerate, yet too toxicto deepwell or biotreat, it is a good candidate for Wet AirOxidation. Unlike other thermal processes, Wet Oxidationproduces no smoke, fly ash or oxides. Spent air from thesystem passes through an adsorption unit to meet local airquality standards. Operating results show destruction ap-proaching or exceeding 99% for many substances, in-cluding cyanides, phenols, sulfides, chlorinated com-pounds, pesticides, and other organics.
This section focuses on the various types of incineration,wet oxidation, and supercritical water oxidation processes.
IncinerationIncineration is a versatile process. Organic materials aredetoxified by destroying the organic molecular structurethrough oxidation or thermal degradation. Incinerationprovides the highest degree of destruction and control fora broad range of hazardous substances (Table 11.14.1).Design and operating experience exists and a wide varietyof commercial incineration systems are available.

©1999 CRC Press LLC
TABLE 11.14.1 SUMMARY OF INCINERATOR DESTRUCTION TEST WORK
Destruction Efficiencyof Principal
Waste Incinerationa Component (%)
Shell aldrin (20% granules) MC 99.99Shell aldrite MC 99.99Atrazine (liquid) MC 99.99Atrazine (solid) MC 99.99Para-arsanilic acid MS 99.999Captan (solid) MC 99.99Chlordane 5% dust LI 99.99Chlordane, 72% emulsifiable concentrate LI 99.999
and no. 2 fuel oilChlorinated hydrocarbon, trichloropropane, HT 99.92
trichlorethane, and dichloroethane 99.98predominating
Chloroform MS 99.999DDT 5% oil solution LI 99.99DDT (solid) MM 99.970 to
99.98DDT 10% dust MC 99.9920% DDT oil solution LI 99.98DDT 25% emulsifiable concentration LI 99.98DDT 25% emulsifiable concentrate MC 99.98 to
99.99DDT oil 20% emulsified DDT waste TO 99.9999
oil—1.7% PCBDDT powder MS 99.998Dieldrin—15% emulsifiable concentrate LI 99.999Dieldrin—15% emulsifiable concentrates and LI 99.98
72% chlordane emulsifiable concentrates(mixed 1:3 ratio)
Diphenylamine-HCl MS 99.999Ethylene manufacturing waste LI 99.999GB (C4H10O2PP) MS 99.99999969Herbicide orange RL 99.999 to
99.985Hexachlorocyclopentadiene LI 99.999Acetic acid, solution or kepone RKP 99.9999Toledo sludge and kepone coincineration RKP 99.9999Lindane 12% emulsifiable concentrate LI 99.999Malathion MS 99.999 to
99.9998Malathion 25% wet powder MC 99.99Malathion 57% emulsifiable concentrate MC 99.99Methyl mathacrylate (MMA) FB 99.9990.3% Mirex bait MC 98.21 to
99.98Mustard MS 99.999982Nitrochlorobenzene LI 99.99 to
99.999Nitroethane MS 99.993Phenol waste FB 99.99Picloram MC 99.99Picloram, (tordon 10K pellets) MC 99.99PCBs RK 99.999964PCB capacitors RK 99.5 to
99.999
(Continued on next page)

Detoxified hazardous wastes include combustible car-cinogens, mutagens, teratogens, and pathological wastes.Another advantage of incineration is the reduction ofleachable wastes from landfills. Incineration of contami-nated soils is increasing. The EPA, for example, employeda mobile incinerator to decontaminate 40 tn of Missourisoil that was contaminated with 4 lb of dioxin compounds.
Different incineration technologies are used to handlevarious types of hazardous waste. The four most common
incinerator designs are liquid injection (sometimes com-bined with fume incineration), rotary kiln, fixed hearthand fluidized bed incinerators.
The four major subsystems of hazardous waste incin-eration are: (1) waste preparation and feeding, (2) com-bustion chamber(s), (3) air pollution control, and (4)residue and ash handling. The normal orientation of thesesubsystems is shown in Figure 11.14.1, along with typicalprocess component options.
©1999 CRC Press LLC
TABLE 11.14.1 (Continued)
Destruction Efficiencyof Principal
Waste Incinerationa Component (%)
PCB CK 99.9998Polyvinyl chloride waste RK 99.99Toxaphene 20% dust MC 99.99Toxaphene 60% emulsifiable concentrate MC 99.99Trichlorethane MS 99.992,4-D low-volatile liquid ester LI 99.992,4,5-T (Weedon™) MM 99.990 to
99.9962,4,5-T SH 99.9952,4,5-T SH 99.9952,4,5-T SH 922,4,5-T SH 99.995VX (C11H26O2PSN) MS 99.999989 to
99.9999945Zineb MC 99.99
Source: J. Corini, C. Day, and E. Temrowski, 1980 (Sept. 2). Trial Burn Data (unpublished draft) Office of Solid Waste,U.S. Environmental Protection Agency, Washington, D.C.
aMC 5 multiple chamber; MS 5 molten salt combustion; LI 5 liquid injection; HT 5 2 high-temp. incinerators;MM 5 municipal multiple-hearth sewage sludge incinerator; TO 5 thermal oxidizer waste incinerator; RL 5 2 identicalrefractory-lined furnaces; RKP 5 rotary kiln pyrolyzer; FB 5 fluidized bed; CK 5 cement kiln; SH 5 single-hearth furnace.
FIG. 11.14.1 General orientation of incineration subsystems and typical process component options. (Reprinted,with permission, from Dempsey and Oppelt 1993).
Waste Preparation Combustion Air Pollution Control
BlendingScreeningShreddingHeating
AtomizationRamGravityAugerLance
Liquid InjectionRotary KilnFixed HearthFluidized Bed
QuenchHeatRecovery
VenturiWet ESP*IWS*Fabric Filter
Packed TowerSpray TowerTray TowerIWSWet EPS
Was
te WastePreparation
WasteFeeding
CombustionChamber(s)
CombustionGas
Conditioning
ParticulateRemoval
AcidGas
Removal
Demisterand
Stack
AshDisposal
ResidueTreatment
Residueand AshHandling
*IWS = Ionizing Wet ScrubberESP = Electrostatic PrecipitatorWWT = Wastewater Treatment Dewatering
ChemicalStabilizationSecure Landfill WWT* Neutralization
Chemical Treatment
Return toProcess
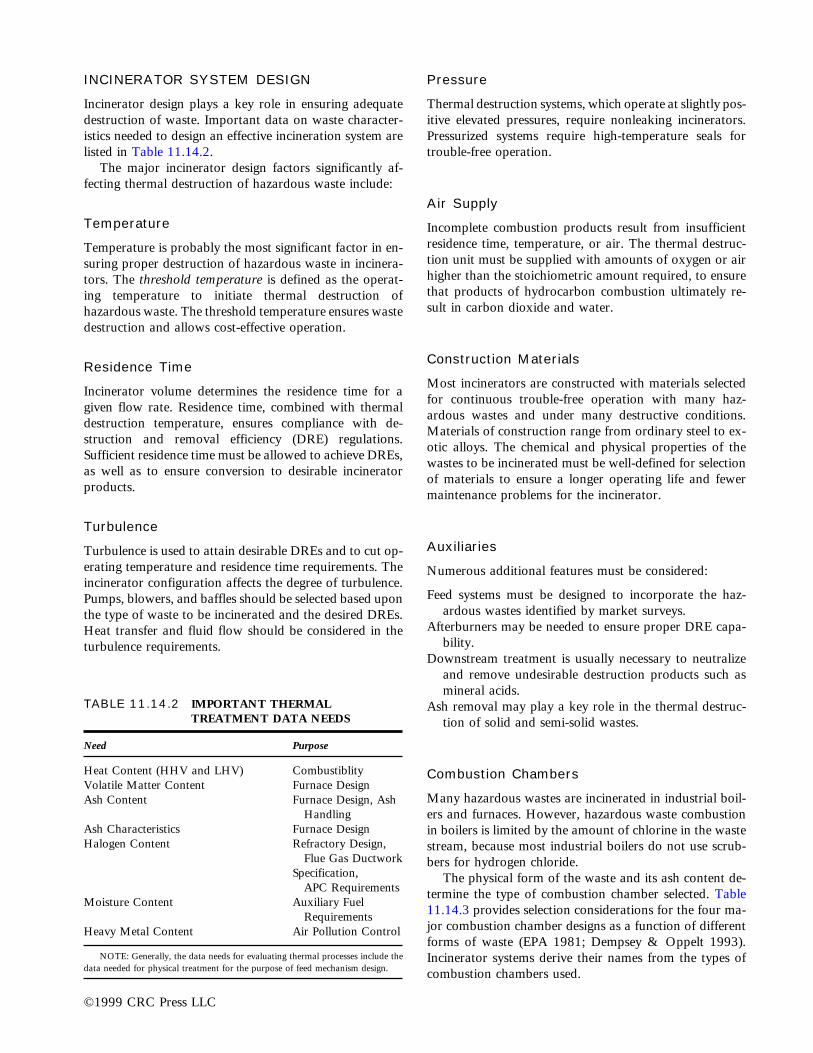
INCINERATOR SYSTEM DESIGN
Incinerator design plays a key role in ensuring adequatedestruction of waste. Important data on waste character-istics needed to design an effective incineration system arelisted in Table 11.14.2.
The major incinerator design factors significantly af-fecting thermal destruction of hazardous waste include:
Temperature
Temperature is probably the most significant factor in en-suring proper destruction of hazardous waste in incinera-tors. The threshold temperature is defined as the operat-ing temperature to initiate thermal destruction ofhazardous waste. The threshold temperature ensures wastedestruction and allows cost-effective operation.
Residence Time
Incinerator volume determines the residence time for agiven flow rate. Residence time, combined with thermaldestruction temperature, ensures compliance with de-struction and removal efficiency (DRE) regulations.Sufficient residence time must be allowed to achieve DREs,as well as to ensure conversion to desirable incineratorproducts.
Turbulence
Turbulence is used to attain desirable DREs and to cut op-erating temperature and residence time requirements. Theincinerator configuration affects the degree of turbulence.Pumps, blowers, and baffles should be selected based uponthe type of waste to be incinerated and the desired DREs.Heat transfer and fluid flow should be considered in theturbulence requirements.
Pressure
Thermal destruction systems, which operate at slightly pos-itive elevated pressures, require nonleaking incinerators.Pressurized systems require high-temperature seals fortrouble-free operation.
Air Supply
Incomplete combustion products result from insufficientresidence time, temperature, or air. The thermal destruc-tion unit must be supplied with amounts of oxygen or airhigher than the stoichiometric amount required, to ensurethat products of hydrocarbon combustion ultimately re-sult in carbon dioxide and water.
Construction Materials
Most incinerators are constructed with materials selectedfor continuous trouble-free operation with many haz-ardous wastes and under many destructive conditions.Materials of construction range from ordinary steel to ex-otic alloys. The chemical and physical properties of thewastes to be incinerated must be well-defined for selectionof materials to ensure a longer operating life and fewermaintenance problems for the incinerator.
Auxiliaries
Numerous additional features must be considered:
Feed systems must be designed to incorporate the haz-ardous wastes identified by market surveys.
Afterburners may be needed to ensure proper DRE capa-bility.
Downstream treatment is usually necessary to neutralizeand remove undesirable destruction products such asmineral acids.
Ash removal may play a key role in the thermal destruc-tion of solid and semi-solid wastes.
Combustion Chambers
Many hazardous wastes are incinerated in industrial boil-ers and furnaces. However, hazardous waste combustionin boilers is limited by the amount of chlorine in the wastestream, because most industrial boilers do not use scrub-bers for hydrogen chloride.
The physical form of the waste and its ash content de-termine the type of combustion chamber selected. Table11.14.3 provides selection considerations for the four ma-jor combustion chamber designs as a function of differentforms of waste (EPA 1981; Dempsey & Oppelt 1993).Incinerator systems derive their names from the types ofcombustion chambers used.
©1999 CRC Press LLC
TABLE 11.14.2 IMPORTANT THERMALTREATMENT DATA NEEDS
Need Purpose
Heat Content (HHV and LHV) CombustiblityVolatile Matter Content Furnace DesignAsh Content Furnace Design, Ash
HandlingAsh Characteristics Furnace DesignHalogen Content Refractory Design,
Flue Gas DuctworkSpecification,
APC RequirementsMoisture Content Auxiliary Fuel
RequirementsHeavy Metal Content Air Pollution Control
NOTE: Generally, the data needs for evaluating thermal processes include thedata needed for physical treatment for the purpose of feed mechanism design.

LIQUID INJECTION INCINERATORS
Liquid injection incinerators are applicable for pumpableliquid waste. These units (Figure 11.14.2) are usually sim-ple, refractory-lined cylinders (either horizontally or verti-cally aligned) equipped with one or more waste burners.Liquid wastes are injected through the burner(s), atomizedto fine droplets and burned in suspension. Burners, as wellas separate injection nozzles, may be oriented for axial, ra-dial or tangential firing. Improved use of combustion spaceand higher heat release rates can be achieved by using swirlor vortex burners, or designs involving tangential entry. Aforced draft must be supplied to the combustion chamberfor the necessary mixing and turbulence.
Good atomization is critical to achieving high destruc-tion efficiency in liquid combustors. Nozzles have been de-veloped to produce mists with mean particle diameters aslow as 1 micron (mm), as compared to oil burners, whichyield oil droplets in the 10 to 50 mm range. Atomizationmay be obtained by low pressure air or steam (25 to 100psig), or mechanical (hydraulic) means using specially de-signed orifices (25 to 250 psig).
Vertical, downward-oriented liquid injection incinera-tors are preferred when wastes are high in inorganic saltsand fusible ash content; horizontal units may be used withlow ash waste. In the past, the typical capacity of liquid in-jection incinerators was 30 MM Btu/hr heat release. How-ever, units as high as 210 MM Btu/hr are in operation.
©1999 CRC Press LLC
TABLE 11.14.3 APPLICABILITY OF MAJOR INCINERATOR TYPES TO WASTES OF VARIOUS PHYSICAL FORM
Liquid Rotary Fixed FluidizedInjection Kiln Hearth Bed
Solids:Granular, homogeneous X X XIrregular, bulky (pallets, etc.) X XLow melting point (tars, etc) X X X XOrganic compounds with fusible ash constituents X X XUnprepared, large, bulky material X X
Gases:Organic vapor laden X X X X
Liquids:High organic strength aqueous wastes X X X XOrganic liquids X X X X
Solids/liquids:Waste contains halogenated aromatic compounds X X X
(2,200°F minimum)Aqueous organic sludge X X
Source: Reprinted with permission from C.R. Dempsey and E.T. Oppelt, 1993, Incineration of hazardous waste: a critical review update, Air & Waste, Vol. 43,1993.
�������������
�����������������
Dischargeto Quench or
Waste Heat Recovery25-250%
Excess AirAir
Refractory Wall
Spray
1500°F-2200°F0.3-2.0 SecondsMean Combustion
Gas Residence Time
2600°F-3000°F
AqueousWaste
AuxiliaryFuel
LiquidWaste
AtomizingSteam or
AirPrimary
CombustionAir Cross Section
Steam
Flame
FIG. 11.14.2 Typical liquid injection combustion chamber. (Reprinted, with permission, from Dempseyand Oppelt 1993.)

ADVANTAGES
• Incinerates a wide range of liquid wastes• Requires no continuous ash removal system, other
than for air pollution control• Capable of a high turndown ratio• Provides fast temperature response to changes in
the waste-fuel flow rate• Includes virtually no moving parts• Allows low maintenance costs• Is a proven technology
DISADVANTAGES
• Must be able to atomize liquids through a burnernozzle except for certain limited applications
• Must provide for complete combustion and pre-vent flame impingement on the refractory
• Susceptible to plugging. High percent solids cancause problems
• No bulk solids capability
ROTARY KILN INCINERATORS
Rotary kiln incinerators (Figure 11.14.3) are more versa-tile, as they are used to destroy solid wastes, slurries, con-tainerized wastes, and liquids. Because of this, these unitsare frequently incorporated into commercial off-site in-cineration facilities and used for Superfund remediation.
The rotary kiln is a horizontal, cylindrical, refractory-lined shell mounted on a slight slope. Rotation of the shelltransports waste through the kiln and mixes the burningsolid waste. The waste moves concurrently or counter-currently to the gas flow. The residence of waste solids inthe kiln is generally 0.5 to 1.5 hrs. This is controlled bykiln rotation speed (typically 0.5 to 1 rpm), waste feedrate, and in some instances, internal dams to retard wastemovement through the kiln. The feed rate is regulated, lim-iting the waste processed to 20% or less of kiln volume.
Rotary kilns are typically 5–12 ft in diameter and 10–30ft in length. Rotary kiln incinerators generally have alength-to-diameter ratio (L/D) of 2:8. Smaller L/D ratiosresult in less particulate carryover. Higher L/D ratios andslower rotational speeds are used when waste materials re-quire longer residence time.
The primary function of the kiln is converting solidwastes to gases through a series of volatilization, destruc-tive distillation, and partial combustion reactions. An af-terburner, connected directly to the discharge end of thekiln, completes gas-phase combustion reactions. Gases ex-iting the kiln are directed to the afterburner chamber.
Some recent systems have a “hot cyclone” installed be-tween the kiln and afterburner to remove solid particlesthat might create slagging problems in the afterburner. Theafterburner may be horizontally or vertically aligned, andfunctions on the same principles as a liquid injection in-
©1999 CRC Press LLC
FIG. 11.14.3 Typical rotary kiln/afterburner combustion chamber. (Reprinted, with permission, from Dempseyand Oppelt 1993.)
������������������
������
���������
������
�������
������������������
Rotary Seals
Refractory
Liquid Waste
AuxiliaryFuel
Air
Dischargeto Quench or
Heat Recovery
120%-200%Excess Air
1.0-3.0 SecondsMean Gas
Residence Time
Refractory
2000°F2500°F
AshAuxiliaryFuel
Ash
1200°F-2300°F
Waste
Incline 50-250%Excess AirKiln
Shroud
CombustionAir
Waste Liquids
Auxiliary Fuel
Waste Solids,Containers or
Sludges
Rotary Kiln Afterburner
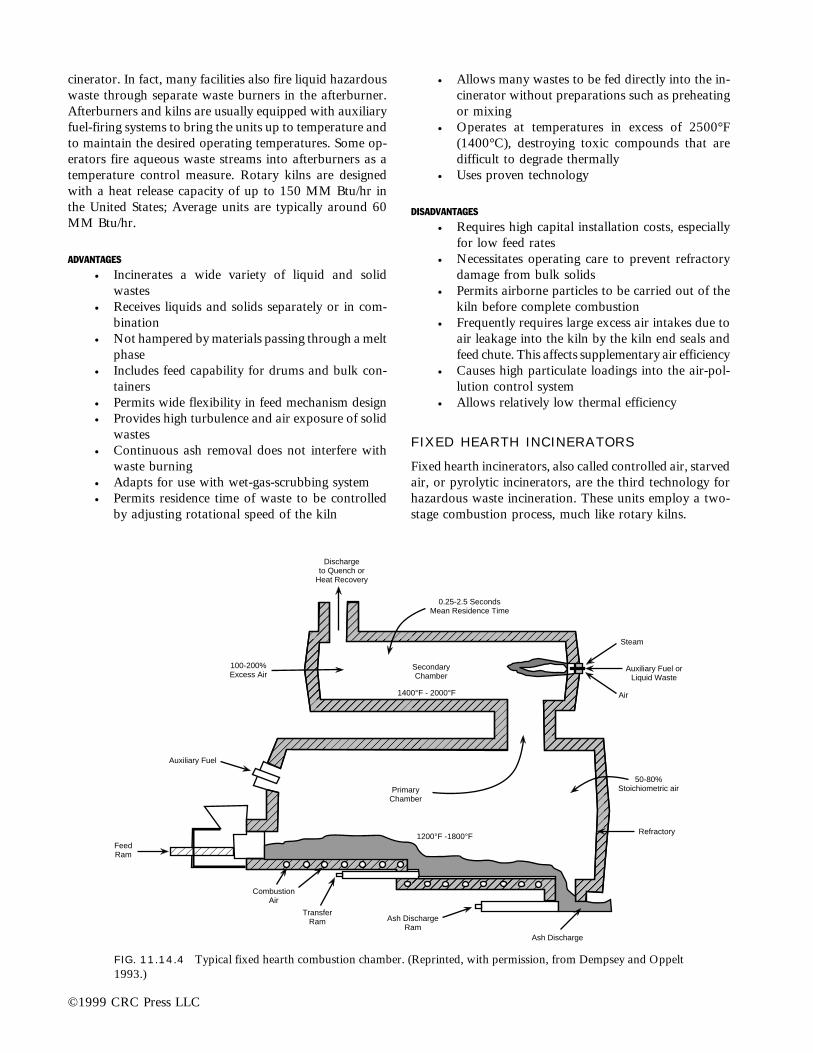
cinerator. In fact, many facilities also fire liquid hazardouswaste through separate waste burners in the afterburner.Afterburners and kilns are usually equipped with auxiliaryfuel-firing systems to bring the units up to temperature andto maintain the desired operating temperatures. Some op-erators fire aqueous waste streams into afterburners as atemperature control measure. Rotary kilns are designedwith a heat release capacity of up to 150 MM Btu/hr inthe United States; Average units are typically around 60MM Btu/hr.
ADVANTAGES
• Incinerates a wide variety of liquid and solidwastes
• Receives liquids and solids separately or in com-bination
• Not hampered by materials passing through a meltphase
• Includes feed capability for drums and bulk con-tainers
• Permits wide flexibility in feed mechanism design• Provides high turbulence and air exposure of solid
wastes• Continuous ash removal does not interfere with
waste burning• Adapts for use with wet-gas-scrubbing system• Permits residence time of waste to be controlled
by adjusting rotational speed of the kiln
• Allows many wastes to be fed directly into the in-cinerator without preparations such as preheatingor mixing
• Operates at temperatures in excess of 2500°F(1400°C), destroying toxic compounds that aredifficult to degrade thermally
• Uses proven technology
DISADVANTAGES
• Requires high capital installation costs, especiallyfor low feed rates
• Necessitates operating care to prevent refractorydamage from bulk solids
• Permits airborne particles to be carried out of thekiln before complete combustion
• Frequently requires large excess air intakes due toair leakage into the kiln by the kiln end seals andfeed chute. This affects supplementary air efficiency
• Causes high particulate loadings into the air-pol-lution control system
• Allows relatively low thermal efficiency
FIXED HEARTH INCINERATORS
Fixed hearth incinerators, also called controlled air, starvedair, or pyrolytic incinerators, are the third technology forhazardous waste incineration. These units employ a two-stage combustion process, much like rotary kilns.
©1999 CRC Press LLC
FIG. 11.14.4 Typical fixed hearth combustion chamber. (Reprinted, with permission, from Dempsey and Oppelt1993.)
������������
��������������������������������������������
������������
������������
���������
��{|
50-80%Stoichiometric air
Refractory
Ash Discharge
Ash DischargeRam
TransferRam
CombustionAir
FeedRam
Auxiliary Fuel
100-200%Excess Air
Dischargeto Quench or
Heat Recovery
0.25-2.5 SecondsMean Residence Time
Steam
Auxiliary Fuel orLiquid Waste
Air
SecondaryChamber
1400°F - 2000°F
1200°F -1800°F
PrimaryChamber

As shown in Figure 11.14.4, waste is ram-fed orpumped into the primary chamber, and burned at roughly50–80% of stoichiometric air requirements. This starvedair condition causes the volatile waste to be vaporized bythe endothermic heat provided in oxidation of the fixedcarbon fraction. The resulting smoke and pyrolytic prod-ucts consist primarily of methane, ethane, and other hy-drocarbons; carbon monoxide and combustion productspass to the secondary chamber. Here additional air is in-jected to complete combustion, which occurs sponta-neously or through the addition of supplementary fuels.Primary chamber combustion reactions and turbulent ve-locities are maintained at low levels by the starved-air con-ditions, minimizing particulate entrainment and carryover.With the addition of secondary air, the total excess air forfixed hearth incinerators is 100–200%.
Fixed hearth units tend to be smaller in capacity thanliquid injection or rotary kiln incinerators because of thephysical limitations in ram-feeding and transporting largeamounts of waste material through the combustion cham-ber. Lower capital costs and reduced particulate controlrequirements make them more attractive than rotary kilnsfor smaller on-site installations.
ADVANTAGE
• Represents proven technology
DISADVANTAGES
• Requires more labor• Operates at a temperature lower than necessary
for acceptable waste destruction
FLUIDIZED BED INCINERATORS
Fluidized bed combustion systems have only recently beenapplied in hazardous waste incineration. Fluidized bed in-cinerators may be either circulating or bubbling bed de-signs (Chang et al. 1987). Both types consist of single re-fractory-lined vessels partially filled with particles of sand,aluminum, calcium carbonate or other such materials.Combustion air is supplied through a distributor plate atthe bottom of the combustor (Figure 11.14.5) at a rate suf-ficient to fluidize (bubbling) or entrain part of the bed ma-terial (recirculating bed). In the recirculating bed design,air velocities are higher and the solids are blown overhead,separated in a cyclone, then returned to the combustionchamber (Figure 11.14.6). Operating temperatures arenormally in the 1400–1600°F range. Excess air require-ments range from 25–150%.
Fluidized bed incinerators are used primarily for liq-uids, sludges, or shredded solid materials, including soil.To allow good circulation of waste materials and removalof solid residues within the bed, all solids require pre-screening or crushing to a size less than 2 in in dia.
Fluidized bed incinerators offer: high gas-to-solids ra-tios, high heat transfer efficiencies, high turbulence in both
gas and solid phases, uniform temperatures throughout thebed, and the potential for in-situ gas neutralization by lime,limestone, or carbonate addition. Fluidized beds also havethe potential for solid agglomeration in the bed, especiallyif salts are present in waste feeds.
ADVANTAGES
• Burns solid, liquid, and gaseous wastes• Simple design has no moving parts• Compact design due to high heating rate per vol-
ume• Low gas temperatures and excess air requirements
minimize nitrogen oxide formation• Large active surface area enhances combustion ef-
ficiency• Fluctuations in feed rate and composition are eas-
ily tolerated due to large heat capacity
DISADVANTAGES
• Residual materials are difficult to remove• Fluid bed must be prepared and maintained• Feed selection must prevent bed damage• Incineration temperatures limited to 1500°F max
to avoid fusing bed material• Little experience on hazardous waste combust-
ion
A wide range of innovative technologies such as high- andlow-temperature plasmas, molten salt, molten glass andmolten metals baths have merged since the passage ofRCRA (Freeman 1990). Many such techniques are nowin development.
©1999 CRC Press LLC
���������������������
1400°F - 1600°F
25-150%Excess Air
Solids Feed andCyclone Ash Recycle
Auxiliary Fuel
Ash/BedRemoval
FluidizingCombustion
Air
LiquidSludgeFeed
PreheatBurner
1.0-5.0 SecondsMean Combustion
Gas ResidenceTime
Dischargeto Cyclone
FluidizedSand or Alumina
Air DistributionManifold
FIG. 11.4.5 Typical fluidized bed combustion chamber.(Reprinted, with permission, from Dempsey and Oppelt 1993).
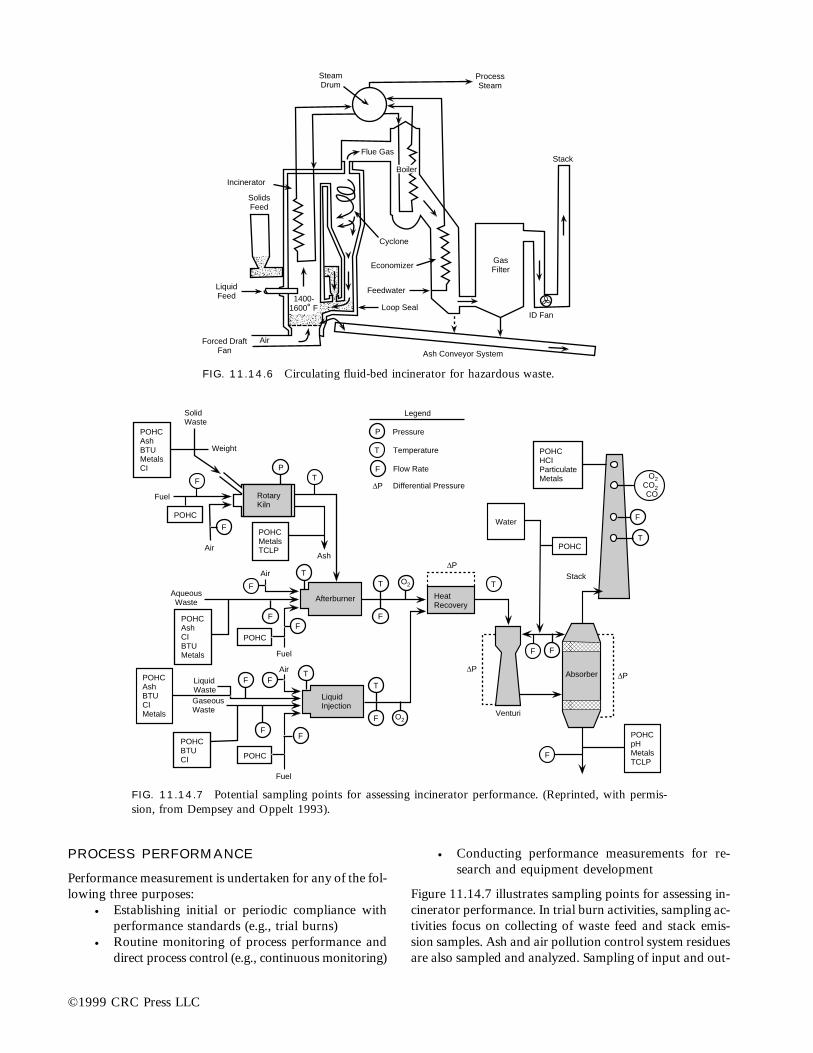
PROCESS PERFORMANCE
Performance measurement is undertaken for any of the fol-lowing three purposes:
• Establishing initial or periodic compliance withperformance standards (e.g., trial burns)
• Routine monitoring of process performance anddirect process control (e.g., continuous monitoring)
• Conducting performance measurements for re-search and equipment development
Figure 11.14.7 illustrates sampling points for assessing in-cinerator performance. In trial burn activities, sampling ac-tivities focus on collecting of waste feed and stack emis-sion samples. Ash and air pollution control system residuesare also sampled and analyzed. Sampling of input and out-
©1999 CRC Press LLC
����������
����
Incinerator
LiquidFeed
AirForced DraftFan Ash Conveyor System
Loop Seal
Feedwater
Economizer
Cyclone
Boiler
Flue Gas
SteamDrum
ProcessSteam
Stack
GasFilter
ID Fan
1400-1600˚ F
SolidsFeed
FIG. 11.14.6 Circulating fluid-bed incinerator for hazardous waste.
FIG. 11.14.7 Potential sampling points for assessing incinerator performance. (Reprinted, with permis-sion, from Dempsey and Oppelt 1993).
SolidWaste
Weight
Fuel
F
Air
Afterburner
LiquidInjection
AqueousWaste
POHCAshBTUCIMetals
LiquidWasteGaseousWaste
POHCBTUCI
Fuel
DP
HeatRecovery
Absorber
POHCpHMetalsTCLP
Water
POHCHCIParticulateMetals
Stack
O2CO2CO
POHC
T
F
O2T
F
DPDP
Venturi
-
����
F
O2
T
F -
T
F
F
F
POHC
F
Air TFF
POHCAshCIBTUMetals
FF
POHC
Fuel
POHCAshBTUMetalsCI
POHC
POHCMetalsTCLP
RotaryKiln
T
TP
Ash
F
Air
F
P
T
F
Pressure
Temperature
Flow Rate
Differential PressureDP
Legend

put around individual unit components, e.g. scrubbers,may also be conducted in research or equipment evalua-tion studies.
Trial Burns
Trial burns provide regulatory agencies with the data toissue operating permits. Consequently, trial runs are di-rected to show that plants achieve the RCRA limits underthe desired operating conditions. These RCRA limits are:
A destruction and removal efficiency (DRE) of greater than99.99% for each of subject principal organic hazardousconstituents (POHCs). (Note: the Toxic SubstanceControl Act [TSCA] requires that incinerators burningPCB and dioxin-containing waste achieve 99.9999%DRE.)
A particulate emission of less than 180 mg per dry stan-dard cu meter (0.08 grains/dry ft) of stack gas (correctedto 7% O2)
Hydrogen chloride (HCl) emissions less than 4 lb/hr (2.4kg/hr) or greater than 99% removal efficiency
Trial burns test the plant’s operating conditions and abil-ity to meet the three RCRA limits. The EPA recommendsthree or more runs under any one set of conditions, withvarying conditions, or with different waste feed charac-teristics.
Operating Permits
Permits should allow plants to incinerate the expectedtypes and quantities of waste, at the necessary feed ratesand within an acceptable range of operating conditions.Permit conditions must be flexible, with limits that are rea-sonably achievable. Based on trial burn results, operatingpermits may specify certain criteria such as:
• Maximum concentration of certain POHCs inwaste feed
• Maximum waste feed rate or maximum total heatinput rate
• Maximum air feed rate or maximum flue gas ve-locity
• Minimium combustion temperature• Maximum carbon monoxide content of stack gas• Maximum chloride and ash content of waste feed
Sampling and Analysis
The EPA provides guidance on sampling and analysismethods for trial burns designed to measure facility com-pliance with the RCRA incinerator standards (EPA 1981,1983, 1989, 1990c; Gorman, et al. 1985).
Table 11.14.4 outlines sampling methods typically in-volved in RCRA trial burns. Sampling method numbersrefer to methods identified in EPA guidance documents
and reports (Harris et al. 1984; EPA 1990). The EPA hasa computerized data base including a reference directoryon the availability and reliability of sampling and analysismethods for designated POHCs.
Assuring Performance
Key control parameters used to trigger fail-safe controlsare presented in Table 11.14.5. The parameters are dividedinto three groups:
Group A parameters are continuously monitored and in-terlocked to the automatic waste feed cutoff.
Group B parameters are set to ensure that worst-case con-ditions demonstrated in the trial run are not exceededduring continuous operation. They are not linked withthe automatic waste cutoff.
Group C parameters are based on equipment manufac-turers’ design and operating specifications. They are setindependently of trial-run results and are not linkedwith automatic waste feed cutoff.
No individual real-time monitoring performance indi-cators appear to correlate with actual organic DRE. Nocorrelation between indicator emissions of CO or HC andDRE has been demonstrated in field-scale incinerator op-erations, although CO is a conservative indicator of or-ganic emissions. It may be that combinations with otherpotential real-time indicators, such as surrogate destruc-tion, may be desirable.
Wet Air OxidationPROCESS DESCRIPTION
The patented Zimmermann process involves flamelessor wet combustion in aqueous solution or dispersions(Zimmermann 1954). Unlike other thermal processes,wet air oxidation does not require dewatering beforecombustion and creates no air pollution. In aqueousdispersion, a wide range of organic and hazardous in-dustrial wastes can be oxidized to carbon dioxide andwater by the addition of air or oxygen. Water, the bulkof the aqueous phase, catalyzes oxidation reactions sothey proceed at relatively low temperatures (350–650°F).At the same time, water moderates the oxidation ratesby evaporation.
Figure 11.14.8 shows a simplified flow scheme of a con-tinuous air oxidation system. The waste liquor is mixedwith air and is preheated by steam during process startupand by hot reactor effluent during operation to300°–400°F. At this reactor inlet temperature oxidationstarts, with the associated heat release further increasingthe temperature as the liquid air mixture moves throughthe reactor. The higher the operating temperature, thegreater the destruction of organic pollutants for the sameresidence time period. The operating temperature cannot
©1999 CRC Press LLC
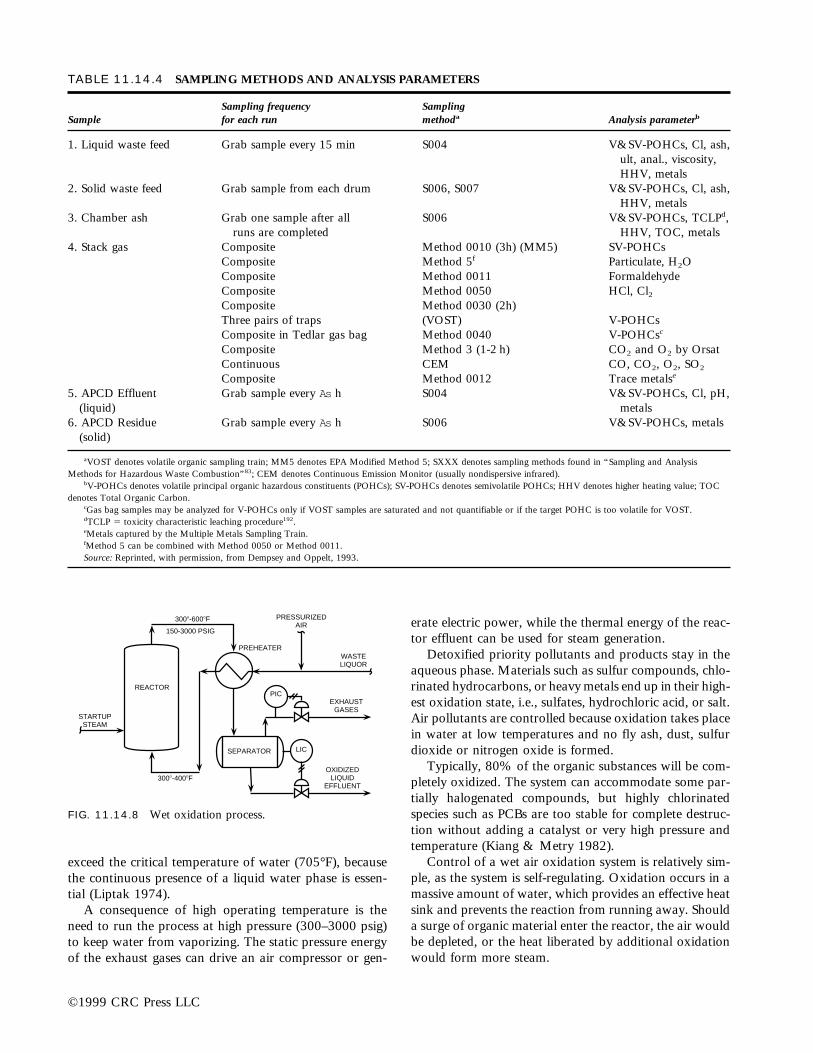
erate electric power, while the thermal energy of the reac-tor effluent can be used for steam generation.
Detoxified priority pollutants and products stay in theaqueous phase. Materials such as sulfur compounds, chlo-rinated hydrocarbons, or heavy metals end up in their high-est oxidation state, i.e., sulfates, hydrochloric acid, or salt.Air pollutants are controlled because oxidation takes placein water at low temperatures and no fly ash, dust, sulfurdioxide or nitrogen oxide is formed.
Typically, 80% of the organic substances will be com-pletely oxidized. The system can accommodate some par-tially halogenated compounds, but highly chlorinatedspecies such as PCBs are too stable for complete destruc-tion without adding a catalyst or very high pressure andtemperature (Kiang & Metry 1982).
Control of a wet air oxidation system is relatively sim-ple, as the system is self-regulating. Oxidation occurs in amassive amount of water, which provides an effective heatsink and prevents the reaction from running away. Shoulda surge of organic material enter the reactor, the air wouldbe depleted, or the heat liberated by additional oxidationwould form more steam.
©1999 CRC Press LLC
TABLE 11.14.4 SAMPLING METHODS AND ANALYSIS PARAMETERS
Sampling frequency SamplingSample for each run methoda Analysis parameterb
1. Liquid waste feed Grab sample every 15 min S004 V&SV-POHCs, Cl, ash,ult, anal., viscosity,HHV, metals
2. Solid waste feed Grab sample from each drum S006, S007 V&SV-POHCs, Cl, ash,HHV, metals
3. Chamber ash Grab one sample after all S006 V&SV-POHCs, TCLPd,runs are completed HHV, TOC, metals
4. Stack gas Composite Method 0010 (3h) (MM5) SV-POHCsComposite Method 5f Particulate, H2OComposite Method 0011 FormaldehydeComposite Method 0050 HCl, Cl2Composite Method 0030 (2h)Three pairs of traps (VOST) V-POHCsComposite in Tedlar gas bag Method 0040 V-POHCsc
Composite Method 3 (1-2 h) CO2 and O2 by OrsatContinuous CEM CO, CO2, O2, SO2
Composite Method 0012 Trace metalse
5. APCD Effluent Grab sample every As h S004 V&SV-POHCs, Cl, pH,(liquid) metals
6. APCD Residue Grab sample every As h S006 V&SV-POHCs, metals(solid)
aVOST denotes volatile organic sampling train; MM5 denotes EPA Modified Method 5; SXXX denotes sampling methods found in “Sampling and AnalysisMethods for Hazardous Waste Combustion”83; CEM denotes Continuous Emission Monitor (usually nondispersive infrared).
bV-POHCs denotes volatile principal organic hazardous constituents (POHCs); SV-POHCs denotes semivolatile POHCs; HHV denotes higher heating value; TOCdenotes Total Organic Carbon.
cGas bag samples may be analyzed for V-POHCs only if VOST samples are saturated and not quantifiable or if the target POHC is too volatile for VOST.dTCLP 5 toxicity characteristic leaching procedure192.eMetals captured by the Multiple Metals Sampling Train.fMethod 5 can be combined with Method 0050 or Method 0011.Source: Reprinted, with permission, from Dempsey and Oppelt, 1993.
PRESSURIZEDAIR
WASTELIQUOR
EXHAUSTGASES
OXIDIZEDLIQUID
EFFLUENT
LIC
PIC
SEPARATOR
REACTOR
STARTUPSTEAM
PREHEATER
150-3000 PSIG
3008-6008F
3008-4008F
FIG. 11.14.8 Wet oxidation process.
exceed the critical temperature of water (705°F), becausethe continuous presence of a liquid water phase is essen-tial (Liptak 1974).
A consequence of high operating temperature is theneed to run the process at high pressure (300–3000 psig)to keep water from vaporizing. The static pressure energyof the exhaust gases can drive an air compressor or gen-

©1999 CRC Press LLC
PROCESS CHARACTERISTICS
The wet air oxidation process has three basic reactionmechanisms: hydrolysis, mass transfer, and chemicalkinetics. Table 11.14.6 gives brief explanations of themechanisms and their major influences. The four basicsteps encountered in the oxidation of hydrocarbon pol-lutants are:
Hydrocarbon 1 oxygen ® alcoholAlcohol 1 oxygen ® aldehyde
Aldehyde 1 oxygen ® acidAcid 1 oxygen ® carbon dioxide 1 water
Nearly all organic materials in industrial waste break downinto several intermediate compounds before complete ox-
TABLE 11.14.5 CONTROL PARAMETERS
Group Parametera
Group AContinuously monitored parameters are interlocked 1. Minimum temperature measured at each combustion chamber exitwith the automatic waste feed cutoff. Interruption of 2. Maximum CO emissions measured at the stack or otherwaste feed is automatic when specified limits are appropriate locationexceeded. The parameters are applicable to all facilities. 3. Maximum flue gas flowrate or velocity measured at the stack or
other appropriate location4. Maximum pressure in PCC and SCC5. Maximum feed rate of each waste type to each combustion
chamberb
6. The following as applicable to the facility:• Minimum differential pressure across particulate venturi scrubber• Minimum liquid-to-gas ratio (L/G) and pH to wet scrubber• Minimum caustic feed to dry scrubber• Minimum kVA settings to ESP (wet/dry) and kV for ionized wet
scrubber (IWS)• Minimum pressure differential across baghouse• Minimum liquid flowrate to IWS
Group B 7. POHC incinerability limitsParameters do not require continuous monitoring and 8. Maximum total halides and ash feed rate to the incinerator systemare thus not interlocked with the waste feed cutoff 9. Maximum size of batches or containerized wasteb
systems. Operating records are required to ensure that 10. Minimum particulate scrubber blowdown or total solids contenttrial burn worst-case conditions are not exceeded. of the scrubber liquid
Group C 11. Minimum/maximum nozzle pressure to scrubberLimits on these parameters are set independently of 11. Maximum total heat input capacity for each chambertrial burn test conditions. Instead, limits are based 13. Liquid injection chamber burner settings:on equipment manufacturer’s design and operating • Maximum viscosity of pumped wastespecifications and are thus considered good operating • Maximum burner turndownpractices. Selected parameters do not require • Minimum atomization fluid pressurecontinuous monitoring and are not interlocked with • Minimum waste heating value (only applicable when a giventhe waste feed cutoff. waste provides 100% heat input to a given combustion
chamber)14. APCD inlet gas temperaturec
aPCC denotes primary combustion chamber; SCC denotes secondary combustion chamber; APCD denotes air pollution control device; kVA denotes kilovolt-amperes;ESP denotes electrostatic precipitator.
bItems 5 and 9 are closely related.cItem 14 can be a group B or C parameter.Source: Reprinted, with permission, from Dempsey and Oppelt, 1993.
TABLE 11.14.6 WET AIR OXIDATION PROCESSREACTION MECHANISMSa
Reaction Mechanism Typical Effects Strongest Influences
Hydrolysis Dissolves solids pHSplits long-chain Temperature
hydrocarbonsMass Transfer Dissolves, absorbs Pressure
oxygen Presence of liquid-gas interface
Chemical Kinetics Oxidizes organic Temperaturechemicals Catalysts
Oxygen activity
aCourtesy of Plant Engineering, Barrington, IL.

Zimpro Passavant provides wet air oxidation units for con-verting caustic liquors into nonhazardous effluents that canbe treated biologically (Zimpro Environmental, Inc. 1993).These liquors are produced during scrubbing of ethylenegases. Table 11.14.7 lists hazardous wastes that are goodcandidates for the wet air oxidation process.
Skid-mounted units can be situated at disposal sites forpretreatment of hazardous liquid before deep welling, orfor carbon regeneration and sludge oxidation.
©1999 CRC Press LLC
TABLE 11.14.7 THE EPA HAZARDOUS WASTE LIST—GOOD CANDIDATES FOR WAO
F Classification:F004, F005 Spent non-halogenated solvents and still bottoms.F006 Sludges from electroplating operations.F007, F011, F015 Spent cyanide bath solutions.F016 Coke oven, blast furnace gas scrubber sludges.
K Classification:K009-K015 Bottoms, bottom streams, and side cuts from production of acetaldehyde and acrylonitrile.K017-K020 Heavy ends or still bottoms from epichlorohydrin, ethyl chloride, ethylene dichloride or vinyl
chloride operations.K024-K025 Distillation bottoms from production of phthalic anhydride and nitrobenzene.K026 Stripping still tails from production of methyl ethyl pyridines.K027 Residues from toluene diisocyanate production.K029-K030 Bottoms, ends, stripper wastes from tricholorethylene, perchloroethylene production.K035 Creosote sludges.K045 Spent carbon from explosives wastewater.K052 Leaded petroleum tank bottoms.K058-K059 Leather tanning, finishing sludges.
P Classification (discarded commercial chemical products):P024 p-chloroanilineP029-P030 Copper cyanide, cyanidesP048 2,4-dinitrophenolP052-P054 Ethylcyanide, ethylenediamine, ethyleneimine.P063-P064 Hydrocyanic acid, isocyanic acidP077 p-nitroanilineP081 NitroglycerineP090 PentachlorophenolP098 Potassium cyanideP101 PropionitrileP106 Sodium cyanide
U Classification:U007 & U009 Acrylamide, acrylonitrileU130 HexachlorocyclopentadieneU135 Hydrogen sulfideU152-U153 Methacrylonitrile, methanethiolU159 Methyl ethyl ketone
Other Hazardous Wastes (SIC Code Numbers):2865 Vacuum still bottoms from maleic anhydride production.
Fractionating residues, benzene and chlorobenzene recovery.Residues from distillation of 1-chloro-4-nitrobenzene.Methanol recovery bottoms, heavy ends, methyl methacrylate production.
2869 Ends, distillation from carbaryl production.Ethylene dichloride distillation ends in vinyl chloride production.Quench column bottoms, acrylonitrile production.Aniline production still bottoms.
3312 Cyanide-bearing wastes from steel finishing.
Source: Reprinted, with permission, from Zimpro Environmental, Inc., 1993, wet air oxidation—solving today’s hazardous wastewater problems. Bulletin WAO-100.
idation occurs. The process is efficient in total organic car-bon reduction for most compounds, but not for acetatesor benzoic acid.
APPLICABILITY/LIMITATIONS
This process is used to treat aqueous waste streams con-taining less than 5% organics, pesticides, phenolics, or-ganic sulfur, and cyanide wastewaters. At ethylene plants,

This technology is not recommended for aromatic halo-genated organics, inorganics, or for large volumes of waste.It is not appropriate for solids or viscous liquids.
Status. Available at commercial scale.
Supercritical Water OxidationSupercritical water oxidation (SCWO) is an emergingwaste treatment technology. There are no full scale SCWOsystems in operation, but large bench- and pilot-scale dataare available.
PROCESS DESCRIPTION
SCWO is basically a high-temperature, high-pressure pro-cess. In SCWO, decomposition occurs in the aqueous phaseabove the critical point of water (374°C/221 atm or 705°F/3248 psi). A schematic of a generic SCWO process is shownin Figure 11.14.9. The feed is typically an aqueous waste.An oxidant such as air, oxygen, or hydrogen peroxide mustbe provided unless the waste itself is an oxidant.
Many of the properties of water change drastically nearits critical point (374°C/221 atm): the hydrogen bonds dis-appear and water becomes similar to a moderately polarsolvent; oxygen and all hydrocarbons become completelymiscible with water; mass transfer occurs almost instan-taneously; and solubility of inorganic salts drops to ppmrange. Thus, inorganic salt removal must be considered inthe design of a SCWO reactor (Thomason, Hong, Swallow& Killilea 1990).
Two process approaches have been evaluated: anabove-ground pressure vessel reactor (Modar), and the useof an 8000–1000–ft deep well as a reactor vessel (Vertox).Figure 11.14.10 is a schematic of a subsurface SCWO re-actor. Subsurface reactors consist of aqueous liquid wastecolumns deep enough that the material near the bottom issubject to a pressure of at least 221 atm (Gene Syst, 1990).To achieve this pressure solely through hydrostatic head,a water column depth of approximately 12,000 ft is re-quired. The influent and effluent will flow in opposite di-rections in concentric vertical tubes. In surface SCWO sys-tems, the pressure is provided by a source other thangravity, and the reactor is on or above the earth’s surface.
The supercritical water process is best suited for largevolume (200 to 1000 gpm), dilute (in the range of1–10,000 mg/l COD), aqueous wastes that are volatile and
have a sufficiently high heat content to sustain the process.In many applications, high Btu, nonhazardous waste canbe mixed with low Btu hazardous waste to provide theheat energy needed to make the process self-sustaining.Emissions or residues include gaseous effluents (nitrogenand carbon dioxide), precipitates of inorganic salts, andliquids containing only soluble inorganic acids and salts.The advantages are rapid oxidation rates, complete oxi-dation of organics, efficient removal of inorganics, and nooff-gas processing required (EPA 1992).
Significant bench- and pilot-scale SCWO performancedata are available. Typical destruction efficiencies (DEs)for a number of compounds are summarized in Table11.14.8. Although several low DEs are included in thistable to illustrate that DE is proportional to both temper-atures and time, DEs in excess of 99% can be achievedfor nearly all pollutants (EPA 1992). Table 11.14.8 showsthat using hydrogen peroxide as an oxidant in SCWO sys-tems produces DEs significantly higher than those obtainedusing of air and oxygen.
APPLICABILITY/LIMITATIONS
Supercritical water oxidation is used to treat a wide vari-ety of pumpable aqueous organic solutions, slurries, andmixed organic and inorganic waste (EPA 1992). Sophisti-cated equipment and long-term continuous operations havenot been demonstrated, thereby limiting its use. Demonstra-
©1999 CRC Press LLC
Aqueous Waste
Supplemental Fuel (opt.)
Oxidant
SupercriticalWater
Oxidation
Cooling Depressurization,Vapor/LiquidSeparation
Gases
Liquids
Solids
Solid/LiquidSeparation
��������������������������������������������������������������������������������������������������������������������������������������������������������������������������������������
���
������
������
Oxidant
Effluent
Influent
Downdraft
Reactor
FIG. 11.14.9 SCWO Schematic. (Reprinted from U.S. EPA, 1992).
FIG. 11.14.10 Subsurface SCWO Reactor

tion of use with municipal sewage sludge was completedin 1985.
Possible corrosion problems must be examined whenSCWO is considered. High-temperature flames observedduring SCWO may present additional equipment prob-lems in both surface and subsurface SCWO systems. Thereis some concern that these flames will cause hot spotswhich could weaken SCWO vessels (DOE 1991).
Status. Demonstration of use with municipal seweragesludge completed in 1986.
—David H.F. Liu (1995)
ReferencesChang, D.P.Y., et al. 1987. Evaluation of a pilot-scale circulating bed
combustor as a potential hazardous waste incinerator. JAPCA, Vol.37, no. 3.
Dempsey, C.R., and E.T. Oppelt. 1993. Incineration of hazardous waste:a critical review update. Air & Waste, Vol. 43.
Freeman, H. 1990. Thermal processes: innovative hazardous waste treat-ment technology series, Lancaster, PA: Technomic Publishing Company.
Gene Syst International Inc. 1990. The gravity pressure vessel (June).Gorman, P., et al. 1985. Practical Guide to Trial Burns for Hazardous
Waste Incineration. U.S. EPA, EPA 600–R2-86–050. NTIS PB 86-190246 (November).
Harris, J.C., D.J. Larsen, and C.E. Rechsteiner. 1984. Sampling andanalysis methods for hazardous waste combustion. EPA 600–8-84–002. PB 84-155545 (February).
©1999 CRC Press LLC
TABLE 11.14.8 SCWO PERFORMANCE DATA
React FeedTemp. Pressure DE TIme Conc.
Pollutant (deg. C) (atm.) (%) (min.) Oxidant (mg/L)
1,1,1-Trichloroethane 495 99.99 4 Oxygen1,1,2,2-Tetrachloroethylene 495 99.99 4 Oxygen1,2-Ethylene dichloride 495 99.99 4 Oxygen2,4-Dichlorophenol 400 33.7 2 Oxygen 2,0002,4-Dichlorophenol 400 99.440 1 H2O2 2,0002,4-Dichlorophenol 450 63.3 2 Oxygen 2,0002,4-Dichlorophenol 450 99.950 1 H2O2 2,0002,4-Dichlorophenol 500 78.2 2 Oxygen 2,0002,4-Dichlorophenol 500 .99.995 1 H2O2 2,0002,4-Dimethylphenol 580 443 .99 10 H2O2 1 O2 1352,4-Dinitrotoluene 410 443 83 3 Oxygen 842,4-Dinitrotoluene 528 287 .99 3 Oxygen 1802-Nitrophenol 515 443 90 10 Oxygen 1042-Nitrophenol 530 430 .99 15 H2O2 1 O2 104Acetic acid 400 3.10 5 Oxygen 2,000Acetic acid 400 61.8 5 H2O2 2,000Acetic acid 450 34.3 5 Oxygen 2,000Acetic acid 450 92.0 5 H2O2 2,000Acetic acid 500 47.4 5 Oxygen 2,000Acetic acid 500 90.9 5 H2O2 2,000Activated sludge (COD) 400 272 90.1 2 62,000Activated sludge (COD) 400 306 94.1 15 62,000Ammonium perchlorate 500 374 99.85 0.2 None 12,000Biphenyl 450 99.97 7 OxygenCyclohexane 445 99.97 7 OxygenDDT 505 99.997 4 OxygenDextrose 440 99.6 7 OxygenIndustrial sludge (TCOD) 425 .99.8 20 OxygenMethyl ethyl ketone 505 99.993 4 OxygenNitromethane 400 374 84 3 None 10,000Nitromethane 500 374 .99 0.5 None 10,000Nitromethane 580 374 .99 0.2 None 10,000o-Chlorotoluene 495 99.99 4 Oxygeno-Xylene 495 99.93 4 OxygenPCB 1234 510 99.99 4 OxygenPCB 1254 510 99.99 4 OxygenPhenol 490 389 92 1 Oxygen 1,650Phenol 535 416 .99 10 Oxygen 150
Source: (Reprinted from U.S. Environmental Protection Agency, 1992, Engineering Bulletin: Supercritical water oxidation, [EPA 540–S–92–006], Office of Researchand Development, Cincinnati, Oh. [September]).

Kiang, Y.H., and A.A. Metry. 1982. Hazardous waste processing tech-nology. Ann Arbor, Mi: Ann Arbor Science.
Liptak, B.G. 1974. Environmental engineers’ handbook. Vol. 3.2.15.Radnor, Pa: Chilton Book Company.
Thomason, Terry B., G.T. Hong, K. Swallow, and W.R. Killilea. 1990.The Modar supercritical water oxidation process. Innovative haz-ardous waste treatment technology series. Vol. 1. TechnomicPublishing Company, Inc.
U.S. Department of Energy (DOE). 1991. Supercritical OxidationDestroys Toxic Wastes. NTIS Technical Note (February).
U.S. Environmental Protection Agency (EPA). 1981. Engineering hand-book on hazardous waste incineration. SW-889. NTIS PB 81-248163(September).
———. 1983. Guidance Manual for Hazardous Waste IncineratorPermits. EPA-SW-966. NTIS PB 84-100577 (March).
———. 1989. Guidance on setting permit conditions and reporting trialburn results. EPA 625–6-89–019 (January).
———. 1990. Handbook: quality assurance/quality control (QA/QC)procedures for hazardous waste incinerators. EPA 625–6-89–023.NTIS PB 91-145979 (January).
———. 1990c. Methods manual for compliance with the BIF regula-tions. EPA 530-SW-91-010. NTIS PB 90-120-006 (December).
———. 1992. Engineering bulletin: Supercritical water oxidation. EPA540–S–92–006. Office of Research & Development. Cincinnati, Oh.(September).
Zimmerman, F.J., U.S. Patent No. 2,665,249 (Jan. 5, 1954).Zimpro Environmental Inc. 1993. Wet air oxidation–solving today’s haz-
ardous wastewater problems. Bulletin #WAO-100.
©1999 CRC Press LLC
11.15WASTE CONCENTRATION TECHNOLOGY
PARTIAL LIST OF SUPPLIERS
Sedimentation: Chemical Waste Management Inc.; Dorr-OliverInc.; Eimco Process Equipment Co.; Wyo Ben Inc.; National HydroSystems Inc.; Sharples Stokes Div., Pennwalt; Water Tech Inc.; AFLIndustries
Centrifugation: Clinton Centrifuge Inc.; ALFA Laval Inc.; TetraRecovery Systems; Dorr-Oliver Inc.; Bird Environmental Systems;Western States Machine; Fletcher; Astro Metallurgical; BarrettCentrifugals; Donaldson Industrial Group; GCI Centrifuges;General Production Services Inc.; IT Corp.; Ingersoll RandEnvironmental; Master Chemical Corp. System Equipment;Sartorius Balance Div., Brinkman; Sharples Stokes Div., Pennwalt;Tekmar Co.; Thomas Scientific
Evaporation: Resources Conservation Company (mobile brine con-centration systems); Kipin Industries; APV Equipment Inc.;Ambient Technical Div., Ameribrom Inc.; Analytical Bio ChemLabs; Aqua Chem Water Technologies; Capital Control Co., Inc.;Dedert Corp.; HPD Inc.; Industrial Filter & Pump Manufacturing;Kimre Inc.; Fontro Co., Inc.; Lancy International Inc.; Luwa Corp.;Licon Inc.; Rosenmund Inc.; Sasakura International AmericanCorp.; Spraying Systems Co.; Votator Anco Votator Div.; Wallace& Tiernan Div., Pennwalt; Wastesaver Corp.; WeathermeasureWeathertronics; Wheaton Instruments
Air Stripping: OH Materials; Carbon Air Services; Detox Inc.; ITCorporation; Oil Recovery Systems Inc.; Resource ConservationCompany; Terra Vac Inc.; Advanced Industrial Technology; BaronBlakeslee Inc.; Beco Engineering Co.; Calgon Carbon Corp.; ChemPro Corp; D.R. Technology Inc.; Delta Cooling Towers; DetoxInc.; Hydro Group Inc.; IPC Systems; Kimre Inc.; Munters Corp.;NEPCCO; North East Environmental Products; Oil RecoverySystem Inc.; Tri-Mer Corp.; Wright R.E. Associates Inc.
Distillation: Exceltech, Inc.; Kipin Industries; Mobil SolventReclaimers, Inc.; APV Equipment Inc.; Ace Glass Inc.; ArtisanIndustries Inc.; Gilmont Instruments Inc.; Glitsch Inc.; Hoyt Corp.;Licon Inc.; Progressive Recovery Inc.; Rosenmund Inc.; SutcliffeCroftshaw; Tekmar Co.; Thomas Scientific; Vera International Inc.;Vic Manufacturing Co.; Industrial Div.; Wheaton Instruments;York Otto H. Co., Inc.
Soil Flushing: Critical Fluid Systems; IT Corp.
Liquid/Liquid Extraction: Resources Conservation Co.
Filtration: Calgon Carbon Corp.; Carbon Air Services Inc; ChemicalWaste Management; Industrial Innovations Inc., Krauss-Maffei;Komline Sanderson; Bird Machine Co.; D.R. Sperry, Inc., Dorr-Oliver
Carbon Adsorption: Calgon Carbon Corp.; Carbon Air ServicesInc.; Zimpro Inc.; Chemical Waste Management
Reverse Osmosis: Osmonics, Inc.; Artisan Industries Inc.
Ion Exchange: Calgon Carbon; Dionex; DeVoe-Holbein; DavisInstrument Mfg Co., Inc.; Ecology Protection Systems, Inc.;Envirex Inc.; Industrial Filter & Pump Mfg.; Lancy InternationalInc.; McCormack Corp.; Osmonic Membrane Sys. Div.; PaceInternational Corp.; Permutit Co., Inc.; Serfilco LTD.; TechniChem., Inc.; Thomas Scientific; Treatment Technologies; WaterManagement Inc.; Western Filter Co.
Chemical Precipitation: Mobile Systems-Rexnord Craig; EcolochemInc., Dravo Corp.; Detox Inc.; Envirochem Waste ManagementServices; Chemical Waste Management Inc.; Andco EnvironmentalProcesses Inc.; Ensotech Inc.; Tetra Recovery Systems
Chemical and physical waste treatment processes are usedfor removal rather than destruction. A more appropriateterm for non-destructive processes is concentration techno-logies (Martin & Johnson 1987). Physical treatment pro-cesses use physical characteristics to separate or concen-trate constituents in a waste stream. Residues then requirefurther treatment and ultimate disposal. Chemical treatmentprocesses alter the chemical structure of wastes, producingresiduals that are less hazardous than the original waste.
In this section, physical treatment processes are orga-nized into four groupings: gravity; phase change; dissolu-tion; and size, adsorptivity, or ionic characteristics (Table11.15.1). Important physical treatment data needs are pre-sented in Table 11.15.2.

The following chemical treatment processes discussedin this section are commonly used for waste treatment ap-plications. These include
• pH adjustment (for neutralization or precipita-tion)
• Oxidation and reduction• Hydrolysis and photolysis• Chemical oxidation (ozonation, electrolytic oxi-
dation, hydrogen peroxide)• Chemical dehalogenation (alkaline metal dechlo-
rination, alkaline metal/polyethylene glycol, based-catalyzed dechlorination)
Important chemical treatment data needs are presentedin Table 11.15.3.
Gravity SeparationSEDIMENTATION
Description
Sedimentation is a settling process in which gravity causesheavier solids to collect at the bottom of a containmentvessel, separated from the suspending fluid. Sedimentation
©1999 CRC Press LLC
TABLE 11.15.1 PHYSICAL TREATMENT PROCESS
Gravity Separation:● Sedimentation● Centrifugation● Flocculation● Oil/Water Separation● Dissolved Air Flotation● Heavy Media Separation
Phase Change:● Evaporation● Air Stripping● Steam Stripping● Distillation
Dissolution:● Soil Washing/Flushing● Chelation● Liquid/Liquid Extraction● Supercritical Solvent Extraction
Size/Adsorptivity/Ionic Characteristics:● Filtration● Carbon Adsorption● Reverse Osmosis● Ion Exchange● Electrodialysis
TABLE 11.15.2 PHYSICAL TREATMENT DATA NEEDS
Data Need Purpose
For SolidsAbsolute Density Density SeparationBulk Density Storage Volume RequiredSize Distribution Size Modification or SeparationFriability Size ReductionSolubility Dissolution
(in H2O, organic solvents, oils, etc.)
For LiquidsSpecific Gravity Density SeparationViscosity Pumping & HandlingWater Content (or oil content, etc.) SeparationDissolved Solids SeparationBoiling Pt/Freezing Point Phase Change Separation, Handling and Storage
For Liquids/Solid MixturesBulk Density Storage & TransportationTotal Solids Content SeparationSolids Size Distribution SeparationSuspended Solids Content SeparationSuspended Solids Settling Rate SeparationDissolved Solids Content SeparationFree Water Content Storage & TransportOil and Grease Content SeparationViscosity Pumping and Handling
For GasesDensity SeparationBoiling (condensing) Temp. Phase Change SeparationSolubility (in H2O, etc.) Dissolution

can be accomplished using a batch process or a continu-ous removal process. Several physical arrangements wherethe sedimentation process is applied are shown in Figure11.15.1.
The top diagram illustrates a settling pond. Aqueouswaste flows through while suspended solids are permittedto gravitate and settle out. Occasionally the settling parti-cles (sludges) are removed, so this system is considered asemibatch process.
The middle diagram shows a circular clarifier equippedwith a solids-removal device. This facilitates continuousclarification, resulting in a lower solid content outlet fluid.
The sedimentation basin is shown in the bottom dia-gram. It uses a belt-type solids collector mechanism to forcesolids to the bottom of the basin’s sloped edge, where theyare removed.
The efficiency of sedimentation treatment depends uponthe depth and surface area of the basin, settling time (based
on the holding time), solid particle size, and the flow rateof the fluid.
Applicability/Limitations
Sedimentation is considered a separation process only.Typically, some type of treatment process for aqueous liq-uids and sludges will follow. Use is restricted to solids thatare more dense than water. It is not suitable for wastesconsisting of emulsified oils. Important sedimentation dataare summarized in Table 11.15.4.
Status. This is a conventional process.
CENTRIFUGATION
Description
Centrifuge involves physical separation of fluid mixturecomponents based on their relative density. A rapidly ro-tating fluid mixture within a rigid vessel deposits the moredense solid particles farthest from the axis of rotation,while liquid supernatant lies separated near the axis.Centripetal forces in centrifugation are similar to gravita-tional forces in sedimentation, except the centripetal forcesare thousands of times stronger than gravitational forces,depending upon centrifuge diameter and rotational speed.
Applicability/Limitations
This treatment is limited to dewatering sludges (includingmetal-bearing sludges), separating oils from water, andclarification of viscous gums and resins. Centrifuges aregenerally better suited than vacuum filters for dewateringsticky or gelatinous sludges. Disc-type centrifuges (Figure11.15.2) can be used to separate three component mix-tures (e.g. oil, water, and solids). Centrifuges often cannotbe used for clarification since they may fail to remove lessdense solids and those small enough to remain in suspen-sion. Recovery and removal efficiencies may be improvedif paper or cloth filters are used.
Status. This process is commercially available.
©1999 CRC Press LLC
TABLE 11.15.3 IMPORTANT CHEMICALTREATMENT DATA NEEDS
Data Need Purpose
pH pH Adjustment Needs, CorrosivityTurbidity/Opacity PhotolysisConstituent analysis Treatment NeedHalogen Content Dehalogenation
Note: Generally, the data needs for evaluating and comparing chemical treat-ment technologies include the data needs identified for physical treatment tech-nologies.
TABLE 11.15.4 IMPORTANT SEDIMENTATIONDATA NEEDS
Data Need Purpose
Viscosity of High viscosity hindersaqueous waste sedimentation
Oil and grease Not applicable tocontent of wastes containingwaste stream emulsified oils
Specific gravity of Must by greater than 1suspended solids for sedimentation to occur
��������Accumulated Settled Particles
Periodically Removed by Mechanical Shovel
Overflow Discharge Weir
Settling Pond
Inlet Liquid
�
��
Circular Clarifier
Inlet Liquid
Circular Baffle
Annular Overflow Weir
Outlet LiquidLiquid Flow
Settling Particles
Collected and Periodically Removed
Sludge Drawoff
Inlet ZoneSettling Zone
Revolving CollectionMechanism
Settled Particles
Outlet Zone
Outlet Liquid
Belt-Type SolidsCollection Mechanism
Settling ParticlesTrajectoryInlet Liquid
Settled Particles Collectedand Periodically Removed
Inlet Zone
Baffles to MaintainQuiescent Conditions
Sedimentation Basin
FIG. 11.15.1 Representative types of sedimentation.

FLOCCULATION
Description
Flocculation is used to enhance sedimentation or centrifu-gation. The waste stream is mixed while a flocculatingchemical is added. Flocculants adhere readily to suspendedsolids and to each other (agglomeration), and the resul-tant particles are too large to remain in suspension. Floccu-lation is used primarily for the precipitation of inorganics.
Availability/Limitations
The extent of flocculation depends upon waste stream flowrate, composition, and pH. This process is not recom-mended for a highly viscous waste stream. Table 11.15.5presents the important flocculation data needs.
Status. Flocculation is a conventional, demonstratedtreatment technique.
OIL/WATER SEPARATION
Description
As in sedimentation, the force of gravity can be used toseparate two or more immiscible liquids with sufficientlydifferent densities, such as oil and water. Liquid/liquid sep-
aration occurs when the liquid mix settles. Thus, flow ratesin continuous processes must be kept low. The waste flowsinto a chamber, where it is kept quiescent, and permittedto settle. The floating oil is skimmed off the top using anoil skimmer while the water or effluent flows out of thelower portion of the chamber. Acids may be used to breakoil/water emulsion and to enhance this process for efficientoil removal.
Availability/Limitations
Effectiveness can be influenced by waste stream flow rate,temperature, and pH. Separation is a pretreatment processif the skimmed oil requires further treatment.
Status. Mobile phase separators are commercially avail-able.
DISSOLVED AIR FLOTATION
Description
Dissolved air flotation involves removing suspended par-ticles or mixed liquids from an aqueous waste stream(Figure 11.15.3). The mixture to be separated is saturatedwith air or another gas such as nitrogen, then air pressureis reduced above the treatment tank. As air escapes the so-lution, microbubbles form and are readily adsorbed ontosuspended solids or oils, enhancing their flotation charac-teristics. In the flotation chamber, separate oil or other
©1999 CRC Press LLC
TABLE 11.15.5 IMPORTANT FLOCCULATIONDATA NEEDS
Data Need Purpose
pH of waste Selection offlocculating agent
Viscosity of waste Affects settling ofsystem agglomerated solids;
high viscosity notsuitable
Settling rate of suspended Selection ofsolids flocculating agent
FIG. 11.15.2 Disk-centrifuge bowls. (a) separator, solid wall;(b) recycle clarifier, nozzle discharge.
Feed
Light-phaseeffluent
Heavy-phaseeffluent
Solidsholdingspace
Feed
Clarifiedeffluent
Concentratedsolid phase
Recycle
(a)
(b)
LIQUID
LIGHTSOLIDS
HEAVYSOLIDS(SLUDGE)
PRESSURIZEDAIR BUBBLES
FEED
AIRTANK
AIR/SOLIDS MIX
RECYCLE
FIG. 11.15.3 Recycle flow dissolved air flotation system.Source: Peabody-Welles, Roscoe, Il.
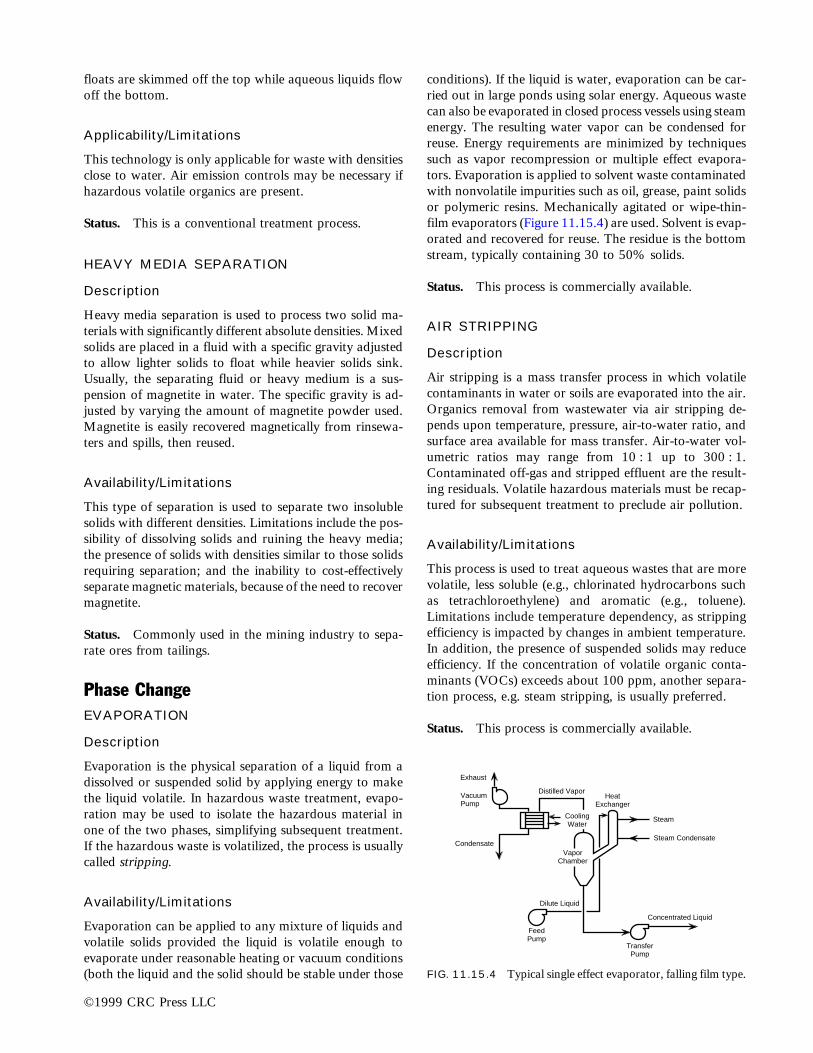
floats are skimmed off the top while aqueous liquids flowoff the bottom.
Applicability/Limitations
This technology is only applicable for waste with densitiesclose to water. Air emission controls may be necessary ifhazardous volatile organics are present.
Status. This is a conventional treatment process.
HEAVY MEDIA SEPARATION
Description
Heavy media separation is used to process two solid ma-terials with significantly different absolute densities. Mixedsolids are placed in a fluid with a specific gravity adjustedto allow lighter solids to float while heavier solids sink.Usually, the separating fluid or heavy medium is a sus-pension of magnetite in water. The specific gravity is ad-justed by varying the amount of magnetite powder used.Magnetite is easily recovered magnetically from rinsewa-ters and spills, then reused.
Availability/Limitations
This type of separation is used to separate two insolublesolids with different densities. Limitations include the pos-sibility of dissolving solids and ruining the heavy media;the presence of solids with densities similar to those solidsrequiring separation; and the inability to cost-effectivelyseparate magnetic materials, because of the need to recovermagnetite.
Status. Commonly used in the mining industry to sepa-rate ores from tailings.
Phase ChangeEVAPORATION
Description
Evaporation is the physical separation of a liquid from adissolved or suspended solid by applying energy to makethe liquid volatile. In hazardous waste treatment, evapo-ration may be used to isolate the hazardous material inone of the two phases, simplifying subsequent treatment.If the hazardous waste is volatilized, the process is usuallycalled stripping.
Availability/Limitations
Evaporation can be applied to any mixture of liquids andvolatile solids provided the liquid is volatile enough toevaporate under reasonable heating or vacuum conditions(both the liquid and the solid should be stable under those
conditions). If the liquid is water, evaporation can be car-ried out in large ponds using solar energy. Aqueous wastecan also be evaporated in closed process vessels using steamenergy. The resulting water vapor can be condensed forreuse. Energy requirements are minimized by techniquessuch as vapor recompression or multiple effect evapora-tors. Evaporation is applied to solvent waste contaminatedwith nonvolatile impurities such as oil, grease, paint solidsor polymeric resins. Mechanically agitated or wipe-thin-film evaporators (Figure 11.15.4) are used. Solvent is evap-orated and recovered for reuse. The residue is the bottomstream, typically containing 30 to 50% solids.
Status. This process is commercially available.
AIR STRIPPING
Description
Air stripping is a mass transfer process in which volatilecontaminants in water or soils are evaporated into the air.Organics removal from wastewater via air stripping de-pends upon temperature, pressure, air-to-water ratio, andsurface area available for mass transfer. Air-to-water vol-umetric ratios may range from 10 : 1 up to 300 : 1.Contaminated off-gas and stripped effluent are the result-ing residuals. Volatile hazardous materials must be recap-tured for subsequent treatment to preclude air pollution.
Availability/Limitations
This process is used to treat aqueous wastes that are morevolatile, less soluble (e.g., chlorinated hydrocarbons suchas tetrachloroethylene) and aromatic (e.g., toluene).Limitations include temperature dependency, as strippingefficiency is impacted by changes in ambient temperature.In addition, the presence of suspended solids may reduceefficiency. If the concentration of volatile organic conta-minants (VOCs) exceeds about 100 ppm, another separa-tion process, e.g. steam stripping, is usually preferred.
Status. This process is commercially available.
©1999 CRC Press LLC
Exhaust
VacuumPump
Condensate
Distilled VaporHeat
Exchanger
Steam
Steam Condensate
Dilute Liquid
FeedPump
Concentrated Liquid
TransferPump
VaporChamber
CoolingWater
FIG. 11.15.4 Typical single effect evaporator, falling film type.

STEAM STRIPPING
Description
Steam stripping uses steam to evaporate volatile organicsfrom aqueous wastes. Steam stripping is essentially a con-tinuous fractional distillation process carried out in apacked or tray tower. Clean steam, rather than reboiledbottoms, provide direct heat to the column, and gas flowsfrom the bottom to the top of the tower (Figure 11.15.5).The resulting residuals are contaminated steam conden-sate, recovered solvent and stripped effluent. The organicvapors and the raffinate are sent through a condenser inpreparation for further purification treatment. The bottomrequires further consideration as well. Possible post-treat-ment includes incineration, carbon adsorption, or land dis-posal.
Availability/Limitations
Steam stripping is used to treat aqueous wastes contami-nated with chlorinated hydrocarbons, aromatics such asxylenes, ketones such as acetone or MEK, alcohols suchas methanol, and high-boiling-point chlorinated aromat-ics such as pentachlorophenol. Steam stripping will treatless volatile and more soluble wastes than will air strip-ping and can handle a wide concentration range (e.g., from
less than 100 ppm to about 10% organics). Steam strip-ping requires an air pollution control (APC) mechanismto eliminate toxic emissions.
Status. Conventional, well documented.
DISTILLATION
Description
Distillation is simply evaporation followed by condensa-tion. The separation of volatile materials is optimized bycontrolling the evaporation-stage temperature and pres-sure, and the condenser temperature. Distillation separatesmiscible organic liquids for solvent reclamation and wastevolume reduction. Two types of distillation processes arebatch distillation and continuous fractional distillation.
Availability/Limitations
Distillation is used to separate liquid organic wastes, pri-marily spent solvents, for full or partial recovery and reuse.Both halogenated and nonhalogenated solvents can be re-covered via distillation. Liquids to be separated must havedifferent volatilities. Distillation for recovery is limited bythe presence of volatile or thermally reactive suspendedsolids. If constituents in the input waste stream form anazeotrope (a specific mixture of liquids exhibiting maxi-mum or minimum boiling point with the individual con-stituents), the energy cost to break the azeotrope can beprohibitive.
Batch distillation in a heated still pot with condensa-tion of overhead vapors is easily controlled and flexible,but cannot achieve the high product quality typical of con-tinuous fractional distillation. Small, packaged-batch stillstreating one drum or less per day are becoming popularfor on-site recovery of solvents. Continuous fractional dis-tillation is accomplished in tray columns or packedcolumns ranging up to 40 ft in diameter and 200 ft high.Each is equipped with a reboiler, a condenser, and an ac-cumulator. Unit capacity is a function of the processedwaste, purity requirements, reflux ratios, and heat input.Fractional distillation is not applicable to liquids with highviscosity at high temperature, liquids with high solid con-centrations, polyurethanes, or inorganics.
Status. Commercially available.
DissolutionSOIL FLUSHING/SOIL WASHING
Soil is comprised of fine-grained (e.g., silt and clay) andcoarse-grained (e.g., sand and gravel) particles, organic ma-terials (e.g., decayed plant and animal matter), water, andair. Contaminants bind readily, chemically or physically,to silt, clay, and organic matter. Silt, clay, and organic mat-
©1999 CRC Press LLC
OrganicVapors
LiquidFeed
SieveTray
CartridgeSupport
Rods
Downcomer
Heat
Flow
Steam
StrippedEffluent
FIG. 11.15.5 Steam stripping column, perforated tray type.

ter bind physically to sand and gravel. When soil containslarge amounts of clay and organic materials, contaminantsattach more easily to the soil and are more difficult to re-move.
Description
Soil flushing is an in-situ extraction of inorganic and or-ganic compounds from soil, and is accomplished bypassing extractant solvents through the soils using aninjection and recirculation process. Solvents may include:water, water-surfactant mixtures, acids, bases (for in-organics), chelating agents, oxidizing agents, or reducingagents. Soil washing consists of similar treatments, butthe soil is excavated and treated at the surface in a soilwasher.
A simplified drawing of the soil washing process is il-lustrated in Figure 11.15.6. The contaminated soil is re-moved to a staging area, then sifted to remove debris andlarge objects such as rocks. The remaining material entersa soil scrubbing unit, is mixed with a washing solution,and agitated. The washing solution may be water, or maycontain some additives like detergent to remove contami-nants. Then the washwater is drained and the soil is rinsedwith clean water. The heavier sand and gravel particles inthe processed soil settle out and are tested for contami-nants. If clean, these materials can be used on site or takenelsewhere for backfill. If contaminated, these materials mayundergo soil washing again.
The contaminated silt and clay in the washwater settleout and are then separated from the washwater. The wash-water, which also contains contaminants, undergoeswastewater treatment processes for future recycling use.This wastewater may contain additives that interfere withthe wastewater treatment process. If so, the additives mustbe removed or neutralized by pretreatment methods be-fore wastewater treatment. The silts and clays are thentested for contaminants. If clean, these materials can beused on the site or taken elsewhere for backfill. If contam-inated, these materials may undergo soil washing again,or be collected for alternate treatment or off-site disposalin a permitted RCRA landfill.
Availability/Limitations
Soil flushing and washing fluids must have: good extrac-tion coefficients; low volatility and toxicity; capability forsafe and easy handling, and, most important, be recover-able and recyclable. This technology is very promising inextracting heavy metals from soil, although problems arelikely in dry or organically-rich soils. Surfactants can beused to extract hydrophobic organisms. Soil type and uni-formity are important. Certain surfactants, when tested forin-situ extraction, clogged soil pores and precluded furtherflushing.
Status. The U.S. EPA in Edison, New Jersey, has a mo-bile soil washer; other systems are under development.
©1999 CRC Press LLC
����������������������������
��������������������������������������������������������������������������������������������������
���������������������������
��������������������������������
������������������������������������������������
������������������������������������������
����������������������������������������������������������������������������������������
��������������������������������������������������������������������������������������������������������������������������������
Recycled Water
Washing Solution
Contaminated Soil
Soil WashingProcess
On-SiteWastewaterTreatment
Washwater
Residual Material ToOther
Treatment/Disposal
No
Yes
Clean Soil(Returned ToExcavation)
Oversized Rejects(Boulders, Logs, Etc.) ToOther Treatment/Disposal
WastewaterPretreatment
Air EmissionsControl
DoesWashwater
Contain"Interfering"Additives?
To Off-SiteWastewaterTreatment
FIG. 11.15.6 Simplified soil washing process flow. (Reprinted from U.S. Environmental Protection Agency (EPA),1992, A citizen’s guide to glycolate dehalogenation [EPA 524–F–92–005], Office of Solid Waste and EmergencyResponse [March]).

CHELATION
Description
A chelating molecule contains atoms that form ligandswith metal ions. If the number of such atoms in the mol-ecule is sufficient, and if the molecular shape is such thatthe final atom is essentially surrounded, then the metal willbe unable to form ionic salts which can precipitate out.Thus chelation is used to keep metals in solution and toaid in dissolution for subsequent transport and removal(e.g., soil washing).
Applicability/Limitations
Chelating chemicals are chosen for their affinity to par-ticular metals (e.g., EDTA and calcium). The presence offats and oils can interfere with the process.
Status. Chelating chemicals are commercially available.
LIQUID/LIQUID EXTRACTION
Description
Two liquids that are well mixed or mutually soluble maybe separated by liquid/liquid extraction. The process re-quires that a third liquid be added to the original mix. Thisthird liquid must be a solvent for one of the original com-ponents, but must be insoluble in and immiscible with theother. The final solvent and solute stream can be separatedby distillation or other chemical means, and the extract-ing solvent captured and reused.
Availability/Limitations
Complete separation is rarely achieved, and some form ofpost–treatment is required for each separated stream. Toeffectively recover solvent and solute materials from theprocess, other treatments such as distillation or strippingare needed.
Status. This is a demonstrated process.
SUPERCRITICAL EXTRACTION
Description
At a certain temperature and pressure, fluids reach theircritical point, beyond which their solvent properties aregreatly enhanced. For instance, supercritical water is anexcellent non-polar solvent in which most organics arereadily soluble. These properties make extraction morerapid and efficient than distillation or conventional solventextraction methods. Presently, the use of supercritical car-bon dioxide to extract hazardous organics is being inves-tigated.
Availability/Limitations
This technology may be useful in extracting hazardouswaste from aqueous streams. Specific applicability and lim-itations are not yet known.
Status. This process has been demonstrated on a labo-ratory scale.
Size/Adsorptivity/Ionic CharacteristicsFILTRATION
Description
Filtration is the separation and removal of suspended solidsfrom a liquid by passing the liquid through a porousmedium. The porous medium may be a fibrous fabric (pa-per or cloth), a screen, or a bed of granular material. Thefilter medium may be precoated with a filtration aid suchas ground cellulose or diatomaceous earth. Fluid flowthrough the filter medium may be accomplished by grav-ity, by inducing a partial vacuum on one side of themedium, or by exerting mechanical pressure on a dewat-erable sludge enclosed by filter medium.
Availability/Limitations
Filtration is used to dewater sludges and slurries as pre-treatment for other processes. It is also a polishing step fortreated waste, reducing suspended solids and associatedcontaminants to low levels. Pretreatment by filtration isappropriate for membrane separation, ion exchange, andcarbon adsorption to prevent plugging or overloadingthese processes. Filtration of settled waste is often requiredto remove undissolved heavy metals present as suspendedsolids. Filtration does not reduce waste toxicity, althoughpowdered activated carbon may be used as an adsorbentand filter aid. Filtration should not be used with sticky orgelatinous sludges, due to the likelihood of filter mediaplugging.
Status. This process is commercially available.
CARBON ADSORPTION
Description
Most organic and inorganic compounds will readily at-tach to carbon atoms. The strength of that attachment—and the energy for subsequent desorption—depends on thebond formed, which in turn depends on the specific com-pound being adsorbed. Carbon used for adsorption istreated to produce a high surface-to-volume ratio(900 : 1,300 sq.m/g), exposing a practical maximum num-ber of carbon atoms for active adsorbtion. This treatedcarbon is said to be activated for adsorption. When acti-
©1999 CRC Press LLC

vated carbon has adsorbed so much contaminant that itsadsorptive capacity is severely depleted, it is said to bespent. Spent carbon can be regenerated, but for stronglyadsorbed contaminants, the cost of such regeneration ishigher than simple replacement with new carbon.
Availability/Limitations
This process is used to treat single-phase aqueous organicwastes with high molecular weight and boiling point, andlow solubility and polarity; chlorinated hydrocarbons suchas tetrachloroethylene; and aromatics such as phenol. It isalso used to capture volatile organics in gaseous mixtures.Limitations are economic, relating to how rapidly the car-bon becomes spent. As an informal guide, concentrationsshould be less than 10,000 ppm; suspended solids less than50 ppm; and dissolved inorganics, oil, and grease less than10 ppm.
Status. Conventional, demonstrated.
REVERSE OSMOSIS
Description
In normal osmotic processes, solvent flows across a semi-permeable membrane from a dilute solution to a more con-centrated solution until equilibrium is reached. Applyinghigh pressure to the concentrated side causes the processto reverse. Solvent flows from the concentrated solution,leaving an even higher concentration of solute. The semi-permeable membrane can be flat or tubular, and acts likea filter due to the pressure driving force. The waste streamflows through the membrane, while the solvent is pulledthrough the membrane’s pores. The remaining solutes, suchas organic or inorganic components, do not pass through,but become more and more concentrated on the influentside of the membrane.
Availability/Limitations
For efficient reverse osmosis, the semi-permeable mem-brane’s chemical and physical properties must be com-patible with the waste stream’s chemical and physical char-acteristics. Some membranes will be dissolved by somewastes. Suspended solids and some organics will clog themembrane material. Low-solubility salts may precipitateonto the membrane surface.
Status. Commercial units are available.
ION EXCHANGE
Description
Although some ion exchange media occur naturally, thisprocess normally uses specially formulated resins with an
exchangeable ion bonded to the resin with a weak ionicbond. Ion exchange depends upon the electrochemical po-tential of the ion to be recovered versus that of the ex-change ion; it also depends upon the concentration of theions in the solution. After a critical relative concentrationof recoverable ion to exchanged ion in the solution is ex-ceeded, the exchanged resin is said to be spent. Spent resinis usually recharged by exposure to a concentrated solu-tion of the original exchange ion, causing a reverse ex-change. This results in regenerated resin and a concen-trated solution of the removed ion, which can be furtherprocessed for recovery and reuse. This process is used toremove toxic metal ions from solution to recover concen-trated metal for recycling. The residuals include spentresins and spent regenerants such as acid, caustic, or brine.
Availability/Limitations
This technology is used to treat metal wastes includingcations (e.g., Ni21, Cd21, Hg21) and anions (e.g., CrO4
22,SeO4
22, HAsO422). Limitations are selectivity and compe-
tition, pH, and suspended solids. Concentrated wastestreams with greater than 25,000 mg/L contaminants canbe more cost-effectively separated by other means. Solidconcentrations greater than 50 mg/L should be avoided toprevent resin blinding.
Status. This is a commercially available process.
ELECTRODIALYSIS
Description
Electrodialysis concentrates or separates ionic species con-tained in a water solution. In electrodialysis, a water so-lution is passed through alternately placed cation-perme-able and anion-permeable membranes (Figure 11.15.7). An
©1999 CRC Press LLC
������������
����������������
������
��
-
-
-
-
-
-
-
-
-
-
-
+
+
+
+
+
+
+
+
+
+
+
��
����
����
����
��
C A C A
A - Anion permeable membraneC - Cation permeable membrane
DilutingCompartment
DilutingCompartment
ConcentratingCompartment
Anion- Cation+
FIG. 11.15.7 Electrodialysis. An electric current concentratesthe dissolved ions in compartments adjacent to those betweenthe electrodes.

electrical potential is applied across the membrane to pro-vide the motive force for ion migration. The ion-selectivemembranes are thin sheets of ion exchange resins rein-forced by a synthetic fiber backing.
Availability/Limitations
The process is well established for purifying brackish wa-ter, and was recently demonstrated for recovery of metalsalts from plating rinse.
Status. Units are being marketed to reclaim metals ofvalue from rinse streams. Such units can be skid mountedand require only piping and electrical connections.
Chemical Treatment ProcessesNEUTRALIZATION
Description
When an ionic salt is dissolved in water, several watermolecules break into their ionic constituents of H1 andOH2. Neutralization is the process of changing theconstituents in an ionic solution until the number ofhydrogen ions (H1) is balanced by the hydroxyl (OH2)ions. Imbalance is measured in terms of the hydrogenion (H1) concentration, and is described as the solu-tion’s pH. Neutrality, on the pH scale, is 7; an excessof H1 ions (acidity) is listed at between 0 and 7; andan excess of hydroxy or OH2 ions (alkalinity) is indi-cated as between 7 and 14. Neutralization is used totreat waste acids and alkalis (bases) to eliminate or re-duce reactivity and corrosivity. Neutralization is an in-expensive treatment, especially if waste alkalis can beused to treat waste acid and vice/versa. Residuals in-clude neutral effluents containing dissolved salts, andany precipitated salts.
Applicability/Limitations
This process has extremely wide application to aqueousand nonaqueous liquids, slurries, and sludges. Some ap-plications include pickle liquors, plating wastes, minedrainage, and oil emulsion breaking. The treated streamundergoes essentially no change in physical form, exceptprecipitation or gas evolution.
The process should be performed in a well-mixed sys-tem to ensure completeness (Figure 11.15.8). Compatibil-ity of the waste and treatment chemicals should be ensuredto prevent formation of more toxic or hazardous com-pounds than were originally present.
Status. This is a common industrial process.
CHEMICAL PRECIPITATION
Description
Like neutralization, chemical precipitation is a pH adjust-ment process. To achieve precipitation, an acid or base isadded to a solution to adjust the pH to a point where theconstituents to be removed reach their lowest solubility.Chemical precipitation facilitates the removal of dissolvedmetals from aqueous wastes. Metals may be precipitatedfrom solutions by the following methods.
Alkaline agents, such as lime or caustic soda, are added towaste streams to raise the pH. The solubility of metalsdecreases as pH increases, and the metal ions precipi-tate out of the solution as hydroxide (Figure 11.15.9).
©1999 CRC Press LLC
WasteCausticStorage
WasteAcid
Storage
Mixer
Effluent
pH Controller
H++OH- H2O+Salt
FIG. 11.15.8 Simultaneous neutralization of acid and causticwaste.
Experimentally determined solubilities of metal hydroxides.
pH6 7 8 9 10 11 12
Sol
ubili
ty m
g/1
Pb
Ag
Zn
Cd
Fe
NiCu
Fe
100
10
1.0
1
.01
.001
.0001
FIG. 11.15.9 Solubilities of metal hydroxides at various pH’s.(Reprinted, with permission from Graver Water.)
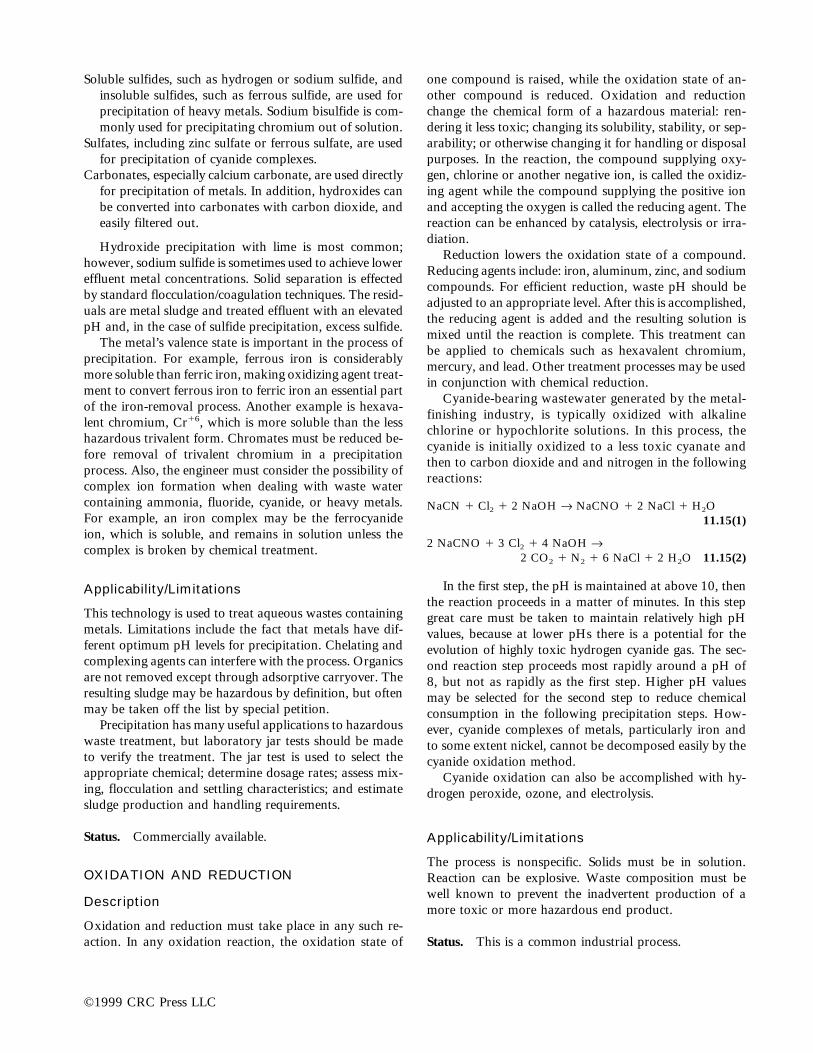
Soluble sulfides, such as hydrogen or sodium sulfide, andinsoluble sulfides, such as ferrous sulfide, are used forprecipitation of heavy metals. Sodium bisulfide is com-monly used for precipitating chromium out of solution.
Sulfates, including zinc sulfate or ferrous sulfate, are usedfor precipitation of cyanide complexes.
Carbonates, especially calcium carbonate, are used directlyfor precipitation of metals. In addition, hydroxides canbe converted into carbonates with carbon dioxide, andeasily filtered out.
Hydroxide precipitation with lime is most common;however, sodium sulfide is sometimes used to achieve lowereffluent metal concentrations. Solid separation is effectedby standard flocculation/coagulation techniques. The resid-uals are metal sludge and treated effluent with an elevatedpH and, in the case of sulfide precipitation, excess sulfide.
The metal’s valence state is important in the process ofprecipitation. For example, ferrous iron is considerablymore soluble than ferric iron, making oxidizing agent treat-ment to convert ferrous iron to ferric iron an essential partof the iron-removal process. Another example is hexava-lent chromium, Cr16, which is more soluble than the lesshazardous trivalent form. Chromates must be reduced be-fore removal of trivalent chromium in a precipitationprocess. Also, the engineer must consider the possibility ofcomplex ion formation when dealing with waste watercontaining ammonia, fluoride, cyanide, or heavy metals.For example, an iron complex may be the ferrocyanideion, which is soluble, and remains in solution unless thecomplex is broken by chemical treatment.
Applicability/Limitations
This technology is used to treat aqueous wastes containingmetals. Limitations include the fact that metals have dif-ferent optimum pH levels for precipitation. Chelating andcomplexing agents can interfere with the process. Organicsare not removed except through adsorptive carryover. Theresulting sludge may be hazardous by definition, but oftenmay be taken off the list by special petition.
Precipitation has many useful applications to hazardouswaste treatment, but laboratory jar tests should be madeto verify the treatment. The jar test is used to select theappropriate chemical; determine dosage rates; assess mix-ing, flocculation and settling characteristics; and estimatesludge production and handling requirements.
Status. Commercially available.
OXIDATION AND REDUCTION
Description
Oxidation and reduction must take place in any such re-action. In any oxidation reaction, the oxidation state of
one compound is raised, while the oxidation state of an-other compound is reduced. Oxidation and reductionchange the chemical form of a hazardous material: ren-dering it less toxic; changing its solubility, stability, or sep-arability; or otherwise changing it for handling or disposalpurposes. In the reaction, the compound supplying oxy-gen, chlorine or another negative ion, is called the oxidiz-ing agent while the compound supplying the positive ionand accepting the oxygen is called the reducing agent. Thereaction can be enhanced by catalysis, electrolysis or irra-diation.
Reduction lowers the oxidation state of a compound.Reducing agents include: iron, aluminum, zinc, and sodiumcompounds. For efficient reduction, waste pH should beadjusted to an appropriate level. After this is accomplished,the reducing agent is added and the resulting solution ismixed until the reaction is complete. This treatment canbe applied to chemicals such as hexavalent chromium,mercury, and lead. Other treatment processes may be usedin conjunction with chemical reduction.
Cyanide-bearing wastewater generated by the metal-finishing industry, is typically oxidized with alkalinechlorine or hypochlorite solutions. In this process, thecyanide is initially oxidized to a less toxic cyanate andthen to carbon dioxide and and nitrogen in the followingreactions:
NaCN 1 Cl2 1 2 NaOH ® NaCNO 1 2 NaCl 1 H2O11.15(1)
2 NaCNO 1 3 Cl2 1 4 NaOH ®2 CO2 1 N2 1 6 NaCl 1 2 H2O 11.15(2)
In the first step, the pH is maintained at above 10, thenthe reaction proceeds in a matter of minutes. In this stepgreat care must be taken to maintain relatively high pHvalues, because at lower pHs there is a potential for theevolution of highly toxic hydrogen cyanide gas. The sec-ond reaction step proceeds most rapidly around a pH of8, but not as rapidly as the first step. Higher pH valuesmay be selected for the second step to reduce chemicalconsumption in the following precipitation steps. How-ever, cyanide complexes of metals, particularly iron andto some extent nickel, cannot be decomposed easily by thecyanide oxidation method.
Cyanide oxidation can also be accomplished with hy-drogen peroxide, ozone, and electrolysis.
Applicability/Limitations
The process is nonspecific. Solids must be in solution.Reaction can be explosive. Waste composition must bewell known to prevent the inadvertent production of amore toxic or more hazardous end product.
Status. This is a common industrial process.
©1999 CRC Press LLC
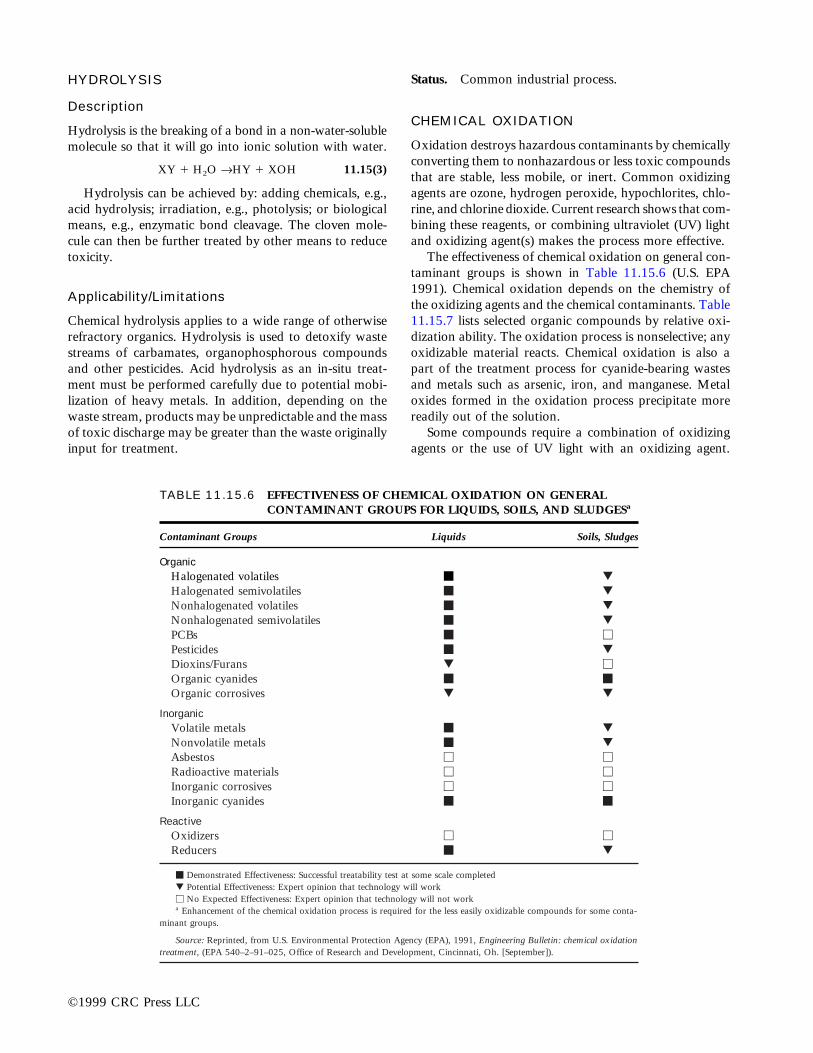
HYDROLYSIS
Description
Hydrolysis is the breaking of a bond in a non-water-solublemolecule so that it will go into ionic solution with water.
XY 1 H2O ®HY 1 XOH 11.15(3)
Hydrolysis can be achieved by: adding chemicals, e.g.,acid hydrolysis; irradiation, e.g., photolysis; or biologicalmeans, e.g., enzymatic bond cleavage. The cloven mole-cule can then be further treated by other means to reducetoxicity.
Applicability/Limitations
Chemical hydrolysis applies to a wide range of otherwiserefractory organics. Hydrolysis is used to detoxify wastestreams of carbamates, organophosphorous compoundsand other pesticides. Acid hydrolysis as an in-situ treat-ment must be performed carefully due to potential mobi-lization of heavy metals. In addition, depending on thewaste stream, products may be unpredictable and the massof toxic discharge may be greater than the waste originallyinput for treatment.
Status. Common industrial process.
CHEMICAL OXIDATION
Oxidation destroys hazardous contaminants by chemicallyconverting them to nonhazardous or less toxic compoundsthat are stable, less mobile, or inert. Common oxidizingagents are ozone, hydrogen peroxide, hypochlorites, chlo-rine, and chlorine dioxide. Current research shows that com-bining these reagents, or combining ultraviolet (UV) lightand oxidizing agent(s) makes the process more effective.
The effectiveness of chemical oxidation on general con-taminant groups is shown in Table 11.15.6 (U.S. EPA1991). Chemical oxidation depends on the chemistry ofthe oxidizing agents and the chemical contaminants. Table11.15.7 lists selected organic compounds by relative oxi-dization ability. The oxidation process is nonselective; anyoxidizable material reacts. Chemical oxidation is also apart of the treatment process for cyanide-bearing wastesand metals such as arsenic, iron, and manganese. Metaloxides formed in the oxidation process precipitate morereadily out of the solution.
Some compounds require a combination of oxidizingagents or the use of UV light with an oxidizing agent.
©1999 CRC Press LLC
TABLE 11.15.6 EFFECTIVENESS OF CHEMICAL OXIDATION ON GENERALCONTAMINANT GROUPS FOR LIQUIDS, SOILS, AND SLUDGESa
Contaminant Groups Liquids Soils, Sludges
OrganicHalogenated volatiles m ▼
Halogenated semivolatiles m ▼
Nonhalogenated volatiles m ▼
Nonhalogenated semivolatiles m ▼
PCBs m MPesticides m ▼
Dioxins/Furans ▼ MOrganic cyanides m mOrganic corrosives ▼ ▼
InorganicVolatile metals m ▼
Nonvolatile metals m ▼
Asbestos M MRadioactive materials M MInorganic corrosives M MInorganic cyanides m m
ReactiveOxidizers M MReducers m ▼
m Demonstrated Effectiveness: Successful treatability test at some scale completed▼ Potential Effectiveness: Expert opinion that technology will workM No Expected Effectiveness: Expert opinion that technology will not worka Enhancement of the chemical oxidation process is required for the less easily oxidizable compounds for some conta-
minant groups.
Source: Reprinted, from U.S. Environmental Protection Agency (EPA), 1991, Engineering Bulletin: chemical oxidationtreatment, (EPA 540–2–91–025, Office of Research and Development, Cincinnati, Oh. [September]).

Polychlorinated biphenyls (PCBs) do not react with ozonealone, but have been destroyed by combined UV and ozonetreatment. Enhanced chemical oxidation has been used atseveral Superfund sites (U.S. EPA 1990a).
Description
Chemical oxidation increases the oxidation state of a con-taminant and decreases the oxidation state of the reactant.The electrons lost by the contaminant are gained by theoxidizing agent. The following equation is an example ofoxidation reaction:
NaCN 1 H2O2 ® NaCNO 1 H2O 11.15(4)
Figure 11.15.10 details the process flow for a chemicaloxidation system. The main component is the processreactor. Oxidant is fed into the mixing unit (1), then thereactor (2). Reaction products and excess oxidant arescrubbed before venting to the ambient air. Reactor pHand temperature are controlled to ensure completion atthe reaction. The reaction can be enhanced by addingUV light.
Systems that combine ozone with hydrogen peroxide orUV radiation are catalytic ozonation processes. They ac-celerate ozone decomposition, increasing hydroxyl radicalconcentration, and promoting oxidation of the com-pounds. Specifically, hydrogen peroxide, hydrogen ion,and UV radiation have been found to initiate ozone de-composition and accelerate oxidation of refractory organ-ics via free radical reaction. Reaction times can be 100 to1000 times faster in the presence of UV light. Minimalemissions result from the UV-enhanced system.
Applicability/Limitations
This process is nonspecific. Solids must be in solution.It may be exothermic or explosive or require addition
of heat. Waste composition must be well-known toprevent producing a more toxic or hazardous end prod-uct. Oxidation by hydrogen peroxide is not applicablefor in situ treatment. However, it may be used for sur-face treatment of contaminated groundwater sludge.Oxidation is not cost-effective for highly concentratedwaste because of the large amount of oxidizing agentrequired.
Ozone can be used to pretreat wastes to break downrefractory organics or to oxidize untreated organicsafter biological or other treatment processes. Ozone iscurrently used to destroy cyanide and phenolic com-pounds. Rapid oxidation offers advantages over theslower alkaline chlorination method. Limitations in-clude the physical form of the waste (i.e., sludges andsolids are not readily treated) and non-selective com-petition with other species. Ozonation systems havehigher capital costs because ozone generators must beused.
The cost of generating UV lights and the problems ofscaling or coating on the lamps are two of the major draw-backs to UV-enhanced chemical oxidation systems. Theydo not perform well in turbid waters or slurries becausereduced light transmission lowers the effectiveness.
Status. Commercially available.
ELECTROLYTIC OXIDATION
Description
In this process, cathodes and anodes are immersed in atank containing waste to be oxidized, and a direct currentis imposed on the system. This process is particularly ap-plicable to cyanide-bearing wastes. Reaction products areammonia, urea, and carbon dioxide. During decomposi-tion, metals are plated out on the cathodes.
©1999 CRC Press LLC
TABLE 11.15.7 SELECTED ORGANIC COMPOUNDSBY RELATIVE ABILITY TO BEOXIDIZED
Ability to be Oxidized Examples
High phenols, aldehydes, amines,some sulfur compounds
Medium alcohols, ketones, organicacids, esters, alkyl-substituted aromatics,nitro-substituted aromatics,carbohydrates
Low halogenated hydrocarbons,saturated aliphatics, benzene
Source: Reprinted, from U.S. EPA, 1991.
Scrubber
(3)
OxidantStorage
Tank
Reactor
(2)
OxidantMixing Unit
(1)
pH Adjustment
Temperature Adjustment
VENT GAS
CONTAMINANTS
EFFLUENT
WATER
FIG. 11.15.10 Process flow diagram for chemical oxidationsystem. (Reprinted from U.S. EPA, 1991.)

Applicability/Limitations
Electrolytic oxidation is used to treat high concentrationsof up to 10% cyanide and to separate metals to allow theirpotential recovery. Limitations include the physical form ofthe feed (solids must be dissolved), non-selective competi-tion with other species and long process times. Electrolyticrecovery of single metal species can be 90% or higher.
Status. Commercially available.
ALKALINE METAL DECHLORINATION
Description
This process of chemical dechlorination displaces chlorinefrom chlorinated organic compounds contained in oils andliquid wastes. Typically, wastes are filtered before enter-ing the reactor system and encountering the dechlorinat-ing reagent. The great affinity of alkali metals for chlorine(or any halide) is the chemical basis of this process.
Successive treatment includes additional centrifugation andfiltration. By-products include chloride salts, polymers, andheavy metals. Several chemical dechlorination processesare based on a method developed by the Goodyear Tireand Rubber Company in 1980. The original method usessodium naphthalene and tetrahydrofuran to strip chlorineatoms from PCBs, polymerizing the biphenols into an in-ert condensible sludge. The reactor is blanketed with ni-trogen because the reagents are sensitive to air and water,and an excess of reagent to chlorine is required. TheGoodyear Company has not commercially developed thistechnology; however, several companies have modified themethod by substituting their own proprietary reagents forthe naphthalene. The equipment is mobile and can betransported on semi-trailers.
Applicability/Limitations
Such processes are used to treat PCBs, other chlorinatedhydrocarbons, acids, thiols, and dioxins. Moisture content
©1999 CRC Press LLC
������������������������������������������������������������������������������������������������������������������������������������������������������������������
�������������������������������������������������������������������
������������������������������������������������������
������������������������������������������
��������������������������������������������������������������������������������������������������������
������������������������������������������������������������������������������������������������������������������������������������������������������������������
Oversized Rejects(Boulders, Logs, Etc.) to
Other Treatment/Disposal
���������������������������������������������
ContaminatedSoil
RecycledReagent
Reagents
GlycolateDehalogenation
TreatmentVessel
Washer DewaterWater
to PubliclyOwnedTreatmentWorks
TreatedSoils
FurtherTesting andTreatment ifNecessary
Acid
TreatedEmissionsEmissions Control
(Activated Carbon)
Emissions
WaterVapor
Separator
Condensor
TreatmentVessel
Halogen
andAPEG
Reagent
Halogen
HalogenHalogen
Hal
ogen
HalogenPeg
Peg
Hal
ogen
andA-Halogen
(a salt)
Nonhazardous Dehalogenated CompoundHazardous Halogen Compound Treated
Conceptual Diagram of Dehalogenation
Water
5
2
5
1
4
3 6 8
7
FIG. 11.15.11 Glycolate dehalogenation process flow. (Reprinted, from U.S. EPA, 1992 [March].)
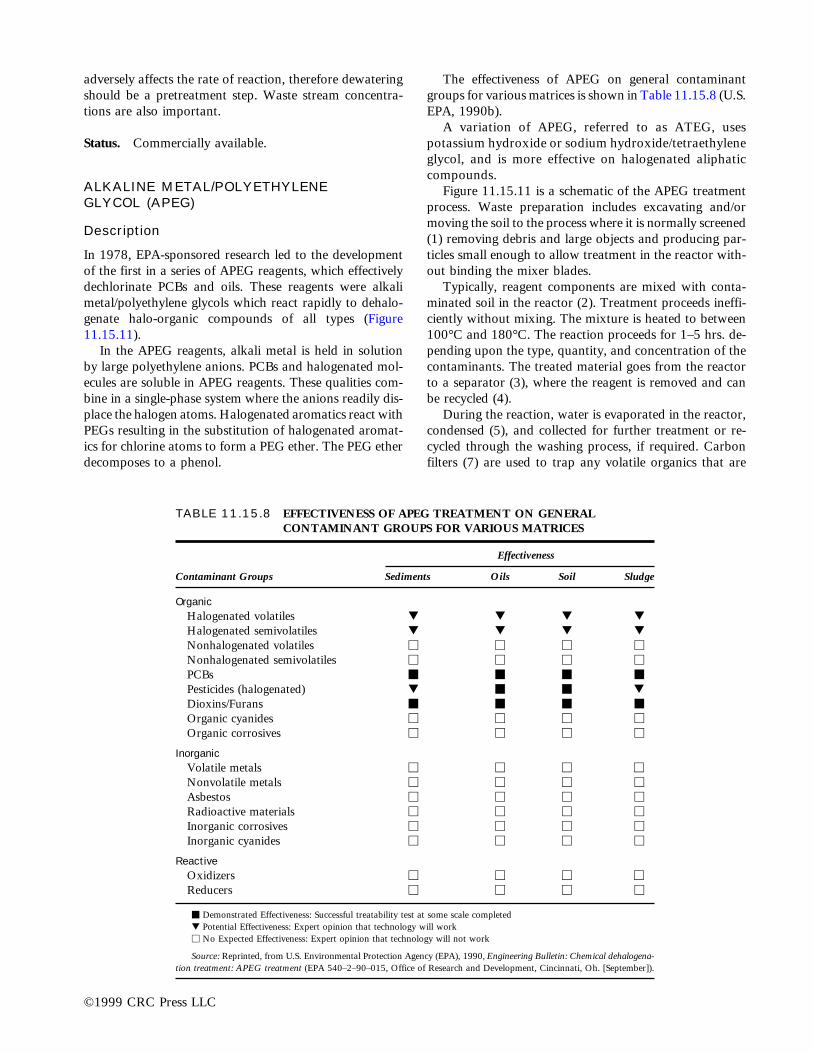
adversely affects the rate of reaction, therefore dewateringshould be a pretreatment step. Waste stream concentra-tions are also important.
Status. Commercially available.
ALKALINE METAL/POLYETHYLENEGLYCOL (APEG)
Description
In 1978, EPA-sponsored research led to the developmentof the first in a series of APEG reagents, which effectivelydechlorinate PCBs and oils. These reagents were alkalimetal/polyethylene glycols which react rapidly to dehalo-genate halo-organic compounds of all types (Figure11.15.11).
In the APEG reagents, alkali metal is held in solutionby large polyethylene anions. PCBs and halogenated mol-ecules are soluble in APEG reagents. These qualities com-bine in a single-phase system where the anions readily dis-place the halogen atoms. Halogenated aromatics react withPEGs resulting in the substitution of halogenated aromat-ics for chlorine atoms to form a PEG ether. The PEG etherdecomposes to a phenol.
The effectiveness of APEG on general contaminantgroups for various matrices is shown in Table 11.15.8 (U.S.EPA, 1990b).
A variation of APEG, referred to as ATEG, usespotassium hydroxide or sodium hydroxide/tetraethyleneglycol, and is more effective on halogenated aliphaticcompounds.
Figure 11.15.11 is a schematic of the APEG treatmentprocess. Waste preparation includes excavating and/ormoving the soil to the process where it is normally screened(1) removing debris and large objects and producing par-ticles small enough to allow treatment in the reactor with-out binding the mixer blades.
Typically, reagent components are mixed with conta-minated soil in the reactor (2). Treatment proceeds ineffi-ciently without mixing. The mixture is heated to between100°C and 180°C. The reaction proceeds for 1–5 hrs. de-pending upon the type, quantity, and concentration of thecontaminants. The treated material goes from the reactorto a separator (3), where the reagent is removed and canbe recycled (4).
During the reaction, water is evaporated in the reactor,condensed (5), and collected for further treatment or re-cycled through the washing process, if required. Carbonfilters (7) are used to trap any volatile organics that are
©1999 CRC Press LLC
TABLE 11.15.8 EFFECTIVENESS OF APEG TREATMENT ON GENERALCONTAMINANT GROUPS FOR VARIOUS MATRICES
Effectiveness
Contaminant Groups Sediments Oils Soil Sludge
OrganicHalogenated volatiles ▼ ▼ ▼ ▼
Halogenated semivolatiles ▼ ▼ ▼ ▼
Nonhalogenated volatiles M M M MNonhalogenated semivolatiles M M M MPCBs m m m mPesticides (halogenated) ▼ m m ▼
Dioxins/Furans m m m mOrganic cyanides M M M MOrganic corrosives M M M M
InorganicVolatile metals M M M MNonvolatile metals M M M MAsbestos M M M MRadioactive materials M M M MInorganic corrosives M M M MInorganic cyanides M M M M
ReactiveOxidizers M M M MReducers M M M M
m Demonstrated Effectiveness: Successful treatability test at some scale completed▼ Potential Effectiveness: Expert opinion that technology will workM No Expected Effectiveness: Expert opinion that technology will not work
Source: Reprinted, from U.S. Environmental Protection Agency (EPA), 1990, Engineering Bulletin: Chemical dehalogena-tion treatment: APEG treatment (EPA 540–2–90–015, Office of Research and Development, Cincinnati, Oh. [September]).
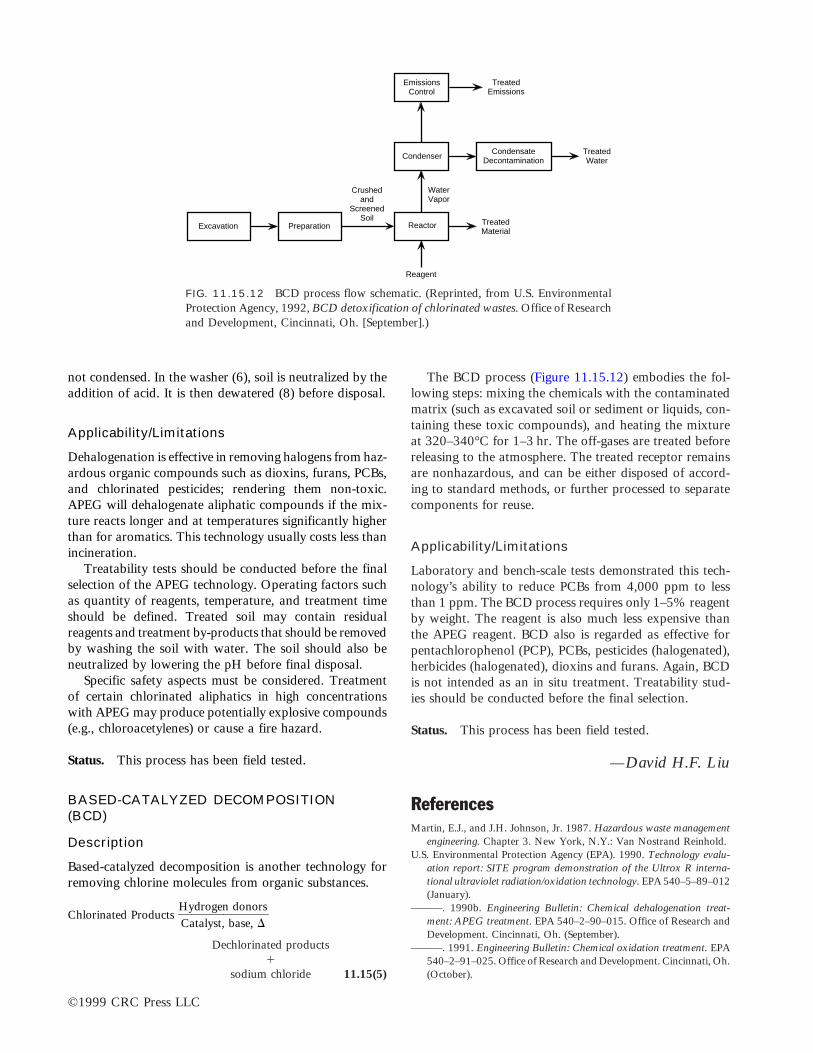
not condensed. In the washer (6), soil is neutralized by theaddition of acid. It is then dewatered (8) before disposal.
Applicability/Limitations
Dehalogenation is effective in removing halogens from haz-ardous organic compounds such as dioxins, furans, PCBs,and chlorinated pesticides; rendering them non-toxic.APEG will dehalogenate aliphatic compounds if the mix-ture reacts longer and at temperatures significantly higherthan for aromatics. This technology usually costs less thanincineration.
Treatability tests should be conducted before the finalselection of the APEG technology. Operating factors suchas quantity of reagents, temperature, and treatment timeshould be defined. Treated soil may contain residualreagents and treatment by-products that should be removedby washing the soil with water. The soil should also beneutralized by lowering the pH before final disposal.
Specific safety aspects must be considered. Treatmentof certain chlorinated aliphatics in high concentrationswith APEG may produce potentially explosive compounds(e.g., chloroacetylenes) or cause a fire hazard.
Status. This process has been field tested.
BASED-CATALYZED DECOMPOSITION(BCD)
Description
Based-catalyzed decomposition is another technology forremoving chlorine molecules from organic substances.
Chlorinated Products }HC
yadtarloygset,nbdaosen,oD
rs}
Dechlorinated products1
sodium chloride 11.15(5)
The BCD process (Figure 11.15.12) embodies the fol-lowing steps: mixing the chemicals with the contaminatedmatrix (such as excavated soil or sediment or liquids, con-taining these toxic compounds), and heating the mixtureat 320–340°C for 1–3 hr. The off-gases are treated beforereleasing to the atmosphere. The treated receptor remainsare nonhazardous, and can be either disposed of accord-ing to standard methods, or further processed to separatecomponents for reuse.
Applicability/Limitations
Laboratory and bench-scale tests demonstrated this tech-nology’s ability to reduce PCBs from 4,000 ppm to lessthan 1 ppm. The BCD process requires only 1–5% reagentby weight. The reagent is also much less expensive thanthe APEG reagent. BCD also is regarded as effective forpentachlorophenol (PCP), PCBs, pesticides (halogenated),herbicides (halogenated), dioxins and furans. Again, BCDis not intended as an in situ treatment. Treatability stud-ies should be conducted before the final selection.
Status. This process has been field tested.
—David H.F. Liu
ReferencesMartin, E.J., and J.H. Johnson, Jr. 1987. Hazardous waste management
engineering. Chapter 3. New York, N.Y.: Van Nostrand Reinhold.U.S. Environmental Protection Agency (EPA). 1990. Technology evalu-
ation report: SITE program demonstration of the Ultrox R interna-tional ultraviolet radiation/oxidation technology. EPA 540–5–89–012(January).
———. 1990b. Engineering Bulletin: Chemical dehalogenation treat-ment: APEG treatment. EPA 540–2–90–015. Office of Research andDevelopment. Cincinnati, Oh. (September).
———. 1991. Engineering Bulletin: Chemical oxidation treatment. EPA540–2–91–025. Office of Research and Development. Cincinnati, Oh.(October).
©1999 CRC Press LLC
EmissionsControl
TreatedEmissions
CondenserCondensate
DecontaminationTreatedWater
Excavation Preparation
Crushedand
ScreenedSoil
WaterVapor
Reactor TreatedMaterial
Reagent
FIG. 11.15.12 BCD process flow schematic. (Reprinted, from U.S. EnvironmentalProtection Agency, 1992, BCD detoxification of chlorinated wastes. Office of Researchand Development, Cincinnati, Oh. [September].)

PARTIAL LIST OF SUPPLIERS
Portland Cement Pozzolan Process: Aerojet Energy Conversion Co.:ATCOR, Inc.; Chem-Nuclear System, Inc.; Delaware CustomMaterials; Energy, Inc.; General Electric Co.; Hittman Nuclear andDevelopment Co.; Stock Equipment Co.; Todd Research andTechnical Div., United Nuclear Industries; Westinghouse ElectricCo.
Asphalt-Based (Thermoplastic); Microencapsulation(Thermoplastic); Microencapsulation: Werner A. Pfleidler; AerojetEnergy Conversion Co.; Newport News Industrial Corp.
Solidification techniques encapsulate hazardous waste intoa solid material of high structural integrity. Encapsulationinvolves either fine waste particles, microencapsulation, ora large block or container of wastes, macroencapsulation(Conner 1990). Stabilization techniques treat hazardouswaste by converting it into a less soluble, mobile, or toxicform. Solidification/stabilization (S/S) processes utilize oneor both of these techniques.
The goal of S/S processes is the safe ultimate disposalof hazardous waste. Four primary reasons for treating thewaste are to:
• Improve handling characteristics for transport on-site or to an off-site TSD facility
• Limit the mobility or solubility of pollutants con-tained in the waste
• Reduce the exposed area allowing transfer or lossof contained pollutants
• Detoxify contained pollutants
ApplicationsTable 11.16.1 summarizes the effectiveness of S/S on gen-eral contaminant groups for soils and sludges. The fixingand binding agents for S/S immobilize many heavy metalsand solidify a wide variety of wastes including spent pickleliquor, contaminated soils, incinerator ash, wastewatertreatment filter cake, waste sludge, and many radionuclides(EPA 1990). In general, S/S is considered as an establishedfull-scale technology for nonvolatile heavy metals, al-though the long-term performance of S/S in Superfund ap-plications has yet to be demonstrated (EPA 1991).
Technology DescriptionS/S processes can be divided into the following broad cat-egories: inorganic processes (cement and pozzolanic) andorganic processes (thermoplastic and thermosetting).
CEMENT-BASED PROCESSES
These processes generally use Portland cement and sludgealong with certain other additives (some proprietary) in-cluding fly ash or other aggregate to form a monolithic,rock-like mass. Type I Portland cement, the cement nor-mally used in construction, is generally used for waste fix-ation. Type II is used in the presence of moderate sulfateconcentrations (150–1500 mg/kg), and Type V, for highsulfate concentrations (greater than 1500 mg/kg).
These processes are successful on many sludges gener-ated by the precipitation of heavy metals. The high pH ofthe cement mixture keeps the metals as insoluble hydrox-
©1999 CRC Press LLC
11.16SOLIDIFICATION AND STABILIZATIONTECHNOLOGIES
TABLE 11.16.1 EFFECTIVENESS OF S/S ONGENERAL CONTAMINANT GROUPSFOR SOIL AND SLUDGES
EffectivenessContaminant Groups Soil/Sludge
OrganicHalogenated volatiles MNonhalogenated volatiles MHalogenated semivolatiles mNonhalogenated semivolatiles
and nonvolatiles mPCBs ▼
Pesticides ▼
Dioxins/Furans ▼
Organic cyanides ▼
Organic corrosives ▼
InorganicVolatile metals mNonvolatile metals mAsbestos mRadioactive materials mInorganic corrosives mInorganic cyanides m
ReactiveOxidizers mReducers m
KEY: m Demonstrated Effectiveness: Successful treatability test at some scalecompleted.
▼ Potential Effectiveness: Expert opinion that technology will work.M No Expected Effectiveness: Expert opinion that technology will/does not
work.
Source: Reprinted, from U.S. Environmental Protection Agency, 1993,Engineering bulletin: solidification/stabilization of organics and inorganics, (EPA540–5–92–015. Office of Research and Development, Cincinnati, Oh.

ides or carbonate salts. Metal ions may also be taken upinto the cement matrix.
Additives such as clay, vermiculite, and soluble silicateimprove the physical characteristics and decrease leachinglosses from the resulting solidified sludge. Many additivesare proprietary.
POZZOLANIC PROCESSES
These lime-based stabilization processes depend on the re-action of lime with a fine-grained siliceous material andwater to produce a hardened material. The most commonpozzolanic materials used in waste treatment are fly ash,ground blast-furnace slag, and cement-kiln dust. As all thesematerials are waste products to be disposed of, the fixa-tion process can reduce contamination from several wastes.Other additives, generally proprietary, are often added tothe sludge to enhance material strength or to help limit mi-gration of problem contaminants from the sludge mass.
Lime and Portland cement are the setting agents, butgypsum, calcium carbonate, and other compounds mayalso be used. Lime-based and cement-based processes arebetter suited for stabilizing inorganic wastes rather thanorganic wastes. Decomposition of organic material insludge after curing can result in increased permeability anddecreased strength of the material.
Certain processes fall in the category of cement-poz-zolanic processes. In this case both cement and lime-siliceous materials are combined to give the best and mosteconomical containment for waste.
THERMOPLASTIC PROCESSES
Bitumen stabilization techniques (including bitumen,paraffin and polyethylene) were developed for use in ra-dioactive waste disposal and later adapted for handling in-dustrial wastes. In a bitumen process, the waste is driedand then mixed with bitumen, paraffin or polyethylene(usually at temperatures greater than 100°C). The mixturesolidifies as it cools, then is placed in a container, such asa steel drum or a thermoplastic coating, before disposal.
A variation of the bitumen process uses an asphalt emul-sion that is miscible with the wet sludge. This process canbe conducted at a lower temperature than a bitumenprocess. The emulsion-waste mixture must be dried beforedisposal.
The type of waste sludges that can be fixed with bitu-men techniques is limited. Organic chemicals that act assolvents with bitumen cannot be stabilized. High concen-trations of strong oxidizing salts such as nitrates, chlorates,or perchlorates will react with bitumen and cause slow de-terioration.
ORGANIC POLYMER PROCESSES
The major organic polymer process (including urea-formaldehyde, unsaturated polyesters) currently in use isthe urea-formaldehyde process. In the process, a monomeris added to the waste or sludge and thoroughly mixed.Next, a catalyst is added to the mixture and mixing con-tinues until the catalyst is dispersed. The mixture is trans-ferred to another container and allowed to harden. Thepolymerized material does not chemically combine withthe waste. Instead, a spongy mass forms, trapping the solidparticles while allowing some liquid to escape. The poly-mer mass can be dried before disposal.
Table 11.16.2 compares the advantages and disadvan-tages of the above S/S processes. Table 11.16.3 illustratesthe compatibility of selected waste categories with S/Sprocesses.
Figures 11.16.1 and 11.16.2 depict generic elements oftypical ex situ and in situ S/S processes for soils and sludges.Ex situ processing involves: (1) excavation to remove thecontaminated waste from the subsurface; (2) classificationto remove oversize debris; (3) mixing; and (4) off-gas treat-ment. In situ processing has only two steps: (1) mixing;and (2) off-gas treatment. Both processes require a systemfor delivering water, waste, and S/S agents in proper pro-portions; and a mixing device (e.g., rotary drum paddle orauger). Ex situ processing requires a system for deliveringtreated waste to molds, surface trenches, or subsurface in-jection. The need for off-gas treatment using vapor col-
©1999 CRC Press LLC
FIG. 11.16.1 Generic elements of a typical ex situ S/S process. (Reprinted,from U.S. EPA, 1993.)
S/S BindingAgent(s)
Excavation(1)
Classification(2)
Mixing(3)
Off-GasTreatment(optional)
(4)
Residuals
VOC Captureand
Treatment
OversizeRejects
Water Stabilized/SolidifiedMedia
Crusher

©1999 CRC Press LLC
lection and treatment modules is specific to the S/S process.Also, hazardous residuals from some pretreatment tech-nologies must be disposed of using appropriate procedures.
Technology LimitationsTables 11.16.4 and 11.16.5 summarize factors that inter-fere with stabilization and solidification processes.
TABLE 11.16.2 COMPARISON FOR SOLIDIFICATION AND STABILIZATION PROCESSES
Process Description Advantages Disadvantages
Cement Slurry of wastes and Low costs; readily Solids are suspended, notwater is mixed with available mixing chemically bound;portland cement to equipment; relatively therefore are subject toform a solid simple process; suitable leaching; doubles waste
for use with metals volume; requires secondarycontainment; incompatiblewith many wastes(organics, some sodiumsalts, silts, clays, and coalor lignite)
Pozzolanic Waste is reacted with Low cost; readily available Increases waste volume; maylime and a fine-grained mixing equipment; be subject to leaching;siliceous material (fly ash, suitable for power-plant requires secondaryground blast furnace slag, wastes (FGD sludges, etc.) containmentcement kiln dust) to form as well as a wide rangea solid of industrial wastes,
including metals, wasteoil, and solvents
Thermoplastic Waste is dried, heated, and Less increase in volume Wastes must be dried beforedispensed through a than with cement- or use; high equipment costs;heated plastic matrix of lime-based processes; high energy costs; requiresasphalt bitumen, paraffin reduced leaching relative trained operators;or polyethylene to cement- or lime-based incompatible with
processes; suitable for oxidizers, some solentsradioactive wastes and and greases, some salt,some industrial wastes and chelating/complexing
agents; requires secondarycontainment
Organic polymers Waste is mixed with a Suitable for insoluble solids; Pollutants are not chemicallyprepolymer and a catalyst very successful in limited bound, subject to leaching;that causes solidification limited applications strongly acidic leach waterthrough formation of a may be produced;spongelike polymer matrix; requires special equipmenturea-formaldehyde or and operators; some of thevinyl ester-styrene catalysts used are corrosive;polymers are used harmful vapors may be
produced; incompatiblewith oxidizers and someorganics; some resins arebiodegradable anddecompose with time
Source: Reprinted, from U.S. Environmental Protection Agency, 1980, Guide to the disposal of chemically stabilized and solidified waste, (EPA SW–872, Cincinnati,Oh. [September]).
FIG. 11.16.2 Generic elements of a typical in situ S/S process.(Reprinted, from U.S. EPA, 1993.)
S/S BindingAgent(s)
Mixing(1)
Off-GasTreatment(optional)
(2)
ResidualsWater
Stabilized/SolidifiedMedia

Physical mechanisms that interfere with the S/S pro-cess include incomplete mixing due to high moisture ororganic chemical content. This results in only partial wet-ting or coating of particles with stabilizing and bindingagents, and the aggregation of untreated waste into lumps(EPA 1986). Chemical mechanisms that interfere withS/S of cement-based systems include chemical adsorp-
tion, complexation, precipitation, and nucleation (Conner1990).
Environmental conditions must be considered in deter-mining whether and when to implement S/S process tech-nology. Extremes of heat, cold, and precipitation can ad-versely affect S/S applications. For example, the viscosityof one or more of the materials may increase rapidly with
©1999 CRC Press LLC
TABLE 11.16.3 COMPATIBILITY OF WASTE CATEGORIES WITH SOLIDIFICATION/STABILIZATIONTECHNIQUES
Treatment Type
Organic Classification andWaste Cement- Lime- Polymer Surface Self- Synthetic MineralComponent Based Based Thermoplastic (UF)a Encapsulation Cementing Formation
Organics1. Organic Many impede set- Many impede Organics may May retard Must first be Fire danger on Wastes decomposesolvents and ting, may setting, vaporize on set of absorbed heating at highoils escape as vapor may escape heating poly- on solid temperatures
as vapor mers matrix
2. Solid Good–often in- Good–often Possible use as May retard Compatible– Fire danger on Wastes decomposeorganics (e.g., creases increases binding set of many en- heating at highplastics, resins, durability durability agent poly- capsulation temperaturestars) mers materials
are plastic
Inorganics1. Acid wastes Cement will Compatible Can be neu- Compatible Can be neu- May be neu- Can be neutral-
neutralize acids tralized tralized tralized to ized andbefore in- before in- form sulfate incorporatedcorporation corporation salts
2. Oxidizers Compatible Compatible May cause May cause May cause Compatible if High temperaturesmatrix matrix deteriora- sulfates are may causebreakdown, break- tion of en- present undesirablefire down capsulating reactions
materials
3. Sulfates May retard setting Compatible May dehydrate Compatible Compatible Compatible Compatible inand cause spall- and rehy- many casesing unless drate, caus-special cement ing splittingis used
4. Halides Easily leached May retard May dehydrate Compatible Compatible Compatible if Compatible infrom cement, setting, sulfates are many casesmay retard most are also presentsetting easily
leached
5. Heavy metals Compatible Compatible Compatible Acid pH Compatible Compatible if Compatible insolubil- sulfates are many casesizes presentmetalhydrox-ides
6. Radioactive Compatible Compatible Compatible Compatible Compatible Compatible if Compatiblematerials sulfates are
present
Source: Reprinted, from U.S. EPA, 1980.aUrea-formaldehyde resin.

falling temperature, or the cure rate may be unacceptablyslowed.
Depending on the waste and binding agents involved,S/S processes can produce hot gases, including vapors thatare potentially toxic, irritating, noxious to workers or com-munities downwind from the processes. In addition, ifvolatile substances with low flash points are involved, andthe fuel-air ratio is favorable, there is a potential for fireand explosion.
Taking S/S processes from bench-scale to full-scale op-eration involves inherent uncertainties. Variables such asingredient flow-rate control, material balance, mixing, ma-terials handling and storage, and weather may all affect afield operation. These potential engineering difficulties em-phasize the need for field demonstration before full-scaleimplementation.
Performance TestingTreated wastes are subjected to physical tests to (1) de-termine particle size and distribution, porosity, perme-ability, and dry and wet density; (2) evaluate bulk-han-dling properties; (3) predict the reaction of a material toapplied stresses in embankments and landfills; and (4) eval-uate durability under freeze/thaw and wet/dry weatheringcycles.
Chemical leach testing determines the chemical stabil-ity of treated wastes when in contact with aqueous solu-
tions encountered in landfills. The procedures demonstratethe immobilization of contaminants by the S/S processes.Many techniques for leach testing are available. The ma-jor variables encountered in different leaching proceduresare: the nature of the leaching solution; waste to leachingsolution ratios; number of elutions of leaching solutionsused; contact time of waste and leaching solution; surfacearea of waste exposed; and agitation technique used.Treated wastes must meet certain maximum leachate con-centrations when subject to the Toxicity CharacteristicLeaching Procedure (TCLP) determination (see Section11.4).
—David H.F. Liu
ReferencesConnor, J.R. 1990. Chemical fixation and solidification of hazardous
waste. New York, N.Y.: Van Nostrand Reinhold.U.S. Environmental Protection Agency (EPA). 1987. Handbook—reme-
dial action at waste disposal sites (rev.). EPA 625–6–85–006.Washington, D.C. (January).
———. 1990. Stabilization/solidification of CERCLA and RCRA wastes:physical test, chemical testing procedures, technology, and field ac-tivities. EPA 625–6–89–022. Cincinnati, Oh. (May).
———. 1991. Technical resources document on solidification/stabi-lization and its application to waste material (draft). Contract No.68–C0–0003. Office of Research and Development. Cincinnati,Oh.
©1999 CRC Press LLC
TABLE 11.16.4 SUMMARY OF FACTORS THAT MAY INTERFERE WITH STABILIZATION PROCESSES
Characteristics Affecting Processing Feasibility Potential Interference
VOCs Volatiles not effectively immobilized; driven off by heat of reaction.Sludges and soils containing volatile organics can be treated using aheated extruder evaporator or other means to evaporate free water andVOCs prior to mixing with stabilizing agents.
Use of acidic sorbent with metal hydroxide wastes Solubilizes metal.
Use of acidic sorbent with cyanide wastes Releases hydrogen cyanide.
Use of acidic sorbent with waste containing Releases ammonia gas.ammonium compounds
Use of acidic sorbent with sulfide wastes Releases hydrogen sulfide.
Use of alkaline sorbent (containing carbonates such May create pyrophoric waste.as calcite or dolomite) with acid waste
Use of siliceous sorbent (soil, fly ash) with May produce soluble fluorosilicates.hydrofluoric acid waste
Presence of anions in acidic solutions that form Cation exchange reactions—leach calcium from S/S productsoluble calcium salts (e.g., calcium chloride increases permeability of concrete, increases rate of exchangeacetate, and bicarbonate) reactions.
Presence of halides Easily leached from cement and lime.
Source: Reprinted, from United States Environmental Protection Agency, 1991, Technical resources document on solidification/stabilization and its application towaste material (Draft), (Contract No. 68–CO–003, Office of Research and Development, Cincinnati, Oh.).

©1999 CRC Press LLC
TABLE 11.16.5 SUMMARY OF FACTORS THAT MAY INTERFERE WITH SOLIDIFICATION PROCESSES
Characteristics AffectingProcessing Feasibility Potential Interference
Organic compounds Organics may interfere with bonding of waste materials with inorganic binders.Semivolatile organics or poly- Organics may interfere with bonding of waste materials.
aromatic hydrocarbons (PAHs)Oil and grease Weaken bonds between waste particles and cement by coating the particles. Decrease in
unconfined compressive strength with increased concentrations of oil and grease.Fine particle size Insoluble material passing through a No. 200 mesh sieve can delay setting and curing. Small
particles can also coat larger particles, weakening bonds between particles and cement or other reagents. Particle size .Af inch in diameter not suitable.
Halides May retard setting, easily leached for cement and pozzolan S/S. May dehydrate thermoplasticsolidification.
Soluble salts of manganese, Reduced physical strength of final product caused by large variations in setting time andtin, zinc, copper, and lead reduced dimensional stability of the cured matrix, thereby increasing leachability potential.
Cyanides Cyanides interfere with bonding of waste materials.Sodium arsenate, borates, Retard setting and curing and weaken strength of final product.
phosphates, iodates, sulfides,and carbohydrates
Sulfates Retard setting and cause swelling and spalling in cement S/S. With thermoplastic solidificationmay dehydrate and rehydrate, causing splitting.
Phenols Marked decreases in compressive strength for high phenol levels.Presence of coal or lignite Coals and lignites can cause problems with setting, curing, and strength of the end product.Sodium borate, calcium Interferes with pozzolanic reactions that depend on formation of calcium silicate and
sulfate, potassium aluminate hydrates.dichromate, andcarbohydrates
Nonpolar organics (oil, May impede setting of cement, pozzolan, or organic-polymer S/S. May decrease long-term grease, aromatic durability and allow escape of volatiles during mixing. With thermoplastic S/S, organicshydrocarbons, PCBs) may vaporize from heat.
Polar organics (alcohols, With cement or pozzolan S/S, high concentrations of phenol may retard setting and mayphenols, organic acids, decrease short-term durability; all may decrease long-term durability. With thermoplasticglycols) S/S, organics may vaporize. Alcohols may retard setting of pozzolans.
Solid organics (plastics, tars, Ineffective with urea formaldehyde polymers; may retard setting of other polymers.resins)
Oxidizers (sodium May cause matrix breakdown or fire with thermoplastic or organic polymer S/S.hypochlorite, potassiumpermanganate, nitric acid,or potassium dichromate)
Metals (lead, chromium, May increase setting time of cements if concentration is high.cadmium, arsenic, mercury)
Nitrates, cyanides Increase setting time, decrease durability for cement-based S/S.Soluble salts of magnesium, May cause swelling and cracking within inorganic matrix exposing more surface area to leaching.
tin, zinc, copper and leadEnvironmental/waste Eventual matrix deterioration.
conditions that lower thepH of matrix
Flocculants (e.g., ferric Interference with setting of cements and pozzolans.chloride)
Soluble sulfates .0.01% in Endangerment of cement products due to sulfur attack.soil or T50 mg/L in water
Soluble sulfates .0.5% in Serious effects on cement products from sulfur attacks.soil or 2000 mg/L in water
Oil, grease, lead, copper, Deleterious to strength and durability of cement, lime/fly ash, fly ash/cement binders.zinc, and phenol
Aliphatic and aromatic Increase set time for cement.hydrocarbons
Chlorinated organics May increase set time and decrease durability of cement if concentration is high.Metal salts and complexes Increase set time and decrease durability for cement or clay/cement.Inorganic acids Decrease durability for cement (Portland Type I) or clay/cement.Inorganic bases Decrease durability for clay/cement; KOH and NaOH decrease durability for Portland cement
Type III and IV.
Source: Reprinted from U.S. EPA, 1991.

PARTIAL LIST OF SUPPLIERS
Activated Sludge: Polybac Corp.; Detox Inc.; GroundDecontaminaton Systems
Rotating Biological Contactors: Polybac Corp.; Detox Inc.; GroundDecontaminaton Systems
Bioreclamation: FMC
Biological degradation of hazardous organic substances isa viable approach to waste management. Commonprocesses are those originally utilized in treating munici-pal wastewaters, based on aerobic or anaerobic bacteria.In-situ treatment of contaminated soils can be performedbiologically. Cultures used in biological degradationprocesses can be native (indigenous) microbes, selectivelyadapted microbes, or genetically altered microorganisms.
Table 11.17.1 shows that every class of anthropogeniccompound can be degraded by some microorganism.Anthropogenic compounds such as halogenated organicsare relatively resistant to biodegradation. One reason forthis is the naturally present organisms often cannot producethe enzymes necessary to transform the original compoundto a point where resultant intermediates can enter commonmetabolic pathways and be completely mineralized.
Several of the most persistent chlorinated compounds,such as TCE, appear to be biodegradable only through co-metabolism. Co-metabolism involves using another sub-stance as a source of carbon and energy to sustain micro-bial growth. The contaminant is metabolized gratuitouslydue to a lack of enzyme specificity. To stimulate co-me-tabolism in bioremediation, a co-substrate is added to the
©1999 CRC Press LLC
11.17BIOLOGICAL TREATMENT
TABLE 11.17.1 EXAMPLES OF ANTHROPOGENIC COMPOUNDS ANDMICROORGANISMS THAT CAN DEGRADE THEM
Compound Organism
Aliphatic (nonhalogenated)Acrylonitrile Mixed culture of yeast mold, protozoan bacteria
Aliphatic (halogenated)Trichloroethane, trichloroethylene, Marine bacteria, soil bacteria, sewage sludgemethyl chloride, methylene chloride
Aromatic compounds (nonhalogenated)Benzene, 2,6-dinitrotoluene, Pseudomonas sp, sewage sludgecreosol, phenol
Aromatic compounds (halogenated)1,2-; 2,3-; 1,4-Dichlorobenzene,hexachlorobenzene, trichlorobenzene Sewage sludgePentachlorophenol Soil microbes
Polycyclic aromatics (nonhalogenated)Benzo(a)pyrene, naphthalene Cunninghamells elogansBenzo(a)anthracene Pseudomonas
Polycyclic aromatics (halogenated)PCBs Pseudomonas, Flavobacterium4-Chlorobiphenyl Fungi
PesticidesToxaphene Corynebacterium pyrogenesDieldrin Anacystic nidulansDDT Sewage sludge, soil bacteriaKepone Treatment lagoon sludge
NitrosaminesDimethylnitrosamine Rhodopseudomonas
Phthalate esters Micrococcus 12B
Source: Reprinted, with permission from Table 1 of H. Kobayashi and B.E. Rittmann, 1982, Microbial removal of haz-ardous organic compounds, Environmental Science and Technology, (vol. 16, p. 173A).

contaminated site, to induce growth of microorganismswhose enzymes can degrade both the co-substrate and theoriginal pollutant. Even inherently toxic inducers, such asphenol or toluene, are sometimes added to stimulate bac-terial production of enzymes to degrade polyaromatic hy-drocarbons and chlorinated aliphatics.
Table 11.17.2 lists important treatment data needs forbiological treatments.
This section describes biological processes applicable tohazardous waste.
Aerobic Biological TreatmentDESCRIPTION
Hydrocarbons are catabolized or broken down into simplersubstances by microorganisms using aerobic respiration,anaerobic respiration, and fermentation. In general, aerobicdegradation processes are more often used for biodegra-dation because the degradation process is more rapid andmore complete, and problematic products such as methaneand hydrogen sulfide are not produced. However, anaero-bic degradation is important for dehalogenation.
In aerobic respiration, organic molecules are oxidizedto carbon dioxide (CO2), water, and other end productsusing molecular oxygen as the terminal electron acceptor.Oxygen is also incorporated into the intermediate prod-ucts of microbial catabolism through oxidase enzyme ac-tion, making these products more susceptible to furtherbiodegradation. Microorganisms metabolize hydrocar-bons by anaerobic respiration in the absence of molecularoxygen using inorganic substrates as terminal electron ac-ceptors. Naturally occurring aerobic bacteria can decom-pose natural and synthetic organic materials to harmlessor stable forms by mineralizing them to CO2 and water.Some anthropogenic compounds appear refractory tobiodegradation by naturally occurring microbial popula-tions because of environmental influences, lack of solubil-ity, and the absence of required enzymes, nutrients or otherfactors. However, properly selected or engineered micro-
bial populations, maintained under environmental condi-tions conducive to their metabolic activity are an impor-tant means of biological transformation or degrading theseotherwise refractory wastes.
All microorganisms require adequate levels of inorganicand organic nutrients, growth factors (vitamins, magne-sium, copper, manganese, sulfur, potassium, etc.), water,oxygen, carbon dioxide and sufficient biological space forsurvival and growth. One or more of these factors is usu-ally in limited supply. In addition, various microbial com-petitors adversely affect each other in struggling for theselimited resources. Other factors influencing microbialdegradation rates include microbial inhibition by chemi-cals in the waste to be treated, the number and physio-logical state of the organisms as a function of available nu-trients, the seasonal state of microbial development,predators, pH, and temperature. Interaction between theseand other potential factors can cause wide variations indegradation kinetics.
For these and other reasons, aerobic biodegradation isusually carried out in processes where many of the requi-site conditions can be controlled. Such processes includeconventional activated-sludge processes, with modifica-tions such as sequencing batch reactors, and aerobic-at-tached growth biological processes such as rotating bio-logical contactors and trickling filters. Recently developedgenetically engineered bacteria are reported to be effectivefor biological treatment of specific, relatively uniform, haz-ardous wastes.
APPLICABILITY/LIMITATIONS
Used to treat aqueous waste contaminated with low lev-els (e.g., BOD less than 10,000 mg/L) of nonhalogenatedorganic and certain halogenated organics. Treatment re-quires consistent, stable operating conditions.
Status. Conventional, broadly used technology
Activated SludgeDESCRIPTION
Activated sludge treatment breaks down organic contam-inants in aqueous waste streams through aerobic mi-croorganisms’ activity. These microorganisms metabolizebiodegradable organics. This treatment includes conven-tional activated sludge processes and modifications suchas sequencing batch reactors. The aeration process includespumping the waste to an aeration tank where biologicaltreatment occurs. Following this, the stream is sent to aclarifier where the liquid effluent (the treated aqueouswaste) is separated from the sludge biomass (Figure11.17.1). Aerobic processes can significantly reduce a widerange of organic, toxic and hazardous compounds.However, only dilute aqueous wastes (less than 1%) arenormally treatable.
©1999 CRC Press LLC
TABLE 11.17.2 IMPORTANT BIOLOGICALTREATMENT DATA NEEDS
Data Need Purpose
Gross Organic Component Treatability(BOD, TOC)
Priority Pollutant Analysis Toxicity to ProcessMicrobes
Dissolved Oxygen Aerobic Reaction Rates/Interference with AnaerobicSystem
Nutrient Analysis Nutrient Requirements(NH3, NO3, PO4, etc.)
pH pH AdjustmentORP Chemical Competition

APPLICABILITY/LIMITATIONS
The treatment requires consistent, stable operating condi-tions. Activated sludge processes are not suitable for re-moving highly chlorinated organics, aliphatics, amines,and aromatic compounds from waste streams. Some heavymetals and organic chemicals are harmful to the organ-isms. When using conventional open aeration tanks andclarifiers, volatile hazardous materials may escape.
Status. Conventional, well developed
Rotating Biological ContactorsDESCRIPTION
Rotating biological contactors (RBCs) aerobically treataqueous waste streams, especially those containing alco-hols, phenols, phthalates, cyanides, and ammonia. Primarytreatment (e.g., clarifiers or screens) to remove materialsthat could settle in RBC tanks or plug the discs, is oftenessential for good operation. Influents containing high con-centrations of floatables (e.g., grease) require treatmentwith a primary clarifier or an alternate removal system(EPA 1984; EPA 1992).
A typical RBC unit consists of 12-ft-dia plastic discsmounted along a 25-ft horizontal shaft. The disc surfaceis normally 100,000 sq ft for a standard unit and 150,000
sq ft for a high density unit. Figure 11.17.2 details a typ-ical RBC system.
As the discs rotate through leachate at 1.5 rpm, a mi-crobial slime forms on the discs. These microorganismsdegrade the organic and nitrogenous contaminants pre-sent in the waste stream. During rotation, about 40%of the discs’ surface area is in contact with the aqueouswaste, while the remaining area is exposed to the atmos-phere. The rotation of the media through the atmospherecauses oxygenation of the attached organisms. Whenoperated properly, the shearing motion of the discsthrough the aqueous waste causes excess biomass toshear off at a steady rate. Suspended biological solids arecarried through the successive stages before entering thesecondary clarifier.
The RBC treatment process involves a number of stepsas indicated in Figure 11.17.3. Typically, aqueous wasteis transferred from a storage or equalization tank (1) toa mixing tank (2) where chemicals are added for metalprecipitation, nutrient adjustment, and pH control. Thewaste stream then enters a clarifier (3) where solids areseparated from the liquid. The clarifier effluent enters theRBC (4) where the organics and/or ammonia are con-verted to innocuous products. The treated waste is thenpumped into a second clarifier (5) for removal of biolog-ical solids. After secondary clarification, the effluent en-ters a storage tank (6) where, depending upon remainingcontamination, the waste may be stored pending addi-tional treatment or discharged to a sewer system or sur-face stream. Throughout this process, offgases should becollected for treatment (7).
In addition to maximizing the system’s efficiency, stag-ing can improve the system’s ability to handle shock loadsby absorbing the impact in stages. Staging, which employsa number of RBCs in series, enhances biochemical kinet-ics and establishes selective biological cultures acclimatedto successively decreasing organic loading. As the wastestream passes from stage to stage, progressively increasinglevels of treatment occur.
©1999 CRC Press LLC
Air Blower
Influent
ReturnSludge
WasteSludge
SludgePump
Clarifier
Effluent
Nutrient Addition, N and/or P
AerationTank
OffgasTreatment
SecondaryClarifier
Effluent
SludgeDisposal
RBC Units
OffgasTreatment
OffgasTreatment
PrimaryTreatment
RawWaste
SolidsDisposal
FIG. 11.17.1 Activated sludge process.
FIG. 11.17.2 Typical RBC plant schematic. (Reprinted, from U.S. EnvironmentalProtection Agency (EPA), 1992, Engineering Bulletin: rotating biological contactors, [EPA540–5–92–007, October].)
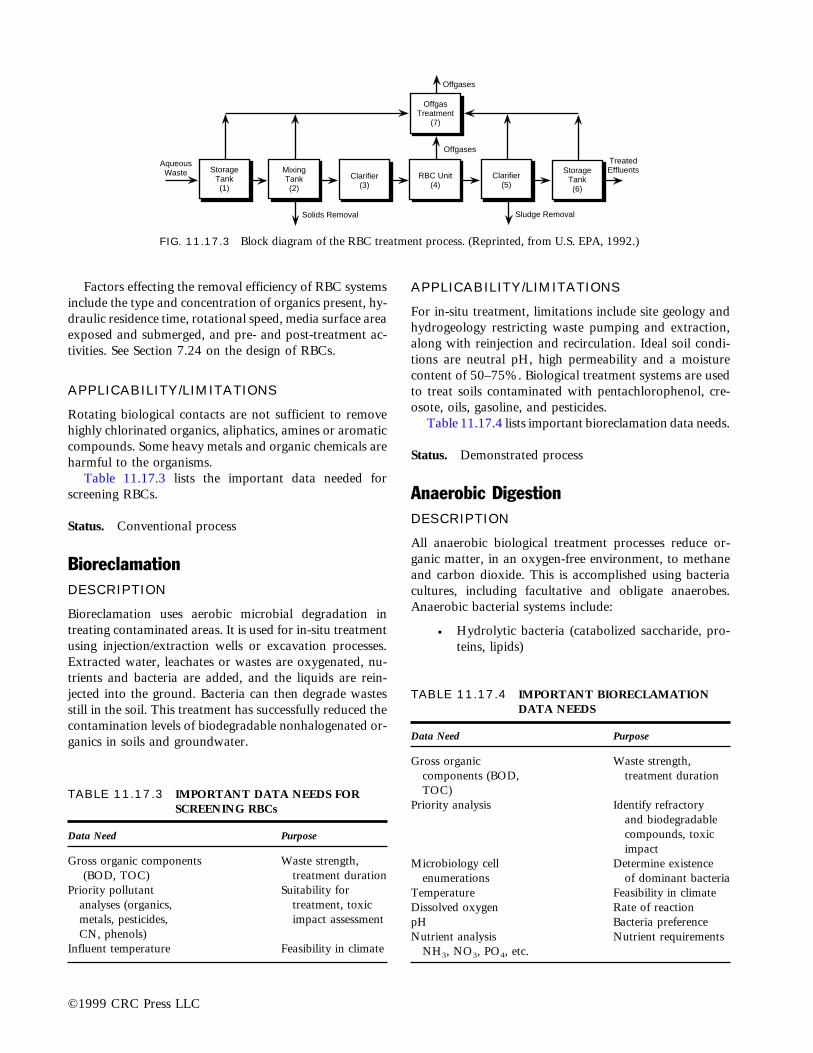
Factors effecting the removal efficiency of RBC systemsinclude the type and concentration of organics present, hy-draulic residence time, rotational speed, media surface areaexposed and submerged, and pre- and post-treatment ac-tivities. See Section 7.24 on the design of RBCs.
APPLICABILITY/LIMITATIONS
Rotating biological contacts are not sufficient to removehighly chlorinated organics, aliphatics, amines or aromaticcompounds. Some heavy metals and organic chemicals areharmful to the organisms.
Table 11.17.3 lists the important data needed forscreening RBCs.
Status. Conventional process
BioreclamationDESCRIPTION
Bioreclamation uses aerobic microbial degradation intreating contaminated areas. It is used for in-situ treatmentusing injection/extraction wells or excavation processes.Extracted water, leachates or wastes are oxygenated, nu-trients and bacteria are added, and the liquids are rein-jected into the ground. Bacteria can then degrade wastesstill in the soil. This treatment has successfully reduced thecontamination levels of biodegradable nonhalogenated or-ganics in soils and groundwater.
APPLICABILITY/LIMITATIONS
For in-situ treatment, limitations include site geology andhydrogeology restricting waste pumping and extraction,along with reinjection and recirculation. Ideal soil condi-tions are neutral pH, high permeability and a moisturecontent of 50–75%. Biological treatment systems are usedto treat soils contaminated with pentachlorophenol, cre-osote, oils, gasoline, and pesticides.
Table 11.17.4 lists important bioreclamation data needs.
Status. Demonstrated process
Anaerobic DigestionDESCRIPTION
All anaerobic biological treatment processes reduce or-ganic matter, in an oxygen-free environment, to methaneand carbon dioxide. This is accomplished using bacteriacultures, including facultative and obligate anaerobes.Anaerobic bacterial systems include:
• Hydrolytic bacteria (catabolized saccharide, pro-teins, lipids)
©1999 CRC Press LLC
OffgasTreatment
(7)
AqueousWaste
TreatedEffluents
Sludge RemovalSolids Removal
Offgases
StorageTank(1)
MixingTank(2)
RBC Unit(4)
Clarifier(5)
StorageTank(6)
Clarifier(3)
Offgases
FIG. 11.17.3 Block diagram of the RBC treatment process. (Reprinted, from U.S. EPA, 1992.)
TABLE 11.17.3 IMPORTANT DATA NEEDS FORSCREENING RBCs
Data Need Purpose
Gross organic components Waste strength,(BOD, TOC) treatment duration
Priority pollutant Suitability foranalyses (organics, treatment, toxicmetals, pesticides, impact assessmentCN, phenols)
Influent temperature Feasibility in climate
TABLE 11.17.4 IMPORTANT BIORECLAMATIONDATA NEEDS
Data Need Purpose
Gross organic Waste strength,components (BOD, treatment durationTOC)
Priority analysis Identify refractoryand biodegradablecompounds, toxicimpact
Microbiology cell Determine existenceenumerations of dominant bacteria
Temperature Feasibility in climateDissolved oxygen Rate of reactionpH Bacteria preferenceNutrient analysis Nutrient requirements
NH3, NO3, PO4, etc.

• Hydrogen-producing acetogenic bacteria (catabo-lized products of hydrolytic bacteria, e.g., fattyacids and neutral end products)
• Homolactic bacteria (catabolized multicarboncompounds to acetic acid)
• Methanogenic bacteria (metabolized acetic acidand higher fatty acids to methane and carbondioxide)
Figure 11.17.4 is a schematic diagram of biological re-action in an anaerobic system.
Strict anaerobics require totally oxygen-free environ-ments and an oxidation reduction potential of less than20.2 V. Microorganisms in this group are known asmethanogenic consortia and are found in anaerobic sedi-
ments or sewage sludge digesters. These organisms play animportant role in reductive dehalogenation reactions, ni-trosamine degradation, reduction of epoxides to olefins,reduction of nitro-groups, and ring fission of aromaticstructures.
Available anaerobic treatment concepts are based onapproaches such as the classic well-mixed system, the two-stage system and the fixed bed system.
In a well-mixed digester system, a single vessel is used tocontain the wastes being treated and all bacteria mustfunction in that common environment. Such systemstypically require long retention times, and the balancebetween acetogenic and methanogenic populations iseasily upset.
©1999 CRC Press LLC
Initial substrate
Acidogens
Inorganic saltsNH+
4, SO4
Other solubleorganic intermediates
Sulphate reducingbacteria
Hydrogen producingacetogens
H2S
Hydrogen utilizingacetogens
Acetate H2 CO2
Methanogens
CH4 + CO2
FIG. 11.17.4 Schematic diagram of biological reactors in anaerobic systems.

In the two-stage approach, two vessels are used to maintainseparate environments, one optimized for acetogenicbacteria (pH 5.0), and the other optimized for methano-genic bacteria (pH 7.0). Retention times are significantlylower and upsets are uncommon in this approach.
The fixed bed approach (for single- or 2-staged systems)utilizes an inert solid media to which the bacteria at-tach. Low solids wastes are pumped through columnsof the bacteria-rich media. Use of such supported cul-tures allows reduced retention times since bacterial lossthrough washout is minimized. Organic degradation ef-ficiencies can be quite high.
A number of proprietary engineered processes based onthese types of systems are being actively marketed. Eachhas distinct features, but all utilize the fundamental anaer-obic conversion to methane and carbon dioxide (Figure11.17.5).
APPLICABILITY/LIMITATIONS
This process is used to treat aqueous waste with low tomoderate levels of organics. Anaerobic digestion can han-dle certain halogenated organics better than aerobic treat-ment. Stable, consistent operating conditions must be
©1999 CRC Press LLC
FIG. 11.17.5 Schematic diagrams of anaerobic digesters currently in use.
Rawwastewater
Contact digester
Gas
Treatedeffluent
Sludgerecycle
Gas
Treatedeffluent
Treated effluentrecycle
Packed bed digester
Rawwastewater
Mediabed
Gas
Treatedeffluent
Treated effluentrecycle
Upflow sludge blanket digester
Rawwastewater
����������Biomasssupportparticles
Rawwastewater
Expanded bed fixed film digester
Treatedeffluentrecycle
Treatedeffluent
Gas

maintained. Anaerobic degradation can take place in na-tive soils, but in a controlled treatment process, an air-tightreactor is required. Since methane and carbon dioxidegases are formed, it is common to vent the gases or burnthem in flare systems. However, volatile hazardous mate-rials could readily escape via such gas venting and flaresystems. Thus controlled off-gas burning could be re-quired. Depending upon the nature of the waste to betreated, the off-gas could be used as a source of energy.
Status. Available and widely used in POTWs.
White-Rot FungusDESCRIPTION
Lignin-degrading white-rot fungus (phanerochaete chryso-sporium) degrades a broad spectrum of organopollutants,including chlorinated, lignin-derived by-products of theKraft pulping process. White-rot fungus degrades aliphatic,aromatic, and heterocyclic compounds. Specifically, white-rot fungus has been shown to degrade indane, benzo(a)-pyrene, DDT, TCDD, and PCBs to innocuous end prod-ucts. The studies performed, to date, suggest that thewhite-rot fungus may prove to be an extremely useful mi-
croorganism in the biological treatment of hazardous or-ganic waste.
Note: Certain plants, such as specific strains of Brassica(mustards), accumulate heavy metals when growing inmetal contaminated soils, forming the basis for a processcalled phytoremediation. These plants can accumulate upto 40% of their biomass as heavy metals, including lead[Atlas 1995].
APPLICABILITY/LIMITATIONS
This technology is in the development phase and has beenapplied only in laboratory environs.
Status. Demonstrated on laboratory scale
—David H.F. Liu
ReferencesAtlas, R.M. 1995. Bioremediation. C&E News (3 April).U.S. Environmental Protection Agency (EPA). 1984. Design information
on rotating biological contactors. EPA 600–2–84–106 (June).———. 1992. Engineering Bulletin: rotating biological contactors. EPA
540–S–92–007 (October).
©1999 CRC Press LLC
11.18BIOTREATMENT BY SEQUENCING BATCHREACTORS
FEATURE SUMMARY
Type of Process: Biological treatment of liquid hazardous wastewaters.
Type of Reactor: Sequencing Batch Reactor (SBR), a fill-and-draw,activated sludge-type system where aeration and settling occur inthe same tank.
Type of Aeration and Mixing Systems: Jet-aeration systems arecommon and allow mixing either with or without aeration; how-ever, other aeration and mixing systems are used.
Type of Decanters: Most decanters, including some which arepatented, float or otherwise maintain inlet orifices slightly belowthe water surface to avoid removal of both settled and floatingsolids.
Type of Tanks: Steel tanks, appropriately coated for corrosion con-trol, are most common; however, concrete and other materials maybe used. Concrete tanks are favored for municipal treatment of do-mestic wastewaters.
Partial List of Suppliers of SBR Equipment: Aqua-AerobicsSystems; Austgen-Biojet; Bioclear Technology; Envirodyne Systems;Fluidyne; Jet Tech; Mass Transfer; Purestream; Transenviro
The Sequencing Batch Reactor (SBR) is a periodically op-erated, activated sludge-type, dispersed-growth, biologicalwastewater treatment system. Both biological reactions andsolids separation are accomplished in a single reactor, butat different times during a cyclic operation. In comparison,continuous flow activated sludge systems use two reactors,one dedicated to biological reactions and the other dedi-cated to solids separation. Once constructed, these two-tanksystems offer little flexibility because changing reactor sizeis difficult. However, the SBR is flexible, as the time dedi-cated to each function can be adjusted. For example, re-ducing the time dedicated to solids separation provides ad-ditional time for the completion of biological reactions.Other advantages of the SBR system are described below,along with a description of the SBR operating cycle. TheSBR originally was developed to treat domestic wastewaterand is now used to effectively treat industrial and otherorganic wastewaters containing hazardous substances.

Process DescriptionInfluent wastewater is added to a partially filled reactor.The partially filled reactor contains biomass acclimated tothe wastewater constituents during preceding cycles. Oncethe reactor is full, it behaves like a conventional activatedsludge aeration basin, but without inflow and outflow.After biological reactions are completed, and aeration andmixing is discontinued, the biomass settles and the treatedsupernatant is removed. Excess biomass is wasted at anyconvenient time during the cycle. Frequent wasting resultsin holding the mass ratio of influent substrate to biomassnearly constant from cycle to cycle. In contrast, continu-ous flow systems hold the mass ratio of influent substrateto biomass constant by adjusting return sludge flow ratescontinually as influent flow rates and characteristics andsettling tank underflow concentrations vary.
No specific SBR reactor shape is required. The width-to-length ratio is unimportant, although this is a concernwith conventional continuous flow systems. Deep reactorsimprove oxygen transfer efficiency and occupy less landarea. The SBR shown in Figure 11.18.1 uses an egg-shapedreactor that offers most of the advantages of a sphericalreactor, and provides a deeper reactor. Along with im-proved oxygen transfer efficiency, deep reactors allow ahigher fraction of treated effluent removal during decant-ing. Similar to a spherical reactor, the egg-shaped reactorhas a minimum surface area to volume ratio resulting inlower heat loss, less material needed in reactor construc-tion, and less energy required for mixing.
The small reactor top is easily enclosed to containvolatile organics, or to direct exhaust gases for removal inan absorber. During filling, floating materials are forcedtogether towards the top center for easy removal. The con-
verging bottom improves thickening of the settled solids,reduces sediment accumulation, and allows easy solids re-moval from a single center point.
The egg-shaped reactor is constructed as a single piece,eliminating the need for special reinforcement at static ten-sion points or seams. The bottom section of the egg isburied in the ground, supporting the reactor without a spe-cial foundation.
Modes of OperationThe illustration of an SBR in Figure 11.18.1 includes fivediscrete periods of time, with more than one operatingstrategy possible during any time period. The five discreteperiods are defined as:
1. Idle: waiting period2. Fill: influent is added3. React: biological reactions are completed4. Settle: solids separate from treated effluent5. Draw: treated effluent is removed
Each discrete period is detailed in the following sections.
IDLE
Idle is considered the beginning of the cycle, although thereexists no true beginning after the initial start-up. Idle oc-curs between draw, the removal of treated effluent, andfill, the beginning of influent addition. Idle time may beshort or long depending on flow rate variation and oper-ating strategy. When the influent flow rates are constantand predictable, and when flow equalization is providedupstream, idle is nearly eliminated. Idle time is long dur-ing periods of low influent flow, and short during periodsof high influent flow. During operations with variable idletimes, the SBR also provides flow equalization. Idle canalso be used to accomplish other functions, such as sludgewasting, and mixing to condition the biomass to a lowsubstrate concentration.
STATIC, MIXED AND AERATED FILL
Developing an operating strategy for the fill period is acomplex problem for designers of hazardous wastewaterSBR systems. Domestic wastewater treatment systems sel-dom require laboratory treatability studies, because thesesystems follow conservative design approaches and mu-nicipal wastewater flow rates and characteristic variationsare predictable. Laboratory treatability studies are almostalways needed to design SBRs and to select the appropri-ate fill policy for hazardous wastes. The following de-scribes alternative fill policies that must be developed dur-ing treatability studies.
SBR influent may require pretreatment. The decision toprovide screening and degritting is made on the same ba-sis used by designers of conventional continuous flow
©1999 CRC Press LLC
IDLE
INFLUENT
STATIC FILL
INFLUENT
MIX
MIXED FILL
INFLUENT
MIX
AIR
AERATED FILL
AERATED REACT
MIXED REACT
SETTLE
SLUDGE
DRAW
MIX
AIR
MIX
FIG. 11.18.1 Illustration of one cycle in a single SBR.

plants. Upstream flow equalization allows for rapid fillrates (i.e., higher than influent flow rates). This results inreduced cycle times and reduced reactor size. The use ofrapid fill periods also results in the accumulation of highsubstrate concentrations. Upstream flow equalization is notnecessary because idle is a normal SBR function. However,upstream flow equalization may be selected, allowingwastewaters with highly variable characteristics, or frommore than one process to be blended for more uniformity.In addition, high concentrations resulting from spill eventscan be caught and kept from interfering with the biologi-cal process. Flow equalization basins are often included inSBR systems because they are inexpensive, provide addedsystem flexibility, and reduce or eliminate idle time.
Static Fill
Static fill introduces influent wastewater into the SBR withlittle or no mixing and contact with the settled biomass,resulting in a high substrate concentration when mixingfirst begins. High substrate concentrations result in highreaction rates. In addition, such concentrates controlsludge bulking because they favor organisms that formmore dense floc particles over filament forming organisms.Bulking sludge is a common problem in continuous flowsystems where substrate concentrations are always low.Finally, static fill favors organisms that produce internalstorage products during high substrate conditions, a re-quirement for biological phosphorous removal. However,static fill time should be limited if an influent biodegrad-able constituent is present at concentrations toxic to theorganisms.
Mixed Fill
Mixed fill begins the biological reactions by bringing in-fluent organics into contact with the biomass. Mixing with-out aeration reduces the energy needed for aeration, becausesome organics are biologically degraded using residualoxygen or alternative electron acceptors, such as nitrate-nitrogen. If nitrate-nitrogen is the electron acceptor, a de-sirable denitrification reaction occurs. The period whenalternative electron acceptors are present and oxygen isabsent is called anoxic. Anaerobic conditions develop af-ter all electron acceptors are consumed, and fermentationreactions may occur. Thus, in a single reactor, aerobic,anoxic and anaerobic treatment conditions exist by cor-rectly varying mixing and aeration policies during fill.
Aerated Fill
Aerated fill begins the aerobic reactions that are later com-pleted during react. Aerated fill reduces cycle time becausethe aerobic reactions occur during the fill period. In somecases, a biodegradable influent constituent may be presentin concentrations that are toxic to the organisms. When
that condition exists, aeration during fill begins early tolimit concentration of that constituent. For example, if thewastewater constituent is toxic at 10 mg/L, and present inthe influent at a concentration of 30 mg/L, aeration shouldbegin prior to the reactor becoming three-quarters full, ifthe SBR liquid volume at the end of draw was one-halfthe volume at the end of fill. This assumes toxic constituentdegradation is at a rate greater than or equal to its rate ofaddition. If the rate of degradation is low, then aerationshould begin earlier, or a higher volume of treated efflu-ent should be held in the SBR for more dilution.
REACT
Aeration is often provided during the fill react period tocomplete the aerobic reactions. However, aerated react al-ternated with mixed react will provide alternating periodsof aerobic and anoxic, or even anaerobic, conditions. Thisis a normal procedure for nitrification and denitrification.During periods of aeration, nitrate concentration increasesas organic nitrogen and ammonia are converted to nitritesand nitrates. The mixed react results in anoxic conditionsneeded for denitrification and the conversion of nitrates tonitrogen gas. Anaerobic conditions are necessary if somewaste constituents are degraded only anaerobically, or par-tially degraded anaerobically followed by a completedegradation under aerobic conditions.
For mixed wastes, the easily degraded constituents areremoved first, and the more difficult to degrade con-stituents are removed later during extended periods of aer-ation. Long periods of aerated react, after removal of sol-uble substrates, may be necessary to condition the biomass,to remove internal storage products, or to aerobically di-gest the biomass. Aerated react may also be stopped soonafter the soluble substrate is removed. This saves energyand maximizes sludge production, which is desirable whenseparate anaerobic sludge digestion is used to stabilize thesewaste solids and to produce methane, an energy-rich anduseful by-product.
SETTLE
Settle is normally provided under quiescent conditions inthe SBR; however, gentle mixing during the early stagesof settle may result in both a clearer effluent and a moreconcentrated settled biomass. Unlike continuous flow sys-tems, settle occurs without inflow or outflow, and the ac-companying currents that interfere with settling.
DRAW
The use of a floating decanter, or a decanter that movesdownward during draw, offers several advantages. Drawis initiated earlier because the effluent is removed fromnear the surface while the biomass continues to settle atlower depths. The effluent is removed from a selected depth
©1999 CRC Press LLC
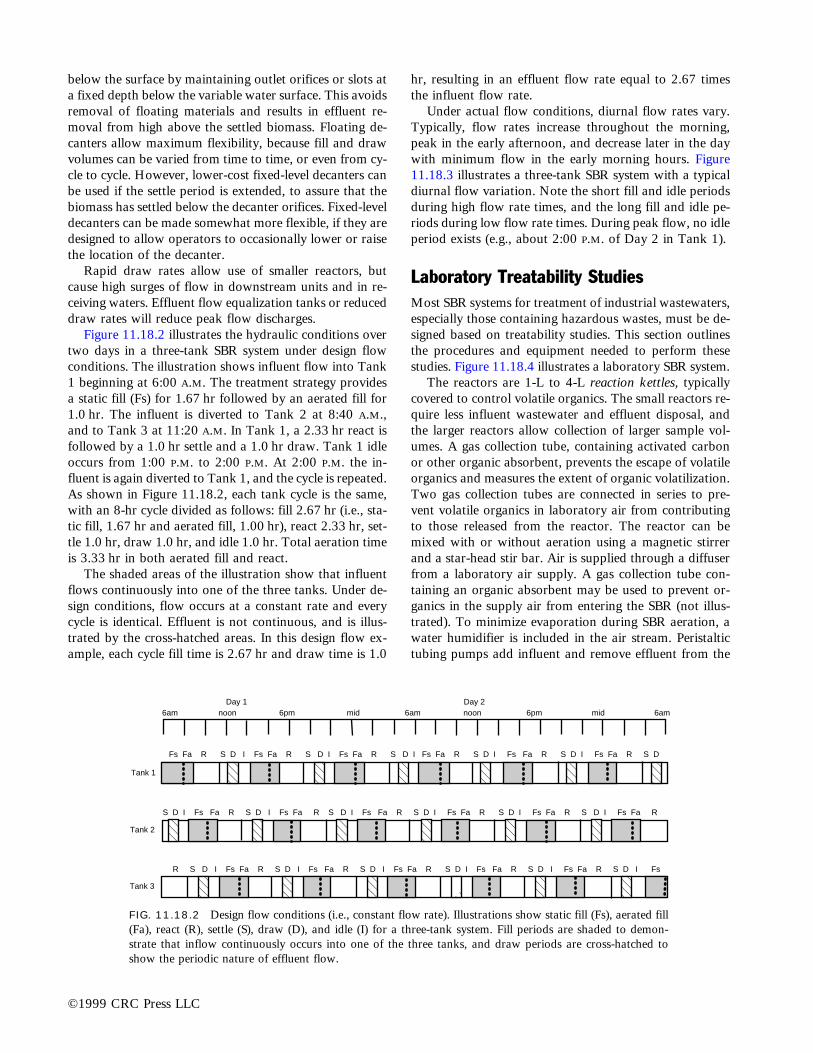
below the surface by maintaining outlet orifices or slots ata fixed depth below the variable water surface. This avoidsremoval of floating materials and results in effluent re-moval from high above the settled biomass. Floating de-canters allow maximum flexibility, because fill and drawvolumes can be varied from time to time, or even from cy-cle to cycle. However, lower-cost fixed-level decanters canbe used if the settle period is extended, to assure that thebiomass has settled below the decanter orifices. Fixed-leveldecanters can be made somewhat more flexible, if they aredesigned to allow operators to occasionally lower or raisethe location of the decanter.
Rapid draw rates allow use of smaller reactors, butcause high surges of flow in downstream units and in re-ceiving waters. Effluent flow equalization tanks or reduceddraw rates will reduce peak flow discharges.
Figure 11.18.2 illustrates the hydraulic conditions overtwo days in a three-tank SBR system under design flowconditions. The illustration shows influent flow into Tank1 beginning at 6:00 A.M. The treatment strategy providesa static fill (Fs) for 1.67 hr followed by an aerated fill for1.0 hr. The influent is diverted to Tank 2 at 8:40 A.M.,and to Tank 3 at 11:20 A.M. In Tank 1, a 2.33 hr react isfollowed by a 1.0 hr settle and a 1.0 hr draw. Tank 1 idleoccurs from 1:00 P.M. to 2:00 P.M. At 2:00 P.M. the in-fluent is again diverted to Tank 1, and the cycle is repeated.As shown in Figure 11.18.2, each tank cycle is the same,with an 8-hr cycle divided as follows: fill 2.67 hr (i.e., sta-tic fill, 1.67 hr and aerated fill, 1.00 hr), react 2.33 hr, set-tle 1.0 hr, draw 1.0 hr, and idle 1.0 hr. Total aeration timeis 3.33 hr in both aerated fill and react.
The shaded areas of the illustration show that influentflows continuously into one of the three tanks. Under de-sign conditions, flow occurs at a constant rate and everycycle is identical. Effluent is not continuous, and is illus-trated by the cross-hatched areas. In this design flow ex-ample, each cycle fill time is 2.67 hr and draw time is 1.0
hr, resulting in an effluent flow rate equal to 2.67 timesthe influent flow rate.
Under actual flow conditions, diurnal flow rates vary.Typically, flow rates increase throughout the morning,peak in the early afternoon, and decrease later in the daywith minimum flow in the early morning hours. Figure11.18.3 illustrates a three-tank SBR system with a typicaldiurnal flow variation. Note the short fill and idle periodsduring high flow rate times, and the long fill and idle pe-riods during low flow rate times. During peak flow, no idleperiod exists (e.g., about 2:00 P.M. of Day 2 in Tank 1).
Laboratory Treatability StudiesMost SBR systems for treatment of industrial wastewaters,especially those containing hazardous wastes, must be de-signed based on treatability studies. This section outlinesthe procedures and equipment needed to perform thesestudies. Figure 11.18.4 illustrates a laboratory SBR system.
The reactors are 1-L to 4-L reaction kettles, typicallycovered to control volatile organics. The small reactors re-quire less influent wastewater and effluent disposal, andthe larger reactors allow collection of larger sample vol-umes. A gas collection tube, containing activated carbonor other organic absorbent, prevents the escape of volatileorganics and measures the extent of organic volatilization.Two gas collection tubes are connected in series to pre-vent volatile organics in laboratory air from contributingto those released from the reactor. The reactor can bemixed with or without aeration using a magnetic stirrerand a star-head stir bar. Air is supplied through a diffuserfrom a laboratory air supply. A gas collection tube con-taining an organic absorbent may be used to prevent or-ganics in the supply air from entering the SBR (not illus-trated). To minimize evaporation during SBR aeration, awater humidifier is included in the air stream. Peristaltictubing pumps add influent and remove effluent from the
©1999 CRC Press LLC
������
����
��
R S D I Fs Fa R S D I Fs Fa R S D I Fs Fa R S D I Fs Fa R S D I Fs Fa R S D I Fs
Tank 3
S D I Fs Fa R S D I Fs Fa R S D I Fs Fa R S D I Fs Fa R S D I Fs Fa R S D I Fs Fa R
Tank 2
Tank 1
6am noon 6pm mid 6am noon 6pm mid 6amDay 1 Day 2
��������������
Fs Fa R S D I Fs Fa R S D I Fs Fa R S D I Fs Fa R S D I Fs Fa R S D I Fs Fa R S D
���
FIG. 11.18.2 Design flow conditions (i.e., constant flow rate). Illustrations show static fill (Fs), aerated fill(Fa), react (R), settle (S), draw (D), and idle (I) for a three-tank system. Fill periods are shaded to demon-strate that inflow continuously occurs into one of the three tanks, and draw periods are cross-hatched toshow the periodic nature of effluent flow.

SBR. Liquid level switches can be used to control the filland draw volume, or, as an alternative, suction tubes canbe placed at an elevation to prevent pumping excessivevolumes. The suction tube alternative will result in too lit-tle addition or removal if minor changes occur in thepumping rates, but this is minimized by frequent moni-toring and occasional manual over-ride at the end of apumping cycle, or simply recorded to reflect a slightly dif-ferent loading rate. System control is provided with a mi-croprocessor-based timer and controller that turns pumpson and off, opens and closes the air shut-off valve, andturns the mixer on and off at appropriate times.
Laboratory studies include a start-up period to developa biomass enriched for organisms acclimated to the waste-water constituents. Start-up time is minimized by includ-ing these organisms in the initial seed biomass. Aeration
of some wastewaters alone will result in an accumulationof a suitable biomass. At other times, activated sludge col-lected from nearby municipal or industrial wastewatertreatment plants may be needed. Finally, for difficult todegrade wastes, organisms are taken from: soil samplescollected from waste spill sites; sediments collected fromnearby receiving waters; or from residues in contact withwaste constituents for long periods of time. During start-up, fill and draw periods are controlled manually after sub-strate reduction is observed. Once an enriched and accli-mated biomass is developed, automatic SBR operation isused to determine the appropriate operating strategy, asdescribed above under the explanation of the differentphases of the SBR cycle.
—Lloyd H. Ketchum, Jr.
©1999 CRC Press LLC
����
���� �R S D I Fs Fa R S D Fs Fa R S D I Fs Fa R S D I Fs Fa R S D I Fs Fa R S D I
Tank 3
S D I Fs Fa R S D Fs Fa R S D I Fs Fa R S D I Fs Fa R S D I Fs Fa R S D I Fs Fa
Tank 2
Tank 1
6am noon 6pm mid 6am noon 6pm mid 6amDay 1 Day 2
���������������
Fs Fa R S D I Fs Fa R S D I Fs Fa R S D I Fs Fa R S D Fs Fa R S D I Fs Fa R
�
EffluentReservoir
InfluentReservoir
Pump Pump Mixer
ReactorWith AirDiffuser
WaterHumidifier
Time-Controller
AirSuppy
Control-Shut Off
Valve
Organic GasCollection Tube
FIG. 11.18.3 Typical flow conditions (i.e., diurnal flow rate variation). Illustrations show static fill (Fs),aerated fill (Fa), react (R), settle (S), draw (D), and idle (I) for a three-tank system. Fill periods are shadedto demonstrate that inflow continuously occurs into one of the three tanks, and draw periods are cross-hatched to show the periodic nature of effluent flow.
FIG. 11.18.4 Illustration of a laboratory SBR system.

The terms underground storage tanks, USTs, and UST sys-tems include underground storage tank vessels, and theconnected underground piping. Thus, above–ground tankswith extensive underground piping may also be regulatedunder RCRA Subtitle I. Usually associated with gasolineservice stations, these tanks are also used to store materi-als that are classified as hazardous due to flammability orcombustibility. Leaking underground storage tanks cancause fires or explosions or contaminate groundwater,threatening public health and the environment.
Problems and CausesLarge numbers of older USTs are “bare” steel. Tanks thatare over 10 years old and unprotected from corrosion arelikely to develop leaks. A leaking UST, if undetected or ig-nored, can cause large amounts of subsurface petroleumproduct loss. In a recent survey of motor fuel storage tanks,the EPA found that 35% of the estimated 796,000 tanksleak. Abandoned tanks were found at 14% of the surveyedestablishments, but the EPA did not conduct leakage testson these abandoned tanks.
Underground storage tanks release contaminants intothe subsurface environment because of one or more of thefollowing factors:
GALVANIC CORROSION
The most common failure of underground tank systems isgalvanic corrosion of the tank or piping. Corrosion can betraced to failure of corrosion protection systems due topinholes in the coating or taping, depletion of sacrificialanodes, corrosion from the inside due to the stored prod-uct, and various other reasons. Many corrosion–relatedleaks are found in systems that have no corrosion protec-tion at all. However, tanks with corrosion protection canalso corrode if the protective coating is damaged duringinstallation; the sacrificial anodes are not replaced whenrequired; the current is switched off in impressed currentsystems; or the protection system is not designed properlyfor the soil condition and stored liquids.
FAULTY INSTALLATION
Installation failures include inadequate backfill, allowingmovement of the tank, and separation of pipe joints. Thesetanks receive a substantial portion of structural supportfrom backfill and bedding. Mishandling can cause struc-tural failures of RFP tanks, or damage to steel tank coat-ing and cathodic protection.
PIPING FAILURES
The underground piping that connects tanks to each other,to delivery pumps, and to fill drops is even more frequentlymade of unprotected steel. An EPA study found that pip-ing failure accounts for a substantial portion of large spillsat UST facilities. The study concluded that piping failureis caused equally by corrosion and poor workmanship.Threaded metal areas, made electrically active by thethreading, have strong tendency to corrode if not coatedand cathodically protected. Improper layout of pipe runs,incomplete tightening of joints, inadequate cover pad con-struction, and construction can accidents lead to failure ofdelivery piping. Figure 11.19.1 diagrams a typical servicestation tank and piping layout.
©1999 CRC Press LLC
Storage and Leak Detection
11.19UNDERGROUND STORAGE TANKS
VentPipes
Line LeakDetectors
Product Delivery LinesProduct Dispensers
DeliveryHose
Fill Pipe
Tank Truck
FIG. 11.19.1 Typical service station tank and piping layout(EPA).

SPILLS AND OVERFILLS
Spills and overfills, usually the result of human error, ag-gravate release problems at UST facilities. In addition todirect contamination effects, repeated spills of petroleumor hazardous waste can intensity the corrosiveness of thesoils. These mistakes can be corrected by following thecorrect tank filling practices required by 40 CFR 280.Other causes include: delivery source failure, shutoff valvefailure, and tank level indicator failure.
COMPATIBILITY OF UST AND CONTENTS
Compatibility between tanks and contents means that fuelcomponents will not change the physical or mechanicalproperties of the tank. Compatibility for liners requiresthat fuel components not cause blistering, underfilm cor-rosion or internal stress or cracking. There are concernsthat some FRP tanks or liners may not be compatible withsome methanol-blended (or possible ethanol-blended) fu-els. A fuel tank should be designed to handle fuel compo-sitions of the future.
Owners and operators of businesses with FRP-con-structed or lined tanks should consult appropriate stan-dards of the American Petroleum Institute.
UST RegulationsEPA regulations establishing controls for new and existingunderground storage tanks became effective in December1988. Following is a list of important requirements:
DESIGN, CONSTRUCTION, ANDINSTALLATION
Tanks and piping may be constructed of fiberglass, coatedsteel (asphalt or paint), or metal without additional cor-
rosion protection. If constructed of coated steel, tanks andpiping must also contain corrosion-protection devices suchas cathodic protection systems. Such corrosion-protectiondevices must be regularly inspected. If constructed of metalwithout corrosion protection, records must be maintainedshowing that a corrosion expert has determined that thesite is not corrosive enough to cause leaks during the tank’soperating life. Tanks must be installed properly and pre-cautions must be taken to prevent damage.
Information on the design (including corrosion protec-tion), construction, and installation of tanks and piping isavailable on notification forms filed in the designated stateoffice, usually the state UST office. Reports of inspections,monitoring, and testing of corrosion protection devices areon file at the UST site or must be made available to theimplementing agency upon request.
Recent developments in preventing leakage include us-ing asphalt coated steel tanks, double-walled fiberglasstanks, double-walled steel tanks, epoxy-coated steel tanks,fiberglass-coated steel tanks, fiberglass-coated double-walled tanks, synthetic underground containment liners,and tanks placed in subgrade vaults (see Figure 11.19.2).Some suppliers offer double-walled pipes for added safety.Lined trenches offer secondary containment for single-walled pipes.
SPILLS AND OVERFILLS CONTROL
Except for systems filled by transfer of no more than 25gallons at one time, UST systems must use one or moreoverfill prevention devices. These devices include sensorsto detect tank capacity level, automatic flow shutoff valves,and spill catchment basins.
Owners and operators must report spills and overfills tothe implementing agency within a reasonable time period.
The standards apply to new UST systems and some ex-isting tanks.
©1999 CRC Press LLC
�����{{{||������������
������yyyzzz{{{{{{
||||||
��������yyzz{{||
Reinforced Concrete Traffic Cover-Minimum Thickness of 6"
Observation Well With Tamper-Proof,Water-Resistant Cap
Borehole
Low Permeability Backfill
Gravel
Slotted Screen
Groundwater Table
Containment Layerof Natural orSynthetic Material
Soil
Manway With Tamper-Proof,Water-Resistant Cap
Outer Wall
Inner Wall
Tank Bedding Minimum Thickness-12"(Same Material as Backfill)
Double-WalledTank
A: Minimum Tank Clearance: 12" For Steel Tanks and 18" For FRP TanksB: Minimum Burial Depth: 24" For Steel Tanks and 36" For FRP TanksC: Minimum Penetration Into Groundwater: 5'
C
3
13
12
11
10
9
8
7
6
5
1
B
1
4 Backfill Washed Sandor Pea Gravel Compactedin 12" Lifts
To Leak Alarm2Leak Detection
System1
A
FIG. 11.19.2 Double wall tank and leak detection system. (Reprinted from New YorkDepartment of Environmental Conservation, 1982, Siting manual for storing hazardous sub-stances: a practical guide for local officials. New York, N.Y.)

REPAIRS
Tank repairs must be conducted in accordance with a codeof practice developed by a nationally recognized associa-tion or an independent testing laboratory. Following re-pairs, tightness tests may be required.
Owners must maintain repair records on-site or mustmake them available to the implementing agency uponrequest.
These repair standards apply to new and existing USTsystems.
LEAK DETECTION
Release detection requirements differ between petroleumUSTs and hazardous waste USTs. Petroleum UST systems
may choose from among five primary release detectionmethods, for example: 1) automatic tank gauging that testsfor product loss and conducts inventory control; 2) test-ing or monitoring for vapor within the soil gas of the tankarea; and 3) testing or monitoring for liquids in the ground-water. Hazardous substance tanks must use secondarycontainment systems such as double-walled tanks or ex-ternal liners, unless the owner has obtained a variance.
Owners must maintain records pertaining to: system leakdetection methods; recent test results to detect possible leaks;and maintenance of release detection equipment; and mustmake these available to the agency on request. Informationon leak detection method(s) used by UST systems is alsoon the notification form on file in each state’s UST office.
These leak detection standards apply to new USTsystems.
©1999 CRC Press LLC
TABLE 11.19.1 MINIMUM REQUIREMENTS FOR COMPLIANCE WITH UST REGULATIONS (EPA)
Leak DetectionNEW TANKS • Monthly Monitoring*
2 Choices • Monthly Inventory Control and Annual Tank Tightness Every 5 Years(You can only use this choice for 10 years after installation.)
EXISTING TANKS • Monthly Monitoring*3 Choices • Monthly Inventory Control and Annual Tank Tightness Testing
(This choice can be used until December 1998.)• Monthly Inventory Control and Tank Tightness Testing Every 5 Years
(This choice can only be used for 10 years after adding corrosion protection andspill/overfill prevention or until December 1998, whichever date is later.)
NEW & EXISTING • Automatic Flow Restrictor • Annual Line TestingPRESSURIZED PIPING • Automatic Shutoff Device -and- • Monthly Monitoring*
Choice of one from each set • Continuous Alarm System (except automatic tank gauging)
NEW & EXISTING • Monthly Monitoring*SUCTION PIPING (except automatic tank gauging)
3 Choices • Line Testing Every 3 Years• No Requirements—if slope and check valve conditions are met
Corrosion ProtectionNEW TANKS • Coated and Cathodically Protected Steel
3 Choices • Fiberglass• Steel Tank clad with Fiberglass
EXISTING TANKS • Same Options as for New Tanks4 Choices • Add Cathodic Protection System
• Interior Lining• Interior Lining and Cathodic Protection
NEW PIPING • Coated and Cathodically Protected Steel2 Choices • Fiberglass
EXISTING PIPING • Same Options as for New Piping2 Choices • Cathodically Protected Steel
Spill/Overfill PreventionALL TANKS Catchment Basins -and- • Automatic Shutoff Devices -or-
• Overfill Alarms -or-• Ball Float Valves
*Monthly Monitoring includes: Automatic Tank Gauging, Ground-water Monitoring, Vapor Monitoring, Other Approved Methods, Interstitial Monitoring
OUT-OF-SERVICE SYSTEMS ANDCLOSURE
During temporary closures, owners must continue all usualsystem operation, maintenance, and leak detection proce-dures, and must comply with release reporting and cleanupregulations if a leak is suspected or confirmed. Release de-tection, however, is not required if the UST system is empty.
If a UST system is taken out of service for more than12 months, it must be permanently closed unless it meetscertain performance standards and upgrading require-ments. Before a tank is permanently closed, the owner oroperator must test for system leaks: if a leak is found, theowner or operator must comply with corrective-action reg-ulations. Once the tank is permanently out of service, itmust be emptied, cleaned, and either removed from theground or filled with an inert solid material.
Closure procedures are available at each tank site or mustbe made available to the implementing agency upon request.
These closure standards apply to all new and existingUST systems.
Financial ResponsibilityThese regulations specify the amount and scope of cover-age required for corrective action and for compensating
third parties for bodily injury and property damage fromleaking tanks. The minimum coverage required varies de-pending on the number of tanks owned, from $1,000,000for up to 100 USTs to $2,000,000 for more than 100USTs.
Various mechanisms may be used to fulfill coveragerequirements, such as self-insurance, indemnity contracts,insurance, standby trust funds, or state funds. Quickaction may ensure that available funds are directed to-ward coverage. Particular attention should be paid toself-insured tank owners. However, even large compa-nies may go bankrupt, leaving the contracting engineerunprotected.
Information on financial responsibility for new tanksmust be filed with the EPA regional office. Ownersmust also maintain evidence of financial responsibil-ity at tank sites or places of business, or make suchevidence available upon request of the implementingagency.
These financial responsibility standards apply to mostnew and existing UST systems.
The technical requirements for UST rules are summa-rized in Table 11.19.1.
—David H.F. Liu
©1999 CRC Press LLC
11.20LEAK DETECTION AND REMEDIATION
Contamination caused by leaky USTs often may not bedetected until it is widespread, and difficult and expen-sive to correct. Regular tests and inspections of tanksand piping are necessary to ensure that leaks are detectedearly and prevented promptly. The extent of releasesand their migration are characterized to plan correctiveactions.
If a tank is leaking more than 0.05 gph, it is a leaker.Less than 0.05 gph is beyond the scope of measurementability and the tank is considered tight. Present technol-ogy is imprecise in detecting leaks smaller than 0.05 gph.This standard is listed in NFPA 329, Final Test, now re-named Precision Test.
Tank MonitoringThere are four general methods for detecting leaks in USTs:
• Volumetric (quantitative) leak testing and leak ratemeasurement
• Non-volumetric (qualitative) leak testing
• Inventory monitoring• Environmental monitoring
These methods can be used independently or in com-bination.
Figure 11.20.1 illustrates some of these leak detectingalternatives.
Regardless of the UST monitoring techniques used, theeffects of major variables must be compensated for (Table11.20.1). It is important for USTs to be tested under con-ditions close to normal operating conditions without un-covering the tanks. Uncovering tanks or piping is expen-sive and time-consuming, and can cause new leaks.Inadvertent pressurization during testing may rupture thetank and piping.
VOLUMETRIC LEAK TESTING
Table 11.20.2 summarizes common volumetric tank test-ing systems. These systems may be used to detect leaksand ascertain tightness of tanks and associated piping.
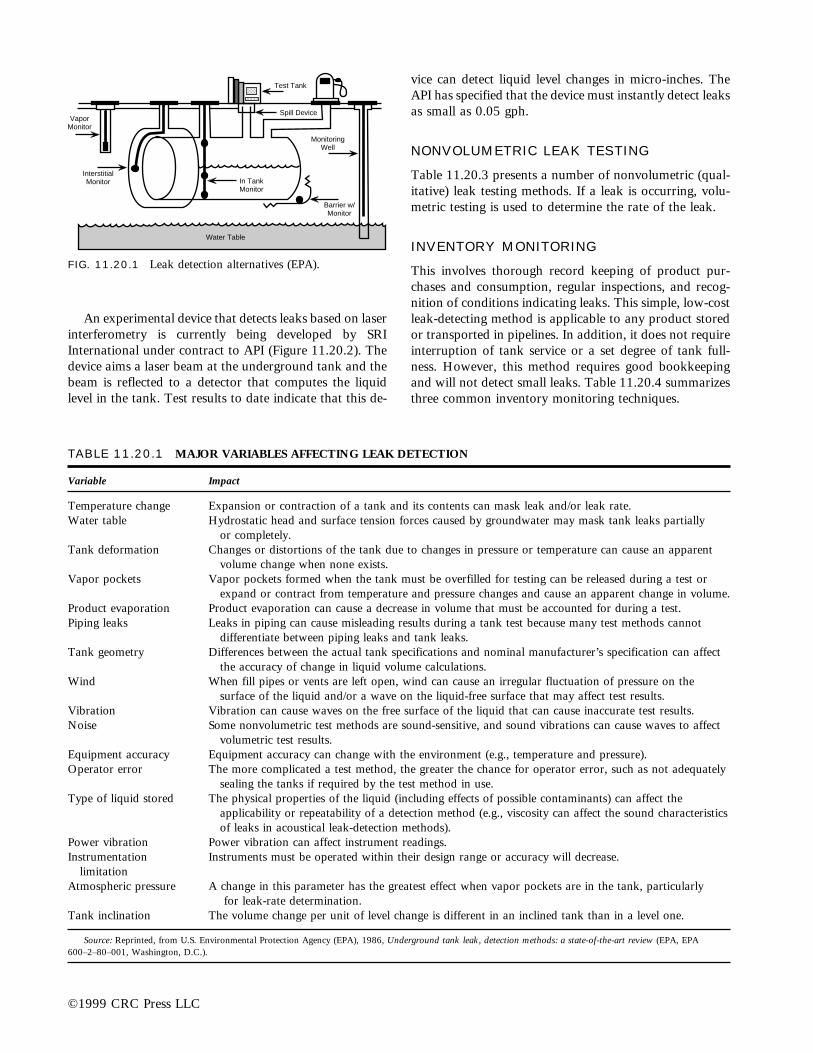
An experimental device that detects leaks based on laserinterferometry is currently being developed by SRIInternational under contract to API (Figure 11.20.2). Thedevice aims a laser beam at the underground tank and thebeam is reflected to a detector that computes the liquidlevel in the tank. Test results to date indicate that this de-
vice can detect liquid level changes in micro-inches. TheAPI has specified that the device must instantly detect leaksas small as 0.05 gph.
NONVOLUMETRIC LEAK TESTING
Table 11.20.3 presents a number of nonvolumetric (qual-itative) leak testing methods. If a leak is occurring, volu-metric testing is used to determine the rate of the leak.
INVENTORY MONITORING
This involves thorough record keeping of product pur-chases and consumption, regular inspections, and recog-nition of conditions indicating leaks. This simple, low-costleak-detecting method is applicable to any product storedor transported in pipelines. In addition, it does not requireinterruption of tank service or a set degree of tank full-ness. However, this method requires good bookkeepingand will not detect small leaks. Table 11.20.4 summarizesthree common inventory monitoring techniques.
©1999 CRC Press LLC
FIG. 11.20.1 Leak detection alternatives (EPA).
��
Water Table
Barrier w/Monitor
MonitoringWell
Test Tank
In TankMonitor
InterstitialMonitor
VaporMonitor
Spill Device
TABLE 11.20.1 MAJOR VARIABLES AFFECTING LEAK DETECTION
Variable Impact
Temperature change Expansion or contraction of a tank and its contents can mask leak and/or leak rate.Water table Hydrostatic head and surface tension forces caused by groundwater may mask tank leaks partially
or completely.Tank deformation Changes or distortions of the tank due to changes in pressure or temperature can cause an apparent
volume change when none exists.Vapor pockets Vapor pockets formed when the tank must be overfilled for testing can be released during a test or
expand or contract from temperature and pressure changes and cause an apparent change in volume.Product evaporation Product evaporation can cause a decrease in volume that must be accounted for during a test.Piping leaks Leaks in piping can cause misleading results during a tank test because many test methods cannot
differentiate between piping leaks and tank leaks.Tank geometry Differences between the actual tank specifications and nominal manufacturer’s specification can affect
the accuracy of change in liquid volume calculations.Wind When fill pipes or vents are left open, wind can cause an irregular fluctuation of pressure on the
surface of the liquid and/or a wave on the liquid-free surface that may affect test results.Vibration Vibration can cause waves on the free surface of the liquid that can cause inaccurate test results.Noise Some nonvolumetric test methods are sound-sensitive, and sound vibrations can cause waves to affect
volumetric test results.Equipment accuracy Equipment accuracy can change with the environment (e.g., temperature and pressure).Operator error The more complicated a test method, the greater the chance for operator error, such as not adequately
sealing the tanks if required by the test method in use.Type of liquid stored The physical properties of the liquid (including effects of possible contaminants) can affect the
applicability or repeatability of a detection method (e.g., viscosity can affect the sound characteristicsof leaks in acoustical leak-detection methods).
Power vibration Power vibration can affect instrument readings.Instrumentation Instruments must be operated within their design range or accuracy will decrease.
limitationAtmospheric pressure A change in this parameter has the greatest effect when vapor pockets are in the tank, particularly
for leak-rate determination.Tank inclination The volume change per unit of level change is different in an inclined tank than in a level one.
Source: Reprinted, from U.S. Environmental Protection Agency (EPA), 1986, Underground tank leak, detection methods: a state-of-the-art review (EPA, EPA600–2–80–001, Washington, D.C.).

©1999 CRC Press LLC
ENVIRONMENTAL MONITORING
Monitoring wells are the most prevalent form of environ-mental monitoring for USTs. With environmental effectsmonitoring, it is difficult to determine which tank is leak-ing when there is more than one tank. These methods donot provide information on leakage rates or the size of theleak; however, once installed, a leak effects monitoring sys-tem enables more frequent checking for leaking tanks thanthe other methods. Table 11.20.5 presents the principalenvironmental monitoring methods.
An early warning monitoring technique of double-walled tanks involves monitoring the space between theinner and outer walls of the tank, using either fluid sen-sors or pressure sensors. This is accurate and applicablewith any double-walled tank.
Vapor wells may be used to detect hazardous gases orvapors released into the soil surrounding the UST. Gas de-tectors or portable gas sampling devices can be used tomonitor for gaseous contaminants.
Groundwater monitoring wells may be used to detector define the movement of leaked substances in a ground-water table. This typically entails drilling monitoring wells,installing monitoring casings, and performing chemicalanalyses. Table 11.20.6 presents a generalized groundwa-ter sampling protocol.
Table 11.20.7 summarizes the advantages and disad-vantages of the various leak monitoring techniques, in-cluding those presented in this section.
����
Needle Valve
Brass Tube
Gasoline
Cube-CornerReflector
Float
Gasoline Surface
Optical Glass
Ground
Interferometer
Laser
Beam Splitter
FIG. 11.20.2 Laser interferometer used to measure levelchanges. (Source: U.S. EPA.)
TABLE 11.20.2 VOLUMETRIC LEAK TESTING METHODS
Total Down- RequiresClaimed Accu- time for Empty or Full
Method Principle racy, gal/h Testing Tank for Test
Ainlay tank integ- Pressure measurement by a 0.02 10–12 h (filled Fullrity testing coil-type manometer to de- a night before
termine product level 1.5-h testing)change in a propane bub-bling system
ARCO HTC un- Level change measurement 0.05 4–6 h Noderground tank by float and light-sensingdetector system
Certi-Tec testing Monitoring of pressure 0.05 4–6 h Fullchanges resulting from prod-uct level changes
“Ethyl” tank Level change magnification Sensitive to Typically 10 h Nosentry by a J tube manometer 0.02-in level
changeEZY-CHEK leak Pressure measurement to Less than 0.01 4–6 h (2 h wait- Full
detector determine product level ing after fillup,change in an air bubbling 1-h test)system
Fluid-static Pressurizing of system by a Gross Several days Full(standpipe) test- standpipe; keeping the leveling constant by product addi-
tion or removal; measuringrate of volume change
(Continued on next page)

Corrective TechnologiesThe most important considerations are the volume andtype of substance released and constraining site featuresthat can hinder or prevent effective implementation of atechnology. To lesser extent, the financial ability of re-sponsible parties to implement certain technologies and theimpact on facility production or service operations alsoshould be considered.
Table 11.20.8 summarizes potential applicable correc-tive action technologies commensurate with release volumeand chemical characteristics. Applicable site data needs forpotential technologies are presented in Table 11.20.9.
Initial Response Action. The first response action mustminimize immediate risk to human health and the envi-ronment; all remaining product must be removed fromleaky tanks. Table 11.20.10 lists potential situations andtheir associated initial corrective actions.
Permanent Response Action. Table 11.20.11 gives exam-ples of permanent corrective actions for a variety of site-specific problems.
—David H.F. Liu
©1999 CRC Press LLC
TABLE 11.20.2 (Continued)
Total Down- RequiresClaimed Accu- time for Empty or Full
Method Principle racy, gal/h Testing Tank for Test
Heath Petro Tite Pressurizing of system by a Less than 0.05 6–8 h Fulltank and line test- standpipe; keeping the leveling (Kent-Moore) constant by product addi-
tion or removal; measuringvolume change; productcirculation by pump
Helium differen- Leak detection by differen- Less than 0.05 Minimum 48 h Emptytial pressure test- tial pressure change in aning empty tank; leak rate esti-
mation by Bernoulli’s equa-tion
Mooney tank test Measuring level change with 0.02 14–16 h* (12 to Fulldetector a dip stick 14 h waiting
after fillup)PACE tank tester Magnification of pressure Less than 0.05 14 h Full
change in a sealed tank byusing a tube (based on ma-nometer principle)
PALD-2 leak Pressurizing system with Less than 0.05 14 h (prefer- Fulldetector nitrogen at three different ably 1 day be-
pressures; level measure- fore, 1-h fillment by an electrooptical testing,device; estimate of leak rate includes seal-based on the size of leak ing time)and pressure differenceacross the leak
Pneumatic testing Pressurizing system with Gross Several hours Noair or other gas; leakrate measurement bychange in pressure
Tank auditor Principle of buoyancy 0.00001 in the 1.5–3 h Typically fullfill pipe; 0.03 atthe center of a10.5-ft-diametertank
Two-tube laser Measuring level change Less than 0.05 4–5 h† No (at existinginterferometer by laser beam and its level)system reflection
*Including the time for tank end stabilization when testing with standpipe.†Including 1 to 2 h for reference tube temperature equilibrium.Source: Reprinted from U.S. EPA, 1986.
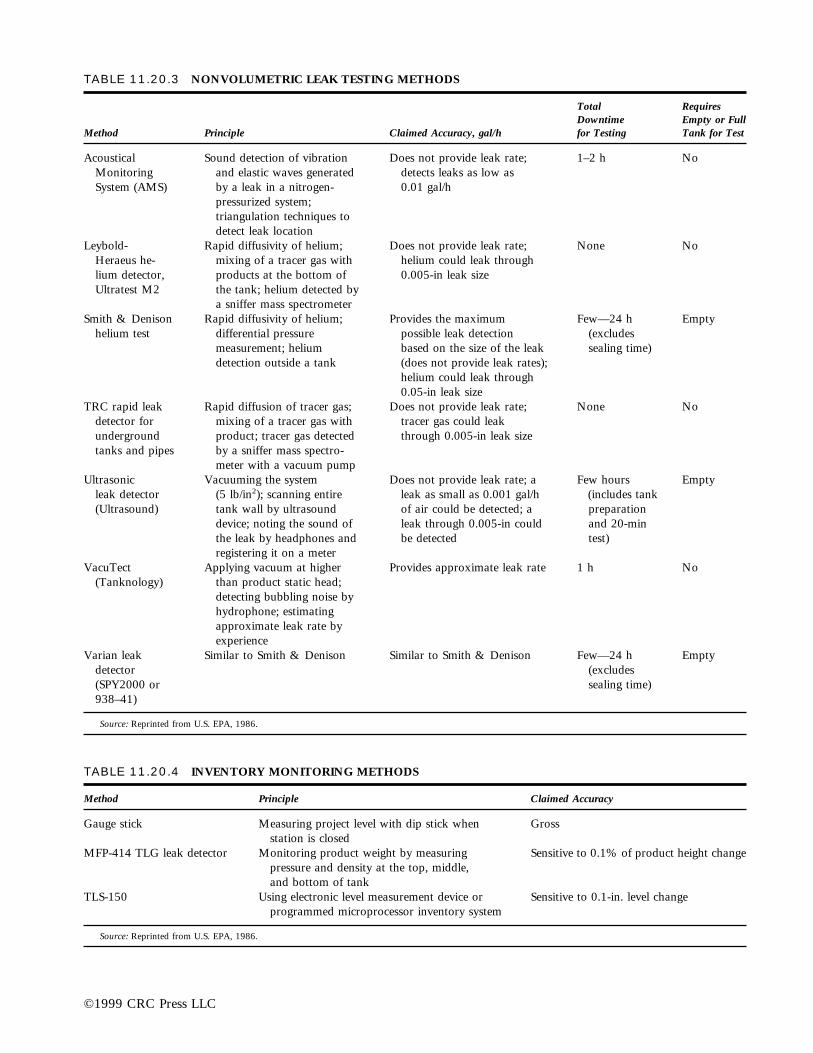
©1999 CRC Press LLC
TABLE 11.20.3 NONVOLUMETRIC LEAK TESTING METHODS
Total RequiresDowntime Empty or Full
Method Principle Claimed Accuracy, gal/h for Testing Tank for Test
Acoustical Sound detection of vibration Does not provide leak rate; 1–2 h NoMonitoring and elastic waves generated detects leaks as low asSystem (AMS) by a leak in a nitrogen- 0.01 gal/h
pressurized system;triangulation techniques todetect leak location
Leybold- Rapid diffusivity of helium; Does not provide leak rate; None NoHeraeus he- mixing of a tracer gas with helium could leak throughlium detector, products at the bottom of 0.005-in leak sizeUltratest M2 the tank; helium detected by
a sniffer mass spectrometerSmith & Denison Rapid diffusivity of helium; Provides the maximum Few—24 h Empty
helium test differential pressure possible leak detection (excludesmeasurement; helium based on the size of the leak sealing time)detection outside a tank (does not provide leak rates);
helium could leak through0.05-in leak size
TRC rapid leak Rapid diffusion of tracer gas; Does not provide leak rate; None Nodetector for mixing of a tracer gas with tracer gas could leakunderground product; tracer gas detected through 0.005-in leak sizetanks and pipes by a sniffer mass spectro-
meter with a vacuum pumpUltrasonic Vacuuming the system Does not provide leak rate; a Few hours Empty
leak detector (5 lb/in2); scanning entire leak as small as 0.001 gal/h (includes tank(Ultrasound) tank wall by ultrasound of air could be detected; a preparation
device; noting the sound of leak through 0.005-in could and 20-minthe leak by headphones and be detected test)registering it on a meter
VacuTect Applying vacuum at higher Provides approximate leak rate 1 h No(Tanknology) than product static head;
detecting bubbling noise byhydrophone; estimatingapproximate leak rate byexperience
Varian leak Similar to Smith & Denison Similar to Smith & Denison Few—24 h Emptydetector (excludes(SPY2000 or sealing time)938–41)
Source: Reprinted from U.S. EPA, 1986.
TABLE 11.20.4 INVENTORY MONITORING METHODS
Method Principle Claimed Accuracy
Gauge stick Measuring project level with dip stick when Grossstation is closed
MFP-414 TLG leak detector Monitoring product weight by measuring Sensitive to 0.1% of product height changepressure and density at the top, middle,and bottom of tank
TLS-150 Using electronic level measurement device or Sensitive to 0.1-in. level changeprogrammed microprocessor inventory system
Source: Reprinted from U.S. EPA, 1986.

©1999 CRC Press LLC
TABLE 11.20.5 ENVIRONMENTAL MONITORING METHODS
Method Principle
Collection sumps Using collection mechanism of product in collection sump throughsloped floor under the storage tank
Dye method Hydrocarbon detection by use of soluble dye through perforated pipeGroundwater and soil sampling Water and soil samplingInterstitial monitoring in double-walled tanks Monitoring in interstitial space between the walls of double-walled tanks
with vacuum or fluid sensorsLASP Diffusion of gas and vapor to a plastic materialObservation wells Product sensing in liquid through monitoring wells at areas with high
groundwaterPollulert and Leak-X Difference in thermal conductivity of water and hydrocarbons through
monitoring wellsRemote infrared sensing Determining soil temperature characteristic change due to the presence of
hydrocarbonsSurface geophysical methods Hydrocarbon detection by ground-penetrating radar, electromagnetic
induction, or resistivity techniquesU-tubes Product sensing in liquid; collection sump for product directed through a
horizontal pipe installed under a tankVapor wells Monitoring of vapor through monitoring well
Source: Reprinted from U.S. EPA, 1986.
TABLE 11.20.6 GENERALIZED GROUNDWATER SAMPLING PROTOCOL
Step Goal Recommendations
Hydrologic measurements Establish nonpumping water level. Measure the water level to 60.01 ft(60.3 cm)
Well purging Remove or isolate stagnant H2O which Pump water until well purging parameterswould otherwise bias representative (e.g., pH, T, V21, Eh) stabilize to 610%sample. over at least two successive well
volumes pumped.Sample collection Collect samples at land surface or in Pumping rates should be limited to
well-bore with minimal disturbance 2100 mL/min for volatile organicsof sample chemistry. and gas-sensitive parameters.
Filtration and preservation Filtration permits determination of Filter: Trace metals, inorganic anions andsoluble constituents and is a form of cations, alkalinity. Do not filter: TOC,preservation. It should be done in the TOX, volatile organic compoundfield as soon as possible samples; other organic compoundafter collection. samples only when required.
Field determinations Field analyses of samples will effectively Samples for determining gases,avoid bias in determining parameters alkalinity, and pH should be ana-and constituents which do not store lyzed in the field if at all possible.well; e.g., gases, alkalinity, pH.
Field blanks and standards These blanks and standards will permit At least one blank and one standardthe correction of analytical results for each sensitive parameter shouldfor changes which may occur after be made up in the field on each daysample collection: preservation, of sampling. Spiked samples are alsostorage, and transport. recommended for good QA/QC.
Sample storage and transport Refrigerate and protect samples to Observe maximum sample holding orminimize their chemical alteration storage periods recommended by theprior to analysis. Agency. Documentation of actual
holding periods should be carefullyperformed.

©1999 C
RC
Press LL
C
TABLE 11.20.7 COMPARISON OF VARIOUS LEAK MONITORING TECHNIQUES
Substances RelativeApproach Description Applications Detected Cost Advantages/Disadvantages
Inventory A system based on product Any storage tanks and Any product stored Low The technique is widely applicable to anyControl record keeping, regular buried pipelines. or transported. product stored or transported in pipelines.
inspections, and recognition However, it requires good bookkeeping,of the conditions which and will not detect small leaks.indicate leaks.
Thermal Uses a probe that detects the Can monitor groundwater Any liquid. Medium Primary advantage is early detection whichConductivity presence of stored product or normally dry areas. makes it possible for leaks and spills toSensors by measuring thermal be corrected before large volumes of
conductivity. material are discharged. Typicallyrequires Af inch of product on ground/water interface in wet (groundwater)applications.
Electric Consists of one or series of Can monitor groundwater Any liquid. Medium Primary advantage is the early detection ofResistivity sensor cables that deteriorate or normally dry areas. spills. Once a leak or spill is detected theSensors in the presence of the stored sensors must be replaced. Can detect
product, thereby indicating small as well as large leaks.a leak.
Gas Detectors Used to monitor the presence Areas of highly permeable, Highly volatile liquids, Medium Once the contaminant is present andof hazardous gases in vapors dry soil, such as excavation such as gasoline. detected, gas detectors are no longer ofin the soil. backfill or other permeable use until contamination has been
soils, above ground-water cleaned up.table.
Sampling Grabbing soil or water samples Universal; primarily used to Any substance High Highly accurate intermittent evaluationfrom area for analysis. collect groundwater samples, tool. However, does not provide
as would be the case with continuous monitoring.tanks stored in high ground-water area.
Interstitial Monitors pressure level or Double-walled tanks. Pressure sensors monitor High Accurate technique which is applicable wi
Monitoring in vacuum in space between tank integrity and are any double-walled tanks.Double-Walled walls of a double-walled applicable with anyTanks tank. stored liquid. Fluid
sensors monitorpresence of any liquidin a normally dry areaand are also applicablewith any stored liquid.
(Continued on next page)

©1999 C
RC
Press LL
C
TABLE 11.20.7 (Continued)
Substances RelativeApproach Description Applications Detected Cost Advantages/Disadvantages
Groundwater Wet wells are used to detect Area-wide or local monitoring Any hazardous Medium to The type, number and location of wet wellsMonitoring and determine the extent of for groundwater contamina- liquids which can High depends upon the site’s hydrogeology,Wells contamination in ground- tion from underground be detected by the direction of groundwater flow, and the(wet wells) water tables. storage tanks and pipelines. on-site type of spill containment and spill
May be used for periodic instruments or collection systems used.sampling or may employ one laboratoryof the sensors described above analysis.to detect leaks or spills.
Vapor (sniff) Vapor wells are used to detect Area-wide or local monitoring Many different Low The type, number and location of vaporWells and monitor the presence of of the soil surrounding combustible and wells depend upon the extent of the spill,
hazardous gases and vapors underground storage tanks non-combustible the volatility of the product, and the soilin the soil. and pipe-lines. gases and vapors. characteristics. Vapor wells are subject
to contamination from surface spills andcannot be used at contaminated sites.
Dyes and Substances with a characteristic Area-wide monitoring of Dye itself is detected Low Medium Dye or tracer could be low in cost, but theTracers color or other characteristics underground tanks and visually or with the time required to perform a study could be
(e.g., radioactive tracers) buried pipelines. use of instruments. great. Also may require the drilling ofthat can be used to trace observation wells to trace the dye of otherthe origin of a spill. material. Radioactive tracers require a
license and approval from the NuclearRegulatory Commission of the U.S.Department of Labor. Therefore they aregenerally discouraged.

©1999 CRC Press LLC
TABLE 11.20.8 APPLICATIONS OF TYPICAL CORRECTIVE ACTION TECHNOLOGIES
Technology
Removal and excavation of tank, soil, and sedimentTank removal ● ● ● ●Soil excavation ● ● ● ●Sediment removal ● ● ●
On-site and off-site treatment and disposal of contaminantsSolidification or stabilization ● ● ●Landfilling ●Landfarming ● ● ● ●Soil washing ●Thermal destruction ● ●Aqueous waste treatment ● ● ● ●Deep well injection
Free product recoveryDual pump systems ● ● ● ●Floating filter pumps ● ● ● ●Surface oil and water separators ● ● ●
Groundwater recovery systemsGroundwater pumping ● ● ● ●Subsurface drains ● ● ● ●
Subsurface barriersSlurry walls ● ● ●Grouting ● ● ●Sheet pilesHydraulic barriers ● ● ● ●
In situ treatmentChemical treatmentPhysical treatment ● ●Soil flushing ● ● ● ●Biostimulation ● ● ● ●
Groundwater treatmentAir stripping ● ● ●Carbon adsorption ● ● ●Biological treatment ● ● ●Precipitation, flocculation, sedimentation ●Dissolved air flotation ●
Groundwater treatmentGranular media filtration ●Ion-exchange resin adsorption ●Oxidation-reduction ●Neutralization ●Steam stripping ●Reverse osmosis ●Sludge dewatering ●
(Continued on next page)
Rel
ease
fro
m t
anks
con
tain
ing
haza
rdou
s su
bsta
nces
(in
orga
nic)
Smal
l- t
o m
oder
ate-
volu
me
rece
ntga
solin
e or
pet
role
um r
elea
se (
gas
stat
ion
or t
ank
farm
s)
Lar
ge-v
olum
e or
lon
g-te
rm c
hron
icga
solin
e or
pet
role
um r
elea
se (
gas
stat
ion
or t
ank
farm
s)
Rel
ease
fro
m t
anks
con
tain
ing
haza
rdou
s su
bsta
nces
(or
gani
c)

©1999 CRC Press LLC
TABLE 11.20.8 (Continued)
Technology
Vapor migration control, collection, and treatmentPassive collection systems ● ●Active collection systems ● ●Ventilation of structures ● ● ●Adsorption ●Flaring
Surface water and drainage controlsDiversion and collection systems ● ● ● ●Grading ● ● ● ●Capping ● ● ●Revegetation ● ● ● ●
Restoration of contaminated water supplies and sewer linesAlternative central water supplies ● ● ●Alternative point-of-use water supplies ● ● ● ●Treatment of central water supplies ● ● ●Treatment of point-of-use water supplies ● ● ●Replacement of water and sewer lines ● ●Cleaning and restoration of water and sewer lines ● ● ● ●
Rel
ease
fro
m t
anks
con
tain
ing
haza
rdou
s su
bsta
nces
(in
orga
nic)
Smal
l- t
o m
oder
ate-
volu
me
rece
ntga
solin
e or
pet
role
um r
elea
se (
gas
stat
ion
or t
ank
farm
s)
Lar
ge-v
olum
e or
lon
g-te
rm c
hron
icga
solin
e or
pet
role
um r
elea
se (
gas
stat
ion
or t
ank
farm
s)
Rel
ease
fro
m t
anks
con
tain
ing
haza
rdou
s su
bsta
nces
(or
gani
c)
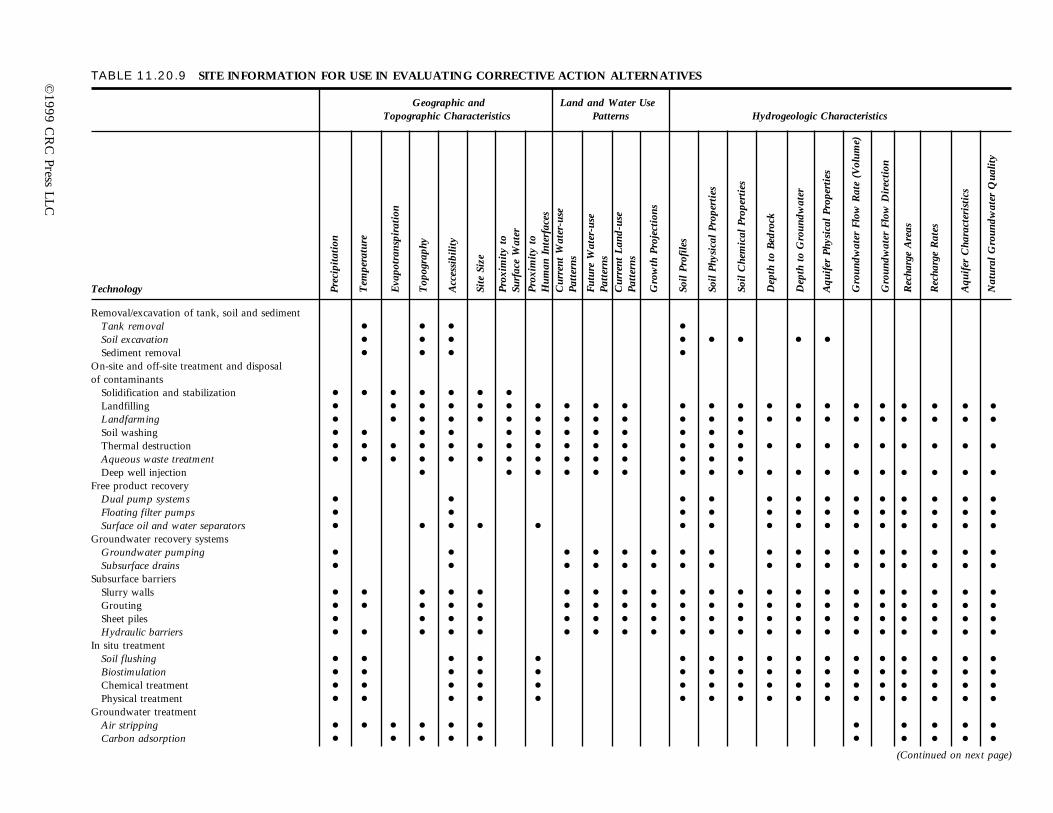
©1999 C
RC
Press LL
C
TABLE 11.20.9 SITE INFORMATION FOR USE IN EVALUATING CORRECTIVE ACTION ALTERNATIVES
Geographic and Land and Water UseTopographic Characteristics Patterns Hydrogeologic Characteristics
Technology
Removal/excavation of tank, soil and sedimentTank removal ● ● ● ●
Soil excavation ● ● ● ● ● ● ● ●
Sediment removal ● ● ● ●
On-site and off-site treatment and disposalof contaminants
Solidification and stabilization ● ● ● ● ● ● ●
Landfilling ● ● ● ● ● ● ● ● ● ● ● ● ● ● ● ● ● ●
Landfarming ● ● ● ● ● ● ● ● ● ● ● ● ● ● ● ● ● ●
Soil washing ● ● ● ● ● ● ● ● ● ● ● ●
Thermal destruction ● ● ● ● ● ● ● ● ● ● ● ● ● ● ● ● ● ● ●
Aqueous waste treatment ● ● ● ● ● ● ● ● ● ● ● ● ● ●
Deep well injection ● ● ● ● ● ● ● ● ● ● ● ● ● ●
Free product recoveryDual pump systems ● ● ● ● ● ● ● ● ●
Floating filter pumps ● ● ● ● ● ● ● ● ●
Surface oil and water separators ● ● ● ● ● ● ● ● ● ● ● ●
Groundwater recovery systemsGroundwater pumping ● ● ● ● ● ● ● ● ● ● ● ● ●
Subsurface drains ● ● ● ● ● ● ● ● ● ● ● ● ●
Subsurface barriersSlurry walls ● ● ● ● ● ● ● ● ● ● ● ● ● ● ● ● ●
Grouting ● ● ● ● ● ● ● ● ● ● ● ● ● ● ● ● ●
Sheet piles ● ● ● ● ● ● ● ● ● ● ● ● ● ● ● ●
Hydraulic barriers ● ● ● ● ● ● ● ● ● ● ● ● ● ● ● ● ●
In situ treatmentSoil flushing ● ● ● ● ● ● ● ● ● ● ● ● ●
Biostimulation ● ● ● ● ● ● ● ● ● ● ● ● ●
Chemical treatment ● ● ● ● ● ● ● ● ● ● ● ● ●
Physical treatment ● ● ● ● ● ● ● ● ● ● ● ● ●
Groundwater treatmentAir stripping ● ● ● ● ● ● ●
Carbon adsorption ● ● ● ● ● ●
● ● ● ●
● ● ● ●
● ● ● ●
● ● ● ●
● ● ● ●
● ● ● ●
● ● ● ●
● ● ● ●
● ● ● ●
● ● ● ●
● ● ● ●
● ● ● ●
● ● ● ●
● ● ● ●
● ● ● ●
● ● ● ●
● ● ● ●
● ● ● ●
● ● ● ●
Prec
ipit
atio
n
Tem
pera
ture
Eva
potr
ansp
irat
ion
Top
ogra
phy
Acc
essi
bilit
y
Site
Siz
e
Prox
imit
y to
Surf
ace
Wat
er
Prox
imit
y to
Hum
an I
nter
face
sC
urre
nt W
ater
-use
Patt
erns
Futu
re W
ater
-use
Patt
erns
Cur
rent
Lan
d-us
ePa
tter
ns
Gro
wth
Pro
ject
ions
Soil
Prof
iles
Soil
Phys
ical
Pro
pert
ies
Soil
Che
mic
al P
rope
rtie
s
Dep
th t
o B
edro
ck
Dep
th t
o G
roun
dwat
er
Aqu
ifer
Phy
sica
l Pr
oper
ties
Gro
undw
ater
Flo
w R
ate
(Vol
ume)
Gro
undw
ater
Flo
w D
irec
tion
Rec
harg
e A
reas
Rec
harg
e R
ates
Aqu
ifer
Cha
ract
eris
tics
Nat
ural
Gro
undw
ater
Qua
lity
(Continued on next page)

©1999 C
RC
Press LL
C
TABLE 11.20.9 (Continued)
Geographic and Land and Water UseTopographic Characteristics Patterns Hydrogeologic Characteristics
Technology
Groundwater treatment cont’d.Biological treatment ● ● ● ● ● ●
Precipitation, flocculation, sedimentation ● ● ● ● ● ●
Dissolved air flotation ● ● ● ● ● ●
Granular media filtration ● ● ● ● ● ●
Ion-exchange resin adsorption ● ● ● ● ● ● ● ● ● ● ●
Oxidation-reduction ● ● ● ● ● ● ● ● ● ● ● ●
Neutralization ● ● ● ● ● ● ● ● ● ● ● ●
Steam stripping ● ● ● ● ● ● ● ● ● ● ● ●
Reverse osmosis ● ● ● ● ● ● ● ● ● ● ● ●
Sludge dewatering ● ● ● ● ● ● ● ● ● ● ● ●
Vapor migration control, collection, andtreatment
Passive collection systems ● ● ● ● ● ● ● ● ● ●
Active collection systems ● ● ● ● ● ● ● ● ● ●
Ventilation of structures ● ● ● ● ● ● ● ● ● ●
Adsorption ● ● ● ● ● ● ● ● ● ●
Flaring ● ● ● ● ● ● ● ● ● ●
Surface water and drainage controlsDiversion and collection systems ● ● ● ● ● ● ● ● ● ● ● ● ●
Grading ● ● ● ● ● ● ● ● ● ● ● ● ●
Capping ● ● ● ● ● ● ● ● ● ● ● ● ●
Revegetation ● ● ● ● ● ● ● ● ● ● ● ● ●
Restoration of contaminated water suppliesand sewer lines
Alternative central water supplies ● ● ● ● ● ● ● ● ● ● ● ● ●
Alternative point-of-use water supplies ● ● ● ● ● ● ● ● ● ● ● ● ●
Treatment of central water supplies ● ● ● ● ● ● ● ● ● ● ● ● ●
Treatment of point-of-use water supplies ● ● ● ● ● ● ● ● ● ● ● ● ●
Replacement of water and sewer lines ● ● ● ● ● ● ● ● ● ●
Cleaning and restoration of water and ● ● ● ● ● ● ● ● ● ●
sewer lines
Note: Technologies in italics are likely to be used in response to UST releases at gasoline stations.
● ● ● ●
● ● ● ●
● ● ● ●
● ● ● ●
● ● ● ●
● ● ● ●
● ● ● ●
● ● ● ●
● ● ● ●
● ● ●
● ● ●
● ● ●
● ● ●
● ●
● ●
● ●
● ●
Prec
ipit
atio
n
Tem
pera
ture
Eva
potr
ansp
irat
ion
Top
ogra
phy
Acc
essi
bilit
y
Site
Siz
e
Prox
imit
y to
Surf
ace
Wat
er
Prox
imit
y to
Hum
an I
nter
face
sC
urre
nt W
ater
-use
Patt
erns
Futu
re W
ater
-use
Patt
erns
Cur
rent
Lan
d-us
ePa
tter
ns
Gro
wth
Pro
ject
ions
Soil
Prof
iles
Soil
Phys
ical
Pro
pert
ies
Soil
Che
mic
al P
rope
rtie
s
Dep
th t
o B
edro
ck
Dep
th t
o G
roun
dwat
er
Aqu
ifer
Phy
sica
l Pr
oper
ties
Gro
undw
ater
Flo
w R
ate
(Vol
ume)
Gro
undw
ater
Flo
w D
irec
tion
Rec
harg
e A
reas
Rec
harg
e R
ates
Aqu
ifer
Cha
ract
eris
tics
Nat
ural
Gro
undw
ater
Qua
lity
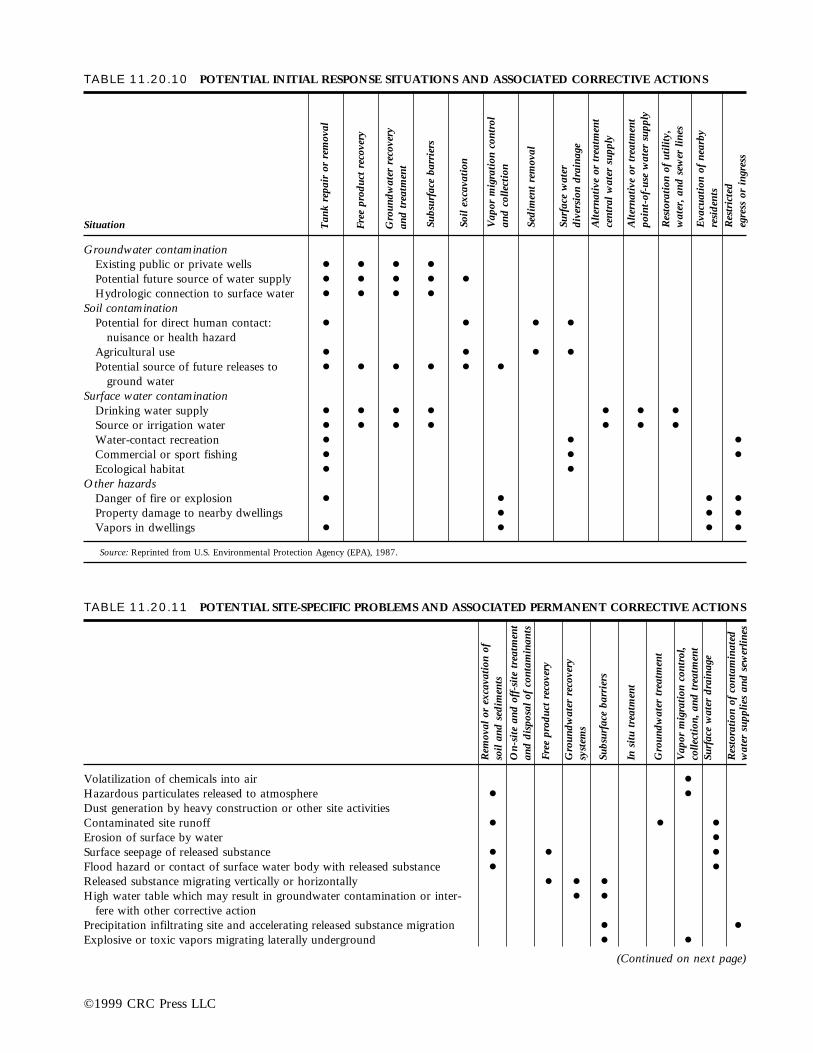
©1999 CRC Press LLC
TABLE 11.20.10 POTENTIAL INITIAL RESPONSE SITUATIONS AND ASSOCIATED CORRECTIVE ACTIONS
Situation
Groundwater contaminationExisting public or private wells ● ● ● ●Potential future source of water supply ● ● ● ● ●Hydrologic connection to surface water ● ● ● ●
Soil contaminationPotential for direct human contact: ● ● ● ●
nuisance or health hazardAgricultural use ● ● ● ●Potential source of future releases to ● ● ● ● ● ●
ground waterSurface water contamination
Drinking water supply ● ● ● ● ● ● ●Source or irrigation water ● ● ● ● ● ● ●Water-contact recreation ● ● ●Commercial or sport fishing ● ● ●Ecological habitat ● ●
Other hazardsDanger of fire or explosion ● ● ● ●Property damage to nearby dwellings ● ● ●Vapors in dwellings ● ● ● ●
Source: Reprinted from U.S. Environmental Protection Agency (EPA), 1987.
Tan
k re
pair
or
rem
oval
Free
pro
duct
rec
over
y
Subs
urfa
ce b
arri
ers
Soil
exca
vati
on
Sedi
men
t re
mov
al
Gro
undw
ater
rec
over
yan
d tr
eatm
ent
Vap
or m
igra
tion
con
trol
and
colle
ctio
n
Surf
ace
wat
erdi
vers
ion
drai
nage
Alte
rnat
ive
or t
reat
men
tce
ntra
l w
ater
sup
ply
Alte
rnat
ive
or t
reat
men
tpo
int-
of-u
se w
ater
sup
ply
Res
tora
tion
of
utili
ty,
wat
er, a
nd s
ewer
lin
es
Eva
cuat
ion
of n
earb
yre
side
nts
Res
tric
ted
egre
ss o
r in
gres
s
TABLE 11.20.11 POTENTIAL SITE-SPECIFIC PROBLEMS AND ASSOCIATED PERMANENT CORRECTIVE ACTIONS
Volatilization of chemicals into air ●Hazardous particulates released to atmosphere ● ●Dust generation by heavy construction or other site activitiesContaminated site runoff ● ● ●Erosion of surface by water ●Surface seepage of released substance ● ● ●Flood hazard or contact of surface water body with released substance ● ●Released substance migrating vertically or horizontally ● ● ●High water table which may result in groundwater contamination or inter- ● ●
fere with other corrective actionPrecipitation infiltrating site and accelerating released substance migration ● ●Explosive or toxic vapors migrating laterally underground ● ●
(Continued on next page)
Rem
oval
or
exca
vati
on o
fso
il an
d se
dim
ents
On-
site
and
off
-sit
e tr
eatm
ent
and
disp
osal
of
cont
amin
ants
Gro
undw
ater
rec
over
ysy
stem
s
Vap
or m
igra
tion
con
trol
,co
llect
ion,
and
tre
atm
ent
Surf
ace
wat
er d
rain
age
Res
tora
tion
of
cont
amin
ated
wat
er s
uppl
ies
and
sew
erlin
es
Free
pro
duct
rec
over
y
Subs
urfa
ce b
arri
ers
In s
itu
trea
tmen
t
Gro
undw
ater
tre
atm
ent

©1999 CRC Press LLC
Radioactivity in the environment provokes public reactionfaster than any other environmental occurrence. The mereword radioactivity evokes fear in most people, even trainedand skilled workers in the field. This fear has been etchedin the public mind by such names as Hiroshima, ThreeMile Island, and Chernobyl. This legacy of fear has madeit difficult for proponents of the usefulness of radioactiv-ity to gain the public trust.
Handling radioactivity in the environment was formerlythe territory of the nuclear engineer. This has changed dra-matically during the past twenty-five years. Today, indi-viduals working in the environmental arena may be re-quired to deal with radiological issues as one part of abroad environmental program. The aim of this section,and the remainder of the chapter, is to help such individ-uals grasp the principles of radioactivity as they pertain toenvironmental engineering.
The following questions must always be answered whenone encounters or suspects the presence of radiation:
• What type and how much radioactive material ispresent?
• How can it be handled safely?• How can it be contained and/or disposed, includ-
ing classification and transportation?
Radioactivity enters the environment from natural andman-made sources. Radioactivity can exist as gaseous, liq-uid or solid materials. Radon is a well-known example ofa radioactive gas. Water often contains dissolved amountsof radium and uranium. Solid radioactive waste is pro-duced from many sources, including the uranium and rareearth mining industries, laboratory and medical facilities,and the nuclear power industry.
The Environmental Protection Agency (EPA) has theauthority to develop federal radiation protection guidelinesfor release of radioactivity into the general environmentand for exposure of workers and the public. The NuclearRegulatory Commission (NRC) and individual states au-thorized by the NRC, called agreement states, see Figure11.21.1, implement the EPA’s general environmental stan-dards through regulations and licensing actions. Thesestandards are usually based on recommendations devel-oped by the International Atomic Energy Agency (IAEA).
Radioactive Waste
11.21PRINCIPLES OF RADIOACTIVITY
TABLE 11.20.11 (Continued)
Contaminated surface water, groundwater, or other aqueous or liquid waste ● ● ● ● ● ●Contaminated soils ● ● ●Toxic and/or explosive vapors that have been collected ●Contaminated stream banks and sediments ● ●Contaminated drinking water distribution system ● ● ● ● ●Contaminated utilities ● ●Free product in groundwater and soils ● ● ● ● ● ● ● ●
Source: Reprinted from U.S. EPA, 1987.
Rem
oval
or
exca
vati
on o
fso
il an
d se
dim
ents
On-
site
and
off
-sit
e tr
eatm
ent
and
disp
osal
of
cont
amin
ants
Gro
undw
ater
rec
over
ysy
stem
s
Vap
or m
igra
tion
con
trol
,co
llect
ion,
and
tre
atm
ent
Surf
ace
wat
er d
rain
age
Res
tora
tion
of
cont
amin
ated
wat
er s
uppl
ies
and
sew
erlin
es
Free
pro
duct
rec
over
y
Subs
urfa
ce b
arri
ers
In s
itu
trea
tmen
t
Gro
undw
ater
tre
atm
ent

©1999 CRC Press LLC
Types of RadioactivityRadioactivity is defined as the property possessed by someelements with spontaneously emitting alpha particles (a),beta particles (b), or sometimes gamma rays (g) by the dis-integration of the nuclei of atoms. It is a naturally occur-ring phenomenon, it can not be stopped, and it has beentaking place since the beginning of time. The process ofunstable nuclei giving off energy to reach a stable condi-tion is called radioactive decay. This process produces nu-clear radiation, and the emitting isotopes are called ra-dionuclides (radio isotopes). All isotopes of elements withatomic numbers larger than 83 (Bismuth) are radioactive.A few elements with lower atomic numbers, such as potas-sium and rubidium, have naturally occurring isotopes thatare also radioactive. The kind of ionizing radiation emit-ted, the amount of energy, and the period of time it takesto become stable differs for each radioactive isotope. Thefollowing three types of radiation can be emitted.
ALPHA PARTICLES
Emitted by many high-atomic-number natural and man-made radioactive elements such as thorium, uranium andplutonium, alpha decay does not lead directly to stable nu-
clei. Intermediate isotopes are first produced, then theseundergo further decay. The relatively high mass of the al-pha particle means that for a given energy, the velocity isrelatively low. The heavy, slow-moving, highly chargedparticles are completely absorbed by a few centimeters ofair. After absorption, they are released to the atmosphereas harmless helium gas.
BETA PARTICLES
Emitted by both high and low atomic weight radioactiveelements, the beta particle is an electron possessing kineticenergy due to the speed with which it is emitted from thenucleus. The velocities of the more energetic betas ap-proach the speed of light. Beta decay is the most commonmode of radioactive decay among artificial and natural ra-dioisotopes. The range of beta particles in air may be morethan a meter for energetic betas, and such particles willpenetrate several meters of aluminum.
GAMMA RAYS
This type of emission consists not of particles but quanta ofenergy, similar to radio-waves, but containing much higherlevels of energy. This emission is a secondary process fol-
FIG. 11.21.1 States with NRC-licenses or agreements for possession of radioactive materials.
AGREEMENT STATES
NRC-LICENSED STATES
TEXAS
OKLAHOMANEW MEXICO
ARIZONA
CALIFORNIA
NEVADA
UTAH
COLORADO
WYOMING
IDAHO
OREGON
KANSAS
NEBRASKA
SOUTH DAKOTA
NORTH DAKOTAMONTANA
WASHINGTON
MINNESOTA
IOWA
MISSOURI
ARKANSAS
LOUISIANA
MISSISSIPPI
ALABAMA GEORGIA
FLORIDA
SOUTHCAROLINA
NORTH CAROLINATENNESSEE
KENTUCKY
ILLINOIS
WISCONSIN
VIRGINIA
WESTVIRGINIA
INDIANA
MICHIGAN
OHIO
PENNSYLVANIA
NEW YORK
D.C.
M.D.DE.
N.J.
CONN.R.I.
MASS.
VT.
N.H.
MAINE
ALASKA
HAWAII

23892U * a
U-238 series
4.51 ¥ 109 y‹)
23490Th * b
24.1 d‹)
23491Pa * b
6.75 h‹)
23492U * a
2.47 ¥ 105 y‹)
23090Th * a
8.0 ¥ 104 y‹)
22688Ra * a
1.60 ¥ 103 y‹)
22286Rn * a
3.82 d ‹)
21884Po * a
3.05 m
21482Pb * b
26.8 m
21483Bi * a
19.7 m
21081Tl * b
1.32 m
21082Pb * b
20.4 y ‹)
21083Bi * a
5.01 d
20681Tl * b
4.19 m
20682Pb
a , 21084Po
138 d
a , 21484Po
1.6 ¥ 10-4 s
|100%
b ,
99.96%
b ,
a , 21885At
2 s
0.04%
b ,
)
)
)
)
)
)
)
)
)
)
)
)
23592U * a
7.1 ¥ 108 y‹)
23190Th * b
25.5 h‹)
23191Pa * a
3.25 ¥ 104 y‹)
22789Ac * a
21.6 y
22387Fr * b
22 m
21584Po * a
21182Pb * b
36.1 m
21183Bi * a
2.16 m
20781Tl * b
4.79 m
20782Pb
a , 21184Po
0.52 s
a , 21585At
10-4 s
99.7%
b ,
5 ¥ 10-4 %
b ,
a , 22790
18.2 d
98.8%
b ,
)
)
)
)
)
)
)
)
)
)
)
)
Th
22388Ra * a
11.4 d‹)
21986Rn * a
4.00 s ‹)
1.78 ¥ 10-3 s
U-235 series
lowing rapidly after certain alpha or beta decay events. Theemission of these particles leaves the nucleus in an unstablestate, and the excess energy is released as gamma radiation.Gamma rays are very penetrating: absorbing materials cannot stop them completely, only reduce their intensity.
Half-Life and Decay of RadioisotopesAll decay processes result from energy changes that even-tually result in the formation of a stable nucleus. For ex-ample, thorium decays to radium, which decays to ac-tinium, which eventually produces non-radioactive lead208. The unstable nucleus releases excess energy by oneor more of these processes according to characteristic rates.All radioisotopes follow the same law of decay: a fixedfraction of the atoms present will decay in a unit of time.That is, for each isotope there is a period of time duringwhich half of the atoms initially present will decay (Table11.21.1). Each radioactive element has a constant speedof decay, so that each element can be characterized by thetime it takes for half of the element to decay. This is calledthe half-life of the element. Some elements decay in sec-onds while others take thousands of years. Since the rateof radioactive decay is not dependent on physical variables
such as temperature or pressure, the half-life of each ra-dioisotope is constant. Specific activity relates the half-lifeof an element to its mass, and is conventionally used tocharacterize radionuclides.
The specific activity (SpA) of a radioisotope is the ac-tivity per gram of the pure radioisotope. The number ofatoms of a pure radioisotope in one gram (N) is given by
N 5 }NA
A} 11.21(1)
where:
NA 5 Avogadro’s number (6.0248 3 1023)/nuclidic massA 5 nuclidic mass
The specific activity (SpA) of a particular radioisotope is:
SpA (disintegration/sec) 5 }0.
T69
1/
3
2 ANA
} 11.21(2)
or
SpA (Ci/gm) 5 }1.12
T8
1/
3
2 A1013
} 11.21(3)
where:
T1/2 5 half-life of the radioisotope in sec.
©1999 CRC Press LLC
23290Th * a
1.41 ¥ 1010 y
22888Ra * b
6.7 y
22889Ac * b
6.13 h
22890Th * a
1.91 y
22488Ra * a
3.64 d
22086Rn * a
55.3 s
‹)
‹)
‹)
‹)
‹)
‹)
21684Po * a
21282Pb * b
10.6 h
21283Bi * a
60.6 m
20681Tl * b
3.10 m
20682Pb
a , 21184Po
a , 21685At
0.14 s
66.3%
b ,
0.014%
b ,
)
)
)
)
)
)
)
)
3 ¥ 10-4 s
3.0 ¥ 10-7 s
Th-232 series
FIG. 11.21.2 Emissions and half-lives of members of radioactive series. (Reprinted, with per-mission, from R.C. Weast, ed. 1978. Handbook of chemistry and physics. CRC Press, Inc.)aThe abbreviations are y, year; d, day; m, minute; and s, second.

©1999 CRC Press LLC
The curie (Ci) is thus the quantity of any radioactivematerial in which the number of disintegrations is 3.7 31010 per second. This is a rather large amount of radio-activity, and smaller quantities are expressed in such unitsas millicuries (1 mCi 5 1023 Ci), microcuries (1 mCi 51026 Ci), and picocuries (1 pCi 5 10212 Ci). Since thecurie is a measure of the emission rate, it is not a satis-factory unit for setting safety standards for handlingradioactive materials.
Radioactivity originates from natural and man-madesources. Man-made radioactive materials produce artifi-cial radioactivity. The radioactivity produced from nuclearfission in a nuclear reactor is a classic example of artifi-cial radioactivity.
Naturally occurring radioisotopes of higher atomicnumber elements belong to chains of successive disinte-grations. The original element, which starts the whole de-cay series, is called the parent. The new elements formedare called daughters, and the whole chain is called a fam-ily. The parent of a natural radioactive series undergoes aseries of disintegrations before reaching its stable form.When a series is in secular equilibrium, one Ci of the par-ent will coexist with one Ci of each of the daughters. Threeseries, the uranium, actinium, and thorium, make up mostof the naturally radioactive elements found in the periodictable (Figure 11.21.2).
—Paul A. Bouis
TABLE 11.21.1 HALF-LIFE AND DECAY MODE OF SELECTED RADIOISOTOPES
Half-Life Type of Half-Life Type ofElement Duration Emission Element Duration Emission
146C 5770 y (b2) 226
88Ra 1590 y (a)137N 10.0 m (b1) 228
88Ra 6.7 y (b2)2411Na 15.0 h (b2) 228
89Ac 6.13 h (b2)3215P 14.3 d (b2) 228
90Th 1.90 y (a)4019K 1.3 3 109 y (b2 or E.C.) 232
90Th 1.39 3 1010 y (a, b2, or S.F.)6027Co 5.2 y (b2) 233
90Th 23 m (b2)8737Rb 4.7 3 1010 y (b2) 234
90Th 24.1 d (b2)9038Sr 28 y (b2) 223
91Pa 27 d (b2)11549In 6 3 1014 y (b2) 233
92U 1.62 3 105 y (a)13153I 8.05 d (b2) 234
92U 2.4 3 105 y (a or S.F.)14258Ce 5 3 1015 y (a) 235
92U 7.3 3 108 y (a or S.F.)19879Au 64.8 h (b2) 238
92U 4.5 3 109 y (a or S.F.)208
81Tl 3.1 m (b2) 23992U 23 m (b2)
21082Pb 21 y (b2) 239
93Np 2.3 d (b2)21282Pb 10.6 h (b2) 239
94Pu 24,360 y (a or S.F.)21482Pb 26.8 m (b2) 240
94Pu 6.58 3 103 y (a or S.F.)20683Bi 6.3 d (b1 or E.C.) 241
94Pu 13 y (a or b2)21083Bi 5.0 d (b2) 241
95Am 458 y (a)212
83Bi 60.5 m (a or b2) 24296Cm 163 d (a or S.F.)
20784Po 5.7 h (a, b1, or E.C.) 243
97Bk 4.5 h (a or E.C.)21084Po 138.4 d (a) 245
98Cf 350 d (a or E.C.)21284Po 3 3 1027 s (a) 253
99Es 20.0 d (a or S.F.)21684Po 0.16 s (a) 254
100Fm 3.24 h (S.F.)21884Po 3.0 m (a or b2) 255
100Fm 22 h (a)21585At 1024 s (a) 256
101Md 1.5 h (E.C.)21885At 1.3 s (a) 254
102No 3 s (a)22086Rn 54.5 s (a) 257
103Lr 8 s (a)22286Rn 3.82 d (a) 263
106(106) 0.9 s (a)22488Ra 3.64 d (a)
Symbol in parentheses indicates type of emission; E.C. 5 K-electron capture, S.F. 5 spontaneous fission; y 5 years, d 5 days, h 5 hours, m 5 minutes, s 5 seconds.

Radioactivity in the environment comes from natural andman-made sources (Figure 11.22.1). Although natural ra-dioactivity is the most likely to be encountered in the en-vironment due to its widespread dispersal, man-made ra-dioactivity poses the greatest environmental risk. Naturalradioactivity harnessed by man and not properly disposedof is also a potential threat to the environment. There arefive basic sources of radioactivity in the environment: thenuclear fuel cycle, mining activities, medical and labora-tory facilities, nuclear weapons testing and seepage fromnatural deposits.
Nuclear Fuel CycleThe nuclear fuel cycle is defined as the activities carriedout to produce energy from nuclear fuel. These activitiesinclude, but are not limited to, mining of uranium-con-taining ores, enrichment of uranium to fuel grade specifi-cations, fabrication and use of fuel rods, and isolation andstorage of waste produced from power plants. The nuclear
fuel cycle is shown in Figure 11.22.2. Note that commer-cial fuel reprocessing, currently practiced in Europe, wasdiscontinued in the United States in 1972 for safety andsecurity reasons. The Department of Energy (DOE), how-ever, does reprocess most of its spent fuels (U.S. DOE1988).
Mining ActivitiesMining, processing, and the use of coal, natural gas, phos-phate rock, and rare earth deposits result in the concen-tration and release or disposal of large amounts oflow–level radioactive material (UNSCEAR 1977).Coal–fired power plants release as much radioactivity(radon) to the environment as nuclear facilities, and thefly ash residue contains low levels of several natural ra-dioisotopes. Natural gas is one of many radon sources inthe environment. Phosphate rock always has associatednatural radioisotopes; in many cases, tailings from phos-phate operations have levels above those allowed by the
©1999 CRC Press LLC
11.22SOURCES OF RADIOACTIVITY IN THEENVIRONMENT
��������������������������������������
Natural element that has at least one radioisotope other than stable isotopes
Natural element with only radioactive isotopes
Artificial element
1A1IA
2A2IIA
1
H
19
K
20
Ca
11
Na
12
Mg
3
Li
4
Be
21
Sc
22
Ti
23
V
24
Cr
25
Mn
26
Fe
27
Co
28
Ni
29
Cu
30
Zn
31
Ga
32
Ge
33
As
34
Se
35
Br
36
Kr
13
Al
14
Si
15
P
16
S
17
Cl
18
Ar
5
B
6
C
7
N
8
O
9
F
10
Ne
2
He
37
Rb
38
Sr
39
Y
40
Zr
41
Nb
42
Mo
43
Tc
44
Ru
45
Rh
46
Pd
47
Ag
48
Cd
49
In
50
Sn
51
Sb
52
Te
53
I
54
Xe
55
Cs
56
Ba
57
La*
72
Hf
73
Ta
74
W
75
Re
76
Os
77
Ir
78
Pt
79
Au
80
Hg
81
Tl
82
Pb
83
Bi
84
Po
85
At
86
Rn
58
Ce
59
Pr
60
Nd
61
Pm
62
Sm
63
Eu
64
Gd
65
Tb
66
Dy
67
Ho
68
Er
69
Tm
70
Yb
71
Lu
90
Th
91
Pa
92
U
93
Np
94
Pu
95
Am
96
Cm
97
Bk
98
Cf
99
Es
100
Fm
101
Md
102
No
103
Lr
87
Fr
88
Ra
89
Ac**
104
Ku
105
Ha(Ns)
106 107
Rf
108
Hs
109
Mt
3A3IIIB
4A4IVB
5A5VB
6A6VIB
7A7VIIB
88VIII
89VIII
810VIII
1B11IB
2B12IIB
3B13IIIA
4B14IVA
5B15VA
6B16VIA
7B17VIIA
018VIIIA
*Lanthanides
**Actinides
FIG. 11.22.1 Periodic table showing different types of radioisotopes.
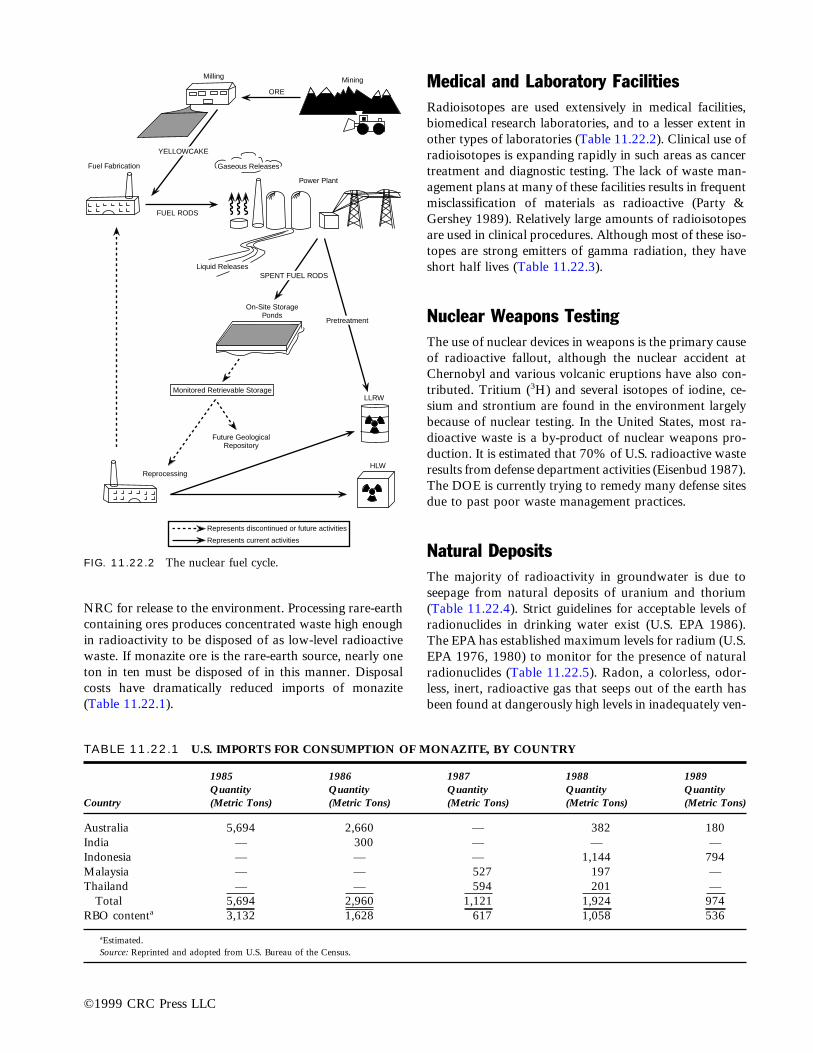
NRC for release to the environment. Processing rare-earthcontaining ores produces concentrated waste high enoughin radioactivity to be disposed of as low-level radioactivewaste. If monazite ore is the rare-earth source, nearly oneton in ten must be disposed of in this manner. Disposalcosts have dramatically reduced imports of monazite(Table 11.22.1).
Medical and Laboratory FacilitiesRadioisotopes are used extensively in medical facilities,biomedical research laboratories, and to a lesser extent inother types of laboratories (Table 11.22.2). Clinical use ofradioisotopes is expanding rapidly in such areas as cancertreatment and diagnostic testing. The lack of waste man-agement plans at many of these facilities results in frequentmisclassification of materials as radioactive (Party &Gershey 1989). Relatively large amounts of radioisotopesare used in clinical procedures. Although most of these iso-topes are strong emitters of gamma radiation, they haveshort half lives (Table 11.22.3).
Nuclear Weapons TestingThe use of nuclear devices in weapons is the primary causeof radioactive fallout, although the nuclear accident atChernobyl and various volcanic eruptions have also con-tributed. Tritium (3H) and several isotopes of iodine, ce-sium and strontium are found in the environment largelybecause of nuclear testing. In the United States, most ra-dioactive waste is a by-product of nuclear weapons pro-duction. It is estimated that 70% of U.S. radioactive wasteresults from defense department activities (Eisenbud 1987).The DOE is currently trying to remedy many defense sitesdue to past poor waste management practices.
Natural DepositsThe majority of radioactivity in groundwater is due toseepage from natural deposits of uranium and thorium(Table 11.22.4). Strict guidelines for acceptable levels ofradionuclides in drinking water exist (U.S. EPA 1986).The EPA has established maximum levels for radium (U.S.EPA 1976, 1980) to monitor for the presence of naturalradionuclides (Table 11.22.5). Radon, a colorless, odor-less, inert, radioactive gas that seeps out of the earth hasbeen found at dangerously high levels in inadequately ven-
©1999 CRC Press LLC
FIG. 11.22.2 The nuclear fuel cycle.
Monitored Retrievable Storage
Reprocessing
Future GeologicalRepository
LLRW
HLW
Pretreatment
On-Site StoragePonds
SPENT FUEL RODSLiquid Releases
FUEL RODS
Fuel Fabrication
YELLOWCAKE
Milling
ORE
Mining
Power Plant
Gaseous Releases
Represents discontinued or future activities
Represents current activities
TABLE 11.22.1 U.S. IMPORTS FOR CONSUMPTION OF MONAZITE, BY COUNTRY
1985 1986 1987 1988 1989Quantity Quantity Quantity Quantity Quantity
Country (Metric Tons) (Metric Tons) (Metric Tons) (Metric Tons) (Metric Tons)
Australia 5,694 2,660 — 382 180India — 300 — — —Indonesia — — — 1,144 794Malaysia — — 527 197 —Thailand — — 594 201 —
Total 5,694 2,960 1,121 1,924 974RBO contenta 3,132 1,628 617 1,058 536
aEstimated.Source: Reprinted and adopted from U.S. Bureau of the Census.

©1999 CRC Press LLC
TABLE 11.22.2 RADIOISOTOPES ENCOUNTERED IN LABORATORIES
Elementand Atomic Mass Gamma Radiation Energy
Half-Life Symbol Number Number (MeV)
88 days Sulfur (S) 16 35 none115 days Tantalum (Ta) 73 182 0.068, .10, .15, .22, 1.12,
1.19, 1.22120 days Selenium (Se) 34 75 0.12, .14, .26, .28, .40130 days Thulium (Tm) 69 170 0.084138 days Polonium (Po) 84 210 0.80165 days Calcium (Ca) 20 45 none245 days Zinc (Zn) 30 65 1.12270 days Cobalt (Co) 27 57 0.12, .13253 days Silver (Ag) 47 110 0.66, .68, .71, .76, .81,
.89, .94, 1.39284 days Cerium (Ce) 58 144 0.08, .134303 days Manganese (Mn) 25 54 0.84367 days Ruthenium (Ru) 44 106 none1.81 yr Europium (Eu) 63 155 0.09, .112.05 yr Cesium (Cs) 55 134 0.57, .60, .792.6 yr Promethium (Pm) 61 147 none2.6 yr Sodium (Na) 11 22 1.2772.7 yr Antimony (Sb) 51 125 0.18, .43, .46, .60, .642.6 yr Iron (Fe) 26 55 none3.8 yr Thallium (Tl) 81 204 none5.27 yr Cobalt (Co) 27 60 1.3, 1.1211.46 yr Hydrogen (H) 1 3 none12 yr Europium (Eu) 63 152 0.12, .24, .34, .78, .96, 1.09,
1.11, 1.4116 yr Europium (Eu) 63 154 0.123, .23, .59, .72, .87, 1.00,
1.2828.1 yr Strontium (Sr) 38 90 none21 yr Lead (Pb) 82 210 0.04730 yr Cesium (Cs) 55 137 0.66192 yr Nickel (Ni) 28 63 none1602 yr Radium (Ra) 88 226 0.1865730 yr Carbon (C) 6 14 none2.12 3 105 yr Technetium (Tc) 43 99 none3.1 3 105 yr Chlorine (Cl) 17 36 none
Source: Reprinted, from U.S. Department of Health, Education and Welfare (HEW), 1970, Radiological health handbook, rev. ed. (HEW, Rockville, Md., [January]).
TABLE 11.22.3 PRINCIPAL CLINICALLY ADMINISTERED RADIOISOTOPES
TypicalDose Number of Total % of
Radionuclide Principal Uses Half-life (mCi) Procedurea Curies Total
99mTc Organ imaging 6.0 hr 4–25 8,040,000 116,580 96.1309Tl Myocardial & 74.0 hr 2 960,000 1,920 2.1
parathyroidimaging
Ga Tumor/infection 78.1 hr 5 600,000 3,000 2.1diagnosis
I Thyroid imaging 8.1 days 0.1 960,000 96 ,0.1Total 10,560,000 121,596 100.1
aAnnual number of procedures in the United States.
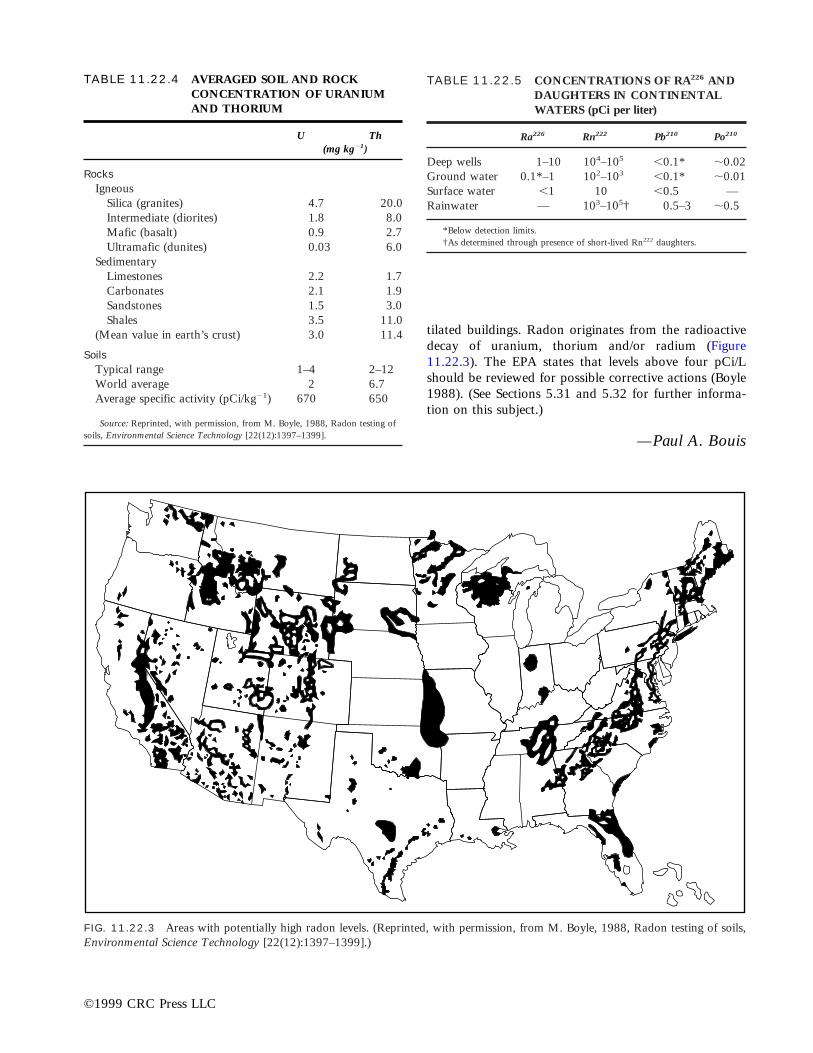
©1999 CRC Press LLC
tilated buildings. Radon originates from the radioactivedecay of uranium, thorium and/or radium (Figure11.22.3). The EPA states that levels above four pCi/Lshould be reviewed for possible corrective actions (Boyle1988). (See Sections 5.31 and 5.32 for further informa-tion on this subject.)
—Paul A. Bouis
TABLE 11.22.4 AVERAGED SOIL AND ROCKCONCENTRATION OF URANIUMAND THORIUM
U Th(mg kg21)
RocksIgneous
Silica (granites) 4.7 20.0Intermediate (diorites) 1.8 8.0Mafic (basalt) 0.9 2.7Ultramafic (dunites) 0.03 6.0
SedimentaryLimestones 2.2 1.7Carbonates 2.1 1.9Sandstones 1.5 3.0Shales 3.5 11.0
(Mean value in earth’s crust) 3.0 11.4
SoilsTypical range 1–4 2–12World average 2 6.7Average specific activity (pCi/kg21) 670 650
Source: Reprinted, with permission, from M. Boyle, 1988, Radon testing ofsoils, Environmental Science Technology [22(12):1397–1399].
TABLE 11.22.5 CONCENTRATIONS OF RA226 ANDDAUGHTERS IN CONTINENTALWATERS (pCi per liter)
Ra226 Rn222 Pb210 Po210
Deep wells 1–10 104–105 ,0.1* ,0.02Ground water 0.1*–1 102–103 ,0.1* ,0.01Surface water ,1 10 ,0.5 —Rainwater — 103–105† 0.5–3 ,0.5
*Below detection limits.†As determined through presence of short-lived Rn222 daughters.
FIG. 11.22.3 Areas with potentially high radon levels. (Reprinted, with permission, from M. Boyle, 1988, Radon testing of soils,Environmental Science Technology [22(12):1397–1399].)

ReferencesBoyle, M. 1988. Radon testing of soils, Environmental Science
Technology, 22(12):1397–1399.Eisenbud, M.E. 1987. Environmental radioactivity from natural, indus-
trial, and military sources. 3rd ed. Orlando, Fla.: Academic Press.Party, E.A., and E.L. Gershey. 1989. Recommendations for radioactive
waste reduction in biomedical/academic institutions. Health Physics56(4):571–572.
U.S. Department of Energy (DOE). 1988. Database for 1988: spent fueland radioactive waste inventories, projections, and characteristics.DOE/RW–0006, Rev. 4. Washington, D.C.
United Nations Scientific Committee on the Effects of Atomic Radiation(UNSCEAR). 1977. Sources and effects of ionizing radiation. NewYork, N.Y.
U.S. Environmental Protection Agency (EPA). 1976. Drinking water reg-ulations, radionuclides. Federal Register 41:28402.
———. 1980. Prescribed procedures of measurement of radioactivity indrinking water. EPA 600–4–80–032.
———. 1986. Water pollution control: radionuclides: advance notice ofproposed rulemaking. 40 CFR Part 141, 34836: Federal Register51:189.
©1999 CRC Press LLC
11.23SAFETY STANDARDS
Radioactivity presents special hazards because it cannot bedetected by the normal human senses. Strict safety stan-dards have been established by international organizationsto ensure that exposure to workers is minimized and thatthe public is not exposed to radiation from other than thenatural background (ICRP 1979; NCRPM 1959,1987a,b). This background radiation, from naturally oc-curring radioisotopes and cosmic rays, is the base expo-sure level, and cannot be practically reduced.
All types of radiation share the property of losing en-ergy by absorption in passing through matter. The degreeof absorption depends upon the type of radiation, but alltypes are absorbed to some extent (Figure 11.23.1). Theprocess of absorption always results in ionization. Thisprocess of stripping electrons from atoms causes damageto human tissues. It also allows for the design of instru-ments for detection and measurement of radioactivity. The
properties of the various radiations determine the protec-tive measures needed and the methods of measurement.Three types of radiation exist.
Alpha Radiation: Radiation from alpha particles loses en-ergy very quickly when passing through matter. As aresult, alpha radiation travels only a few inches in airand can easily be stopped by the outer layer of humanskin. Alpha radiation sources are most harmful to hu-mans if they are ingested. Alpha radiation can be verydamaging to body organs, especially the lungs if the al-pha source is inhaled as fine particles (BEIR 1988).
Beta Radiation: Radiation produced by beta particles trav-els much farther in air than alpha radiation, and canpenetrate several layers of human skin. The humanbody can be damaged by being near a source of betaradiation for a long period of time or by ingesting asource of beta radiation. Beta radiation can be stoppedby absorbing materials.
Gamma Radiation: Gamma radiation travels great dis-tances and easily penetrates matter. It can pass com-pletely through the human body, damaging cells enroute, or be absorbed by tissue and bone. Three feet ofconcrete or two inches of lead are required to stop 90%of typical gamma radiation. Excessive external gammaradiation can cause serious internal damage to the hu-man body, but cannot induce radioactivity in it.
The biological effect of radiation is measured in units calledrems. A rem is the amount of beta/gamma radiation thattransfers a specific quantity of energy to a kilogram of mat-ter. A single exposure to 300 rems would result in deathwithin thirty days for 50% of the persons exposed. Theunit of dose is difficult to put into perspective, however,a comparison of the allowable doses helps. The permissi-
Beta Radiation
Gamma Radiation
RadiationSource
Alpha RadiationStopped
By a Sheetof Paper
Stoppedby About
Inch of Aluminum
Stopped by Several Inches of Lead
12
FIG. 11.23.1 Relative penetrating power of alpha, beta, andgamma radiation.

ble level for occupational radiation exposure is five remsper year to the whole body. It is believed that this levelcan be absorbed for a working lifetime without any signof biological damage. Background radiation is measuredin millirems (0.001 rem).
The average person is exposed to ionizing radiationfrom many sources. The environment, and even the hu-man body, contains naturally occurring radioactive mate-rials. Cosmic radiation contributes additional exposure.The use of x-rays and radioisotopes in medicine and den-
tistry adds to the public exposure. Table 11.23.1 showsthe estimated average individual exposure in milliremsfrom natural background and other sources.
Protection from ExposureMaximum permissible levels of external and internal ra-diation (Table 11.23.2) have been set by the NationalCouncil on Radiation Protection (NCRP) and by theInternational Commission on Radiological Protection(ICRP). In addition, the practice of keeping exposures AsLow As Reasonably Achievable (NRC 1976) is recom-mended by these and many other organizations. Thismeans that every activity involving exposure to radiationshould be planned to minimize unnecessary exposure toworkers and the public. For further explanations of radi-ation protection the reader is referred to the many refer-ences available (Henry 1969, Olishifski 1981, Schapiro1981).
Basic Radiation SafetySafety practices for handling radioactive materials areaimed at protecting individuals from external and internalhazards.
©1999 CRC Press LLC
TABLE 11.23.1 U.S. GENERAL POPULATIONEXPOSURE ESTIMATES
Average Individual DoseSource mrem/yr
Natural Background 100Mining Releases 5Medical 90Nuclear Fallout 7Nuclear Energy 0.3Consumer Products 0.03Total <200
TABLE 11.23.2 MAXIMUM PERMISSIBLE DOSE EQUIVALENT FOR OCCUPATIONAL EXPOSURE
Combined whole body occupational exposureProspective annual limit 5 rems in any one yearRetrospective annual limit 10–15 rems in any one yearLong-term accumulation (N–18) 3 5 rems, where N is age in years
Skin 15 rems in any one yearHands 75 rems in any one year (25/qtr)Forearms 30 rems in any one year (10/qtr)Other organs, tissues and organ systems 15 rems in any one year (5/qtr)Fertile women (with respect to fetus) 0.5 rem in gestation periodDose limits for the public, or
occasionally exposed individuals:Individual or occasional 0.5 rem in any one yearStudents 0.1 rem in any one year
Population dose limitsGenetic 0.17 rem average per yearSomatic 0.17 rem average per year
Emergency dose limits—Life saving:Individual (older than 45, if possible) 100 remsHands and forearms 200 rems, additional (300 rems, total)
Emergency dose limits—Less urgent:Individual 25 remsHands and forearms 100 rems, total
Family of radioactive patients:Individual (under age 45) 0.5 rems in any one yearIndividual (over age 45) 5 rems in any one year
Reprinted from National Committee on Radiation Protection (NCRP), 1975, Review of the current state of radiation protection philosophy. NCRP PublicationNo. 43.
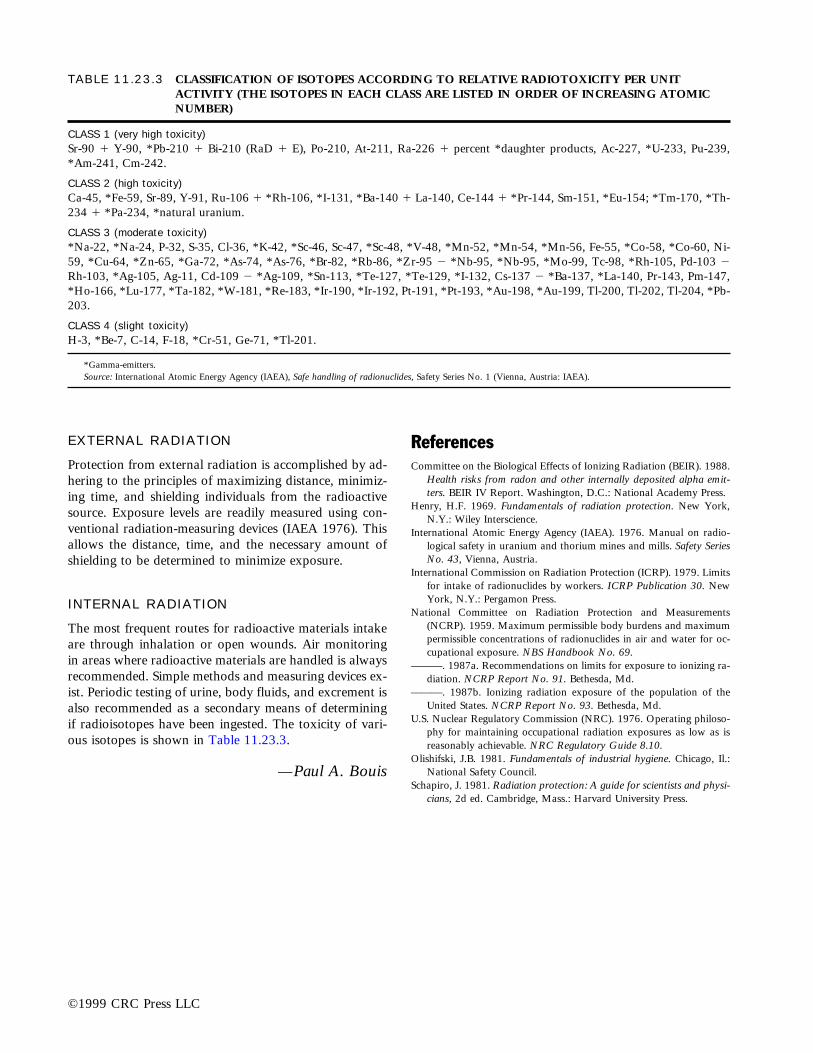
EXTERNAL RADIATION
Protection from external radiation is accomplished by ad-hering to the principles of maximizing distance, minimiz-ing time, and shielding individuals from the radioactivesource. Exposure levels are readily measured using con-ventional radiation-measuring devices (IAEA 1976). Thisallows the distance, time, and the necessary amount ofshielding to be determined to minimize exposure.
INTERNAL RADIATION
The most frequent routes for radioactive materials intakeare through inhalation or open wounds. Air monitoringin areas where radioactive materials are handled is alwaysrecommended. Simple methods and measuring devices ex-ist. Periodic testing of urine, body fluids, and excrement isalso recommended as a secondary means of determiningif radioisotopes have been ingested. The toxicity of vari-ous isotopes is shown in Table 11.23.3.
—Paul A. Bouis
ReferencesCommittee on the Biological Effects of Ionizing Radiation (BEIR). 1988.
Health risks from radon and other internally deposited alpha emit-ters. BEIR IV Report. Washington, D.C.: National Academy Press.
Henry, H.F. 1969. Fundamentals of radiation protection. New York,N.Y.: Wiley Interscience.
International Atomic Energy Agency (IAEA). 1976. Manual on radio-logical safety in uranium and thorium mines and mills. Safety SeriesNo. 43, Vienna, Austria.
International Commission on Radiation Protection (ICRP). 1979. Limitsfor intake of radionuclides by workers. ICRP Publication 30. NewYork, N.Y.: Pergamon Press.
National Committee on Radiation Protection and Measurements(NCRP). 1959. Maximum permissible body burdens and maximumpermissible concentrations of radionuclides in air and water for oc-cupational exposure. NBS Handbook No. 69.
———. 1987a. Recommendations on limits for exposure to ionizing ra-diation. NCRP Report No. 91. Bethesda, Md.
———. 1987b. Ionizing radiation exposure of the population of theUnited States. NCRP Report No. 93. Bethesda, Md.
U.S. Nuclear Regulatory Commission (NRC). 1976. Operating philoso-phy for maintaining occupational radiation exposures as low as isreasonably achievable. NRC Regulatory Guide 8.10.
Olishifski, J.B. 1981. Fundamentals of industrial hygiene. Chicago, Il.:National Safety Council.
Schapiro, J. 1981. Radiation protection: A guide for scientists and physi-cians, 2d ed. Cambridge, Mass.: Harvard University Press.
©1999 CRC Press LLC
TABLE 11.23.3 CLASSIFICATION OF ISOTOPES ACCORDING TO RELATIVE RADIOTOXICITY PER UNITACTIVITY (THE ISOTOPES IN EACH CLASS ARE LISTED IN ORDER OF INCREASING ATOMICNUMBER)
CLASS 1 (very high toxicity)Sr-90 1 Y-90, *Pb-210 1 Bi-210 (RaD 1 E), Po-210, At-211, Ra-226 1 percent *daughter products, Ac-227, *U-233, Pu-239,*Am-241, Cm-242.
CLASS 2 (high toxicity)Ca-45, *Fe-59, Sr-89, Y-91, Ru-106 1 *Rh-106, *I-131, *Ba-140 1 La-140, Ce-144 1 *Pr-144, Sm-151, *Eu-154; *Tm-170, *Th-234 1 *Pa-234, *natural uranium.
CLASS 3 (moderate toxicity)*Na-22, *Na-24, P-32, S-35, Cl-36, *K-42, *Sc-46, Sc-47, *Sc-48, *V-48, *Mn-52, *Mn-54, *Mn-56, Fe-55, *Co-58, *Co-60, Ni-59, *Cu-64, *Zn-65, *Ga-72, *As-74, *As-76, *Br-82, *Rb-86, *Zr-95 2 *Nb-95, *Nb-95, *Mo-99, Tc-98, *Rh-105, Pd-103 2Rh-103, *Ag-105, Ag-11, Cd-109 2 *Ag-109, *Sn-113, *Te-127, *Te-129, *I-132, Cs-137 2 *Ba-137, *La-140, Pr-143, Pm-147,*Ho-166, *Lu-177, *Ta-182, *W-181, *Re-183, *Ir-190, *Ir-192, Pt-191, *Pt-193, *Au-198, *Au-199, Tl-200, Tl-202, Tl-204, *Pb-203.
CLASS 4 (slight toxicity)H-3, *Be-7, C-14, F-18, *Cr-51, Ge-71, *Tl-201.
*Gamma-emitters.Source: International Atomic Energy Agency (IAEA), Safe handling of radionuclides, Safety Series No. 1 (Vienna, Austria: IAEA).

FEATURE SUMMARY
Types of Measurement: A. Radiation surveys; B. Personnel moni-toring; C. Radiological analysis
Types of Detection: A. Film and thermoluminescent; B. Gas filleddevices; C. Scintillation counters; D. Gamma-ray spectrometers
Range: A. Personnel monitoring, millirems to rems; B. Radiologicalanalysis, picocuries to curies
Approximate Cost: A. Personnel monitoring, $500 to $100,000,Typical—$1000 to $10,000 for basic monitoring capabilities; B.Radiological analysis, $3,000 to $100,000, Typical—$15,000 forbasic analytical capabilities, $50,000 with gamma ray capabilities
PARTIAL LIST OF SUPPLIERS
A. Survey and personnel monitoring: Amersham Corp.; DosimeterCorp.; Eberline Instrument Corp.; Edmund Scientific Co.; EG&GOrtec/EG&G Berthold; Health Physics Instruments; KeithleyInstruments, Inc.; Lab Safety Supply, Inc.; Ludlum Measurements,Inc.; Oxford Instruments, Inc.; Radiation Monitoring Devices, Inc.;TN Technologies, Inc.
B. Radiological Analysis: Canberra Industries, Inc.; EG&GOrtec/EG&G Berthold; Health Physics Instruments; OxfordInstruments, Inc.; PGC Scientific Corp.; Premier AmericanTechnologies, Corp.; Princeton Gamma-Tech, Inc.; TeledyneIsotopes
Detection and quantification of radioactivity is critical topersonnel and environmental safety, since radioactivitycannot be detected by the human senses. Devices to mea-sure the dose of radiation received, and the amount of theradionuclide present are available. In spite of this, thereare few qualified commercial enterprises that handle radi-ological monitoring or analysis. Most radiological exper-tise is confined to government or industrial institutionswhose primary responsibility or business involves ra-dioactive materials. Some general-purpose radiological ser-vices are provided by individual state laboratories.
Radiation MonitoringRadiation measurement for the purpose of protection fromexposure requires proper measuring devices and propermeasurement techniques. Equipment and units of measurefor health protection are designed in terms of absorbed ra-diation dose. This absorbed dose is defined as the energyimparted to matter by ionizing radiation per unit mass ofirradiated material at a given location. This unit of ab-
sorbed dose is called a rad. The dose equivalent is a quan-tity used in radiation protection to express all radiationexposure on a common scale. The unit of dose equivalentis the rem. Rads of g and b radiation are normally equiv-alent to rems, and are used interchangeably. The sievert(Sv) is the equivalent SI unit and is equal to 100 rems.
Radiation doses can be measured using survey meterswhen instantaneous dose readings of a particular area arerequired, or by badges or dosimeters for longer-term mea-surements. Radiation surveys will often measure dosesfrom the source, surface contamination (using wipe sam-ples), and airborne contaminants.
SURVEY INSTRUMENTS
Geiger Mueller Counter
This meter is able to measure all ionizing radiation and istherefore used for area surveys. However, it uses a gas-filled detector; it cannot identify the specific source of ra-dioactivity; it has a poor efficiency for gamma radiation;and it can easily be overloaded.
Ionization Chamber
Portable versions of this chamber are used routinely in ra-diation protection surveys. These detectors give a direct in-dication of the exposure rate to gamma rays. In manycases, the detectors have a thin window and a removableshield allowing measurement of high energy alpha and betaparticles.
Scintillation Counter
This flat probe is used extensively for surface contamina-tion surveys (IAEA 1976). It uses a ZnS (Ag) scintillatorwhich only responds to alpha particles. NOTE: the alu-minized plastic film window is susceptible to pinhole leaks.
Film Badges
Used to monitor worker exposure to ionizing radiation,the film badge is a photographic film packet used to mea-sure approximate long-term exposure. It is usually readmonthly or quarterly. The badge may contain two or morefilms of differing sensitivity, and it may contain filters thatshield part of the film from certain types of radiation.
©1999 CRC Press LLC
11.24DETECTION AND ANALYSIS

Thermoluminescent Dosimeter (TLD)
This is the primary method used for long term radiationmonitoring. These devices can be configured as finger orbody badges. The TLD badge is usually made of lithiumfluoride, which is capable of storing absorbed ionizing ra-diation, then releasing this energy in the form of visiblelight when heated. The amount of light released is then re-lated to the amount of radiation exposure. The TLD isrugged in design, and is independent of absorption energyfor gamma radiation.
DEVICE CALIBRATION
Periodic calibration of survey instruments and dosimeterreaders must be done by qualified experts. Check standards,consisting of encapsulated known quantities of radioiso-topes, are commercially available and should be used dailyto check that these devices are in proper working order.
Radioactivity AnalysisDetection, identification, and quantification of the specificradionuclide responsible for the presence of ionizing radi-ation is very often required. Identification of the radionu-clide facilitates the design of systems to safely and eco-nomically handle radioactive materials. Many differenttypes of instruments, ranging in price from several thou-sand to several hundred thousand dollars, are available.Field measuring devices are often used to detect and ap-proximate the amount of radiation present. Identificationand quantification is usually performed in a controlled lab-oratory area, equipped to minimize background interferenceand gross contamination, and to ensure personnel safety.
Radiological analysis must be done using good labora-tory practices and sound scientific judgement (Knoll 1989).Many measurements are done at extremely low levels(NCRP 1976), and poor laboratory technique often leadsto erroneous conclusions (NCRP 1978). The laboratoryarea dedicated to radiological analysis is often called thecounting room. The gross alpha-beta measurement is themost frequently run analysis. This relatively inexpensiveanalysis screens samples to determine if more elaborateanalysis for specific radionuclides is required. Specific ra-dionuclide analyses are usually done if dose estimates aredesired, if long-term trends are being established, or if reg-ulatory requirements are mandated. Analyses of specificradionuclides are usually more expensive and requiregreater expertise to interpret the results. These analyses arebased on accurately measuring the half-life or the energyof the radiation emitted. Chemicals are often separatedprior to instrumental analysis to eliminate potential inter-ferences or to concentrate the radionuclide of interest.Gamma-emitting materials can be identified and quanti-fied quickly with little or no sample preparation by usinggamma ray spectroscopy.
A sample representing the area or situation under analy-sis must be obtained. Survey instruments can be effectivein obtaining a proper sample. Liquid and solid samples arevery amenable to analysis by gamma ray spectroscopy. Airsamples can be collected using continuous samplers. Air-grab samples can be taken directly into evacuated scintil-lation cells if alpha emitters are being monitored.
ANALYTICAL COUNTING INSTRUMENTS
Proportional Counters
These instruments, mid-range in price, are most frequentlyused for gross alpha/beta testing. They are gas-filled de-tectors that operate on the principle that gas ionization byradiation can, with the proper circuitry, produce an elec-trical signal proportional to the amount of radiation thatcaused the ionization. P-10 gas, a methane-containing mix-ture, is used as the counting gas. Three types of countersare routinely used: internal, end window, and thin win-dow. Internal counters are especially suited for low-levelenvironmental samples (Greenberg, Clesceri & Eaton1992). End window and thin window counters are moresuitable for moderate to high level radioactivity samples.These are easier to maintain and less prone to contami-nation than internal counters. All proportional countersrequire a calibration curve be run to quantify results(Figure 11.24.1).
Scintillation Counter
In this counter, light flashes produced in a scintillator (ZnS[Ag]) by ionizing radiation are converted into electricalpulses by a photo-multiplier tube. The scintillation counteris especially suited for the analysis of alpha-emitting
©1999 CRC Press LLC
Plateau Source: Beta, Alpha
(a) (b)
Plateau Source: 1 Beta
Bet
aP
late
au
Bet
a T
hres
hold
AlphaOperating Voltage
Alp
haP
late
au Alpha-BetaOperatingVoltage
Alp
ha-B
eta
Pla
teau
Alp
ha T
hres
hold
Cou
ntin
g R
ate
Voltage Applied to Anode
12
12
FIG. 11.24.1 Calibration curve-counting rate vs. anode volt-age curve for internal proportional counter with P-10 gas.
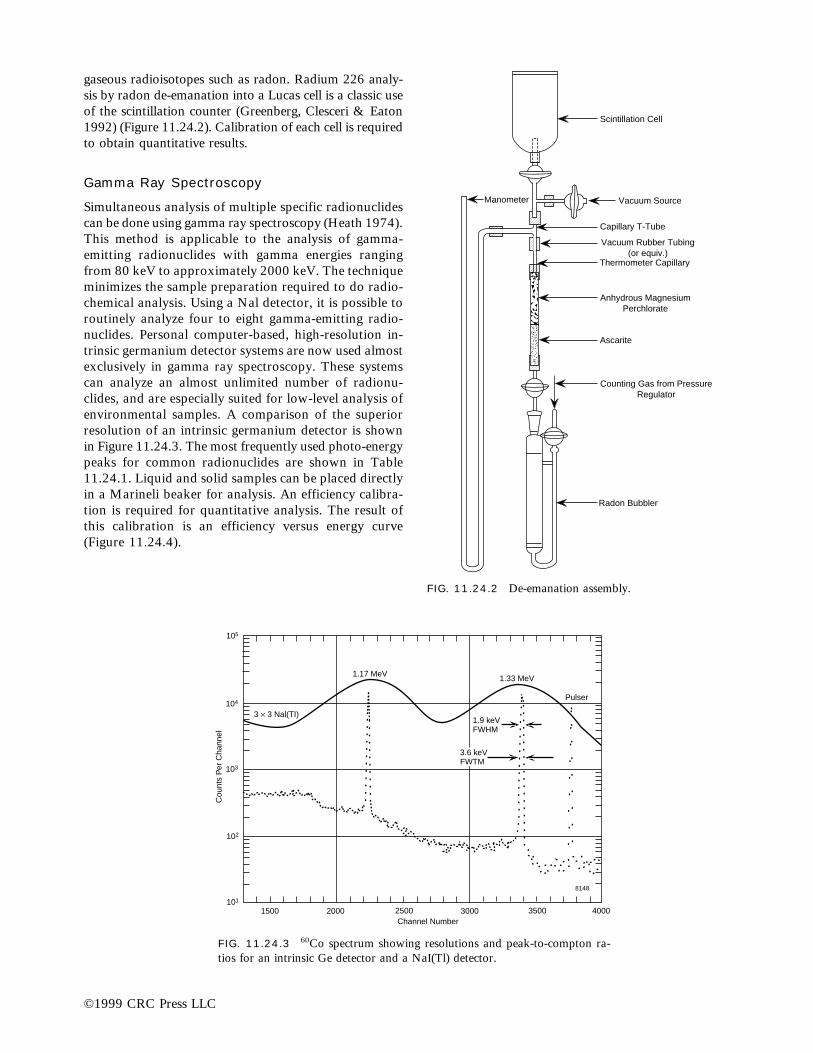
©1999 CRC Press LLC
gaseous radioisotopes such as radon. Radium 226 analy-sis by radon de-emanation into a Lucas cell is a classic useof the scintillation counter (Greenberg, Clesceri & Eaton1992) (Figure 11.24.2). Calibration of each cell is requiredto obtain quantitative results.
Gamma Ray Spectroscopy
Simultaneous analysis of multiple specific radionuclidescan be done using gamma ray spectroscopy (Heath 1974).This method is applicable to the analysis of gamma-emitting radionuclides with gamma energies rangingfrom 80 keV to approximately 2000 keV. The techniqueminimizes the sample preparation required to do radio-chemical analysis. Using a Nal detector, it is possible toroutinely analyze four to eight gamma-emitting radio-nuclides. Personal computer-based, high-resolution in-trinsic germanium detector systems are now used almostexclusively in gamma ray spectroscopy. These systemscan analyze an almost unlimited number of radionu-clides, and are especially suited for low-level analysis ofenvironmental samples. A comparison of the superiorresolution of an intrinsic germanium detector is shownin Figure 11.24.3. The most frequently used photo-energypeaks for common radionuclides are shown in Table11.24.1. Liquid and solid samples can be placed directlyin a Marineli beaker for analysis. An efficiency calibra-tion is required for quantitative analysis. The result ofthis calibration is an efficiency versus energy curve(Figure 11.24.4).
��
����
�
�������
Scintillation Cell
Vacuum SourceManometer
Capillary T-Tube
Vacuum Rubber Tubing(or equiv.)
Thermometer Capillary
Anhydrous MagnesiumPerchlorate
Ascarite
Counting Gas from PressureRegulator
Radon Bubbler
FIG. 11.24.2 De-emanation assembly.
1500 2000 2500 3000 3500 4000101
102
103
104
105
Channel Number
Cou
nts
Per
Cha
nnel
3 ´ 3 Nal(TI)
1.17 MeV 1.33 MeV
Pulser
1.9 keVFWHM
3.6 keVFWTM
8148
FIG. 11.24.3 60Co spectrum showing resolutions and peak-to-compton ra-tios for an intrinsic Ge detector and a NaI(Tl) detector.

ANALYTICAL METHODS
Gross Alpha-Beta
A proportional counter with heavy shielding is recom-mended for this method. The instrument is calibrated byadding radionuclide standards to a matrix similar to thesample. A standard solution of cesium 137 or strontium90 certified by the National Institute of Standards andTechnology (NIST) is suitable for gross beta analysis. Asolution of natural uranium, thorium, plutonium 239 or
americium 241 is recommended for gross alpha analysis.Gross alpha-beta results are always reported in compari-son to a specific standard.
The sample, usually a liquid, is evaporated onto aplanchette, to a thin film. The standard is prepared in thesame manner. Counts from the sample are then comparedto the standard. Samples suspected of containing fissionor artificial radionuclides can be tested for gross beta us-ing either the cesium or strontium standard. Environmentalsamples suspected of containing natural radionuclides canbe tested for gross alpha using any of the alpha standardspreviously listed. Careful attention must be paid to self ab-sorption of alpha and beta particles due to sample thick-ness on the planchette whenever test results are evaluated.
Radioactive Cesium
An extremely hazardous fission product, the interim EPAdrinking water regulations limit cesium 134 to 80 pCi/Land cesium 137 to 200 pCi/L. Samples suspected of con-taining moderate or high levels of cesium can be tested bygamma ray spectroscopy. Low-level environmental sam-ples can be purified and concentrated by co-precipitationwith ammonium phosphomolyodate and analyzed eitherby gamma ray analysis or by beta counting (Kreiger 1976).
Radioactive Iodine
Radioiodine originates from nuclear weapons testing andfrom the nuclear fuel cycle. Fission products may containiodines 129 through 135. The EPA drinking water maxi-mum for iodine 135 is 3 pCi/L. Samples are preconcen-trated either by precipitation as PdI2, absorption on an an-ion exchange resin, or by distillation. The concentratedsample is then beta counted (U.S. EPA 1980).
Radium
The EPA has established strict limits on radium in publicdrinking waters. These regulations require that if the ra-dium 226 activity exceeds 3 pCi/L, radium 228 activitymust be measured. If the combined activities of these ra-dioisotopes exceed 5 pCi/L, the water supply exceeds theEPA limit for radium in water. The standard methods ofanalyzing for radium involve either alpha counting a pu-rified barium-radium sulfate co-precipitate, or measuringthe radian de-emanated from radium 226-containing sam-ples. An involved wet chemical procedure based on the in-growth of actinium 228 has been published by the EPAfor radium 228 analysis (U.S. EPA 1980). Simpler, moreprecise gamma ray spectroscopy methods have been de-veloped, significantly lowering the detection limits (U.S.EPA 1980).
©1999 CRC Press LLC
TABLE 11.24.1 PRINCIPAL GAMMA-RAY PHOTOPEAKS USED FOR ANALYSIS OFSELECTED RADIONUCLIDES BYGAMMA-RAY SPECTROSCOPY
Radionuclide Gamma Energy keV
Ra 226 186Pb 212 239Cr 51 321Cs 134 605Cs 137 662Mn 54 835Ac 228 (Ra 228) 911Co 58 1100Zn 65 1110Co 60 1173Co 58 1290Co 60 1333Ce 144 1387Eu 152 1408
FIG. 11.24.4 Typical closed-end coaxial Ge(Li) detector effi-ciency calibration curve. The dashed curve indicates the increasedlow-energy efficiency of intrinsic Ge detectors.
10-3
987654
3
2
10-4
987654
3
2
EF
FIC
IEN
CY
4 5 6 7 8 9100
2 3 4 5 6 7 8 9 2 31000
ENERGY (KeV)
10-5

Strontium
Nuclear fission produces radioactive strontium isotopes.Strontium 90 is an extremely hazardous isotope. Upon in-gestion it tends to concentrate in bone. Analysis of stron-tium involves tedious and complicated wet procedures oflarge samples. It is impossible to separate the isotopes ofstrontium, therefore strontium 90 is actually determinedby measuring the amount of its daughter, yttrium 90. Thefinal purified concentrate is beta counted using cesium 137as the calibration standard.
Tritium
Tritium is found in the environment as a result of naturalcosmic rays, nuclear weapons testing, and the nuclear fuelcycle. Tritium eventually decays by beta emission to he-lium. Analysis consists of an alkaline permanganate dis-tillation, mixing with a liquid scintillator, and beta count-ing with a liquid scintillation spectrometer.
Uranium
Uranium is found in most drinking water supplies as a sol-uble carbonate. Uranium 238 is the primary isotope foundin these waters. Standard uranium methods involve com-plicated wet procedures combined with ion exchange pu-rification prior to alpha counting with a proportionalcounter (Barker 1965). A direct fluorescence analyzer isnow commercially available, considerably simplifying thisanalysis.
—Paul A. Bouis
ReferencesAnalytical chemistry, lab guide edition, Vol. 65, No. 16. American
Chemical Society.American Laboratory. Buyers’ Guide Edition. Vol. 26, No. 4.
International Scientific Communications, yearly publication.Barker, F.B., et al. 1965. Determination of uranium in natural waters.
U.S. Geological Survey, Water Supply Paper 1696-C. Washington,D.C.: U.S. Government Printing Office.
Greenberg, A.E., L.S. Clesceri, and A.D. Eaton. 1992. Standard meth-ods for the examination of water and wastewater, 18th ed. APHA.Washington, D.C.
Heath, R.L. 1974. Gamma ray spectrum catalogue, Ge(Li) and Si(Li)spectrometry. ANCR-1000-2. National Technical InformationService. Springfield, Va.
International Atomic Energy Agency (IAEA). 1976. Manual on radio-logical safety in uranium and thorium mines and mills. Safety SeriesNo. 43. Vienna, Austria: IAEA.
Knoll, G.F. 1989. Radiation detection and measurements. New York,N.Y.: J. Wiley & Sons.
Kreiger, H.L. 1976. Interim radiochemical methodology for drinking wa-ter. EPA 600–4–75–008 (Revised). U.S. Environmental ProtectionAgency, Environmental Monitoring and Support Lab. Cincinnati, Oh.
National Council on Radiation Protection and Measurements (NCRP).1976. Environmental radiation measurements. NCRP Report No. 50.Washington, D.C.
———. 1978. A handbook of radioactivity measurement procedures.NCRP Report No. 58. Washington, D.C.
U.S. Environmental Protection Agency (EPA). 1980. Prescribed proce-dures for measurements of radioactivity in drinking water. EPA600–4–80–032. Environmental Monitoring and Support Lab.Cincinnati, Oh.
©1999 CRC Press LLC
11.25MINING AND RECOVERY OF RADIOACTIVEMATERIALS
The nuclear fuel cycle begins with the exploration and min-ing of uranium-containing ores. Although few active min-ing sites are currently in operation, there are numerousclosed mines throughout the world. Many of the facilitiesin the United States, built and operated under contract tothe DOE, have not been properly remediated. The prolif-eration of sites occurred during a period in the 1970s whenuranium prices skyrocketed. Ores containing as little as0.2% U3O8 were processed during this period.
A simplified schematic of a typical uranium mill isshown in Figure 11.25.1. Closure of mining and mill sitesis strictly regulated by the NRC and its agreement states.Detailed criteria for closure can be found in the Code ofFederal Regulations (10 CFR Part 40). The mining andmilling of uranium ores produces large quantities of con-taminated rock, sludge, gases, and liquids. These materi-als contain varying concentrations of the radioactive oreand its daughters such as radon, radium, lead, thorium,

and bismuth. Tailings and waste produced from the ex-traction or concentration of uranium or thorium from anyore processed primarily to recover source material is calledby-product material. Source material is defined as any ma-terial containing more than 0.05% uranium and/or tho-rium by weight. Exemptions from most NRC regulationsexist for many commercial uses of source material. By-product material is regulated as radioactive waste, includ-ing surface wastes from uranium solution extraction.Underground ore bodies depleted by such techniques arenot considered by-product material.
Proper handling and disposal of waste classified as by-product material is a large part of any mining and millingoperation (IAEA 1976). The typical process produceswaste at almost every step. Most wastes are put into tail-ings ponds where uranium is periodically recovered. Theseponds are normally highly acidic due to the large quanti-ties of acid used in the ore leaching step. They may alsobe contaminated with organic solvents or ion exchangeresins if these are used in the recovery step. Many of these
impoundments have contaminated local groundwaters(UNSCEAR 1977). Treatments for runoff from uraniummills have been developed; a typical treatment process isshown in Figure 11.25.2. This process is designed to pro-duce an effluent that comes close to meeting the drinkingwater limits of 5 pCi/L total radium and 3 pCi/L of ra-dium 226. The concentrated radioactive (radium) sludge(Tsivoglou & O’Connell 1965) is then handled as a low-level radioactive waste.
Tailings ponds, even after closure, are a constant sourceof radon from the decay of radium. Tailings are sometimesused as building materials, posing a potential health haz-ard from radon seepage.
Non-radioactive mining such as phosphate rock oper-ations can produce tailings containing uranium, thorium,and radium at levels above those permissible for release tothe environment. These tailings also often find their wayinto commerce as building materials.
—Paul A. Bouis
©1999 CRC Press LLC
FIG. 11.25.1 Process schematic for a typical uranium mill.
Apron feeder
Belt conveyor
ORE RECEIVING1
Grinding2
Fines
Cyclones
Coarse
H2O
5-Stage Leach (10 hrs)3
Air
SteamSulfuric acid
Slurryholdingtanks
Sodium chlorate
Atmosphere
Demister
Counter Current Decantation (6 Stages CCD)4
Dilute slurry
Floc
Dilute slurry
Floc
Dilute slurry
Floc
Dilute slurry
Floc
Overflow wash
No. 1 thickenerNo. 2 thickener
No. 6 thickenerNo. 3-5 thickener
SlurrySlurry
SlurrySlurry
Clarification5
Clarified
Solutions
Settling tanks
Sand filters
Solvent Extraction6
Barrenstrip
NH3
NH3
NH3HCL
Barren stripMakeup tank Precipitation and Drying7
Wash water
Scrubber wash solution
Slurry
Centrifuge Atmosphere
Atmosphere
AirScrubber
AirScrubber
Yellowcakedryer
Yellow cake
H2O
H2O
SIMPLIFIED SCHEMATIC MILL FLOWSHEET
Overflow washOverflow wash

References
International Atomic Energy Agency (IAEA). 1976. Manual on radio-logical safety in uranium and thorium mines and mills. Safety SeriesNo. 43. IAEA. Vienna, Austria.
Tsivoglou, E.C., and R.S. O’Connell. 1965. Nature, volume and activ-ity of uranium mill wastes. Radiological Health and Safety in Miningand Milling of Nuclear Materials. IAEA. Vienna, Austria.
United Nations Scientific Committee on the Effects of Atomic Radiation(UNSCEAR). 1977. Sources and effects of ionizing radiation. NewYork, N.Y.
©1999 CRC Press LLC
FIG. 11.25.2 Process schematic of a typical radium removal operation.
Polymer
Dual MediaFilter
Effluent
Backwash
Sludge to Disposalat a LLWD Site
SludgeThickener
Barium Chloride
Influent
Precipitation Reactors
P
P
11.26LOW-LEVEL RADIOACTIVE WASTE
Low-level radioactive waste is a general term for a widerange of materials contaminated with radioisotopes(Gershey, Klein, Party & Wilkerson 1990; Burns 1988).Industries and hospitals, medical, educational and researchinstitutions, private and government laboratories, and nu-clear fuel cycle facilities using radioactive materials gener-ate low-level radioactive wastes as part of normal opera-tions. These wastes are generated in many physical andchemical forms, and at many levels of contamination. Low-level radioactive waste (LLRW) accounts for only one per-cent of the activity (curies, bequerels) but eighty-five per-cent of the volume of radioactive waste generated in theUnited States. The NRC defines LLRW as “radioactivematerial subject to NRC regulations that is not high-levelwaste, spent nuclear fuel, or mill tailings and which NRCclassifies in 10 CFR Part 61 as low-level radioactive waste.”
Table 11.26.1 shows the origins of most radioactivewastes. Figure 11.26.1 shows general classifications for allradioactive wastes. Low-level wastes fall under four cate-gories:
1. Below regulatory concern2. Generator disposed3. Class A, B, or C4. Greater than class C
Approximately two million cubic feet of LLRW are dis-posed of annually at currently operating commercial dis-posal sites. The nuclear fuel cycle accounts for over fiftypercent of this volume, and more than eighty percent ofthe activity.
Although contact with radioactive waste in the envi-ronment should be minimal, due to the highly regulatednature of the waste handling protocols, the ongoing de-sign, operation, and maintenance of the numerous sites areongoing activities requiring the expertise of environmen-tal engineers and scientists.
Waste ClassificationNo worldwide agreement has been reached for classifica-tion of radioactive wastes. This is contrary to the rules es-tablished for release of radioactive materials to the envi-ronment and for protection of the general public andworkers from radiological exposure. However, most coun-tries agree that waste is best classified from the point ofview of disposal. The NRC, in 10 CFR Part 61, classifieslow-level radioactive waste based on its suitability for nearsurface disposal. According to the NRC, classifying ra-dioactive waste involves two factors:

©1999 CRC Press LLC
TABLE 11.26.1 ORIGINS, TYPES, QUANTITIES AND CHARACTERISTICS OF RADIOACTIVE WASTE GENERATEDIN THE UNITED STATES
U.S. InventoryHazard
Surface Duration Overall HazardWaste Principal Generators Typical Nuclides Curies m Exposure (years) Potential
Spent fuel Nuclear power plants, 137Cs, 60Co, 235U, 1.8 3 1010 6.80 3 103 High .105 Requires isolation inDOE activities 238U, 239–242Pu perpetuity
High-level DOE reprocessing of 90Sr-90Y, 137Cs, 1.3 3 109 3.82 3 105 High .105 Requires long-termspent fuels 144Ce, 106Ru, isolation
239–242Pu
Transuranic Plutonium production 239–242Pu, 241Am, 4.1 3 106 2.80 3 105 Moderate .105 Soluble and respirablefor nuclear weapons 244Cm
Mill tailings Mining and milling of 235U, 230Th, 226Ra 1.4 3 105 1.20 3 108 Low .104 Hazard to workeruranium/thorium ores
Greater than Nuclear power plants, 60Co, 137Cs, 90Sr, 2.40 3 106 1.30 3 102 High 500 HighClass C users and manufactur- 241Am
ers of sealed-sourcedevices
Low-level DOE Various processes, in- Fission products, 1.4 3 107 2.40 3 106 Unknown .103 High, poorly managedcluding decontamination 235U, 230Th, in the pastand remedial action a-bearing waste, 3Hcleanup projects
Low-levelcommercialClass A Fuel cycle, power 3.6 3 105 1.3 3 106 Low 200 Low
plants, industry,institutions
Class B Principally power plants 9.5 3 105 2.7 3 104 Moderate ,103 Moderateand industry
Class C Power plants, some 2.5 3 106 6.5 3 103 High .105 Highindustry
TABLE 11.26.2 OVERVIEW OF CLASSES A, B, AND C, WASTE CHARACTERISTICS
Characteristic Class A Waste Class B Waste Class C Waste
Concentration low concentrations higher concentrations highest concentrationof radionuclides of radionuclides of radionuclides
Waste Form must meet minimum waste must meet minimum waste must meet minimum wasteform requirements form requirements form requirements
does not require requires stabilization requires stabilization forstabilization (but may for 300 years 300 yearsbe stabilized)
Examples typically contaminated typically resins and typically nuclearprotective clothing, filters from nuclear reactor components,paper, laboratory trash power plants sealed sources, high
activity industrial waste
Intruder Protection after 100 years, decays after 100 years, decays after 500 years, decaysto acceptable levels to to acceptable levels to to acceptable levels toan intruder an intruder, provided an intruder
waste is recognizablerequires no additional requires stabilization requires stabilization
measures to protect to protect intruder and deeper disposalintruder (or barriers) to protect
intruder
Segregation unstable Class A must need not be segregated need not be segregatedbe segregated from from Class C from Class BClasses B and C

1. Long-lived radionuclide concentrations posing poten-tial hazards that will persist long after such precautionsas institutional controls, improved waste forms anddeeper disposal have ceased to be effective
2. Shorter-lived radionuclide concentrations for which in-stitutional controls, waste forms, and disposal methodsare effective
Low-level radioactive waste is classified as Class A, B, andC waste. An overview of the characteristics of wastes inthese classes is shown in Table 11.26.2. 10 CFR §61.54defines these classes as follows:
1. Class A wastes are usually segregated from other wasteclasses at the disposal site. The physical form and char-acteristics must meet the minimum requirements setforth in these regulations (10 CFR §61.56[a]), e.g., con-tains less than 1% liquid by volume, etc. If Class Awaste also meets the stability requirements set forth in10 CFR §61.56(b), it is not necessary to segregate thewaste for disposal.
2. Class B wastes must meet more rigorous waste formrequirements to ensure stability after disposal.
3. Class C wastes must meet more rigorous waste formrequirements, and also require additional measures atthe disposal facility to protect against inadvertent in-trusion.
Wastes with form and disposal methods more stringentthan Class C are not acceptable for near surface disposal.These wastes must be disposed of in geological repositories.
Classification by specific long- and short-lived ra-dionuclide concentrations is also given in 10 CFR §61.54.The reader is referred to this section for details.
The 10 CFR Part 61 radioactive waste classification isa systematic attempt to control the potential dose to manfrom disposed waste. System components include site char-acteristics, site design and operation, institutional controls,waste forms, and intruder barriers. The quantity and typeof radionuclides permitted in each class are based on thesevarious disposal components and on radioactive material
©1999 CRC Press LLC
FIG. 11.26.1 General classifications of radioactive waste.
Produced by• nuclear reactors• hospitals• research
institutions• industry• government• universities
Produced by• nuclear reactors• hospitals• research
institutions• industry• government• universities
Produced by• nuclear reactors• hospitals• research
institutions• industry• government• universities
Produced by• nuclear reactors• industry• medical
institutions
Produced by• nuclear reactors• Dept. of Energy
Produced by• medical facilities• industry• university accelerators• coal plants• old watch dial and paint factories
Produced by• uranium millers
• uranium mill tailings• resins• filters and general industrial wastes from uranium extraction
• reactor components• sealed sources• decontamination fluids
• radium sources (needles, gauges & instruments)• water treatment resins• accelerator products• boiler ash• contaminated soil
• spent fuel rods• weapons by-products
• solidified liquids• filters and resins• rags/wood• clothing/paper• lab trash• animal carcasses
• liquids, gases• combustibles• contaminated soils• solids
• solidified liquids• filters and resins• rags/wood• clothing/paper• lab trash• scintillation vials• animal carcasses
Regulatedby NRC
orStates
Regulatedby NRC,EPA and
States
Regulatedby NRC
orStates
Regulatedby NRC
Regulatedby NRC
Regulatedby States
Regulatedby NRC
orStates
NaturallyOccuring
andAccelerator-ProducedMaterials
Class A, B, CLow-Level
RadioactiveWaste
MillTailings
High-LevelRadioactive
Waste
Greater ThanClass CWaste
10 CFR20 Disposal
byGenerators
BelowRegulatoryConcern
Low-LevelRadioactive
Waste
Rad
ioac
tive
Was
te

concentrations expected in the waste and important fordisposal. Since low-level radioactive waste typically con-tains short- and long-lived radionuclides, three time inter-vals, 100, 300, and 500 yr, are used to set waste classifi-cation limits (Table 11.26.3).
Sources of Low-Level RadioactiveWasteNUCLEAR FUEL CYCLE WASTE
Fuel cycle and utility wastes consist mostly of compactedtrash and dry wastes, filters, tools, and ion-exchangeresin. Many of these wastes are generated from systemsdesigned to minimize escape of any radioactivity to theenvironment.
INDUSTRIAL WASTE
The industrial LLRW category encompasses wastes gen-erated by private research and development companies,manufacturers, non-destructive testing, mining, fuel fabri-cation facilities, and radiopharmaceutical manufacturers.Most wastes are generated by manufacturing concerns pro-ducing radioactive materials for use in nuclear fuel andnon-fuel cycles. Manufacturing companies also produce
waste from consumer goods such as smoke detectors andluminous devices. An estimated ninety-five percent ofwaste is generated by one percent of the approximately4000 industrial generators.
GOVERNMENT WASTE
Waste generated by state and federal agencies falls intothis category. Waste from private facilities working undercontract to the government is very often excluded fromthis category. Government waste is the most diverse sinceit is generated by so many different organizations. LLRWproduced in defense-related areas is handled by the DOEand is not included in this category.
MEDICAL WASTE
Medical generators include hospitals and clinics, researchfacilities, and private medical offices. More than 120 mil-lion medical procedures using radioactive materials areconducted annually in the United States (SNM 1988).Relatively large doses of isotopes, frequently powerfulgamma emitters with short half-lives, are used in clinicalprocedures. Medical waste volumes were historically toolarge due to improper classifications. Rising disposal costshave improved proper classification.
©1999 CRC Press LLC
TABLE 11.26.3 MAXIMUM CONCENTRATION LIMITS FOR LOW-LEVEL RADIOACTIVE WASTE FROM 10 CFRPART 61
Half-lifeMaximum Concentration Limits (Ci/m3)a
Radionuclide (years) Class A Class B Class C
Nuclides with half-lives,5 yearsa ,5.0 700.000 NLb •••
60Co 5.3 700.000 NL •••3H 11.3 40.000 NL •••90Sr 28.0 0.040 150.0 7000.00137Cs 30.0 1.000 44.0 4600.0063Ni 92.0 3.500 70.0 700.0063Ni in activated metal 92.0 35.000 700.0 7000.0014C 5,730.0 0.800 ••• 8.0014C in activated metal 5,730.0 8.000 ••• 80.0094Nb in activated metal 20,000.0 0.020 ••• 0.2059Ni in activated metal 80,000.0 22.000 ••• 220.0099Tc 212,000.0 0.300 ••• 3.00129I 17,000,000.0 0.008 ••• 0.08a-emitting transuranic
nuclides with half-lives ,5 years ,5.0 10.000 nCi/g ••• 100.00 nCi/g
242Cm 0.45 2,000.000 nCi/g ••• 20,000.00 nCi/g241Pu 13.2 350.000 nCi/g ••• 3,500.00 nCi/g
aIncluding, but not limited to: 32P, 35S, 51Cr, 54Mn, 55Fe, 58Co, 59Fe, 65Zn, 67Ga, 125I, 131I, 134Cs, 144Ce, and 192Ir.bNo upper limit on concentration.

ACADEMIC WASTE
Academic waste includes university hospitals and universitymedical and nonmedical research facilities. It tends to be lowin activity and relatively high in volume, often due to im-proper classification of some materials as radioactive waste.
GREATER THAN CLASS C WASTE
Greater than Class C (GTCC) wastes contain concentra-tions of radionuclides greater than Class C limits estab-lished in 10 CFR Part 61. These wastes, as mentioned ear-lier, cannot be disposed of as LLRW but must go to ageological repository. GTCC waste comes primarily fromdecontamination and decommissioning of nuclear powerplants. Nonutility generators include manufacturers ofsealed sources used as measuring devices. GTCC wastevolume is projected to expand during the next twenty yearsas more nuclear plants are decommissioned.
BELOW REGULATORY CONCERNWASTE
Below regulatory concern (BRC) wastes have radioactivecontent so low that unregulated release does not pose anunacceptable risk to public health or safety (Table11.26.4). This class was established to make practical,timely determinations of when wastes need to go to a li-censed LLRW site. The low-level radioactive waste policyamendments act of 1985 established procedures for act-ing expeditiously on petitions to exempt specific radioac-tive waste streams from NRC regulations (NRC 1986).Petitions already filed could dramatically reduce the totalLLRW needing disposal.
MIXED WASTE
Mixed low-level radioactive waste contains both radioac-tive and hazardous components and meets, respectively,NRC’s definition of low-level radioactive waste in 10 CFRPart 61, and the Environmental Protection Agency’s defi-nition of hazardous material in 40 CFR Part 261. Althoughany type of low-level waste may be “mixed,” surveys ofwaste generators indicate that less than five percent of thewastes to be sent to commercial sites would be classifiedas mixed (Bowerman, Davis & Siskind 1986). An exam-ple of a mixed waste would be a contaminated flamma-ble extraction solvent used in radioisotope recovery. NRCderegulation of scintillation fluids containing minimalquantities of 3H and 14C has eliminated the largest sourceof mixed waste from disposal as LLRW.
Quantities of LLRW GeneratedEach year, the DOE national low-level waste managementprogram publishes data on both national and state-specificLLRW commercially disposed of in the United States(Fuchs & McDonald 1993). Data are categorized by dis-posal site, generator category, waste class, volume, and ra-dionuclide activity. A distinction is made between LLRWshipped directly for disposal by generators, and waste han-dled by an intermediary. Wastes are subdivided into fivecategories:
• Academic• Government• Industrial• Medical• Utility
The volume of LLRW disposed of at commercial sites ex-ceeded 3,500,000 ft3 in 1980 (LLWMP 1982). The vol-ume of LLRW disposed of at these sites since that timehas steadily declined. In 1992, commercial LLRW disposalfacilities received a total volume of 1,743,279 ft3 of wastecontaining an activity of 1,000,102 curies. Waste distrib-ution by disposal site is presented in Table 11.26.5. Tables11.26.6 and 11.26.7 provide typical radionuclide andwaste forms associated with commercial LLRW. Table
©1999 CRC Press LLC
TABLE 11.26.4 EXAMPLES OF MATERIALS EXEMPTFROM LICENSING REQUIREMENTSUNDER 10 CFR PART 31
Producta Permissible Activity (#)
Static-elimination devices 500 mCi 210PoIon-generating tubes 500 mCi 210Po or 50 mCi 3HLuminous devices in aircraft 10 Ci 3H or 300 mCi 147PmCalibration sources 5 mCi 241AmIce-detection devices 50 mCi 90SrPrepackaged in vitro/clinical 10 mCi 125I/test
testing kits 10 mCi 131I/test10 mCi 14C50 mCi 3H20 mCi 59Fe10 mCi 55Fe
aThe use of thorium in gas mantles, vacuum tubes, welding rods, incandes-cent lamps, photographic films, and finished optical lenses is also not regulated.Naturally occurring radioactive materials (NORM) present in geologic speci-mens, petroleum drilling wastes, and rare earth minerals processing wastes (withthe exception of uranium and thorium) are also not regulated.
TABLE 11.26.5 DISTRIBUTION OF LOW-LEVELRADIOACTIVE WASTE RECEIVEDAT DISPOSAL SITES IN 1992
Percent PercentVolume of Activity of
Site (ft3) Total (curies) Total
Barnwell 830,512 48 815,974 82Beatty 514,726 29 90,205 9Richland 398,041 23 93,923 9Total 1,743,279 100 1,000,102 100

©1999 CRC Press LLC
11.26.8 shows volume and activity according to genera-tor category.
LLRW Commercial Disposal SitesThere were only two low-level radioactive waste disposalsites operating in the United States in 1994. Located inBarnwell, South Carolina and Richland, Washington, thesefacilities handle all low-level waste generated in the UnitedStates. Beginning in 1993, federal law allowed these statesto refuse to accept any low-level waste generated outsidetheir borders. The low-level radioactive waste policy actof 1980 made each of the 50 states responsible for dis-
TABLE 11.26.6 REPORTED LOW-LEVEL RADIOACTIVE WASTE RADIONUCLIDES RECEIVED AT DISPOSAL SITESIN 1992 FOR DIRECT AND NONDIRECT SHIPMENTS IN ORDER OF HIGHEST TO LOWESTACTIVITY LEVELS
Nondirect Reactors Academic Medical Industrial Government
H-3 Fe-55 Pm-147 Cs-137 H-3 Sr-90Cs-137 Co-60 H-3 Sr-90 Co-60 Co-60Fe-55 Ni-63 Co-60 Ni-63 Cs-137 Fe-55Co-60 Mn-54 I-129 Co-57 Fe-55 U-238S-35 Ag-110m S-35 Ba-133 S-35 Mn-54Ni-63 Cs-137 Cr-51 Ra-226 Ir-192 Ni-63Co-58 Co-58 P-32 Rn-222 U-238 Co-58C-14 Cr-51 C-14 Sr-90 Ra-226Mn-54 Cs-134 I-131 Th-232 C-14Kr-85 H-3 Ca-45 Th-228 H-3Cs-134 Cd-109 Ni-63 Ce-144 Eu-152Sr-90 Sb-125 Ra-226 P-32 U-235P-32 Sr-90 Co-57 Ni-63 Ni-59Cr-51 Ni-59 I-123 Ag-110m Co-57Zn-65 Nb-95 Re-186 Sb-125 Tc-99I-125 Zr-95 Cu-67 Ra-228 Am-241Am-241 Fe-59 Cu-64 Eu-154Ni-59 C-14 K-40 I-125Sb-125 Sr-85 Cs-137Fe-59 Zn-65Ra-226 Ag-108
TABLE 11.26.7 TYPICAL WASTE FORMS BYGENERATOR CATEGORIES
AcademicCompacted trash or solidsInstitutional laboratory or biological wasteAbsorbed liquidsAnimal carcasses
GovernmentCompacted trash or solidsContaminated plant hardwareAbsorbed liquids
IndustrialDepleted uraniumCompacted trash or solidsContaminated plant hardwareAbsorbed liquidsSealed sources
MedicalCompacted trash or solidsInstitutional laboratory or biological wasteAbsorbed liquidsSealed sources
UtilitiesSpent resinsEvaporator bottoms and concentrated wasteFilter sludgeDry compressible wasteIrradiated componentsContaminated plant hardware
TABLE 11.26.8 LOW-LEVEL RADIOACTIVE WASTESRECEIVED AT COMMERCIALDISPOSAL SITES IN 1992
Generator Volume ActivityCategory (ft3) (curies)
Academic 44,322.34 1,724.39Government 158,186.17 40,780.08Industrial 908,451.86 100,089.80Medical 26,251.32 397.80Utility 606,066.85 857,110.38Total 1,743,278.54 1,000,102.45

posal of its own low-level waste. Amendments passed in1985 strengthened the act and established a firm decision-making timeline for the states (Table 11.26.9). Federal lawgives each state the option of establishing a disposal sitewithin its borders, or forming a partnership or compact,with other states to dispose of low-level waste on a re-gional basis (Figure 11.26.2). Each state must take title toall waste generated within its borders by January 1, 1996,whether or not a disposal facility is operating at that time.
Beginning in 1993, the Washington site restrictedLLRW received for disposal to the Northwest and RockyMountain compact states. The South Carolina facility isto remain open until 1996, but stopped accepting wastefrom outside the southeast compact in 1994. At this time,states without access to an operational disposal site willhave to store their LLRW until a location is identified fordisposal.
LLRW Reduction ProcessesVolume reduction is the single most-used technique to min-imize the cost and environmental impact of low-level ra-dioactive waste disposal. NRC-mandated volume-reduc-tion measures have been very effective in minimizingnuclear power industry waste for LLRW disposal sites(Table 11.26.10). It is estimated that an 80% volume re-duction could be achieved by many institutions and in-dustries through segregation, decay of short-lived isotopes,compaction, regulated sewer disposal, exclusion of scintil-lation fluids, and incineration.
WASTE MINIMIZATION
Waste minimization is the simplest, most economical, andoften most overlooked method to achieve significant vol-ume reduction. Careful preplanning of activities, mini-mizing the use of clean materials and disposable protec-tive equipment, and proper maintenance in radioactiveareas are simple, effective strategies for minimizing LLRWgeneration.
SEGREGATION
Segregation of waste according to physical form, chemicalcomposition half-life, and NRC classifications (A, B, C)should be an integral part of any volume reduction plan.Labeling all waste according to International Commissionon Radiation Protection (ICRP) guidelines facilitates theireventual shipment to the disposal site.
DECAY
Medical and academic LLRW is commonly stored, al-lowing decay of short-lived radionuclides to innocuous lev-els, so that wastes can be disposed of according to theirnon-radiological properties (termed hold-for-decay dis-posal).
Storage is regulated as an operational matter, subjectto the same public health and environmental protectionrequirements. The hold-for-decay practice is best suited for
©1999 CRC Press LLC
TABLE 11.26.9 DEADLINES DEFINED BY THE LOW-LEVEL RADIOACTIVE WASTE POLICY AMENDMENTS ACTOF 1985
Date Legislated Action(s)
January 1, 1986 Each state to have joined compact or to have enacted legislation indicating intention to develop itsown site; surcharge not to exceed $10 per cubic foot.
July 1, 1986 Generators in states that did not meet the January 1, 1986 deadline are subject to doubledsurcharges until December 31, 1986.
January 1, 1987 Generators in states that did not meet January 1, 1986 deadline may be denied access to operatingdisposal sites.
January 1, 1988 Compacts to have named host states; unaligned states to have developed siting plan and scheduleand to have delegated authority for development; surcharge not to exceed $20 per cubic foot;noncompliance states subject to doubled surcharges.
July 1, 1988 Noncompliance states subject to quadrupled surcharges.January 1, 1989 Generators in states and compacts that did not meet the January 1, 1988 deadline to be denied
access to operating disposal sites.January 1, 1990 Compacts and unaligned states to file a complete operating license application; letter from
governor stating that the unaligned state will have provisions for LLRW disposal in placeby December 31, 1992, may be submitted in lieu of application; surcharge not to exceed $40per cubic foot; failure to comply may result in denial of access to operating disposal sites.
January 1, 1992 All compacts and unaligned states to file operating license ap-plications; letter from governor no longer sufficient for compliance status.
January 1, 1993 Sited compacts to be empowered to restrict import of non-compact LLRW.January 1, 1996 Surcharge rebates cease.

small volumes of waste containing discrete radionuclideswith very short half-lives. Wastes containing long-lived ra-dionuclides such as fission products are not amenable tothis practice due to: larger volumes; wide variety of phys-ical and chemical form and radionuclide content; and longstorage times needed for decay.
SEWAGE DISPOSAL
Sewage disposal of radionuclides is authorized by the NRCunder 10 CFR §20.303. The reader is referred to this sec-tion and the limits in Appendix B, Table I, Column 2 fordetails. The total quantity of licensed and other radioac-tive material, excluding 3H and 14C, disposed in sewerscannot exceed one curie per year. The quantity of 3H maynot exceed five curies per year, and the quantity of 14Cmay not exceed one curie per year.
DEREGULATION
Deregulation of LLRW poses little hazard to the public orthe environment and could significantly decrease the vol-ume of LLRW. The NRC, as previously discussed, has es-tablished a petition mechanism for the deregulation ofgeneric wastes. An example of the effect of such a petitioncomes from an exemption for biomedical institutions
©1999 CRC Press LLC
FIG. 11.26.2 U.S. map showing compact alignments, the operating and closed LLRW disposal facilities, and the designated pro-posed sites in California and Texas. Unaligned states are shown in white. The existing sites are shown by circles; closed sites by tri-angles; and proposed sites by squares. The Northeast and Southwest compacts are not contiguous and will require travel outside theirrespective regions in order to transport LLRW from generators to the disposal facilities.
TEXAS
NEVADA
ARIZONA
CALIFORNIA
UTAH
NEW MEXICO
COLORADO
WYOMING
SOUTH DAKOTA
NORTH DAKOTA
IDAHO
OREGON
MONTANA
WASHINGTON
OKLAHOMA
KANSAS
NEBRASKA
ARKANSAS
LOUISIANA
MISSISSIPPI
ALABAMA GEORGIA
FLORIDA
SOUTHCAROLINA
NORTH CAROLINATENNESSEE
VIRGINIA
KENTUCKY
ILLINOIS
MINNESOTA
IOWA
MISSOURI
WISCONSIN
INDIANA
MICHIGAN
OHIO
NEW YORK
WESTVIRGINIA
PENNSYLVANIA
M.D.DE.
N.J.
CONN.
R.I.
MASS.
VT.
N.H.
MAINE
HAWAII
Northeast
Central States
CentralMidwest
Southeast
Appalachian
Midwest
Northwest
Rocky Mountain
Southwest
ALASKA
Operating disposalfacilities
Closed sites
Designated sites
TABLE 11.26.10 COMPARISON OF VOLUMES OFVARIOUS NRC CLASSES OF LLRWSHIPPED TO COMMERCIALDISPOSAL SITES IN 1987 AND 1992
1987 1992
Class ft3 % ft3 %
A 1,796,695 97.4 1,676,007 96.1B 39,128 2.1 41,599 2.4C 8,687 0.5 25,673 1.5

(Fortom and Goode 1986). This petition proposes on-siteincineration of solid biomedical waste containing a max-imum of one curie of 3H and one hundred millicuries of14C per year. The resulting ash would be disposed of assanitary waste. This petition estimates a 90% reduction ininstitutional waste presently sent to LLRW disposal sites.It has not been enacted, in part due to concern for cleanair requirements not related to radioactivity.
DEWATERING
Radioactive waste dewatering is an effective and efficientmethod for volume reduction. In addition, radioactivewaste must not contain more than 0.5% freestanding wa-ter to be accepted at LLRW disposal sites. Centrifugation,filtration, and evaporation are standard techniques usedto dewater wastes.
COMPACTION
Compaction is the primary volume-reduction method.Uncompacted waste has a typical density of approximately130 kg/m3 and can be increased three- to fourfold using astandard (20,000 psi) compactor. Super compactors canincrease the density by a factor of ten. Shredding wasteprior to compaction can also reduce the final volume.Compaction methods cannot be applied to hard and densewaste items for which volume reduction would be mini-mal. During compacting, potentially contaminated gases,liquids, and particulates are expelled from the waste andmust be trapped by an off-gas (scrubber) treatment system.
INCINERATION
A large portion of LLRW is combustible and suitable forincineration. Used in combination with compacting, one-hundred fold volume reductions can be achieved.Radioactive waste incineration is an expensive and poten-tially troublesome treatment technique. Most Europeancountries incinerate combustible radioactive waste prior todisposal. In the United States, incineration is reserved forcases where maximum volume reduction is required,and/or sophisticated off-gas treatment is not necessary.Clean air requirements make it increasingly difficult tobuild commercial incinerators.
Several waste characteristics are important in relationto incinerator performance. With very compact materials,combustion may be incomplete. Certain materials such asplastics (PVC) produce corrosive (HCl) gases that can dam-age the incinerator and must be scrubbed prior to releaseto the environment. The correct temperature must be main-tained to ensure complete combustion. Since furnace tem-perature is controlled by the calorific value of the waste,the moisture content, and the combustion rate, it is clearthat the feed rate is critical to successful incineration. Theuse of supplemental fuel to control combustion is dis-
couraged unless it is already contaminated with radioac-tive materials.
Liquid and Gaseous EffluentTreatmentLIQUID EFFLUENTS
LLRW is produced from the clean-up of drainings andcooling water at nuclear power plants, manufacturing sites,and R&D laboratories where radioactive materials arehandled. These low-activity wastes are usually treated toremove most radionuclides, then discharged to the envi-ronment. Low-activity wastes can be collected and mixedfor a more uniform effluent or segregated to utilize spe-cific treatments for the individual components. If the firstapproach is utilized, the usual wastewater treatments offlocculation, precipitation, absorption, filtration, and ionexchange can be adapted to radioactive wastes (Table11.26.11). Provisions must be made for water dischargingand for drying, compacting, and disposing of the solidsproduced. Presently, solids are sent to a LLRW disposalsite. Radium removal, covered in the section on miningand milling, is a good example of a specific treatmentprocess.
If the total solids content of the contaminated water islow, if the volume is small, or if a final polishing of efflu-ents is necessary, ion exchange may be a suitable treat-ment method. At nuclear power plants, ion exchange, fil-tration, evaporation, and reverse osmosis are the majorprocesses used for contaminated water treatment (Figure11.26.3).
GASEOUS EFFLUENTS
The primary source of radioactive gaseous effluents to theenvironment is from nuclear power plants. Coal-firedpower plants also emit particulate radionuclides and aretreated by conventional stack gas technology. Effluentsfrom nuclear reactors include noble gas isotopes, ra-dioiodines, tritium and some fission products (heavy wa-ter reactors). Typical treatment processes are shownschematically in Figure 11.26.3.
Conditioning TechniquesProper LLRW disposal is closely regulated by the NRCand its agreement states. The application for a license tohandle radioactive materials requires a sound disposal planfor any radioactive waste produced. The NRC permitsLLRW disposal via six methods outlined in 10 CFR Part20.
1. Transfer of waste to an authorized recipient.2. Disposal by release into a sanitary sewerage system
(meets limits in 10 CFR §20.303).
©1999 CRC Press LLC

©1999 CRC Press LLC
TABLE 11.26.11 TREATMENT PROCESSES FOR REMOVAL OF RADIOACTIVEWASTES
Decontamination Factora
Individual Mixed FissionProcess Radionuclides Productsb
ConventionalCoagulation and settling 0–1001 2–9.1Clay addition, coagulation and settling 0–100 1.1–6.2Sand filtration 1–100Coagulation, settling and filtration 1–50 1.4–13.3Lime-soda ash softening 2–100Ion exchange, cation 1.1–500 2.0–6.1Ion exchange, anion 0–125Ion exchange, mixed bed 11–3300 50–100Solids-contact clarifier 1.9–15 2.0–6.1Evaporation 1.00–10,000
NonconventionalPhosphate 1.2–1000 125–250Metallic dusts 1.1–1000 1.1–8.6Clay treatment 0–1001Diatomaceous earth 1.1–`Sedimentation ,1.05Activated sludge 1.03–8.2 4.8–9.8Trickling filter 1.05–37 3.5–6.1Sand filter 8.3–100 1.9–50Oxidation ponds ,1.1–20
aDecontamination factor 5
bWhere no data are listed it implies lack of information and not the unsuitability of the process.
initial concentration}}}final concentration
3. Release to the environment, if material is below themaximum permissible concentration (MPC) in 10 CFRPart 20 appendix B, Table II.
4. Disposal by incineration according to 10 CFR §20.305,especially for waste oils and scintillation fluids.
5. Disposal of certain specific waste without regard to itsradioactivity 10 CFR §20.306 (e.g., 0.05 mCi 3H or14C).
6. Specific procedures approved as part of licensing to han-dle radioactive materials.
Radioactive waste is normally disposed of as a solid, ex-cept for liquids released to sanitary sewers or other watersystems when radioactivity levels are below the maximumpermissible concentration (MPC). In contrast to othertypes of waste, where pollutants can be eliminated by treat-ment, radioactivity can only be reduced by decay time.Thus the disposal methods used at NRC-authorized dis-posal sites are for solids and are based on the decay timerequired to make them non-radioactive. The correct prepa-ration of radioactive waste is the first step to ensure thewaste is disposed of economically and according to all ap-plicable regulations.
Conditioning of radioactive wastes can include segre-gation, pretreatment, processing, and packaging. These
techniques are covered in other sections of this chapter.Here, conditioning refers only to the various immobiliza-tion techniques used to prevent radioisotopes leaching intothe environment. Immobilization is often used to help meetthe NRC stability requirements for Class B and C wasteand even for some forms of Class A and mixed wastes. Theprinciple immobilization techniques are cementation, bitu-minization, polymerization, and vitrification. All of thesetechniques will increase the volume of radioactive waste.
CEMENTATION
Cement is used to solidify liquid waste. Cementation is rel-atively inexpensive but prone to leaching. The radioactivewaste reacts with the cement and is bound to it. Wastecompatibility must be verified, and special cement formu-lations are sometimes required to insure the product sets.This technique is sometimes used to dry a solid waste sothat it contains less than 0.5% freestanding liquid.
BITUMINIZATION
The use of bitumen or asphalt is a classic immobilizationtechnique. The process, carried out at the relatively high

temperature of $150°C, is dangerous and requires spe-cialized equipment. The product is less subject to normalleaching, but is susceptible to fire damage. The productalso has a tendency to swell from the release of gases.
POLYMERIZATION
Polymerization of liquid and semi-liquid LLRW by in situaddition of monomers and initators is a relatively new tech-nique. The process must be carefully adopted to the typeof waste being immobilized. The product has shortcom-ings similar to bitumen waste.
VITRIFICATION
Vitrification in borosilicate waste is an expensive techniquevery rarely used in the immobilization of LLRW.
Disposal TechniquesDisposal of LLRW in the United States has been based onsome form of land burial since ocean dumping was bannedin the 1960s. The facilities must be on a site designed, op-erated, closed, and controlled after closure to meet all cri-teria in 10 CFR Part 61. Releases to the environment must
be as low as reasonally achievable (ALARA), and wastecontainment systems must be effective until the radioac-tivity has decayed to MPC levels.
SHALLOW LAND BURIAL
Shallow land burial (SLB) in trenches, often plastic lined,is the most economical disposal method. Prepackaged orpreconditioned waste is carefully stacked into the trench,then covered with the excavated earth. Radioactivity canbe successfully confined in the burial area if leaching ofthe waste by groundwater or rainwater can be reducedto negligible levels. Thus, careful geological, geochemi-cal and hydrological studies must be made for burial sitelocation.
DISPOSAL VAULTS
Below-ground vaults (BGV) and above ground vaults(AGV) are enclosed, engineered structures built to hold themost hazardous low-level radioactive wastes, such as ClassC or greater than Class C (GTCC). The long-term effec-tiveness of this expensive solution has been questioned byproponents of SLB disposal (Gershey, Klein, Party &Wilkerson 1990).
©1999 CRC Press LLC
FIG. 11.26.3 Specific treatment and volume-reduction methods for nuclear plants. (Reprintedfrom International Atomic Energy Agency, 1986.)
Collectingtanks
Filter orcentrifuge
Reverseosmosis
Solid waste
Ion exchange
reuse
Precool filter
Decay pipes
Blower
Charcoalfilter
Ventilationsystem
Turbine glandseal off-gases
Charcoalabsorbent beds
Decoy tankRecombiner
EjectorMain condensoroff-gases
STACK
DISCHARGE
HEPA filter�z��yzCondenser Filter Drier��
��yz{|
HEPA filter
HEPA filterCondenser
Controltanks
Low conductivity:Equipment drainsCleanup & fuel pond system
Ion exchangeControltanks
Precool filterCollecting
tanksEvaporator
High Conductivity:Floor drainsSampling & lab drainsRegenerants & decontaminations
Laundry & shower drains Collecting &control tanks
LIQUID WASTES
GASEOUS WASTES
TREATMENT
Boiling Water Reactor
Blower
Blower

EARTH-MOUNDED CONCRETE BUNKERS
Earth-mounded concrete bunkers (EMCB), a combinationof trenches and vaults, are being strongly considered bymany of the new state disposal sites mandated byCongress. EMCB disposal technology involves isolatinglow-level radioactive waste in an engineered vault locatedabove or below the natural grade of the site. A multilayer,engineered earthen cover is positioned over the vault toprovide an additional barrier. Depending on the design,Class A, B, or C wastes can be stored in these structures.
Other disposal methods for LLRW have been proposed,but at this time shallow land burial is the only successfuland cost effective commercial method (Gershey, Klein,Party & Wilkerson 1990).
—Paul A. Bouis
ReferencesBowerman, B.S., R.E. Davis, and B. Siskind. 1986. Document review
regarding hazardous chemical characteristics of low-level waste.NUREG, BNL. Upton, N.Y.
Burns, M.E. 1988. Low-level radioactive waste regulations: science, pol-itics and fear. Chelsea, Mich.: Lewis Publishers.
Code of Federal Regulations. Title 10, Part 61.Code of Federal Regulations. Title 40, Part 261.Fortom, J.M., and D.J. Goode. 1986. Deminimis waste impacts analy-
sis methodology: impacts-BRC user’s guide and methodology for ra-dioactive wastes below regulatory concern. NUREG/CR-3585, NRC,Washington, D.C.
Fuchs, R.L., and S.D. McDonald. 1993. 1992 state-by-state assessmentof low-level radioactive waste received at commercial disposal sites.DOE/LLN-181. Springfield, Va.: NTIS.
Gershey, E.L., R.C. Klein, E. Party, and A. Wilkerson. 1990. Low-levelradioactive waste: from cradle to grave. New York, N.Y.: VanNostrand Reinhold.
National Low-Level Radioactive Waste Management Program (LL-WMP). 1982. The 1980 state-by-state assessment of low-level ra-dioactive waste received at commercial disposal sites. DOE/LLWMP-11T. Springfield, Va.: NTIS.
Nuclear Regulatory Commission (NRC). 1986. Guideline for wastes be-low regulatory concern (BRC). Federal Register 51, 30839.
Society of Nuclear Medicine (SNM). 1988. Nuclear medicine self-studyprogram 1. SNM, New York, N.Y.
©1999 CRC Press LLC
11.27HIGH-LEVEL RADIOACTIVE WASTE
High-level radioactive waste consists of spent fuel elementsfrom nuclear reactors, waste produced from reprocessing,and waste generated from the manufacture of nuclearweapons. All these wastes are highly regulated and con-trolled due to the dangerously high levels of radiation andthe security issues caused by their plutonium content. Strictlicensing requirements for the storage of spent nuclear fueland high-level radioactive waste are specified in 10 CFRPart 72.
Spent nuclear fuel has been withdrawn from a reactor,has undergone at least one year of decay since being usedas an energy source in a power reactor, and has not un-dergone chemical reprocessing. Spent fuel is normallystored on-site at nuclear power plants in an independentspent fuel storage installation (ISFSI). An ISFSI is definedin 10 CFR Part 72 as a complex designed and constructedfor the interim storage of spent nuclear fuel and other ra-dioactive materials associated with spent fuel storage.
Spent fuel reprocessing was discontinued in the UnitedStates in 1972, except for the DOE, which continues to re-process most of its spent fuel. France, Germany and severalother major nuclear power producers also reprocess theirspent fuel. Reprocessing improves the cost effectiveness of
nuclear power by recycling recovered uranium and pluto-nium. The reprocessing of spent fuel, using the PUREXprocess developed in the United States, involves dissolutionin large volumes of acid, liquid/liquid extraction, chemicalreduction, and precipitation (Lanham & Runiou 1949,Flagg 1961, Koch 1979). The highly radioactive waste pro-duced from reprocessing is classified by the NRC as a high-level radioactive waste or HLW in 10 CFR Part 72.
Spent fuel elements, HLW, and other highly radioac-tive wastes, such as transuranic wastes, require permanentcontainment. The disposal method must be designed to al-low decay of the longest-lived radionuclides present in sig-nificant amounts in the waste. This means a time periodof several hundreds of thousands of years.
Burial in engineered geological repositories is the onlycurrent option being seriously considered on a worldwidebasis. Except for TRU waste, no site has been selected inthe U.S., making it necessary for power plants and theDOE to continue storing waste on site. TRU waste gen-erated by the DOE from various weapons programs is be-ing disposed of at the waste isolation pilot plant (WIPP),a geological repository constructed in a bedded salt domein New Mexico (Kohn 1987).
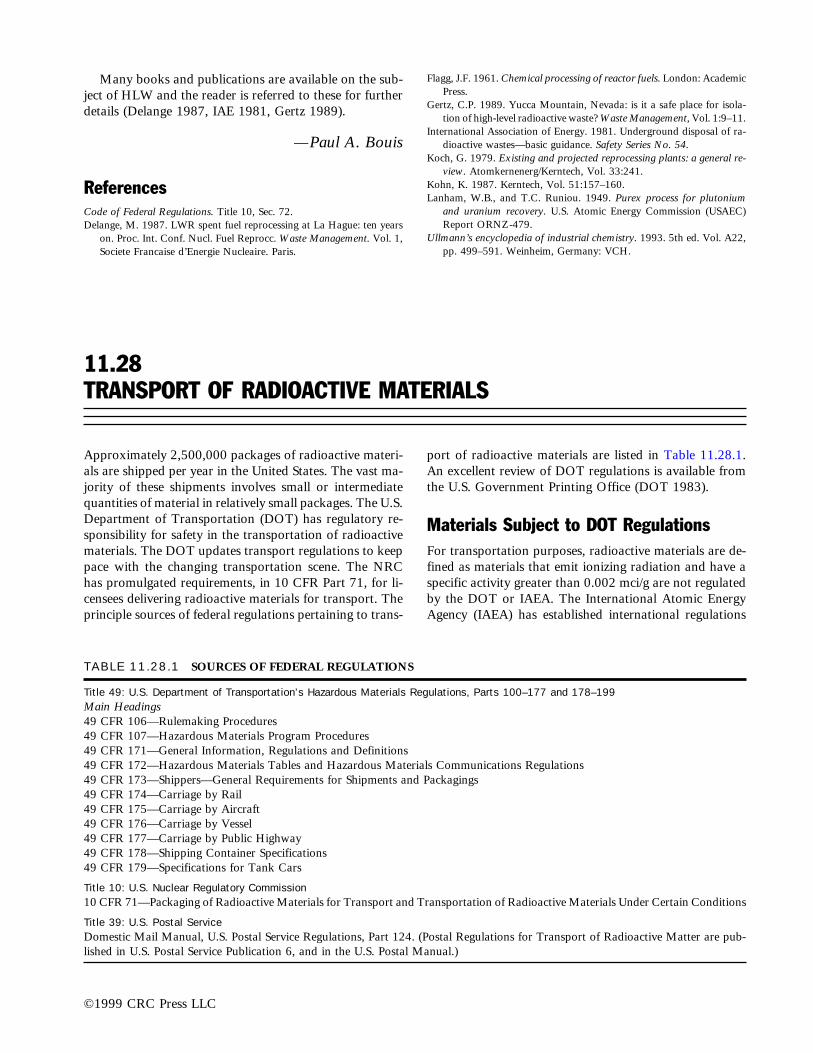
Many books and publications are available on the sub-ject of HLW and the reader is referred to these for furtherdetails (Delange 1987, IAE 1981, Gertz 1989).
—Paul A. Bouis
ReferencesCode of Federal Regulations. Title 10, Sec. 72.Delange, M. 1987. LWR spent fuel reprocessing at La Hague: ten years
on. Proc. Int. Conf. Nucl. Fuel Reprocc. Waste Management. Vol. 1,Societe Francaise d’Energie Nucleaire. Paris.
Flagg, J.F. 1961. Chemical processing of reactor fuels. London: AcademicPress.
Gertz, C.P. 1989. Yucca Mountain, Nevada: is it a safe place for isola-tion of high-level radioactive waste? Waste Management, Vol. 1:9–11.
International Association of Energy. 1981. Underground disposal of ra-dioactive wastes—basic guidance. Safety Series No. 54.
Koch, G. 1979. Existing and projected reprocessing plants: a general re-view. Atomkernenerg/Kerntech, Vol. 33:241.
Kohn, K. 1987. Kerntech, Vol. 51:157–160.Lanham, W.B., and T.C. Runiou. 1949. Purex process for plutonium
and uranium recovery. U.S. Atomic Energy Commission (USAEC)Report ORNZ-479.
Ullmann’s encyclopedia of industrial chemistry. 1993. 5th ed. Vol. A22,pp. 499–591. Weinheim, Germany: VCH.
©1999 CRC Press LLC
11.28TRANSPORT OF RADIOACTIVE MATERIALS
Approximately 2,500,000 packages of radioactive materi-als are shipped per year in the United States. The vast ma-jority of these shipments involves small or intermediatequantities of material in relatively small packages. The U.S.Department of Transportation (DOT) has regulatory re-sponsibility for safety in the transportation of radioactivematerials. The DOT updates transport regulations to keeppace with the changing transportation scene. The NRChas promulgated requirements, in 10 CFR Part 71, for li-censees delivering radioactive materials for transport. Theprinciple sources of federal regulations pertaining to trans-
port of radioactive materials are listed in Table 11.28.1.An excellent review of DOT regulations is available fromthe U.S. Government Printing Office (DOT 1983).
Materials Subject to DOT RegulationsFor transportation purposes, radioactive materials are de-fined as materials that emit ionizing radiation and have aspecific activity greater than 0.002 mci/g are not regulatedby the DOT or IAEA. The International Atomic EnergyAgency (IAEA) has established international regulations
TABLE 11.28.1 SOURCES OF FEDERAL REGULATIONS
Title 49: U.S. Department of Transportation’s Hazardous Materials Regulations, Parts 100–177 and 178–199Main Headings49 CFR 106—Rulemaking Procedures49 CFR 107—Hazardous Materials Program Procedures49 CFR 171—General Information, Regulations and Definitions49 CFR 172—Hazardous Materials Tables and Hazardous Materials Communications Regulations49 CFR 173—Shippers—General Requirements for Shipments and Packagings49 CFR 174—Carriage by Rail49 CFR 175—Carriage by Aircraft49 CFR 176—Carriage by Vessel49 CFR 177—Carriage by Public Highway49 CFR 178—Shipping Container Specifications49 CFR 179—Specifications for Tank Cars
Title 10: U.S. Nuclear Regulatory Commission10 CFR 71—Packaging of Radioactive Materials for Transport and Transportation of Radioactive Materials Under Certain Conditions
Title 39: U.S. Postal ServiceDomestic Mail Manual, U.S. Postal Service Regulations, Part 124. (Postal Regulations for Transport of Radioactive Matter are pub-lished in U.S. Postal Service Publication 6, and in the U.S. Postal Manual.)

and requirements (IAEA 1978). Materials not subject toDOT regulations may be subject to use or transfer regu-lations issued by the NRC or even the EPA.
REGULATIONS FOR SAFE TRANSPORT
A primary consideration in safe transportation of radio-active materials is the use of proper packaging for thespecific radioactive material to be transported. In order todetermine the packaging requirements, the following ques-tions must be answered.
1. What radionuclides are being shipped? 49 CFR§173.435 contains a listing of over 250 specific ra-dionuclides. Certain ground rules for dealing with un-listed or unknown radionuclides, or with mixtures ofradionuclides, appear in 49 CFR §173.433.
2. What quantity of the radionuclides is being shipped?Packaging requirements are related to the activity of thematerial.
3. Is the radionuclide material normal or special form?Special form refers to materials that, if released from apackage, would present a direct external radiation haz-ard, but not from contamination (Figure 11.28.1).Figure 11.28.2 details normal form materials that are,therefore, any radioactive materials that do not qualifyas special form.
QUANTITY LIMITS AND PACKAGING
The quantity or specific activity of a radioactive mate-rial determines the packaging requirements. The regu-lations use A1 and A2 values as points of reference forquantity limitations for every radionuclide. Every radio-nuclide is assigned an A1 and an A2 value. These twovalues, in curies, are the maximum activity of that radio-nuclide that may be transported in a Type A package(Figure 11.28.3). Table 11.28.2 gives examples of A1
and A2 values for some typical radionuclides. Type B
quantities (Figure 11.28.4) are defined as exceeding theappropriate A1 or A2 value. Type B packages, highwayroute controlled quantities, and fissile radioactive ma-terials are additionally controlled by the NRC regula-tions in 10 CFR Part 71.
©1999 CRC Press LLC
TABLE 11.28.2 TYPE A PACKAGE QUANTITYLIMITS FOR SELECTEDRADIONUCLIDES (ADDITIONALRADIONUCLIDES ARE LISTED IN 49CFR §173.435)
Symbol of Element and A1 (Ci) A2 (Ci)Radionuclide Atomic Number (Special Form) (Normal Form)
14C Carbon (6) 1000 60137Cs Cesium (55) 30 1099Mo Molybdenum (42) 100 20235U Uranium (92) 100 0.2226Ra Radium (88) 10 0.05201Pb Lead (82) 20 20
MassiveSolid Metal
High IntegrityEncapsulationas a Sealed Source
High Integrity Weld
Tantalum InnerCapsule
Radioisotope
High Integrity Welds
Stainless SteelOuter Capsule
FIG. 11.28.1 Special Form R.A.M. (49 CFR §§173.403[z] and173.469[a]). May present a direct radiation hazard if releasedfrom package, but presents little hazard due to contamination.Special form R.A.M. may be a natural characteristic, i.e., massivesolid metal, or acquired through high integrity encapsulation.
Waste Material in Plastic Bag
Liquid in Bottle WithinMetal Container
Gas in CylinderPowder in GlassorPlastic Bottle
FIG. 11.28.2 Normal Forms of Radioactive Materials 49 CFR§173.403(s). Normal form materials may be solid, liquid orgaseous and include material that has not been qualified as spe-cial form. Type A Package Limits are A2 Values.
Fiberboard Box Wooden Box Steel Drum
Typical SchemesDot Specification 7A
Type A Package
DOT 128
FIG. 11.28.3 Typical Type A Packaging. Package must with-stand normal conditions (49 CFR §173.465) of transport, with-out loss or dispersal of radioactive contents.
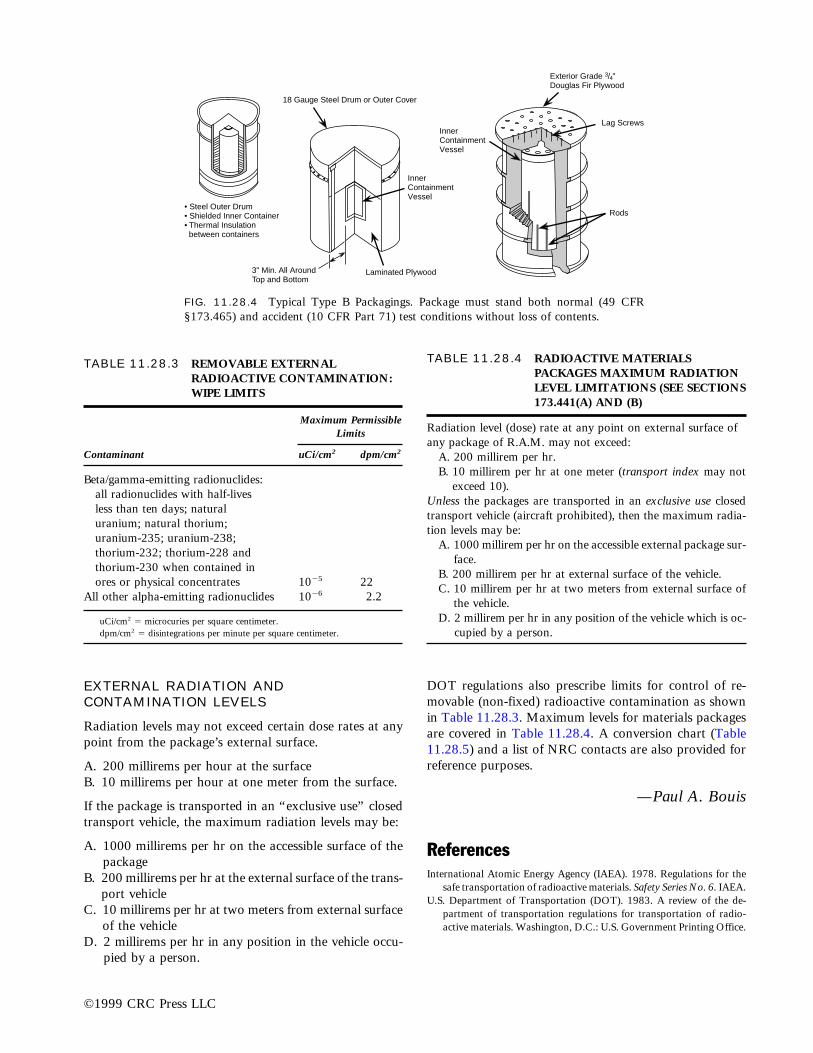
©1999 CRC Press LLC
EXTERNAL RADIATION ANDCONTAMINATION LEVELS
Radiation levels may not exceed certain dose rates at anypoint from the package’s external surface.
A. 200 millirems per hour at the surfaceB. 10 millirems per hour at one meter from the surface.
If the package is transported in an “exclusive use” closedtransport vehicle, the maximum radiation levels may be:
A. 1000 millirems per hr on the accessible surface of thepackage
B. 200 millirems per hr at the external surface of the trans-port vehicle
C. 10 millirems per hr at two meters from external surfaceof the vehicle
D. 2 millirems per hr in any position in the vehicle occu-pied by a person.
TABLE 11.28.3 REMOVABLE EXTERNALRADIOACTIVE CONTAMINATION:WIPE LIMITS
Maximum PermissibleLimits
Contaminant uCi/cm2 dpm/cm2
Beta/gamma-emitting radionuclides:all radionuclides with half-livesless than ten days; naturaluranium; natural thorium;uranium-235; uranium-238;thorium-232; thorium-228 andthorium-230 when contained inores or physical concentrates 1025 22
All other alpha-emitting radionuclides 1026 2.2
uCi/cm2 5 microcuries per square centimeter.dpm/cm2 5 disintegrations per minute per square centimeter.
TABLE 11.28.4 RADIOACTIVE MATERIALSPACKAGES MAXIMUM RADIATIONLEVEL LIMITATIONS (SEE SECTIONS173.441(A) AND (B)
Radiation level (dose) rate at any point on external surface ofany package of R.A.M. may not exceed:
A. 200 millirem per hr.B. 10 millirem per hr at one meter (transport index may not
exceed 10).Unless the packages are transported in an exclusive use closedtransport vehicle (aircraft prohibited), then the maximum radia-tion levels may be:
A. 1000 millirem per hr on the accessible external package sur-face.
B. 200 millirem per hr at external surface of the vehicle.C. 10 millirem per hr at two meters from external surface of
the vehicle.D. 2 millirem per hr in any position of the vehicle which is oc-
cupied by a person.
InnerContainmentVessel
Lag Screws
Exterior Grade 3/4"Douglas Fir Plywood
Rods
18 Gauge Steel Drum or Outer Cover
Laminated Plywood3" Min. All AroundTop and Bottom
• Steel Outer Drum• Shielded Inner Container• Thermal Insulation between containers
InnerContainmentVessel
FIG. 11.28.4 Typical Type B Packagings. Package must stand both normal (49 CFR§173.465) and accident (10 CFR Part 71) test conditions without loss of contents.
DOT regulations also prescribe limits for control of re-movable (non-fixed) radioactive contamination as shownin Table 11.28.3. Maximum levels for materials packagesare covered in Table 11.28.4. A conversion chart (Table11.28.5) and a list of NRC contacts are also provided forreference purposes.
—Paul A. Bouis
ReferencesInternational Atomic Energy Agency (IAEA). 1978. Regulations for the
safe transportation of radioactive materials. Safety Series No. 6. IAEA.U.S. Department of Transportation (DOT). 1983. A review of the de-
partment of transportation regulations for transportation of radio-active materials. Washington, D.C.: U.S. Government Printing Office.

©1999 C
RC
Press LL
C
TABLE 11.28.5 CONVERSION FACTORS FOR IONIZING RADIATION
SymbolsSymbol Expression Expression Special Using Symbol for Value offor in in Symbols Name for Special Conventional Conventional Conventional Unit
Quantity Quantity SI Units for SI Units SI Units Names Units Unit in SI Units
Conversion Between SI and Other UnitsActivity A 1 per second s21 becquerel Bq curie Ci 3.7 3 1010 BqAbsorbed dose D joule per kilogram J kg21 gray Gy rad rad 0.01 GyAbsorbed dose rate D
.joule per kilogram J kg21 s21 Gy s21 rad rad s21 0.01 Gy s21
secondAverage energy per W joule J electronvolt eV 1.602 3 10219 J
ion pairDose equivalent H joule per kilogram J kg21 sievert Sv rem rem 0.01 SvDose equivalent rate H
.joule per kilogram J kg21 s21 Sv s21 rem per second rem s21 0.01 Sv s21
secondElectric current I ampere A ampere A 1.0 AElectric potential U, V watts per ampere Wa21 volt V volt V 1.0 A
differenceExposure X coulomb per kilogram C kg21 roentgen R 2.58 3 1024 C kg21
Exposure rate X.
coulomb per kilogram C kg21 s21 roentgen R s21 2.58 3 1024 C kg21 s21
secondFluence f 1 per meter squared m22 1 per centimeter squared cm22 1.0 3 104 n22
Fluence rate F 1 per meter squared m22 s21 1 per centimeter squared cm22 s21 1.0 3 104 m22 s21
second secondKerma K joule per kilogram J kg21 gray Gy rad rad 0.01 GyKerma rate K
.joule per kilogram J kg21 s21 Gy s21 rad per second rad s21 0.01 Gy s21
secondLineal energy y joule per meter j m21 kiloelectron volt per keV mm21 1.602 3 10210 J m21
micrometerLinear energy transfer L joule per meter j m21 kiloelectron volt per keV mm21 1.602 3 10210 J m21
micrometerMass attenuation co- m/p meter squared per m2 kg21 centimeter squared per cm2 g21 0.1 m2 kg21
efficient kilogram gram

©1999 C
RC
Press LL
C
To Convert:From To Multiply By
becquerel (Bq) curie 2.7 3 10–11
curie (Ci) becquerel 3.7 3 1010
gray (Gy) rad 100rad (rad) gray 0.01sievert (Sv) rem 100rem (rem) sievert 0.010
Taken from the National Council on Radiation Protection and Measurements Report No. 82. “SI Units in Radiation Protection and Measurements”. Reproduced by permission of the copyright owner. Information regard-ing data in these tables is presented in the publication “NCRP Report No. 82” and is available from NCRP, 7910, Woodmont Avenue, Suite 1016, Bethesda, Maryland 20814.
(Continued on next page)TABLE 11.28.5 (Continued)
SymbolsSymbol Expression Expression Special Using Symbol for Value offor in in Symbols Name for Special Conventional Conventional Conventional Unit
Quantity Quantity SI Units for SI Units SI Units Names Units Unit in SI Units
Mass energy transfer me/p meter squared per m2 kg21 centimeter squared per cm2 g21 0.1 m2 kg21
coefficient kilogram gramMass energy absorption mea/p meter squared per m2 kg21 centimeter squared per cm2 g21 0.1 m2 kg21
coefficient kilogram gramMass stopping power S/p joule meter squared J m2 kg21 MeV centimeter squared MeV cm2 g21 1.602 3 10214 J m2 kg21
per kilogram per gramPower P joule per second J s21 watt W watt W 1.0WPressure P newton per meter N m22 pascal Pa torr torr (101325/760)Pa
squared
Conversion Between SI and Other UnitsRadiation chemical G mole per joule mol J21 molecules per 100 molecules 1.04 3 1027 mole J21
yield electron volts (100 eV)21
Specific energy z joule per kilogram J kg21 gray Gy rad rad 0.01 Gy
Converting SI Units/Non-SI Units

NRC Contacts for Further Information
Division of Low-Level Waste Management and Decommissioning NMSSU.S. Nuclear Regulatory Commission 1555 Rockville PikeRockville, MD 20852(301) 415-7000
Public AffairsU.S. Nuclear Regulatory Commission 1555 Rockville PikeRockville, MD 20852(301) 415-7715
State Liaison Officer Region I475 Allendale Road King of Prussia, PA 19406 (610) 337-5246
State & Government Affairs Staff Director Region II101 Marietta Street NW, Suite 2900 Atlanta, GA 30323 (404) 331-5597
State and Government Affairs Director Region III801 Warnerville RoadLaSalle, IL 60532-4351(630) 829-9500
State Liaison Officer Region IVParkway Central Plaza Building 611 Ryan Plaza Drive, Suite 400 Arlington, TX 76011-8064(817) 860-8100
State Liaison Officer Region V1450 Maria Lane, Suite 300 Walnut Creek, CA 94596-5368(510) 975-0200
BibliographyAmerican Society for Testing and Materials (ASTM). 1983. A standard
guide for examining the incompatibility of selected hazardous wastebased on binary chemical mixtures. Philadelphia, Pa.
Berlin, R.E., and C.C. Stanton. 1989. Radioactive waste management.New York, N.Y.: Wiley.
Blackman, W.C., Jr. 1992. Basic hazardous waste management. BocaRaton, Fla.: Lewis Publishers.
Chapman, N.A., and I.G. McKinley. 1987. The geological disposal ofnuclear waste. Chichester, Great Britain: John Wiley & Sons.
Chenoweth, D. 1995. DOT penalties for shipping container violations.Chemical Processing (April).
Cheremisinoff, P. 1990. Biological treatment of hazardous wastes,sludges, and wastewater. Pollution Engineering (May).
Cheremisinoff, P. 1992. A guide to underground storage tanks: evolu-tion, site assessment, and remediation. Englewood Cliffs, N.J.:Prentice-Hall, Inc.
David, M.L. and D.A. Cornwell. 1991. Introduction to environmentalengineering. New York, N.Y.: McGraw-Hill, Inc.
Gershey, E.L., R.C. Klein, E. Party, and A. Wilkerson. 1990. Low-levelradioactive waste: from cradle to grave. New York, N.Y.: VanNostrand Reinhold.
Gollnick, D.A. 1988. Basic radiation protection technology. 2nd ed.Pacific Radiation Corp. Altadena, Calif.
Greenberg, A.E., L.S. Clesceri, and A.D. Eaton. 1992. Standard meth-ods for the examination of water and wastewater. 18th ed. APHA.Washington, D.C.
Harris, M. 1988. Inhouse solvent reclamation efforts in Air Force main-tenance operations, of Hazardous waste minimization within theDepartment of Defense, edited by J.A. Kaminsky. Office of theDeputy Assistant Secretary of Defense (Environment) Washington,D.C.
International Atomic Energy Agency (IAEA). 1986. Assessment of theradiological impact of the transport of radioactive materials.Technical Document 398. Vienna, Austria.
International Atomic Energy Agency (IAEA). 1987. Safe management ofwastes from the mining and milling of uranium and thorium ores.Safety Series No. 85. Vienna, Austria.
International Atomic Energy Agency (IAEA). 1988. Immobilization oflow intermediate level radioactive wastes and polymers. TechnicalReport 289. Vienna, Austria.
International Atomic Energy Agency (IAEA). 1989. Nuclear power andfuel cycle: status and trends. Vienna, Austria.
Irvine, R.L. and L.H. Ketchum, Jr. 1988. Sequencing batch reactors forbiological waste water treatment. Critical Reviews in EnvironmentalControl, 18(4):255–294.
Leiter, J.L., ed. 1989. Underground storage tank guide. Salisbury, Md.:Thomas Publishing Group.
Maillet, J. and C. Sombret. 1988. High-level waste vitrification: the state-of-the-art in France. Waste Management 88(2):165–172.
Mattus, A.J., R.D. Doyle, and D.P. Swindlehurst. 1988. Asphalt solidi-fication of mixed wastes. Waste Management 89(1):229–234.
Murray, R.L. 1989. Understanding radioactive waste. 3rd ed. Columbus,Oh.: Battelle Press.
National Council on Radiation Protection and Measurements (NCRP).1987. Ionizing radiation exposure of the population of the UnitedStates. NCRP Report No. 93. Bethesda, Md.
National Low-Level Waste Management Program. 1993. The 1992 state-by-state assessment of low-level radioactive wastes received at com-mercial disposal sites. DOE/LLW-181. Washington, D.C.
Party, E.P., and E.L. Gershey. 1989. Recommendations for radioactivewaste reduction in biomedical/academic institutions. Health Physics56(4):571–572.
Snelgrove, W.L. and B.O. Paul. 1995. The chemical industry and tankcar development. Chemical Processing (April).
Theodore, L. and Y.C. McGuinn. 1992. Pollution Prevention. New York,N.Y.: Van Nostrand Reinhold.
Ullmann’s encyclopedia of industrial chemistry, 5th ed. 1993. Vol.A22:499–591. Weinheim, Germany: VCH.
United Nations Scientific Committee on the Effects of Atomic Radiation(UNSCEAR). 1977. Sources and effects of ionizing radiation. NewYork, N.Y.
U.S. Department of Transportation (DOT). 1983. A review of theDepartment of Transportation regulations for transportation of ra-dioactive materials. Washington, D.C.
©1999 CRC Press LLC

U.S. Environmental Protection Agency (EPA). 1985. Minimum technol-ogy guidance on double liner systems for landfills and surface im-poundments, design, construction, and operation. Report No. PB87-151072. National Technical Information Service. Springfield, Va.
———. 1986. RCRA orientation manual. Office of Solid Waste.Washington, D.C.
———. 1987. Underground storage tank corrective action technologies.EPA 625–6–87–015. Washington, D.C.
———. 1987. Handbook—Groundwater. EPA 625–6–87–016. Officeof Research and Development. Cincinnati, Oh.
———. 1987. A compendium of technologies used in the treatment ofhazardous wastes. EPA 625–8–87–014 (September).
———. 1988. Musts for USTs. Report No. 530–UST–88–008. Office ofUnderground Storage. Washington, D.C. (September).
———. 1989. Hazardous waste incineration measurement guidancemanual. EPA 625–6–89–021 (June).
———. 1990. Guidance on PIC controls for hazardous waste incinera-tors. EPA 625–530–SW–90–040 (April).
———. 1990. Engineering Bulletin: Soil washing treatment. Office ofResearch and Development. Cincinnati, Oh. (September).
———. 1990. RCRA orientation manual. 1990 edition. Superintendentof Documents. Washington, D.C.: U.S. Government Printing Office.
———. 1992. A citizen’s guide to soil washing. EPA 524–F–92–003.Office of Solid Waste and Emergency Response. Washington, D.C.(March).
Wagner, H.N., and L.E. Ketchem. 1989. Living with radiation.Baltimore, Md.: The Johns Hopkins University Press.
Wentz, C. 1989. Hazardous waste management. McGraw-Hill, Inc.
©1999 CRC Press LLC