chapter 11: geochemistry of the solid earth i: the mantle
TRANSCRIPT
W . M W h i t e G e o c h e m i s t r y
Chapter 11: The Mantle and Core
474 November 25, 1997
Chapter 11: Geochemistry of the Solid Earth I: TheMantle and Core
Introductionhough sizable pieces of mantle occasionally crop out on the EarthÕs surface as alpine massifs orophiolites, and small pieces, xenoliths, are occasionally brought to the surface by volcaniceruptions, much of what we know about the mantle has been deduced indirectly. Indirect
methods of study include determination of geophysical properties such as heat flow, density andseismic velocity. Another indirect method of study is examination of volcanic rocks produced by par-tial melting of the mantle. Finally, the composition of chondrites is an important constraint on thecomposition of the mantle.
The mantle was once viewed as being homogeneous, but we now realize that the chemistry of themantle is heterogeneous on all scales. On a large scale, the mantle appears to consist of a number ofreservoirs that have complex histories. The best evidence for this large-scale heterogeneity comesfrom trace element and isotope ratio studies of volcanic rocks, but there is also evidence that the ma-jor element composition of the mantle varies. While trace elements may vary by an order of magni-tude or more, the major element variations are much more subtle, just as they are in volcanic rocks andin the crust. Isotope studies have proven tremendously valuable in understanding the mantle for sev-eral reasons. First, unlike trace element and major element concentrations, isotope ratios do notchange during the magma generation process (except by mixing of the magma with other componentssuch as assimilated crust). Second, radiogenic isotope ratios provide time-integrated informationabout the parent/daughter ratios, and therefore allow inferences about the history of the mantle.
Composition of the Earth’s MantleTable 11.1 lists the relative masses of the various shells of the Earth. From a geochemical per-
spective, these are the Earth's major chemical reservoirs. The mantle is by far the largest single res-ervoir, and constitutes over 99% of the mass of the silicate Earth, the mass of the crust being less than1%. The crust has apparently been created from the mantle through partial melting over geologictime. For the major elements, this process of crust formation does not change the composition of themantle on the whole because the volume of the crust is so small (but extraction of partial melts un-doubtedly has affected the major element composition of the mantle locally). With the exception ofhighly incompatible elements, which can be highly concentrated in the crust, and siderophile andpossibly chalcophile elements, which are concentrated in the core, major lithophile elements arepresent in the mantle in the same proportions as in the Earth as a whole. Since we assume that chon-dritic meteorites are a good representation of Solar System composition, we naturally want to com-pare the composition of the mantle to that of chondrites. Thus the composition of meteorites is animportant constraint on the composition of the mantle and the Earth as a whole.
Cosmochemical Constraints on the Earth’s Composition
In Chapter 10 we considered the composition of that part of the Solar System accessible to sam-pling: meteorites, the solar surface (deduced from optical spectra and solar wind particles), and theMoon. The meteorite data provide first order constraints on the formation and composition of theEarth. Two important cosmochemical assumptions guide our thinking about the composition of theEarth: (1) the entire solar system formed more or less simultaneously from one gaseous, dusty nebula,(2) the composition from which the solar system formed was similar to that of CI chondrites exceptfor the most volatile elements (e.g., H, N, noble gases). The last statement should not be construed tomean that all bodies that formed from this nebula are of chondritic composition.
T
W . M W h i t e G e o c h e m i s t r y
Chapter 11: The Mantle and Core
475 November 25, 1997
Thus far there is essentially no evidence to contradict the first assumption (provided we interpretÒsimultaneousÓ in a geologic sense; i.e., this process may have taken up to 100 million years); the sec-ond assumption certainly holds to a first approximation, beyond that there is some uncertainty. Indefense of it, however, we should emphasize the isotopic homogeneity of the solar system. The iso-topic anomalies we have discussed previously are very much the expectation to the rule and serve toemphasize the general homogeneity of the solar system (except, of course, for oxygen). The implica-tion is that the presolar nebula was well mixed. We can reasonably conclude that it was in i t ia l lychemically homogeneous as a result.
In summary, we can draw the following conclusions relevant to the formation and composition ofthe Earth from cosmochemistry:
1. The material from which the solar system formed was of CI chondritic composition (plus gases).2. Despite (1), the composition of bodies formed from this nebula is variable. This is apparent
from the composition of chondrites as well as from density variations of the planets.3. Formation of planetary bodies begin shortly ( a few million years at most) after newly synthe-
sized elements were added to the solar nebula (as evidenced by the oldest ages from the Moon anddifferentiated meteorites).
4. Iron meteorites clearly reflect segregations of metallic liquid from material of approximatelychondritic composition. Certainly the existence of stony-irons, which are irons with silicate inclu-sions, demonstrates that segregated silicate and iron metal fractions existed in the parent bodies.Since the ages of these meteorites arenearly indistinguishable from those ofchondrites, it suggests core formation inplanets got under way very early. In themost likely case, cores had already seg-regated in the planetismals and plane-tary embryos from which the planetsformed.
5. The Moon seems to have had amagma ocean. The Earth may wellhave had one as well.
Upper Mantle Composition
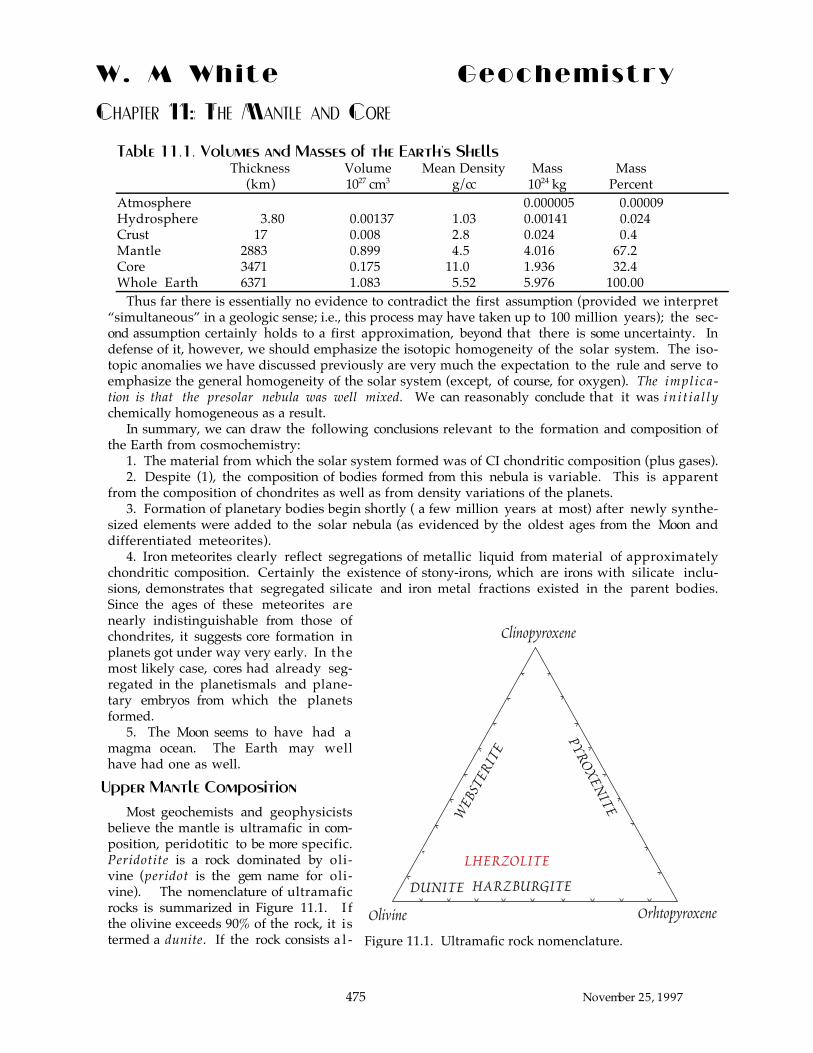
Most geochemists and geophysicistsbelieve the mantle is ultramafic in com-position, peridotitic to be more specific.Peridotite is a rock dominated by oli-vine (peridot is the gem name for oli-vine). The nomenclature of ultramaficrocks is summarized in Figure 11.1. I fthe olivine exceeds 90% of the rock, it istermed a dunite. If the rock consists a l -
Table 11.1. Volumes and Masses of the Earth's ShellsThickness Volume Mean Density Mass Mass
(km) 1027 cm3 g/cc 1024 kg PercentAtmosphere 0.000005 0.00009Hydrosphere 3.80 0.00137 1.03 0.00141 0.024Crust 17 0.008 2.8 0.024 0.4Mantle 2883 0.899 4.5 4.016 67.2Core 3471 0.175 11.0 1.936 32.4Whole Earth 6371 1.083 5.52 5.976 100.00
Olivine Orhtopyroxene
Clinopyroxene
HARZBURGITEDUNITE
LHERZOLITE
WEB
STER
ITE
PYROXENITE
Figure 11.1. Ultramafic rock nomenclature.

W . M W h i t e G e o c h e m i s t r y
Chapter 11: The Mantle and Core
476 November 25, 1997
most exclusively of olivine and orthopyroxene,it is called a harzburgite. A websterite is arock consisting almost exclusively of olivineand clinopyroxene. A rock consisting of over90% pyroxene is a pyroxenite (clinopyroxeniteor orthopyroxenite as the case may be; a py-roxenite is an ultramafic rock, but not a peri-dotite). Rocks with substantial amounts ofboth pyroxenes as well as olivine arelherzolites. This can be prefaced by the nameof the Al-bearing phase, e.g., spinellherzolite, whose nature depends on pressure.In the upper mantle, olivine is thought to bethe dominant mineral, followed by orthopy-roxene, clinopyroxene, and an Al-bearingphase, which can be plagioclase, spinel, orgarnet, depending on the pressure. The up-per mantle is thought to be dominantlylherzolitic. An alternative term is pyrolite(pyroxene-olivine rock), coined by A. E.Ringwood. Pyrolite, however, is associatedwith a specific composition (e.g., Table11.2), though this composition has been re-vised numerous times.
Any estimate of upper mantle composi-tion must satisfy a number of constraints.First, it should match the composition ofdirect mantle samples such as xenoliths(Figure 11.2). Second, it must yield basaltupon melting. Third, it must have seismicvelocities (Figure 11.3) and densities(Figure 11.4) matching those observed. F i -nally, it should have an approximatelychondritic composition (as we shall see, theupper mantle does not appear to be exactlychondritic). A lherzolitic or pyrolitic com-position appears to fit these constraints.However, lherzolitic compositions are notunique in meeting these some of these con-straints, and some have argued that themantle, or at least the upper mantle, isdominantly eclogitic. Eclogite is a rock con-sisting almost exclusively of garnet andomphacitic pyroxene (i.e., Na-, Al-rich).This is the mineralogy of basalt at highpressure. It was once argued by some that the upper mantle composition was closer to eclogite thanperidotite, because it seemed to fit seismic velocity distribution better. But the idea was not ac-cepted, primarily because it failed to match the chondritic composition sufficiently well, and because
2 - 5
21 - 40
>40
6 - 20
Olivine Orthopyroxene
ClinopyroxeneNumber of Samples
X
X
X
X
X
X XX
Figure 11.2. Abundances of modal mineralogy inxenoliths from Kilbourne Hole, NM.
0 1000 2000 3000
0 50 100 150
Depth, km
Lower Mantle Core
Upp
er M
antle
S-Wave
P-Wave
4
6
8
10
12
14
Pressure, GPa
Veloc
ity, k
m/s
ec
Trza
nsiti
on Z
one
Figure 11.3. Mantle seismic velocities.

W . M W h i t e G e o c h e m i s t r y
Chapter 11: The Mantle and Core
477 November 25, 1997
eclogites are considerably rarer as xenoliths than peridotites. Also seismic anisotropy* observed insome parts of the upper mantle suggests the mantle is too rich in olivine to be eclogite. However, inthe last decade Don Anderson (e.g., Anderson, 1989b) has argued for an upper mantle consisting of oli-vine bearing eclogite, for which he coined the term piclogite . The eclogite, which he argues wasproduced by crystal accumulation in a primordial magma ocean, is the source of MORB in his model.This idea has not been particularly well received by geochemists, perhaps even less so by petrolo-gists.
Most studies rely on the composition of mantle xenoliths to estimate mantle compositions (thecomposition of peridotite massifs, which also represent mantle samples, but these have inevitablybeen affected by secondary processes). However, while formation of the crust and other processeshave not affected the major element composition of the bulk mantle, the compositions of individualxenoliths often have been affected by igneous processes. Despite this, xenoliths provide evidencethat the upper mantle differs in composition from chondrites. Whether the estimated upper mantlecomposition is also the composition of the entire mantle depends on whether the mantle is chemi-cally layered. This is an important and unresolved question, and one to which we shall return.
Table 11.2 compares several estimates for the major and minor element composition of the mantlemade over the last decade with the composition of CI chondrites after subtracting the most volatileelements in the latter (column 1). Clearly chondrites are much richer in siderophiles (e.g., Fe, Ni )than all these estimated mantle compositions. The chondritic composition matches the mantle com-position much better after a sufficient amount of the siderophile elements has been removed to form
* Seismic anisotropy refers to the case where seismic waves travel faster in one direction than an other.This can ultimately be related to crystalographic properties. In olivine, seismic velocities are fasteralong one crystallographic axis than the others. Since garnet has a cubic (isotropic) structure, seismicvelocity is equal in all crystallographic directions, as is the velocity of light. Seismic anisotropy canonly occur only when there is some tendency for crystallographic axes of individual mineral grains to bealigned parallel. This is thought to arise in the mantle from flow associated with convection. Piclogite comes from combining picrite, which is an olivine-rich basalt, and eclogite. Piclogite wouldbe the high pressure equivalent of picrite.
MgSiO3Al2O3 s.s.
Moho
Low Velocity Layer
Phase Transitions
Ca, Fe garnet perovskite structurebeta phase Olivine
Mg garnet ilmenite structureMgSiO3+ MgO + FeO
pyroxene garnet structureolivine beta phase Olivine
spinel (Mg,Fe)2SiO4
3.4 3.6 3.8 4.0 4.2 4.4
800
600
400
200
0
1 atm Density, g/cc
spinel (Mg,Fe)2SiO4
Dep
th, k
m
Figure 11.4. Phase assemblages and 1 atm density of the mantle.

W . M W h i t e G e o c h e m i s t r y
Chapter 11: The Mantle and Core
478 November 25, 1997
the EarthÕs core. However, even after removing the siderophile and highly volatile elements, thereare significant differences between the apparent composition of the mantle and chondrites.
First, the mantle is depleted in the alkali elements (e.g., K and Na in Table 11.2). There are sev-eral lines of evidence for this depletion of alkali elements. The depletion in moderately volatile el-ements is also apparent by comparing Sr isotope ratios of the mantle and chondrites, as Gast demon-strated in 1960. 87Sr/86Sr ratios in the mantle imply Rb/Sr ratios more than an order of magnitudelower than chondritic. Some of the Rb depletion of the mantle may be explained by extraction of theRb into the crust. Indeed more than half the Earth's Rb may be in the crust. However, the terrestrialRb/Sr ratio appears to be nearly an order of magnitude lower than chondritic (0.03 vs. 0.25) evenwhen crustal Rb is considered. Independent of Sr isotope considerations, a number of other studieshave demonstrated depletion of K, Rb, and Cs in the Earth.
Table 11.2. Comparison of Estimated Silicate Earth CompositionsCI CI Chondritic Hart & Zindler Ringwood3 McDonough & Sun4 Allegre et al.5
Chondrites Mantle & Core1 LOSIMAG2 Pyrolite Pyrolite PRIMA
SiO2 22.77 49.52 45.96 44.76 45.0 46.12Al2O3 1.64 3.56 4.06 4.46 4.45 4.09FeO 24.49 7.14 7.54 8.43 8.05 7.49MgO 16.41 35.68 37.78 37.23 37.8 37.77CaO 1.30 2.82 3.21 3.60 3.55 3.23Na2O 0.67 0.292 0.332 0.61 0.36 0.36K2O 0.067 0.028 0.032 0.029 0.029 0.034Cr2O3 0.39 0.412 0.468 0.43 0.384 0.38MnO 0.256 0.115 0.130 0.14 0.135 0.149TiO2 0.073 0.159 0.181 0.21 0.20 0.18NiO 1.39 0.244 0.277 0.241 0.25 0.25CoO 0.064 0.012 0.013 0.013 0.013 0.07P2O5 0.274 0.018 0.019 0.015 0.021Sum 69.79 100.0 100.0
HVE6 30.21 30.21 30.21MVE7 1.258 1.258SVE8 5.33Fe 74.44 85.62 79.39N i 4.53 5.16 4.87Co 0.2081 0.237 0.253S 2.3O 20.81 8.99 4.10Core Sum 100.0 100.0Total 99.9 99.7 99.4
1removing HVE, MVE and siderophiles and some oxygen from mantle to form core; renormalizing silicate mantle andcore separately. Hart and Zindler (1986)2Low-Si-Mg Earth with siderophiles and some oxygen removed from mantle to form core; renormalizing silicate man-tle and core separately. Hart and Zindler (1986)3Estimated Primitive Upper Mantle Composition of Ringwood (1991)4Esitmated Primitive Mantle Composition from McDonough and Sun (1995)5Primitive Mantle (ÒPRIMAÓ) of Allegre et al. (1995)6 HVE = Highly Volatile Elements, includes H2O, S, C, organics, etc.7 MVE = Moderately Volatile Elements, includes Na, K, P, Cr, Mn8 SVE = Slightly Volatile Elements, Si and Mg

W . M W h i t e G e o c h e m i s t r y
Chapter 11: The Mantle and Core
479 November 25, 1997
This depletion is thought to encompass all the moderately volatile elements (see Figure 9.29) asall appear to be depleted in the mantle. Many of the moderately volatile elements are siderophileor chalcophile, so their depletion in the mantle may also reflect extraction into the core.
The EarthÕs depletion in moderately volatile elements is not entirely surprising, given that i t ,along with the other terrestrial planets, is obviously depleted in the atmophile elements. Since thedepletion in the highly volatile elements is a feature shared by all the terrestrial planets, it isprobably due to high temperatures in the inner solar nebula during the initial stages of accretion.Thus these elements probably did not condense and were not accreted to the planetismals that ulti-mately formed the terrestrial planets. An enhanced solar wind during the T-Tauri phase of the Sunmight also have caused loss of volatiles that were accreted. Finally, high temperatures achievedduring formation of the Earth (due to re-lease of gravitational energy), particu-larly as a result of the giant impact,probably contributed to volatile loss.
The depletion of the Earth in volatileelements is well established, and morerecent work has focused on comparing therelative concentrations of remaining ma-jor elements, particularly Mg, Si, Ca, andAl in the mantle with those of CI chon-drites.
Table 11.2 reflects a general agreementthat the upper mantle is depleted in sil i-con relative to a ÔchondriticÕ upper man-tle. This depletion can be demonstratedin several ways, but we will consider onlythe approach of Hart and Zindler (1986).Figure 11.5a shows the Mg/Si ratio plot-ted against the Nd/Si ratio for mantlexenoliths and various classes of chon-dritic meteorites. The xenoliths andchondrites form 2 distinct arrays. Hartand Zindler argued that the ÒmeteoritearrayÓ reflects fractionation during proc-esses occurring in the solar nebula or dur-ing planet formation (e.g., volatiliza-tion), whereas the Òterrestrial arrayÓ re-flects processes occurring in the EarthÕsmantle such as partial melting. For ex-ample, the dashed line shows that ex-traction of a partial melt would drivecomposition off the meteorite array inthe general trajectory of the terrestrialarray. Since the bulk mantle compositionshould not have been affected by crustformation, Hart and Zindler, followingearlier work by Jagoutz et al. (1979), rea-soned that it should lie at the intersec-tion of the meteorite and terrestrial ar-rays. A similar sort of analysis can bedone with Al/Si (Figure 11.5b) and Ca/Si
G
.
0.6
0,8
1.0
1.2
0.04 0.06 0.08 0.10 0.12
C1LL
HLCM2
CV-CO
E
Al/Si
1510
5 2 1
0.6
0,8
1.0
1.2
C1H,
L
CM2 CV-CO
E
Meteorite Array
1.4
0 0.02 0.04 0.06Nd/Si (ppm/%)
Terrestrial Array
a
b
Meteorite Array
Terrestrial Array
Mg/
SiM
g/Si
G
G
G
GGG
G
G
G G
G
G
G
G
G
G
G
G
G
GG
GG
G
G
G GG
G
G
G G GG
Figure 11.5. a.) Variation of Mg/Si as a function ofNd/Si in terrestrial mantle xenoliths and meteorites.b.) Variation of Mg/Si as a function of Al/Si in terres-trial mantle xenoliths and meteorites. The data suggestthe Earth is depleted in Mg and Si relative tochondrites. Dashed line is the trajectory of residualmantle compositions following melt extraction with the% melt extracted shown by the tic marks. After Hartand Zindler (1986).

W . M W h i t e G e o c h e m i s t r y
Chapter 11: The Mantle and Core
480 November 25, 1997
ratios. Using this approach, Hart and Zindler concluded that the upper mantle, is depleted in Si. I fthe mantle is not chemically layered, then the entire Earth must be depleted in Si and Mg relative tochondrites. Ringwood (1989) argued that the depletion in Si is a general feature of the inner solarsystem, and reflects the more volatile nature of SiO compared to the gaseous phases of Al, Mg, Ca,and Fe.
Though it is less obvious, all the estimated mantle compositions in Table 11.2 also have highabundances of the most refractory elements, Ca, Al, and Ti, relative to Mg. For example, the chon-dritic Al/Mg ratio is 0.123 whereas estimates of upper mantle Al/Mg ratio ranges from 0.133 (Allegreet al., 1985) to 0.147 (Ringwood, 1991). Estimates of the upper mantle Ca/Mg ratio range from 0.101(Hart and Zindler, 1986; Allegre et al., 1995) to 0.115 (Ringwood, 1991), and are all higher than thechondritic value of 0.094. Assuming these estimates are correct, the upper mantle appears to be en-riched in the highly refractory elements by 7 to 50%. If the mantle is not chemically zoned, then theEarth as a whole is enriched in the highly refractory elements.
Palme and Nickel (1985) argued that the Ca/Al ratio of the mantle is also non-chondritic (0.887for the upper mantle vs. 0.766 for chondrites). Since Ca and Al are both among the most refractoryelements whose relative abundances is uniform in all classes of chondrites (despite variations inabundances of more volatile elements), it would be surprising indeed if the Ca/Al ratio of the Earthas a whole were not chondritic. Palme and Nickel argued that the difference between their esti-mated upper mantle Ca/Al ratio and the chondritic one reflects early mantle differentiation, per-haps during crystallization of a magma ocean, that resulted in a high Ca/Al ratio in the upper man-tle and a low Ca/Al ratio in the lower mantle. Hart and Zindler (1986) disputed the high Ca/Al es-timated by Palme and Nickel, arguing it reflects an overabundance of clinopyroxene in the xenolithsanalyzed by Palme and Nickel. The dispute points out the difficulties in using xenoliths, all ofwhich have been affected by various processes, to estimate upper mantle compositions. Most recentestimates of the silicate Earth composition have Ca/Al values close to the chondritic one (0.76 to0.78).
Phase Transitions in theMantle
The mineral assemblage of themantle changes as pressure in-creases. Understanding thephase relationships in the man-tle is important for two reasons.First, seismic velocities and den-sities are the most important con-straint on the bulk composition ofthe mantle, and these depend onthe mineral assemblage. Second,the pressure at which phasetransitions occur is compositiondependent, so that the depths a twhich phase transitions occur, asreflected by changes in seismicvelocity, constrain the composi-tion of the mantle.
In the upper 200 km or so, theonly important phase changes arethe nature of the aluminousphase. This changes from plagio-clase to spinel (MgAl2O4) at about
Plagio-
Perid-otite
Spinel
GarnetPeridotite
Perid-otite
Ol + Al-Cpx + Al-Opx
0.1 0.2 0.3 0.4 0.5 0.6 0.7
500
1000
1500
50 100 150 200
Pressure, GPa
Depth, Km
Solidus Oceanic Geotherm
Precambrian Shield Geotherm
Tem
pera
ture
, °C
Figure 11.6. Upper mantle phase diagram.

W . M W h i t e G e o c h e m i s t r y
Chapter 11: The Mantle and Core
481 November 25, 1997
30 km depth, and from spinel to garnet at 60 to 90 kmdepth, depending on composition and temperature.
The garnet peridotite assemblage remains stable todepths of about 300 km. At this depth, appreciableamounts of pyroxenes begin to dissolve in garnet, form-ing a solid solution with the general compositionM2(MSi,Al2)Si3O12 where M is Mg, Fe, or Ca. This gar-net, called majorite, differs from those found at lowerpressure in that up to a quarter of the silicon atoms arein octahedral coordination (i.e., surrounded by 6 oxygensrather than 4). The octahedral coordination is favoredbecause the anions such as oxygen are more compressiblethan are cations such as silicon. When compressed,more oxygens can be packed around each silicon atom.This phase change is a gradual one, with complete con-version of pyroxenes to majorite at about 460 km depth(Figure 11.7). The phase change results in a roughly10% increase in density of the ÒpyroxeneÓ component.
The Transition Zone
Between 400 and 670 km depth seismic velocities in-crease more rapidly than elsewhere (Figure 11.3) and
this depth interval is often called the transition region. At about 400 km, or 14 GPa, olivine under-goes a structural change from the low pressure, or α form, to the β form. In contrast to the pyroxene-tomajorite phase change, this phase boundary is relatively sharp, with a transition interval of 9-17km. The α to β transition results in an 8% increase in density.
At about 500 km depth or so, olivine undergoes a further structural change to the γ-form. The struc-ture is similar to that of MgAl2O4 spinel, and this phase is sometimes, somewhat confusingly, re-ferred to simply as spinel, though the name ringwoodite, has been applied to γ-olivine found inshocked meteorites. The change from β to γ-olivine is thought to be more gradual than the α-β transi-tion, occurring over a depth interval of 30 km, and involves only a 2% increase in density. In both theβ and γ phases silicon remains in tetrahedral coordination.
Within the transition zone, some of the Mg and Ca in majorite begin to exsolve to form CaSiO3 inthe perovskite structure and MgSiO3 in the ilmenite structure. The proportion of CaSiO3 perovskiteincreases with depth until majorite disappears at about 720 km. MgSiO3 ilmenite persists only to 660km.
A very sharp and large increase in seismic velocity occurs at around 660à km depth, and is calledthe 660 seismic discontinuity¤. This depth marks the beginning of the lower mantle. Over the yearsthere has been considerable debate as to whether this discontinuity is a chemical boundary or aphase change. There is now complete agreement that it is primarily due to a phase change, thoughdebate continues whether it might also be a chemical boundary (a question discussed below). At thisdepth γ-olivine disproportionates to form (Mg,Fe)SiO3 in the perovskite structure and (Mg,Fe)Omagnesiow�stite, with the Fe going preferentially in the magnesiow�stite. This phase change re-sults in a density increase of about 11%. The (Mg,Fe)SiO3 perovskite has the chemical stoichiometryof pyroxene, but the silicons are in octahedral coordination. The structure, illustrated in Figure 11.8,is similar to that of the Òhigh-temperatureÓ cuprate superconductors discovered in the 1980Õs.
à The exact depth of the transition has been debated and maybe anywhere between 650 and 690 km. Infact, the depth at which the transition occurs could vary due to lateral variations in temperaturewithin the mantle, or because of mantle convection. ¤ This is also variously known as the 650 discontinuity and the 670 discontinuity.
Mag
nesio
-wü
stite
Volume Fraction0 0.2 0.4 0.6 0.8 1.0
100
200
300
400
500
600
700
800
Dep
th, k
m
α-Olivine(Mg,Fe)2SiO4
β-(Mg,Fe)2SiO4
γ-(Mg,Fe)2SiO4G
arne
tMajorite
Opx+
Cpx
Mg-PerovskiteCa
-Pvs
k
Ilm
400 km Discontinuity
670 km Discontinuity
900
Figure 11.7. Mineral assemblages in theupper 1000 km of the mantle. FromRingwood (1991).

W . M W h i t e G e o c h e m i s t r y
Chapter 11: The Mantle and Core
482 November 25, 1997
High pressure experiments carried out with the dia-mond anvil show that the transition is quite sharp, occur-ring within a pressure interval of 0.15 GPa at 1600¡ C. Thetransition has a negative Clapeyron slope (P (GPa) = 27.6Ñ 0.0025 T (¡C); e.g., Chopelas, et al., 1994), so that i twill occur at somewhat shallower depth in hot regions,such areas of mantle upwelling, and at greater depth incooler regions, such as subducted lithosphere, though sincethe Clapeyron slope is shallow, the effect is small. Theaffect of these differences is to oppose motion across theboundary, and therefore to stablize any chemical differ-ences that might exist between the upper and lower man-tle. To understand this, consider a sinking subductedlithospheric slap. Such slabs sink through the uppermantle because they are denser than surrounding mantle.LetÕs arbitrarily suppose that it is 200¡ cooler than sur-rounding mantle. As a result it will undergo the γ-ol i -vineÐperovskite phase change at about 0.5 GPa greaterpressure (15 km or so deeper) than surrounding mantle. Asthe slab penetrates to below 660 km, its density contrastbetween the slab and surrounding mantle will be reduced,because γ-olivine is the principal phase in the slabwhereas Mg-perovskite is the major phase in the surrounding mantle. The reduced density contrastresults in less gravitation energy to cause further sinking of the slab. For similar reasons, the phasetransition will also tend to oppose the motion of rising hot mantle, mantle plumes for example. In-deed, there is seismological evidence that the discontinuity is deflected downward under subductionzones. Though the negative Clapeyron slope opposes motion across the boundary, it is probably notsufficient to prevent it entirely unless the 660 discontinuity is also a chemical boundary.
As we noted above, there is no question that phase transitions are primarily responsible for the in-crease in seismic velocity observed in the transition zone (Figure 11.3). Anderson (1989) argues, how-ever, that change in seismic velocity at 400 km is smaller than what should occur in an olivine-rich(i.e., lherzolitic) mantle, and therefore that the upper mantle must be piclogitic rather than lher-zolitic. Ringwood (1991) argued that, because of the negative Clapeyron slope, many slabs are notdense enough to sink through the 660 discontinuity and therefore pile up above it. In his view, thethere is a layer of 50 km thickness or so of accumulated oceanic crust above the 670 discontinuity.Resolution of these questions requires better data on the elastic properties of phases within the tran-sition zone.
Composition of the Lower MantleThe lower mantle, the region between the 660 km seismic discontinuity and the core-mantle bound-
ary at 2900 km, is substantially less accessible to study than is the upper mantle. It composition mustbe inferred indirectly. The only direct constraint on its composition is its seismic properties. The as-sumption that the Earth is approximately chondritic forms another constraint. It is generally agreedthat the lower mantle is grossly similar in compositional to the upper mantle, i.e., composed domi-nantly of SiO2, MgO, and FeO with lesser amounts of CaO, Al2O3, TiO2, etc. However, there is sub-stantial disagreement as to its precise composition, in particular whether it is richer in FeO and SiO2
than the upper mantle.Perovskite and magnesiow�stite appear to remain the principal phases throughout the lower
mantle. Perovskite constitutes about 80% of the lower mantle, and thus is the most abundant mineralin the Earth. The magnesiow�stite/perovskite partition coefficient for Fe decreases with increasingpressure, so that the proportion of Fe in perovskite should increase somewhat with depth up to about
Figure 11.8. The structure of MgSiO3
perovskite. The structure consists of cor-ner-sharing SiO6 octahedra with Mg2+ indodecahedral sites.
W . M W h i t e G e o c h e m i s t r y
Chapter 11: The Mantle and Core
483 November 25, 1997
30 GPa (~900 km), and this is constant at greater pressure. At this depth, the mole fractions of Mg(Mg/(Mg+Fe)) in MgSiO3Ðperovskite and magnesiow�stite ((Mg,Fe)O) for a pyrolite composition areabout 0.93 and 0.80 respectively.
There has been some debate about how Al2O3 is accomodated in lower mantle minerals. Some haveargued that a separate aluminous phase forms. The most recent experiments however, suggest tha twhile a separate aluminous phase forms at relatively low pressure (20-30 GPa, correpsonding to theregion of 600-800 km), at pressures above about 35 GPa, Mg-perovskite apparently accepts all avai l -able Al2O3 in its structure, so that there is no separate aluminous phase in the lower mantle(e.g., Kes-son et al., 1994) below about 800 km. However, the solid solution between Mg-perovskite and Ca-per-ovskite appears to be quite limited, so that Ca perovskite is probably present as a separate phase,and probably accepts all the Na2O.
There is considerable uncertainty about the composition of the lower mantle, and there are twoprincipal viewpoints on the question. In the first, the lower mantle is compositionally similar to theupper mantle, i.e., an approximately pyrolitic composition, with no major chemical boundaries. Inthis case, the lower mantle would consist of 80% perovskite, with about 10% magnesiow�stite (Figure11.7). Proponents of the second view claim that an essentially pure perovskite lower mantle betterfits seismic observations. A second argument favoring a pure perovskite lower mantle is that it isricher in SiO2 and therefore closer to chondritic than upper mantle compositions. At present, the den-sity and elastic properties of lower mantle minerals are not sufficiently well known to distinguish be-tween these alternatives, as the predicted densities of the pyrolite and chondritic models of thelower mantle differ by less than 0.06 g/cc. Uncertainties about the temperature of the lower mantle,and the coefficient of thermal expansion of lower mantle materials, compound the problem. Though aÔchondriticÕ lower mantle does seem to match the seismic observations slightly better, a pyrolitecomposition appears to match the seismic observations within about 1%, which is less than the com-bined uncertainty of the seismic observations and the values for seismic properties of lower mantlematerials. D. Anderson and R. Jeanloz, among others, also argue that the lower mantle is richer iniron than the upper mantle. Jeanloz has suggested a molar Mg/(Mg+Fe) ratio of about 0.8 for thelower mantle, compared to 0.9 for the upper mantle.
The importance of this problem to both the present working of the Earth and its past evolutionshould be emphasized. If the mantle is chemically stratified or layered, that is if the compositionbelow the 660 discontinuity differs from that above, it implies that convection within the mantle islayered; moreover, it implies there is little chemical exchange between the upper and lower mantles.In this case, it seems unlikely that subducted lithospheric slabs penetrate to depths greater than 660km. Similarly, if the mantle is layered, mantle plumes, which are responsible for most interplatevolcanism, probably arise from the 660 km discontinuity rather than the core-mantle boundary. Alayered mantle also implies that the continental crust was derived only from the upper mantle,which has important implications for mass balance models of the Earth, which we consider below.On the other hand, a homogenous mantle allows, but does not require, whole mantle convection. F i -nally, it is possible, and perhaps likely, that if the mantle is layered, this layering originated dur-ing crystallization of an early magma ocean, a question to which we will return.
D´´ and the Core-Mantle Boundary
For the most part, seismic velocities increase smoothly throughout the lower mantle and appear tobe consistent with self-compression of chemically homogeneous material. However, the lower twohundred kilometers or so of the mantle appear to be seismically peculiar. Within this layer, knownas D«« (d-double-prime), both P- and S-wave velocity gradients are smaller than elsewhere. Fur-thermore, the thickness of D«« varies significantly. Though the anomalous gradients in this regionhave been recognized for 50 years, the extremely heterogeneous nature of D«« has only recently beendiscovered. The shallow seismic gradients can be fairly easily explained if this region is a thermalboundary layer between the core and the mantle, as it would be hotter. The heterogeneity cannot beso easily explained, and is the subject of debate. Again, there are two views. In the first view, the

W . M W h i t e G e o c h e m i s t r y
Chapter 11: The Mantle and Core
484 November 25, 1997
region is a chemical boundary layer and is producedby reaction between silicates of the mantle and theFeNi core. In the other view, the heterogeneityarises from the presence of subducted oceanic litho-sphere that has sunk to the base of the mantle. Inthis latter view, the D«« layer is the source of man-tle plumes, which we discuss in a subsequent section.
The “Primitive Mantle”An important concept in mantle geochemistry is
that of the Òprimitive mantleÓ composition. Prim-itive mantle is defined as the composition of themantle after separation of the core, but before sepa-ration of the crust. It is thus equivalent to theÒBulk Silicate EarthÓ composition. As we will see,it seems likely that the core formed very early,perhaps before accretion was complete, whereasthe crust seems to have formed much more slowly,so equating primitive mantle with bulk silicateearth seems reasonable.
In estimating primitive mantle composition,we start with the assumption of an approxi-mately chondritic Earth. The primitive mantlecomposition will differ from chondritic, however,as a result of two processes: loss of volatiles fromthe inner Solar System or during formation of theEarth, and loss of siderophile elements to theEarthÕs core.
Though the compositions of the various classesof chondrites differ, they do have constant rela-tive abundances of the highly refractory litho-phile elements, i.e., those elements concentratedin CAIÕs (see Chapter 10): Al, Ca, Sc, Ti, Sr, Y, Zr,Nb, Ba, REE, Hf, Ta, Th, and U. Thus for exam-ple, the Sm/Nd ratio is nearly constant in differ-ent meteorites despite variations in the absoluteabundances of Sm and Nd. This being the case, i tis reasonable to assume that these elements arepresent in the same relative abundances in thesilicate Earth as in chondrites. This group in-cludes the parents and daughters of the Sm-Ndand Lu-Hf radioactive decay schemes. It is thisassumption that the Sm/Nd ratio of the Earth is
Table 11.3. Primitive MantleConcentrations
Li 1.6 Ge 1.1 Nd 1.225Be 0.066 As 0.13 Sm 0.381B 0.5 Se 0.05 Eu 0.145C 250 Br 0.075 Gd 0.526F 26 Rb 0.60 Tb 0.093
N a 2545 Sr 19.9 Dy 0.651Mg 219407 Y 4.05 Ho 0.146A l 22985 Zr 10.5 Er 0.428S i 214766 Nb 0.651 Tm 0.058P 95 Mo 0.065 Yb 0.439S 350 Ru 0.0042 Lu 0.065
Cl 330 R h 0.001 H f 0.283K 240 Pd 0.005 Ta 0.037
Ca 23858 Ag 0.008 W 0.021Sc 15.5 Cd 0.04 Re 0.00028Ti 1153 In 0.013 Os 0.0034V 82 Sn 0.175 Ir 0.0033
Cr 2935 Sb 0.005 Pt 0.0068Mn 1080 Te 0.013 Au 0.00075Fe 65500 I 0.011 Hg 0.01Co 105 Cs 0.021 Tl 0.007N i 1890 B a 6.189 Pb 0.18Cu 30 La 0.624 B i 0.0025Zn 56 Ce 1.637 Th 0.0813Ga 3.9 Pr 0.238 U 0.0203All concentrations in ppm.
OO
O
O OOO
O
OOOO
κ= 3.9
0 1 2 3 4
4.0
4.5
0.8
0.9
1.0
1.
T, Ga
Cape Smith
MORB Kambalda
Alexo
Munro
OmanBay of IslandsGorgona
Barbartonκ= 4.3κ= 4.1
Th/U
208 P
b*/20
6 Pb* O
OO
O
Figure 11.9. Apparent Th/U ratio of magmasources as a function of time. 208Pb*/206Pb* is theratio of radiogenic 208Pb to radiogenic 206Pb.The plot shows data for komatiites (komatiitesare ultramafic lavas produced by relativelyhigh degrees of melting) and ophiolites (Bay ofIslands and Oman), which are oceanic crustalsections. After All�gre et al. (1986).

W . M W h i t e G e o c h e m i s t r y
Chapter 11: The Mantle and Core
485 November 25, 1997
chondritic that makes this decay scheme so useful (among other things). Note also that some impor-tant elements in isotope geochemistry are absent from this group: Re, Os, Rb and Pb.
Though both Th and U are refractory elements, there is evidence that the Th/U ratio of the Earthmight be somewhat higher than the chondritic ratio. The Anders and Grevesse tabulation (Table10.2) yields a chondritic Th/U ratio of about 3.8. But Pb isotope systematics of meteorites suggest ahigher ratio, closer to 4.0. All�gre et al. (1986) have argued the ratio is as high as 4.2. Figure 11.9 i l -lustrates one piece of evidence they use to support this hypothesis. As we demonstrate in a subsequentsection, a time-integrated Th/U ratio may be calculated from 208Pb*/206Pb* ratios (the asterisk is usedto designate radiogenic 208Pb and radiogenic 206Pb). When All�gre et al. (1986) did this for a series ofmafic and ultramafic rocks of various ages, they found evidence for a decrease of the Th/U ratio ofthe mantle with time. The curve through the data suggests the mantle had a Th/U ratio of about 4.2at 4.55 Ga. The importance of this derives from recent work on Th isotope ratios, which indicatesthat present upper mantle Th/U ratios are about 2.3, which is much lower than time-averaged ratioderived from 208Pb*/206Pb* ratios, which is about 3.6-3.8. If the primitive mantle Th/U is as low as 3.8and the present mantle ratio is 2.3, a time integrated ratio approaching 3.8 suggests the low presentTh/U is a relatively young feature. However, if the primitive mantle Th/U is 4.2, as All�gre et a l .argue, the a more gradual depletion of Th/U is possible.
The abundance of other elements in the silicate Earth can also be estimated through various indi-rect approaches. For example, the abundance of Rb has been estimated by comparing Rb-Sr and Sm-Nd isotope systematics, and also from the Rb/Ba ratio of mantle-derived basalts, which is constant(Hofmann and White, 1983). The Pb concentration in the Earth can be estimated by noting that mostmajor reservoirs in the Earth have Pb isotope ratios consistent with a µ (238U/204Pb) of about 8. K con-centration can be estimated by noting that the K/U ratio of most materials is about 10000. Table 11.3lists estimated concentrations of the elements in the Primitive Mantle (= bulk silicate Earth). Thevalues were calculated as follows. First a Ôchondritic mantleÕ was calculated, following Hart andZindler (1986), by subtracting an appropriate amount of the volatile and moderately volatile ele-ments and enough of the major siderophiles to form the core. The Si was then adjusted downward to
X
X
X
XX
X
XX
XXX
XX
X
X
X
X
XXX
XXX
XXXXXXXXXXXXXXXXXXXXXXXXXXXXX
X
XXXXX
X
X
X
X
X
XXX
XX
XXXXX
X
0.001
0.01
0.1
1
10
Element
Al
Ca
Sc
Ti
Sr
Y Nb
Ba
La
Ce
Pr
Nd
Sm
Eu
Gd
Tb
Dy
Ho
Er
Tm
Yb
Lu
Hf
Ta
Th
UMg
Si
Li
B NaCl F
K
RbCs
VCr
Fe
W Co
Ni
PMo
Pd
ReRh
OsIr PtRu
Au
MnGa
CuZn In
Sn AsCd
Ag SbGe
S Te
Se
PbTl
HgI Bi
Br
C
ZrRefractory
Mod
erat
elySi
dero
phile
Hig
hly
Side
roph
ile
Side
roph
ile&
Vola
tile
Hig
hly
Volat
ile
PM/C
I
Figure 11.10. Abundances of the elements in the Primitive Mantle compared to CI chondrites.

W . M W h i t e G e o c h e m i s t r y
Chapter 11: The Mantle and Core
486 November 25, 1997
accord with observations on mantle xenoliths (Hart and Zindler, 1986). The observed concentrationsof the major refractory elements, Al, Ca, and Ti, in this upper mantle (Hart and Zindler, 1986) appearto be about 15% enriched relative to this calculated Ôchondritic mantleÕ. On this basis, it was as-sumed that refractory lithophile trace elements (e.g., REE) were also 15% overabundant. The re-maining element concentrations were taken from McDonough (1987) or Hofmann (1988) with some mi-nor adjustments. Figure 11.10 compares these estimated primitive mantle concentrations with CIchondrites. These primitive mantle concentrations should not, of course, but taken as gospel and willundoubtedly be revised in the future.
Magma Ocean and Mantle DifferentiationSeveral observations suggest the Earth underwent extensive melting when it formed. First, the en-
ergetics of the formation of the Earth and its core suggest extensive melting occurred. The gravita-tional energy released by accretion of the Earth from nebular dust is sufficient to melt the entireplanet. Whether this occurs or not, however, depends on how efficiently heat is lost during accretion,and how quickly accretion occurs. If the Moon formed as a result of a giant impact, the impact wouldrelease enough energy to cause very extensive melting. Formation of the core would also release alarge amount of energy. In addition, there is evidence for a magma ocean on the Moon. Given that thegravitational energy released by accreting the Earth is even greater, it is difficult to see how forma-tion of a terrestrial magma ocean could not have formed. Second, the solidus and liquidus of peri-dotite converge at high pressure (Figure 11.11). Some petrologists have argued that this is unlikelyto be coincidental and they conclude that the lherzolitic upper mantle is a minimum melt or eutecticcomposition of a Òchondritic mantleÓ composition (i.e., Table 11.2 column 2).
According to some, crystallization of a magma ocean would produce a chemically stratified man-tle. The magma ocean would have crystallized both from the top down, because heat can only be lostfrom the surface of the Earth. It would have simultaneously crystallized from the bottom up (Figure11.12), because the P-T slope of the solidus is greater than that of an adiabatic gradient (vigorousconvention within the magma ocean would have kept temperatures nearly adiabatic). Presumably, aprotocrust would have quickly formed as the surface of the magma ocean crystallized. This pro-tocrust, like that of the Moon, might have been rich in plagioclase because plagioclase is less densethan a melt of lherzolitic composition (provided it is relatively dry) and hence floats to the surface.Plagioclase, however, would have crystallized only within the upper 30 km of so, since it is not sta-ble at greater pressure. If melting was extensive enough to extend into the Mg-perovskite stabilityfield (shallower than at present because of higher temperature), Mg-perovskite crystallizing in thelower part of the magma ocean would have sunk out of the magma due to its higher density. Mg-
perovskite has a slightly higher Si/Mg ratiothan chondrites or lherzolite, so the residualliquid would have been depleted in Si by Mg-perovskite crystallization. This liquidwould also have been strongly enriched in N aand Ca and modestly enriched in Al, whichare excluded from perovskite, and depleted inTi, which is enriched in Mg-perovskite. Ex-cept in the uppermost part, olivine crystal-lizing above the depth of the present transi-tion zone would be less dense than the meltand would have floated upward, enrichingthe upper mantle in olivine. Majorite garnet,which crystallizes later than perovskite andolivine, would have also been denser thanthe liquid and would have settled, depletingthe upper mantle in Al and other elements,
5 10 15Pressure (GPa)
Te m
pera
ture
, °C
{
{
{
{
{
{
{
{
{{{{{
JJJ
J
EE
EE E
E{{
J
E
E
J
{{
E
E{
EE
J
1000
1500
2000
2500
Figure 11.11. Solidus and Liquidus of peridotite a thigh pressure. Closed symbols are experiments inwhich there was no evidence of melting, red hal f -filled circles are experiments that partiallymelted, and open circles are experiments tha ttotally melted. From Scarfe and Takahashi (1986).

W . M W h i t e G e o c h e m i s t r y
Chapter 11: The Mantle and Core
487 November 25, 1997
such as the heavy rare earths, that parti-tion into garnet. Thus in the view of some,crystallization of a magma ocean could pro-duce a chemically stratified mantle inwhich the upper mantle has a lower thanchondritic Si/Mg ratio and a higher thanchondritic Ca/Al ratio.
There are, however, several questionsabout this scenario. Kato et al. (1988) de-termined Mg-perovskiteÐliquid partition co-efficients for a number of elements. Hf and Scappear to strongly partition into perovskite,whereas rare earths, such as Sm, are not.Fractional crystallization of perovskitewould change the Hf/Sm and Sm/Sc ratiosmore rapidly than the Si/Mg ratio (Figure11.13). However, both the Hf/Sm and Sm/Scratios appear to be approximately chon-dritic in the upper mantle. Fractional crys-tallization of perovskite would also increasethe Lu/Hf ratio, whereas Hf isotope datasuggest the early mantle had an approxi-mately chondritic Lu/Hf ratio. In addition,Tonks and Melosh (1990) argued that convec-tion in the magma ocean would be so vigorousthat nucleating crystals would be swept outof the crystallization zones before they hadtime to grow to sufficient size to settle out.
Thus the magma ocean would crystallize withoutproducing a stratified mantle.
Even if crystallization of a magma ocean hadproduced a stratified mantle, this stratification maynot persist, since subsequent convection could have de-stroyed it. Little, if any of the presently observedmantle heterogeneity can be related to a primordialmagma ocean. However, there is some evidence tha ta stratified mantle did form and persisted for a bil-lion years or so.
The Core and Core FormationWe know little about the composition of the core
or how it formed. Various lines of evidence, primar-ily geophysical, indicate the core consists of Fe-Ni
200
400
600
800
1000 2000 3000 4000T (K)
Solidus
Dep
th, k
m
Liqui dus
Figure 11.12. Solidus, liquidus and thermal gradientin a terrestrial magma ocean. Crystallization occursin the gray regions where temperature is betweenthe solidus and liquidus. This occurs at the very topwhere temperatures are not adiabatic and at thebottom, where the solidus temperature exceeds theadiabatic temperature.
Mg-perovskite Fractionation, %0 5 10
0.6
0.8
1.2�
1.0
1.4�
CI-n
orm
alize
d rat
io
Si/MgUpper Mantle
ratio
Sm/Hf
Sc/Sm
Figure 11.13. Effect of fractional crystalliza-tion of Mg-perovskite on Sm/Hf, Sc/Sm, andSi/Mg ratios in a magma ocean that is ini-tially chondritic. 10% Mg-perovskite frac-tionation drastically changes the Sm/Hf andSc/Sm ratios, but only slightly changes theSi/Mg ratio. From Ringwood (1991).

W . M W h i t e G e o c h e m i s t r y
Chapter 11: The Mantle and Core
488 November 25, 1997
alloy. Iron meteorites contain 5-10% Ni, so the concentration of the core probably falls in this range.About 5.7% Ni in the core is required to explain the observed depletion of the mantle in Ni. Densityconsiderations, however, require about 10% of some lighter element as well. What the light elementis has been the subject of endless debate, and a resolution of the question in the near future does notseem likely. The principle candidates are S and O.
Sulfur is an obvious candidate for several reasons. First, it is severely depleted in the silicateEarth (Figure 11.10). Sulfur is volatile, and much of its depletion may be due to this. However, it ismore depleted than similarly volatile elements, e.g., Zn, which strongly suggests its presence in thecore. Second, iron meteorites often contain considerable amounts of FeS (troilite), indicating S was ex-tracted into the cores of meteorite parent bodies. Finally, FeS and Fe liquids are completely miscibleat low temperature, so that S would have readily dissolved into droplets of Fe liquid in the accretingEarth. Ahrens and Jeanloz (1987) found that a core with about 11% S would match the observed seis-mic properties of the core reasonably well. All�gre et al. (1995) estimate the core has about 2% S ,based on the correlation between K/Ca and S/Ca in meteorites and an estimate of the terrestrialK/Ca value.
The idea that O might be the light element in the core is based on the observation that at highpressure FeO is miscible with Fe liquid, though it is not at low pressure. The eutectic composition inthe Fe-FeO system at 16 GPa, still well below core pressures, contains about 10% FeO (e.g., Ringwoodand Hibbertson, 1990). Furthermore, the EarthÕs mantle is depleted in oxygen compared with CIchondrites. The relevance of this last observation, however, is questionable, since the oxidation stateof chondrites, and therefore presumably the solar nebula, clearly varied widely. Significant in thisrespect is the observation that based on O isotope ratios, the Earth appears to be more closely relatedto enstatite chondrites (Figure 9.23), which are highly reduced, than to other chondrites, and in par-ticular to CI. All�gre et al. (1995) have estimated that the core contains about 4% O.
C, Si, P, Mg, and H have also been mentioned as the possible light element in the core. Allegre etal. (1995) estimated the core contains about 7% Si, which is based on the observed mantle deficit of S iand the assumption the Earth has the same Mg/Si ratio as carbonaceous chondrites. There are, how-ever, some inconsistencies and questionable assumption in their approach. At present, the availableobservations simply do not allow us to specify the core composition very accurately.
The core undoubtedly contains the bulk of the Earth's inventory of other siderophile elements aswell. Refractory siderophiles such as Re, Os, Ir, and Pt, among others, are probably present in chon-dritic relative abundance in the core, based on the same arguments made for chondritic relative abun-dances of lithophile elements. If the light element in the core is S, the core may also be rich in chal-cophiles such as Pb.
It is generally assumed that core formation occurred very early in Earth's history, probably simul-taneously with accretion. One line of evidence for this is the observation that the gravitational en-ergy released by formation of the core from an initially homogeneous Earth is sufficient to raise thetemperature of the Earth by 2000¡ C. Thus if core formation were catastrophic, i.e., happened rap-
idly, it must have occurred before formationof any presently existing crust; i.e., before4.2-4.3 Ga ago (the age of zircons recoveredfrom the Jack Hills of Australia). Model-ling of the physical aspects of accretionalso suggests core formation would have oc-curred simultaneously with accretion. Inaddition, core formation appears to haveoccurred vary early in meteorite parentbodies. Prima facie evidence of this is theexistence of anomalies in the isotopic com-position of Ag resulting from decay of short-lived 107Pd. Certainly all those who have
Table 11.4. Liquid Silicate—Liquid MetalPartition Coefficients
Element DS/M Element DS/M
W 1 Au 1 × 10⁻⁴
Re 5 × 10⁻⁴ P 0.24Ir 5 × 10⁻⁵ Ga 0.8Mo 8 × 10⁻⁴ Ag 0.01N i 2 × 10⁻⁴ Pb 0.15Co 7 × 10⁻³
from Jones and Drake (1986).

W . M W h i t e G e o c h e m i s t r y
Chapter 11: The Mantle and Core
489 November 25, 1997
considered the problem agree tha tcore formation started very early.There has been some question as towhen it was complete, with some ar-guing that it continued through mostof geologic time.
As we found in Chapter 7, traceelements are useful in geochemistrybecause geochemical processes oftenlead to much greater variations intheir abundances than in the majorelements. Equilibration between me-tallic (Fe-Ni) liquid and silicate liquid is an example of a process that should lead to a large frac-tionation of trace elements. Table 11.4 lists experimentally determined liquid silicateÐliquid metalpartition coefficients for a number of siderophile elements. These experiments were performed at lowpressure with about 20% sulfur in the metal phase. Their relevance to the problem of core formationthus depends on 1) whether the core contains sulfur, 2) whether equilibration occurred at high or lowpressure, and 3) the form (liquid or solid) of the silicate and metal phases at the time and point ofequilibration. More fundamentally, it depends on whether core formation was an equilibrium or dise-quilibrium process.
There is as yet little consensus on any of these points. Most students of core formation prefer low-pressure equilibration. New material is added to the surface of the earth and hence the initial in-teraction between metal and silicate would occur near the surface at low pressures. Presumably, blobs(for lack of a better word) of metal grow and coalesce as they sink. The greater their size, the less theopportunity for equilibration with surrounding silicate. So on these grounds, low pressure partitioncoefficients may be more relevant than high pressure ones. Solid silicateÐliquid silicate and solidmetalÐliquid metal partition coefficients for these elements are also available. From these data,any combination of metal-liquid equilibrium distribution coefficients can be calculated.
Accepting for the moment the relevance of the distribution coefficients in Table 11.4 to core forma-tion, we can see that these values predict that the mantle should be highly depleted in elements suchas Mo, Re, Au, and Ir. The partition coefficients can be compared with depletion factors (abundancesrelative to CI chondrites) in the mantle shown in Table 11.5. Although there is very rough qualita-tive agreement, there are significant discrepancies in detail. For example, Ir should be an order ofmagnitude more depleted than Re, and Ni should be a factor of 30 more depleted than Co. But the ac-tual depletions of Ni and Co are similar, as are the depletion factors for all the platinoid metals, a l lof which are highly siderophile (Figure 11.10). The mismatch tells us something is wrong with thepartition coefficients or a simple model of equilibrium core formation. Assuming equilibration tookplace between solid, rather than liquid, silicate and metal generally only makes things worse.
Possible explanations for the discrepancy between predicted and observed depletion of sidero-philes in the mantle include inefficient metal extraction or disequilibrium, discrepancy between thecomposition of the metal phase in experiments and the core (i.e., non-S bearing, O-bearing metal).All of these possibilities must be considered, but perhaps the best hypothesis is that core formationended before the Earth had completely accreted. To illustrate the effect of this, imagine that coreformation effectively extracts all Re and Ir from the mantle, as would be the case for complete equi-librium with distribution coefficients given in Table 11.4. Then imagine new material equivalent to1% of the mass of the mantle and with chondritic abundances of Re and Ir is added to the mantle. Themantle would be highly depleted in these elements, concentrations of these elements would be close to0.01 times the chondritic abundances, but the Re/Ir ratio would be close to chondritic, despite the or-der of magnitude difference in their distribution coefficients. Yet another possible explanation re-lates to how metal and silicate are distributed during the hypothesized giant impact (e.g., Newsomand Taylor, 1989).
Table 11.5. Siderophile and Chalcophile ElementAbundances in the Upper Mantle
Element Concentration/CI Element Concentration/CIW 0.22 Au 0.05Re 0.007 P 0.08Ir 0.007 Ga 0.38Mo 0.064 Ag 0.04N i 0.17 Pb 0.07Co 0.21
W . M W h i t e G e o c h e m i s t r y
Chapter 11: The Mantle and Core
490 November 25, 1997
Some authors (e.g., All�gre et al., 1983) have ascribed the excess radiogenic nature of mantle Pbisotope ratios (i.e., that they lie to the right of the geochron) to continued growth of the core and ex-traction of Pb (and other things) from the mantle long after formation of the Earth. This would, ofcourse produce higher U/Pb ratios, and ultimately higher 206Pb/204Pb, 207Pb/204Pb, and 208Pb/204Pb thanin a closed system. Newsom et al. (1986) showed that this is unlikely by examination of the relation-ship between Pb isotopes and siderophile element concentrations in mantle-derived volcanic rocks.They found that the ratio of Mo, a siderophile, to Pr, a lithophile light rare earth, was uniform inthe mantle and did not correlate with Pb isotope ratios. A correlation is expected if post-accretioncore growth extracted Pb from the mantle because Mo would be more drastically extracted than Pb(Table 11.4), decreasing the Mo/Pr ratio and increasing the U/Pb ratio. That the Mo/Pr ratio is uni-form implies that in the modern mantle, Mobehaves as do moderately incompatible litho-phile elements, such as Pr. Apparently, nopart of the mantle sampled by volcanism hasexperienced more siderophile depletion thanany other part. In a subsequent study, Sims etal. (1990) found that the Mo/Ce ratio in man-tle-derived rocks has been constant throughtime. Thus the core has not extracted sidero-phile elements from any part of the mantlesampled by volcanism.
Mantle Geochemical ReservoirsEvidence from Oceanic Basalts
Isotopic variations in oceanic basalts pro-vide clear evidence that the mantle is pres-ently heterogeneous. Oceanic basalts providebetter evidence of this than continentalbasalts because the possibility of the formerbeing contaminated by the crust throughwhich they pass is much reduced. This is truefor 3 reasons: oceanic crust is much thinner, i thas a higher solidus, and it is compositionallysimilar to melts of the mantle (so that whenassimilation does occur, it chemical affects areminimized). Of course, not all continentalbasalts appear to have been contaminated.Those that have apparently not been contami-nated also show evidence of mantle heteroge-neity. Xenoliths in basalts also provide evi-dence of mantle heterogeneity.
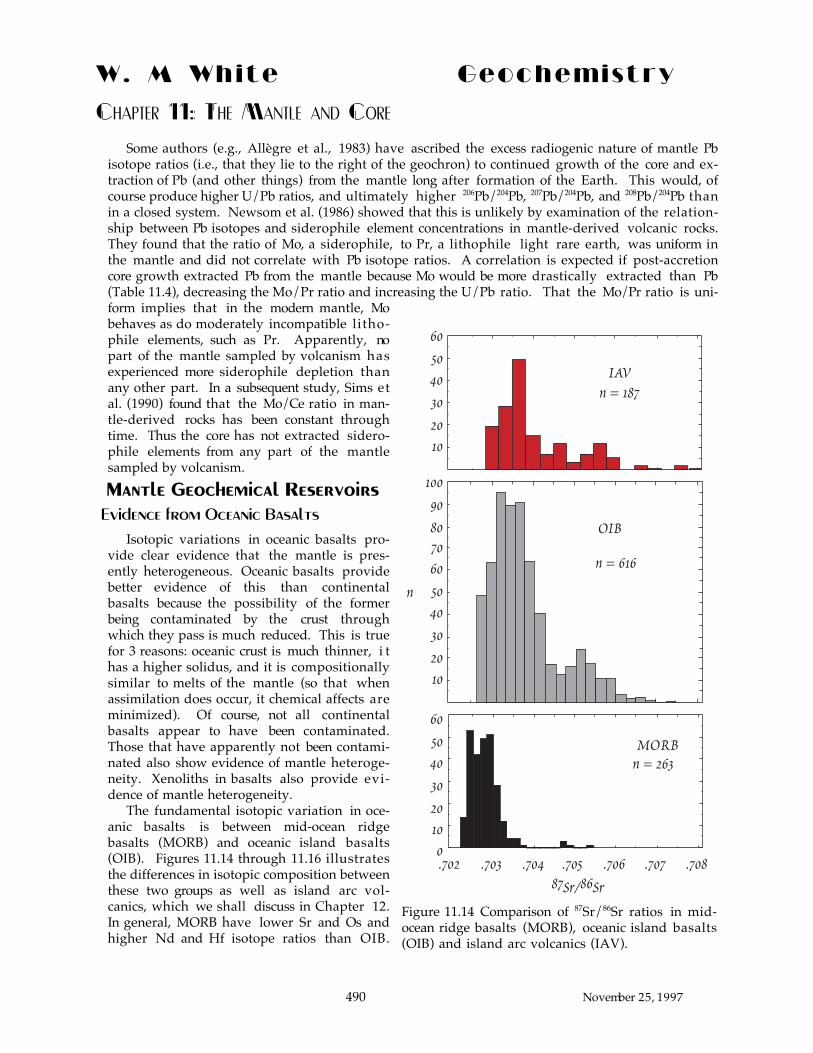
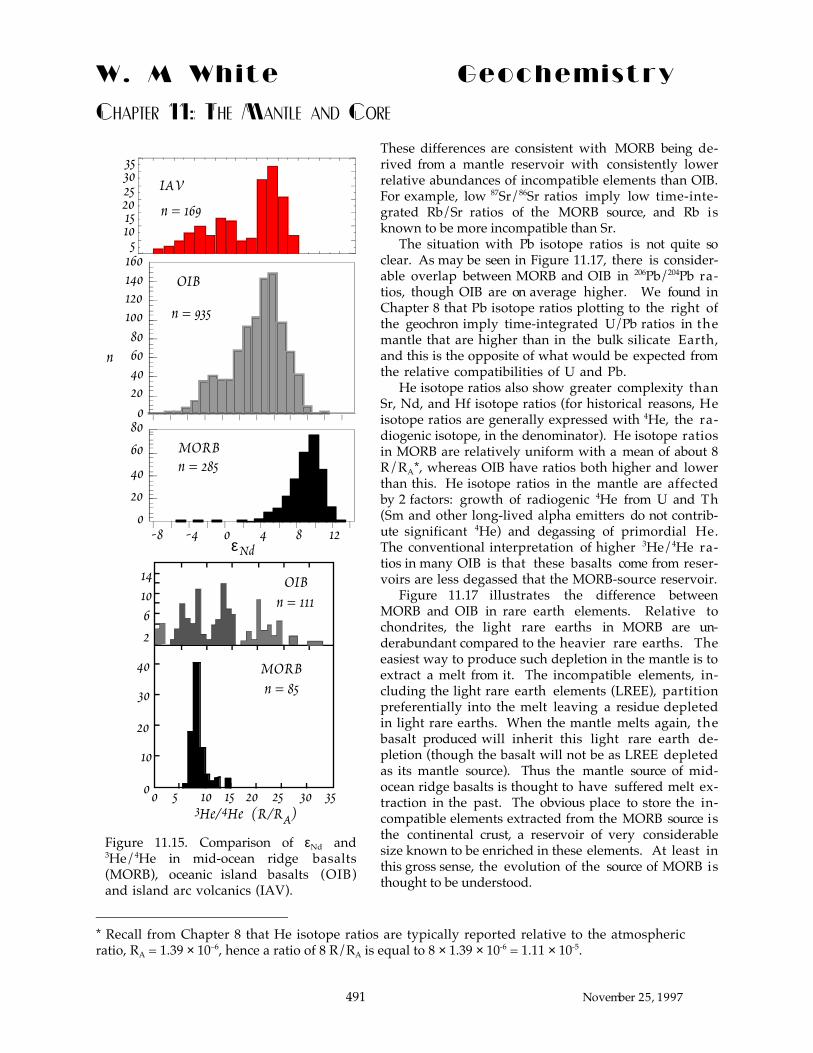
The fundamental isotopic variation in oce-anic basalts is between mid-ocean ridgebasalts (MORB) and oceanic island basalts(OIB). Figures 11.14 through 11.16 illustratesthe differences in isotopic composition betweenthese two groups as well as island arc vol-canics, which we shall discuss in Chapter 12.In general, MORB have lower Sr and Os andhigher Nd and Hf isotope ratios than OIB.
87Sr/86Sr.7020
102030405060
.703 .704 .705 .706 .707 .708
MORBn = 263
n
102030405060708090
100
OIB
n = 616
IAVn = 187
102030405060
Figure 11.14 Comparison of 87Sr/86Sr ratios in mid-ocean ridge basalts (MORB), oceanic island basalts(OIB) and island arc volcanics (IAV).
W . M W h i t e G e o c h e m i s t r y
Chapter 11: The Mantle and Core
491 November 25, 1997
These differences are consistent with MORB being de-rived from a mantle reservoir with consistently lowerrelative abundances of incompatible elements than OIB.For example, low 87Sr/86Sr ratios imply low time-inte-grated Rb/Sr ratios of the MORB source, and Rb isknown to be more incompatible than Sr.
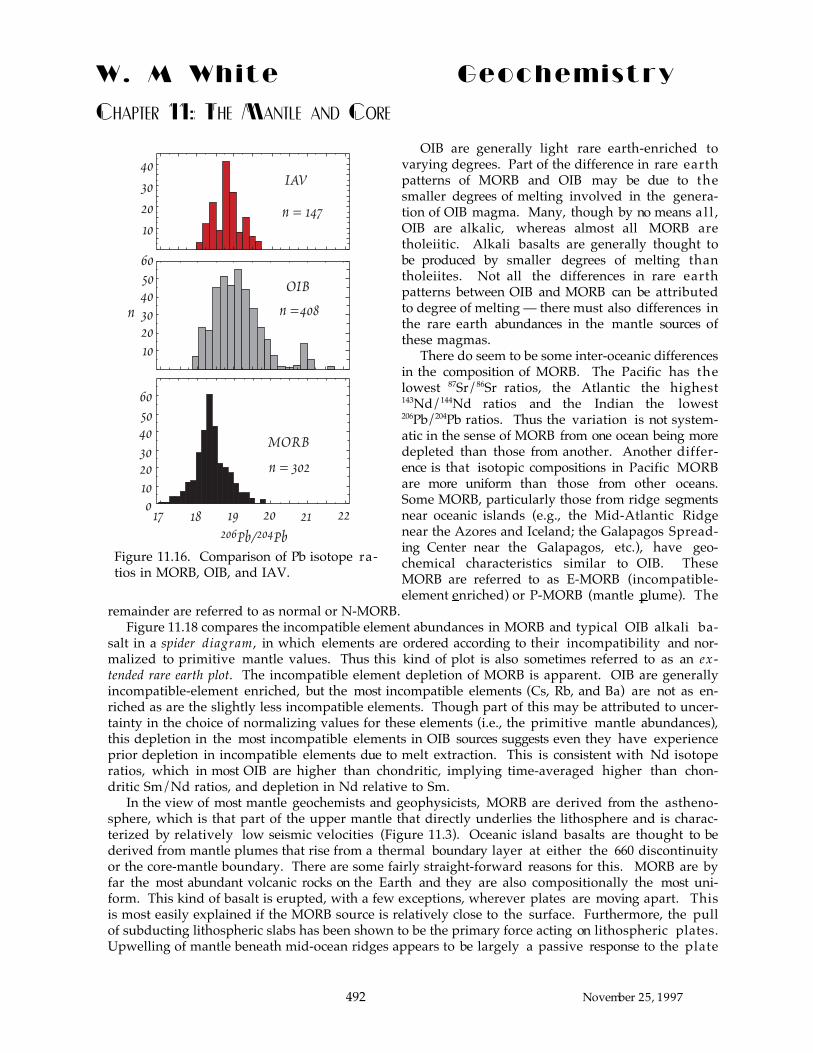
The situation with Pb isotope ratios is not quite soclear. As may be seen in Figure 11.17, there is consider-able overlap between MORB and OIB in 206Pb/204Pb ra-tios, though OIB are on average higher. We found inChapter 8 that Pb isotope ratios plotting to the right ofthe geochron imply time-integrated U/Pb ratios in themantle that are higher than in the bulk silicate Earth,and this is the opposite of what would be expected fromthe relative compatibilities of U and Pb.
He isotope ratios also show greater complexity thanSr, Nd, and Hf isotope ratios (for historical reasons, Heisotope ratios are generally expressed with 4He, the ra-diogenic isotope, in the denominator). He isotope ratiosin MORB are relatively uniform with a mean of about 8R/RA*, whereas OIB have ratios both higher and lowerthan this. He isotope ratios in the mantle are affectedby 2 factors: growth of radiogenic 4He from U and Th(Sm and other long-lived alpha emitters do not contrib-ute significant 4He) and degassing of primordial He.The conventional interpretation of higher 3He/4He ra-tios in many OIB is that these basalts come from reser-voirs are less degassed that the MORB-source reservoir.
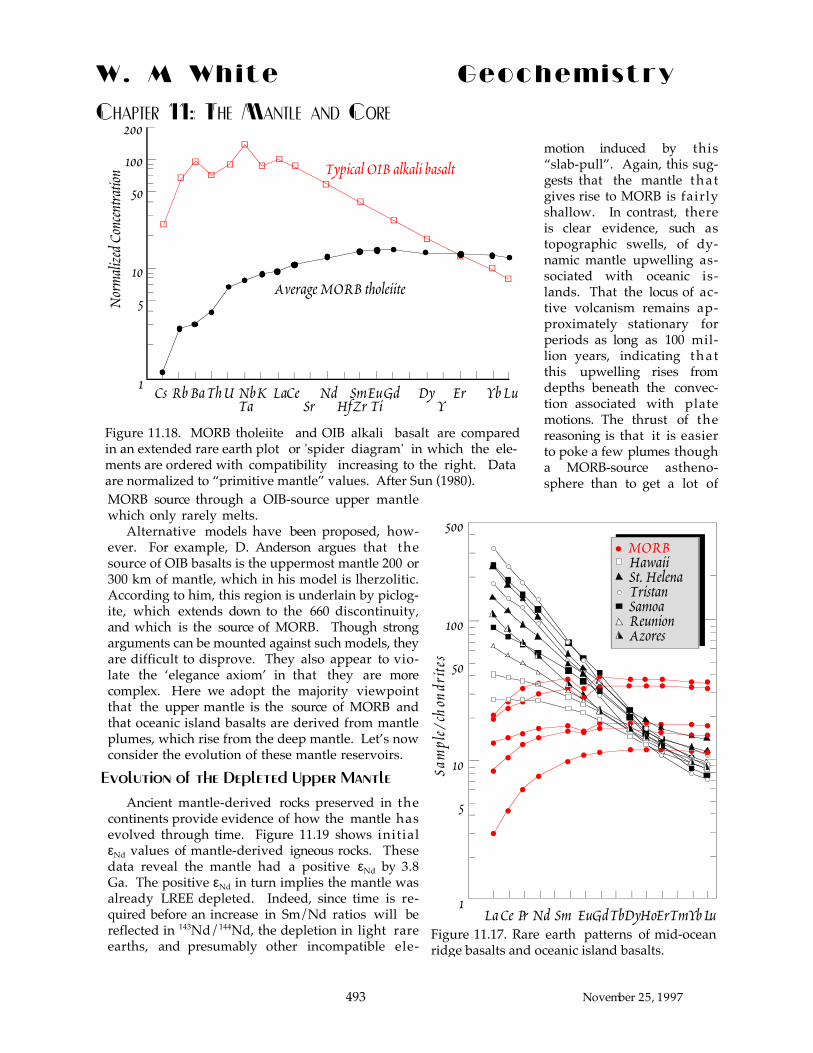
Figure 11.17 illustrates the difference betweenMORB and OIB in rare earth elements. Relative tochondrites, the light rare earths in MORB are un-derabundant compared to the heavier rare earths. Theeasiest way to produce such depletion in the mantle is toextract a melt from it. The incompatible elements, in-cluding the light rare earth elements (LREE), partitionpreferentially into the melt leaving a residue depletedin light rare earths. When the mantle melts again, thebasalt produced will inherit this light rare earth de-pletion (though the basalt will not be as LREE depletedas its mantle source). Thus the mantle source of mid-ocean ridge basalts is thought to have suffered melt ex-traction in the past. The obvious place to store the in-compatible elements extracted from the MORB source isthe continental crust, a reservoir of very considerablesize known to be enriched in these elements. At least inthis gross sense, the evolution of the source of MORB isthought to be understood.
* Recall from Chapter 8 that He isotope ratios are typically reported relative to the atmosphericratio, RA = 1.39 × 10Ð6, hence a ratio of 8 R/RA is equal to 8 × 1.39 × 10-6 = 1.11 × 10⁻⁵.
-8 -4 0 4 8 120
2040
6080
OIB
n = 935
MORBn = 85
OIBn = 111
5 10 15 20 25 30 350
10
0
20
30
40
261014
3He/4He (R/RA)
εNd
MORBn = 285
5101520253035
IAV
n = 169
n
020406080
100120140160
Figure 11.15. Comparison of εNd and3He/4He in mid-ocean ridge basalts(MORB), oceanic island basalts (OIB)and island arc volcanics (IAV).
W . M W h i t e G e o c h e m i s t r y
Chapter 11: The Mantle and Core
492 November 25, 1997
OIB are generally light rare earth-enriched tovarying degrees. Part of the difference in rare earthpatterns of MORB and OIB may be due to thesmaller degrees of melting involved in the genera-tion of OIB magma. Many, though by no means a l l ,OIB are alkalic, whereas almost all MORB aretholeiitic. Alkali basalts are generally thought tobe produced by smaller degrees of melting thantholeiites. Not all the differences in rare earthpatterns between OIB and MORB can be attributedto degree of melting Ñ there must also differences inthe rare earth abundances in the mantle sources ofthese magmas.
There do seem to be some inter-oceanic differencesin the composition of MORB. The Pacific has thelowest 87Sr/86Sr ratios, the Atlantic the highest143Nd/144Nd ratios and the Indian the lowest206Pb/204Pb ratios. Thus the variation is not system-atic in the sense of MORB from one ocean being moredepleted than those from another. Another differ-ence is that isotopic compositions in Pacific MORBare more uniform than those from other oceans.Some MORB, particularly those from ridge segmentsnear oceanic islands (e.g., the Mid-Atlantic Ridgenear the Azores and Iceland; the Galapagos Spread-ing Center near the Galapagos, etc.), have geo-chemical characteristics similar to OIB. TheseMORB are referred to as E-MORB (incompatible-element e nriched) or P-MORB (mantle p lume). The
remainder are referred to as normal or N-MORB.Figure 11.18 compares the incompatible element abundances in MORB and typical OIB alkali ba-
salt in a spider diagram, in which elements are ordered according to their incompatibility and nor-malized to primitive mantle values. Thus this kind of plot is also sometimes referred to as an ex-tended rare earth plot. The incompatible element depletion of MORB is apparent. OIB are generallyincompatible-element enriched, but the most incompatible elements (Cs, Rb, and Ba) are not as en-riched as are the slightly less incompatible elements. Though part of this may be attributed to uncer-tainty in the choice of normalizing values for these elements (i.e., the primitive mantle abundances),this depletion in the most incompatible elements in OIB sources suggests even they have experienceprior depletion in incompatible elements due to melt extraction. This is consistent with Nd isotoperatios, which in most OIB are higher than chondritic, implying time-averaged higher than chon-dritic Sm/Nd ratios, and depletion in Nd relative to Sm.
In the view of most mantle geochemists and geophysicists, MORB are derived from the astheno-sphere, which is that part of the upper mantle that directly underlies the lithosphere and is charac-terized by relatively low seismic velocities (Figure 11.3). Oceanic island basalts are thought to bederived from mantle plumes that rise from a thermal boundary layer at either the 660 discontinuityor the core-mantle boundary. There are some fairly straight-forward reasons for this. MORB are byfar the most abundant volcanic rocks on the Earth and they are also compositionally the most uni-form. This kind of basalt is erupted, with a few exceptions, wherever plates are moving apart. Thisis most easily explained if the MORB source is relatively close to the surface. Furthermore, the pullof subducting lithospheric slabs has been shown to be the primary force acting on lithospheric plates.Upwelling of mantle beneath mid-ocean ridges appears to be largely a passive response to the plate
206Pb/204Pb
MORB
0102030405060
17 18 19 20 21 22
n = 302
102030405060
OIB
n =408
10203040
IAV
n = 147
n
Figure 11.16. Comparison of Pb isotope ra-tios in MORB, OIB, and IAV.
W . M W h i t e G e o c h e m i s t r y
Chapter 11: The Mantle and Core
493 November 25, 1997
motion induced by thisÒslab-pullÓ. Again, this sug-gests that the mantle tha tgives rise to MORB is fairlyshallow. In contrast, thereis clear evidence, such astopographic swells, of dy-namic mantle upwelling as-sociated with oceanic is-lands. That the locus of ac-tive volcanism remains ap-proximately stationary forperiods as long as 100 mil-lion years, indicating tha tthis upwelling rises fromdepths beneath the convec-tion associated with platemotions. The thrust of thereasoning is that it is easierto poke a few plumes thougha MORB-source astheno-sphere than to get a lot of
MORB source through a OIB-source upper mantlewhich only rarely melts.
Alternative models have been proposed, how-ever. For example, D. Anderson argues that thesource of OIB basalts is the uppermost mantle 200 or300 km of mantle, which in his model is lherzolitic.According to him, this region is underlain by piclog-ite, which extends down to the 660 discontinuity,and which is the source of MORB. Though strongarguments can be mounted against such models, theyare difficult to disprove. They also appear to vio-late the Ôelegance axiomÕ in that they are morecomplex. Here we adopt the majority viewpointthat the upper mantle is the source of MORB andthat oceanic island basalts are derived from mantleplumes, which rise from the deep mantle. LetÕs nowconsider the evolution of these mantle reservoirs.
Evolution of the Depleted Upper Mantle
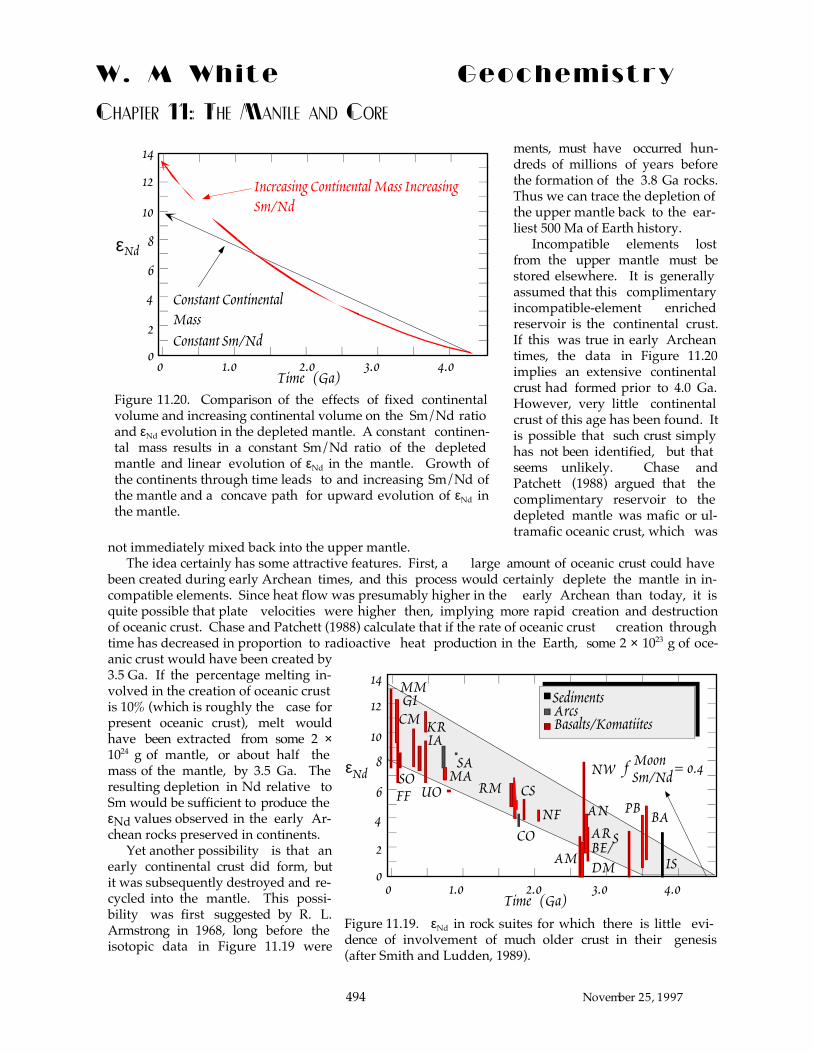
Ancient mantle-derived rocks preserved in thecontinents provide evidence of how the mantle hasevolved through time. Figure 11.19 shows initialεNd values of mantle-derived igneous rocks. Thesedata reveal the mantle had a positive εNd by 3.8Ga. The positive εNd in turn implies the mantle wasalready LREE depleted. Indeed, since time is re-quired before an increase in Sm/Nd ratios will bereflected in 143Nd/144Nd, the depletion in light rareearths, and presumably other incompatible ele-
La Ce Pr Nd Sm Eu TbDyHo LuYbTmErGd1
5
10
50
100
500
HawaiiMORB
AzoresReunionSamoaTristanSt. Helena
Sam
ple/
chon
drite
s
Figure 11.17. Rare earth patterns of mid-oceanridge basalts and oceanic island basalts.
G
G
G
G
G
G GGG
G
G
G
G
G
G
G
Cs Ba U NbK LaSr
Sm DyEuTiZrHf Y
Er Yb LuNdCeTa
ThRb Gd
5
10
50
100
200
1
Nor
mali
zed C
once
ntra
tion
Average MORB tholeiite
Typical OIB alkali basalt
Figure 11.18. MORB tholeiite and OIB alkali basalt are comparedin an extended rare earth plot or 'spider diagram' in which the ele-ments are ordered with compatibility increasing to the right. Dataare normalized to Òprimitive mantleÓ values. After Sun (1980).
W . M W h i t e G e o c h e m i s t r y
Chapter 11: The Mantle and Core
494 November 25, 1997
ments, must have occurred hun-dreds of millions of years beforethe formation of the 3.8 Ga rocks.Thus we can trace the depletion ofthe upper mantle back to the ear-liest 500 Ma of Earth history.
Incompatible elements lostfrom the upper mantle must bestored elsewhere. It is generallyassumed that this complimentaryincompatible-element enrichedreservoir is the continental crust.If this was true in early Archeantimes, the data in Figure 11.20implies an extensive continentalcrust had formed prior to 4.0 Ga.However, very little continentalcrust of this age has been found. Itis possible that such crust simplyhas not been identified, but thatseems unlikely. Chase andPatchett (1988) argued that thecomplimentary reservoir to thedepleted mantle was mafic or ul-tramafic oceanic crust, which was
not immediately mixed back into the upper mantle. The idea certainly has some attractive features. First, a large amount of oceanic crust could have
been created during early Archean times, and this process would certainly deplete the mantle in in-compatible elements. Since heat flow was presumably higher in the early Archean than today, it isquite possible that plate velocities were higher then, implying more rapid creation and destructionof oceanic crust. Chase and Patchett (1988) calculate that if the rate of oceanic crust creation throughtime has decreased in proportion to radioactive heat production in the Earth, some 2 × 10²³ g of oce-anic crust would have been created by3.5 Ga. If the percentage melting in-volved in the creation of oceanic crustis 10% (which is roughly the case forpresent oceanic crust), melt wouldhave been extracted from some 2 ×1024 g of mantle, or about half themass of the mantle, by 3.5 Ga. Theresulting depletion in Nd relative toSm would be sufficient to produce theεNd values observed in the early Ar-chean rocks preserved in continents.
Yet another possibility is that anearly continental crust did form, butit was subsequently destroyed and re-cycled into the mantle. This possi-bility was first suggested by R. L.Armstrong in 1968, long before theisotopic data in Figure 11.19 were
0
2
4
6
10
14
8
12
0 1.0 2.0 3.0 4.0Time (Ga)
εNd
Increasing Continental Mass IncreasingSm/Nd
Constant ContinentalMassConstant Sm/Nd
Figure 11.20. Comparison of the effects of fixed continentalvolume and increasing continental volume on the Sm/Nd ratioand εNd evolution in the depleted mantle. A constant continen-tal mass results in a constant Sm/Nd ratio of the depletedmantle and linear evolution of εNd in the mantle. Growth ofthe continents through time leads to and increasing Sm/Nd ofthe mantle and a concave path for upward evolution of εNd inthe mantle.
f Sm/NdMoon = 0.4
CS
CONF
NW
ANAR
AMBE/DM
S
PB BA
IS
SedimentsArcsBasalts/Komatiites
MMGI
CM
SO
KRIA
UO
SAMA
RMFF
0
2
4
6
10
14
8
12
0 1.0 2.0 3.0 4.0Time (Ga)
εNd
Figure 11.19. εNd in rock suites for which there is little evi-dence of involvement of much older crust in their genesis(after Smith and Ludden, 1989).
W . M W h i t e G e o c h e m i s t r y
Chapter 11: The Mantle and Core
495 November 25, 1997
available. Armstrong argued that the continental crust reached its present mass by about 4.0 Ga andcrustal mass has subsequently remained constant. Armstrong was the first to recognize the possibilitythat plate tectonics, which then was a new and revolutionary theory, provided a means of transport-ing material from the crust to the mantle. In ArmstrongÕs model, new continental crust is continuallycreated, but this creation is balanced by destruction of crust through erosion, deposition of the sedi-ments on the oceanic crust, and subduction of this sediment into the mantle.
There are a number of reasons to believe that continental crust has been recycled into the mantle.As we shall see in the next chapter, there have clearly been additions to the continental crustthrough geologic time. If there has been no accompanying destruction of crust, the volume and mass ofcrust should have increased through geologic time. Armstrong pointed out that this should have ledto flooding of the continents, as the oceans are confined to a smaller and smaller area. But this hasnot occurred. Armstrong also noted that virtually no deep ocean pelagic sediment is preserved on con-tinents, implying that it is carried into the mantle during subduction. Though it was at one timewidely believed that the sedimentary veneer on the oceanic crust is scraped off or ÒobductedÓ in sub-duction zones, careful study of several trenches shows little or no accumulation of sediment despitetens of millions of years of continuous subduction.
From a geochemical perspective, growth of the continental crust through time should lead to in-creasing incompatible element depletion of the upper mantle. This leads, for example, to an increasein the Sm/Nd ratio through time, which should result in the εNd of the mantle following a concaveupward path (Figure 11.20). In actuality, εNd in the depleted mantle appears to follow a linear evo-lution, implying that the mass of the continents has not grown through time. However, there is an al-ternative explanation, proposed by Patchett and Chauvel (1984). They pointed out that if a growingcontinental mass could still result in constant Sm/Nd of the mantle if the volume of the depletedmantle grew.
Let's consider now consider the question of the volume of mantle that would have to be depleted inincompatible elements to create the continental crust. We start by assuming that the Earth consists ofthree reservoir: the continental crust, the volume of mantle depleted in incompatible elements as a re-sult of formation of this crust, and an undepleted, or primitive mantle (Figure 11.21). For any radioac-tive decay system we can write a series of mass balance equations. For the Nd isotope system, we as-sume that the bulk Earth has εNd of so, so we may write:
M jC jεNdj = 0Σ
j11.1
where Mj is the mass of the jth reservoir, Cj is the concentration of Nd in that reservoir, and εjNd is the
value of εNd in that reservoir. We also assume the Sm/Nd is chondritic. WeÕll use fSm/Nd to denote therelative deviation of the Sm/Nd ratio from the chondritic value, i.e.:
f Sm/Nd =
Sm147 / Nd144 – Sm147 / Nd CHUR144
Sm147 / Nd CHUR144 11.2
Then we may write a similar mass balance for the Sm/Nd ratio for the Earth:M jC jfSm/Nd
j = 0Σj
11.3
The mass balance for the Nd concentration is:
M jCNdj = M oCNd
oΣj
11.4
where Mo is the mass of the silicate Earth and CoNd in the concentration of Nd in the silicate Earth.
Finally, the masses of our three reservoirs must sum to the mass of the silicate Earth:
M jΣj
= M o 11.5
Since the half-life of 147Sm is long compared to the age of the Earth, we may use the approximation:
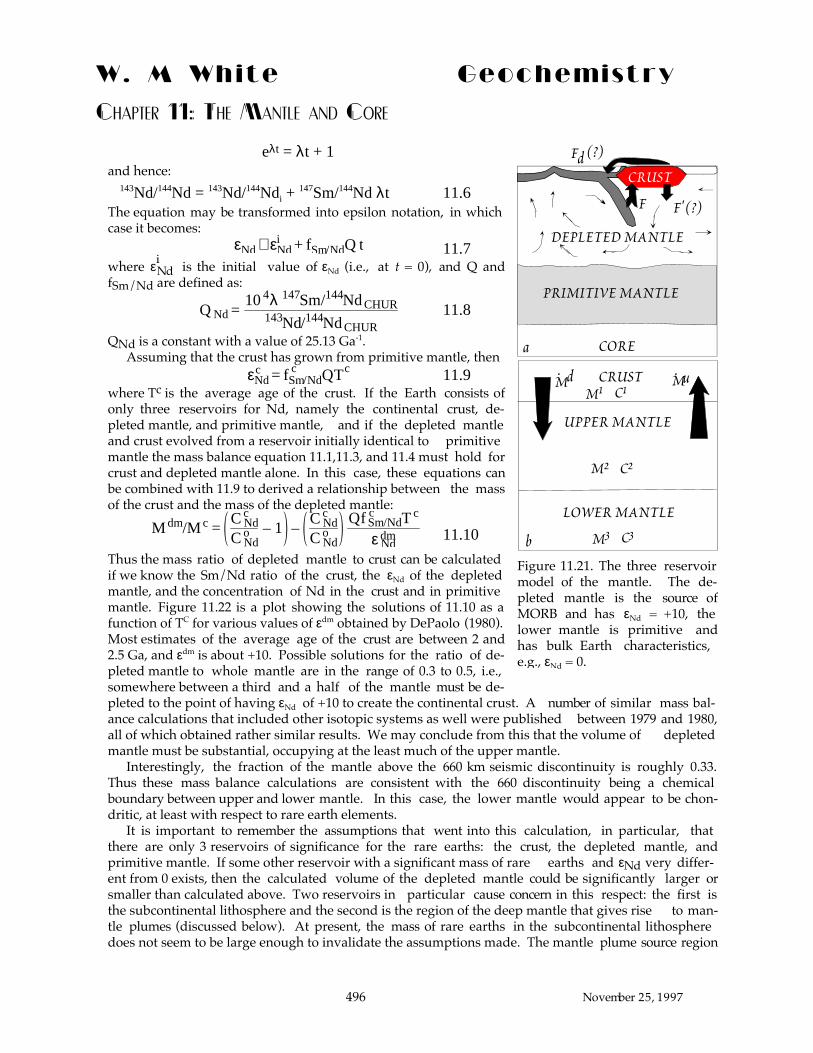
W . M W h i t e G e o c h e m i s t r y
Chapter 11: The Mantle and Core
496 November 25, 1997
eλt = λt + 1and hence:
143Nd/144Nd = 143Nd/144Ndi + 147Sm/144Nd λt 11.6The equation may be transformed into epsilon notation, in whichcase it becomes:
εNd ≅ ε Ndi + fSm/NdQ t 11.7
where εiNd is the initial value of εNd (i.e., at t = 0), and Q and
fSm/Nd are defined as:
Q Nd =10 4λ Sm147 / Nd CHUR
144
Nd143 / Nd CHUR144 11.8
QNd is a constant with a value of 25.13 Ga-1.Assuming that the crust has grown from primitive mantle, then
εNdc = fSm/Nd
c QTc 11.9where Tc is the average age of the crust. If the Earth consists ofonly three reservoirs for Nd, namely the continental crust, de-pleted mantle, and primitive mantle, and if the depleted mantleand crust evolved from a reservoir initially identical to primitivemantle the mass balance equation 11.1,11.3, and 11.4 must hold forcrust and depleted mantle alone. In this case, these equations canbe combined with 11.9 to derived a relationship between the massof the crust and the mass of the depleted mantle:
M dm/M c =C Nd
c
C Ndo – 1 –
C Ndc
C Ndo
Qf Sm/Ndc T c
ε Nddm 11.10
Thus the mass ratio of depleted mantle to crust can be calculatedif we know the Sm/Nd ratio of the crust, the εNd of the depletedmantle, and the concentration of Nd in the crust and in primitivemantle. Figure 11.22 is a plot showing the solutions of 11.10 as afunction of TC for various values of εdm obtained by DePaolo (1980).Most estimates of the average age of the crust are between 2 and2.5 Ga, and εdm is about +10. Possible solutions for the ratio of de-pleted mantle to whole mantle are in the range of 0.3 to 0.5, i.e.,somewhere between a third and a half of the mantle must be de-pleted to the point of having εNd of +10 to create the continental crust. A number of similar mass bal-ance calculations that included other isotopic systems as well were published between 1979 and 1980,all of which obtained rather similar results. We may conclude from this that the volume of depletedmantle must be substantial, occupying at the least much of the upper mantle.
Interestingly, the fraction of the mantle above the 660 km seismic discontinuity is roughly 0.33.Thus these mass balance calculations are consistent with the 660 discontinuity being a chemicalboundary between upper and lower mantle. In this case, the lower mantle would appear to be chon-dritic, at least with respect to rare earth elements.
It is important to remember the assumptions that went into this calculation, in particular, thatthere are only 3 reservoirs of significance for the rare earths: the crust, the depleted mantle, andprimitive mantle. If some other reservoir with a significant mass of rare earths and εNd very differ-ent from 0 exists, then the calculated volume of the depleted mantle could be significantly larger orsmaller than calculated above. Two reservoirs in particular cause concern in this respect: the first isthe subcontinental lithosphere and the second is the region of the deep mantle that gives rise to man-tle plumes (discussed below). At present, the mass of rare earths in the subcontinental lithospheredoes not seem to be large enough to invalidate the assumptions made. The mantle plume source region
PRIMITIVE MANTLE
CORE
DEPLETED MANTLE
CRUST
F'F
F (?)d
(?)
a
b
CRUST
UPPER MANTLE
LOWER MANTLE
M. d M
. uM1 C1
M2 C2
M3 C3
Figure 11.21. The three reservoirmodel of the mantle. The de-pleted mantle is the source ofMORB and has εNd = +10, thelower mantle is primitive andhas bulk Earth characteristics,e.g., εNd = 0.
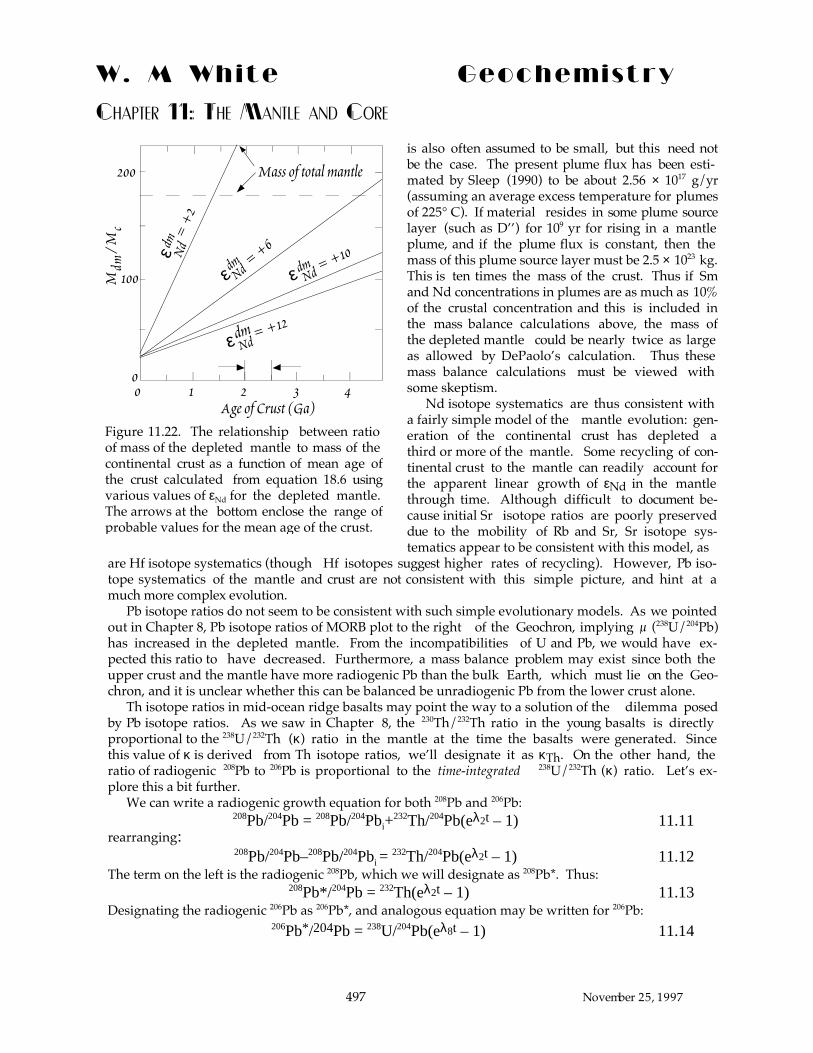
W . M W h i t e G e o c h e m i s t r y
Chapter 11: The Mantle and Core
497 November 25, 1997
is also often assumed to be small, but this need notbe the case. The present plume flux has been esti-mated by Sleep (1990) to be about 2.56 × 10¹⁷ g/yr(assuming an average excess temperature for plumesof 225¡ C). If material resides in some plume sourcelayer (such as DÕÕ) for 109 yr for rising in a mantleplume, and if the plume flux is constant, then themass of this plume source layer must be 2.5 × 10²³ kg.This is ten times the mass of the crust. Thus if Smand Nd concentrations in plumes are as much as 10%of the crustal concentration and this is included inthe mass balance calculations above, the mass ofthe depleted mantle could be nearly twice as largeas allowed by DePaoloÕs calculation. Thus thesemass balance calculations must be viewed withsome skeptism.
Nd isotope systematics are thus consistent witha fairly simple model of the mantle evolution: gen-eration of the continental crust has depleted athird or more of the mantle. Some recycling of con-tinental crust to the mantle can readily account forthe apparent linear growth of εNd in the mantlethrough time. Although difficult to document be-cause initial Sr isotope ratios are poorly preserveddue to the mobility of Rb and Sr, Sr isotope sys-tematics appear to be consistent with this model, as
are Hf isotope systematics (though Hf isotopes suggest higher rates of recycling). However, Pb iso-tope systematics of the mantle and crust are not consistent with this simple picture, and hint at amuch more complex evolution.
Pb isotope ratios do not seem to be consistent with such simple evolutionary models. As we pointedout in Chapter 8, Pb isotope ratios of MORB plot to the right of the Geochron, implying µ (238U/204Pb)has increased in the depleted mantle. From the incompatibilities of U and Pb, we would have ex-pected this ratio to have decreased. Furthermore, a mass balance problem may exist since both theupper crust and the mantle have more radiogenic Pb than the bulk Earth, which must lie on the Geo-chron, and it is unclear whether this can be balanced be unradiogenic Pb from the lower crust alone.
Th isotope ratios in mid-ocean ridge basalts may point the way to a solution of the dilemma posedby Pb isotope ratios. As we saw in Chapter 8, the 230Th/232Th ratio in the young basalts is directlyproportional to the 238U/232Th (κ) ratio in the mantle at the time the basalts were generated. Sincethis value of κ is derived from Th isotope ratios, weÕll designate it as κTh. On the other hand, theratio of radiogenic 208Pb to 206Pb is proportional to the time-integrated 238U/232Th (κ) ratio. LetÕs ex-plore this a bit further.
We can write a radiogenic growth equation for both 208Pb and 206Pb:208Pb/204Pb = 208Pb/204Pbi+
232Th/204Pb(eλ2t – 1) 11.11rearranging:
208Pb/204Pb–208Pb/204Pbi = 232Th/204Pb(eλ2t – 1) 11.12The term on the left is the radiogenic 208Pb, which we will designate as 208Pb*. Thus:
208Pb*/204Pb = 232Th(eλ2t – 1) 11.13Designating the radiogenic 206Pb as 206Pb*, and analogous equation may be written for 206Pb:
206Pb*/204Pb = 238U/204Pb(eλ8t – 1) 11.14
Ndεdm = +12
dmN
d=
+2
ε = +6
ε NddmNdε = +10
dm
1 2 3 4
100
200
0Age of Crust (Ga)
Mdm
/Mc
Mass of total mantle
0
Figure 11.22. The relationship between ratioof mass of the depleted mantle to mass of thecontinental crust as a function of mean age ofthe crust calculated from equation 18.6 usingvarious values of εNd for the depleted mantle.The arrows at the bottom enclose the range ofprobable values for the mean age of the crust.

W . M W h i t e G e o c h e m i s t r y
Chapter 11: The Mantle and Core
498 November 25, 1997
Dividing 11.13 by 11.14, we have: Pb*208
Pb*206 =Th232 (e λ 2t – 1)U238 (e λ 8t – 1)
11.15
For any fixed time the exponentialterm is a constant, so that 208Pb*/204Pb*is proportional to the average κ overthat time. Taking the initial isotoperatios to be the meteoritic values (i.e.,Canyon Diablo troilite), we can calcu-late 208Pb*/206Pb* as:
Pb*208
Pb*206= Pb208 / Pb204 – 29.476
Pb206 / Pb204 – 9.30711.16
From the 208Pb*/206Pb* ratio, we can calculated a time-aver-aged κ, which we denote as κPb, by rearranging equation 11.15:
κ Pb = Pb*208
Pb*206(e λ 8t – 1)(e λ 2t – 1)
11.17
where t is now set to 4.55 Ga, the age of the Earth.Galer and OÕNions (1985) compared values of κPb with κTh
in MORB. They found that the values of κTh averaged about2.5, whereas the time-integrated ones averaged about 3.7.The value of κ in Orgueil (CI-1) is about 3.8, which they tookas the primitive mantle value. The time-integrated value isbarely lower than the primitive mantle value, and muchhigher than the present value. From this they concluded thatPb now in the depleted mantle could not have resided therefor very long. In other words, the depleted mantle appears tobe open to the flow of Pb, with both inputs and outputs. Theycalculated the residence time of Pb in the depleted mantle,the average time spent in the depleted mantle by an atom ofPb, to be about 600 million years.
As we saw earlier in this chapter, there is reason to be-lieve the terrestrial value of κ may be somewhat higher thanthat in Orgueil, perhaps 4 or 4.2. However, with additionaldata, it appears the average value of κTh in MORB is lowerthan 2.5, perhaps about 2.2 (Figure 11.23). The residence timefor Pb calculated using these parameters is about 1 Ga, whichis still short compared to the age of the Earth.
3.7 3.8 3.90
1
2
3
4
5
6
7
8
κPb
1.5 2 2.5 30
2
4
6
8
10
12
κTh
Figure 11.23. Comparison of κPb andκTh in MORB. κPb is the time-inte-grated value of κ calculated from Pbisotope ratios. κTh is the presentvalue, calculated from the230Th/232Th ratio. The time inte-grated value is much higher thanthe present value, implying Pb nowin the depleted mantle could nothave resided there for long.
PacificAtlanticIndian
Rb/Sr
0
5
10
15
20
25
0 .005 .01 .015 .02 .025 .03
µ
6.33MaximumDM µ
Range of permissibleDM Rb/Sr
Figure 11.24. Correlation of Rb/Sr and µ (238U/204Pb) inMORB. Solid line is a regression line, dashed lines repre-sent errors on the regression. The value of Rb/Sr in the de-pleted mantle must be lower than 0.0045, based on Sr iso-tope evolution. From the correlation, this implies µ < 6.33.From White (1993).

W . M W h i t e G e o c h e m i s t r y
Chapter 11: The Mantle and Core
499 November 25, 1997
White (1993) addressed the question of the 238U/204Pb (µ) ratio in the depleted mantle, and con-cluded it was less than about 6, which is lower than the bulk Earth value of about 8. Unlike κ, µ can-not be calculated directly. It can, however, be constrained in several ways. Figure 11.24 illustratesone example. The Rb/Sr ratio in MORB is strongly correlated with µ. From the 87Sr/86Sr ratio inMORB, the maximum Rb/Sr ratio in the depleted mantle can be constrained to be less than 0.0045.Based on the correlation, the value of µ in the depleted mantle must be less than 6.33. The low pres-ent µ in the MORB contrasts with the time-integrated one deduced from the 206Pb/204Pb ratio, the lat-ter being about 9. This difference also leads to the conclusion that the Pb now in the depleted mantlecould not have resided there for very long.
These results suggest a very different model for evolution of the upper mantle than the one basedon Nd isotope ratios discussed above. They suggest that radiogenic isotope ratios and concentrationsof incompatible elements are controlled not simply by the degree of depletion resulting from partialmelting, but by the ratio of the flows into and out of the mantle. In other words, the mantle appearsto be a kinetically controlled system rather than a thermodynamically controlled one. The largescale reservoirs on the surface of the Earth, such as the oceans and the atmosphere, are known to bekinetically controlled in this same sense. So this result should not be too surprising. It appears thatthe compositions of all large chemical systems on the Earth are controlled, at least in part, by kineticfactors.
If there is a flux of Pb and other elements into the depleted mantle, where is this Pb coming from?The continental crust can be easily ruled out as having inappropriate Pb isotope composition. A lowerÒprimitive mantleÓ, originally suggested by Galer and OÕNions (1985), can also be ruled out. White(1993) concluded mantle plumes were supplying this Pb. There are several reasons to believe this isthe case. First, they have the appropriate isotopic composition. Second, only about 10% of the totalplume flux is required to supply the necessary Pb to the depleted mantle. Third, if the suppositionsthat the depleted mantle occupies the uppermost mantle and that plumes come from deeper are cor-rect, then plumes must transit the upper mantle, providing the opportunity to deliver Pb and other in-compatible elements to it. Finally, numerous studies, particularly by J. G. Schilling and coworkers,have shown that plumes do mix with the depleted mantle. For example, Figure 11.25 shows thevariation in Sr isotopes along the northern Mid-Atlantic Ridge. Regions of high 87Sr/86Sr extend hun-dreds of km outward from Iceland and Azores, reflecting mixing of these mantle plumes with the as-thenosphere.
It is presumably this plume flux that buffers the εNd of the depleted mantle as well. As we shallsee below, mantle plumes may contain a significant component of recycled oceanic and continentalcrust. In a sense then, continental recycling may contribute to the flux of material into the depleted
87Sr
/86Sr 0.7030
0.7032
0.7034
0.7036
0.7028
0.7026
0.70220.7024
65° 60° 55° 50° 45° 40° 35° 30° N
2σ
Latitude
Gib
bs F
Z
FAM
OU
S
Icela
nd
Azo
res
Figure 11.25. Sr isotope variations along the Mid-Atlantic Ridge. After White et al. (1976).

W . M W h i t e G e o c h e m i s t r y
Chapter 11: The Mantle and Core
500 November 25, 1997
upper mantle, although indirectly.
Geochemical Evolution of Mantle Plume Reservoirs
As Figures 11.14 through 11.17 demonstrate, the geochemistry of OIB is more variable than that ofMORB. Oceanic island volcanism is thought to be the surface manifestation of mantle plumes. Man-tle plumes are columns of buoyant mantle that rise from the deep mantle. Exactly how deep is uncer-tain. Fluid dynamic experiments and numerical simulations indicate that they must arise from athermal boundary layer (a region where heat is transported conductively rather than convectively).The only certain thermal boundary layer in the mantle is the base: the core-mantle boundary. If thethermodynamics of the phase change at 660 km prevents convection accross the 660 km discontinuity,then it would be a thermal boundary layer as well. Thus plume come either from the core-mantleboundary or the 660 km discontinuity. At present, most geophysicists and geochemists suspect it is theformer.
There are clear systematic relationships in the geochemistry of plumes. White (1985) found thatOIB could be divided into 4 distinct groups based on their Sr, Nd and Pb isotopic compositions. Thusthough there are many mantle plumes and each is to some degree geochemically unique, there appearto be a much smaller number of geochemical reservoirs from which plumes are drawn. These groups,named St. Helena, Society, Kerguelen, and Hawaii for a type island, show distinctive correlationsbetween isotope ratios or have distinctive isotopic compositions. For example, OIB of the St. Helenagroup, which encompasses the Austral Islands (Pacific), the Comores (Indian), and Ascension(Atlantic) as well as St. Helena (Atlantic), have Sr and Nd isotope ratios that plot below the mainarray (Figure 11.26), and their Pb isotopic compositions are very radiogenic. Indeed, all basalts withvery radiogenic Pb (206Pb/204Pb > 20) plot within or close to the St. Helena field on a Sr-Nd isotopediagram. Similarly, islands of the Society group, which include the Azores (Atlantic), the Marque-sas (Pacific), and Samoa (Pacific) as well as the Societies (Pacific), define a shallower Sr-Nd iso-tope correlation than do basalts from Kerguelen group islands, which include Tristan da Cunha(Atlantic), and Juan Fernandez (Pacific) as well as Kerguelen (Indian). The Kerguelen group OIB al-ways have less radiogenic Pb than the Society group. Zindler and Hart (1986) subsequently renamedthey groups as HIMU (St. Helena), EMI (Kerguelen), EMII (Societies), and these names are now morecommonly used than the originals. The term HIMU comes from high-µ, as these basalts are charac-terized by high 206Pb/204Pb. The term EM is an abbreviation for ÔEnriched MantleÕ. In addition,
-6
-4
-2
0
2
4
6
8
10
12
.704 .706 .708
εNd
.702
87Sr
/86Sr
EM I
EM II
HIMU
DMM
MORB
Kerguelen
Society
St. Helena
.703
.704
.705
.706
.707
.708
17 18 19 20 21 22
EM I
EM II
HIMUDMM
KerguelenSociety
St. Helena
MORB
206Pb/204Pb87Sr/86Sr.703
Figure 11.26. Isotopic classes of oceanic basalts of White (1985) and end-member compositions ofZindler and Hart (1986).
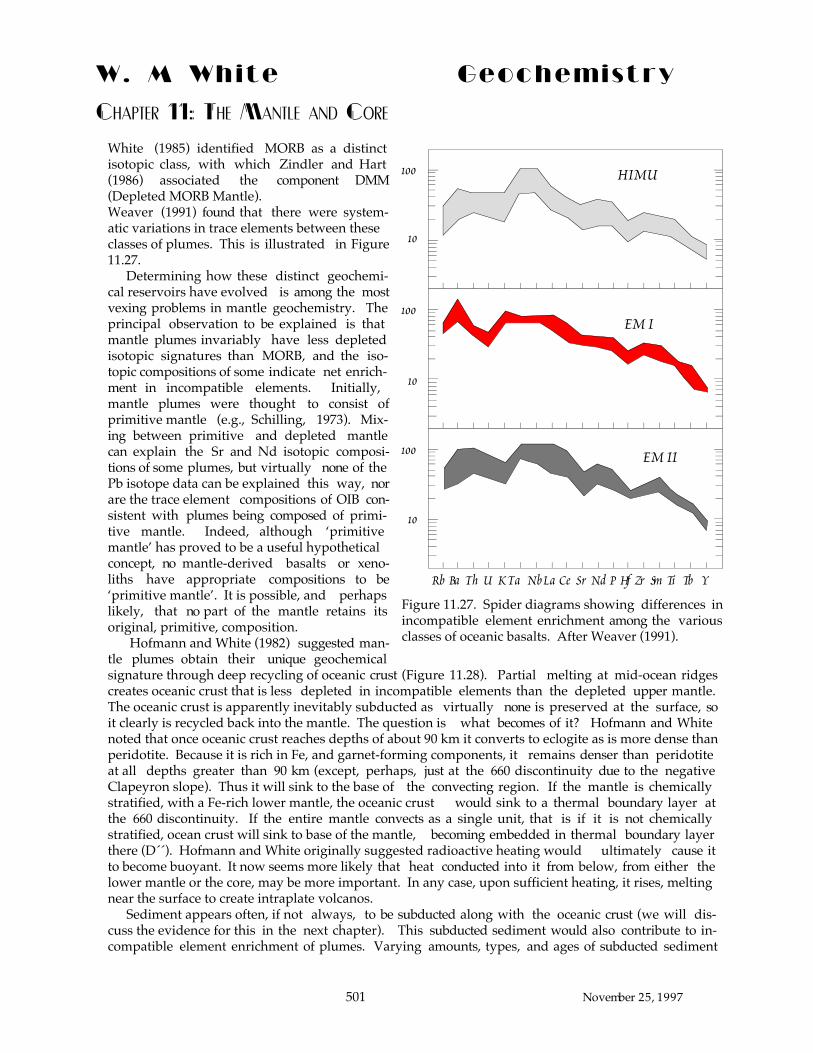
W . M W h i t e G e o c h e m i s t r y
Chapter 11: The Mantle and Core
501 November 25, 1997
White (1985) identified MORB as a distinctisotopic class, with which Zindler and Hart(1986) associated the component DMM(Depleted MORB Mantle).Weaver (1991) found that there were system-atic variations in trace elements between theseclasses of plumes. This is illustrated in Figure11.27.
Determining how these distinct geochemi-cal reservoirs have evolved is among the mostvexing problems in mantle geochemistry. Theprincipal observation to be explained is thatmantle plumes invariably have less depletedisotopic signatures than MORB, and the iso-topic compositions of some indicate net enrich-ment in incompatible elements. Initially,mantle plumes were thought to consist ofprimitive mantle (e.g., Schilling, 1973). Mix-ing between primitive and depleted mantlecan explain the Sr and Nd isotopic composi-tions of some plumes, but virtually none of thePb isotope data can be explained this way, norare the trace element compositions of OIB con-sistent with plumes being composed of primi-tive mantle. Indeed, although ÔprimitivemantleÕ has proved to be a useful hypotheticalconcept, no mantle-derived basalts or xeno-liths have appropriate compositions to beÔprimitive mantleÕ. It is possible, and perhapslikely, that no part of the mantle retains itsoriginal, primitive, composition.
Hofmann and White (1982) suggested man-tle plumes obtain their unique geochemicalsignature through deep recycling of oceanic crust (Figure 11.28). Partial melting at mid-ocean ridgescreates oceanic crust that is less depleted in incompatible elements than the depleted upper mantle.The oceanic crust is apparently inevitably subducted as virtually none is preserved at the surface, soit clearly is recycled back into the mantle. The question is what becomes of it? Hofmann and Whitenoted that once oceanic crust reaches depths of about 90 km it converts to eclogite as is more dense thanperidotite. Because it is rich in Fe, and garnet-forming components, it remains denser than peridotiteat all depths greater than 90 km (except, perhaps, just at the 660 discontinuity due to the negativeClapeyron slope). Thus it will sink to the base of the convecting region. If the mantle is chemicallystratified, with a Fe-rich lower mantle, the oceanic crust would sink to a thermal boundary layer atthe 660 discontinuity. If the entire mantle convects as a single unit, that is if it is not chemicallystratified, ocean crust will sink to base of the mantle, becoming embedded in thermal boundary layerthere (D««). Hofmann and White originally suggested radioactive heating would ultimately cause itto become buoyant. It now seems more likely that heat conducted into it from below, from either thelower mantle or the core, may be more important. In any case, upon sufficient heating, it rises, meltingnear the surface to create intraplate volcanos.
Sediment appears often, if not always, to be subducted along with the oceanic crust (we will dis-cuss the evidence for this in the next chapter). This subducted sediment would also contribute to in-compatible element enrichment of plumes. Varying amounts, types, and ages of subducted sediment
10
100
10
100
10
100
Rb U K Nb Sr Hf TiP ZrTa Ce NdLaThBa Sm Tb Y
HIMU
EM I
EM II
Figure 11.27. Spider diagrams showing differences inincompatible element enrichment among the variousclasses of oceanic basalts. After Weaver (1991).
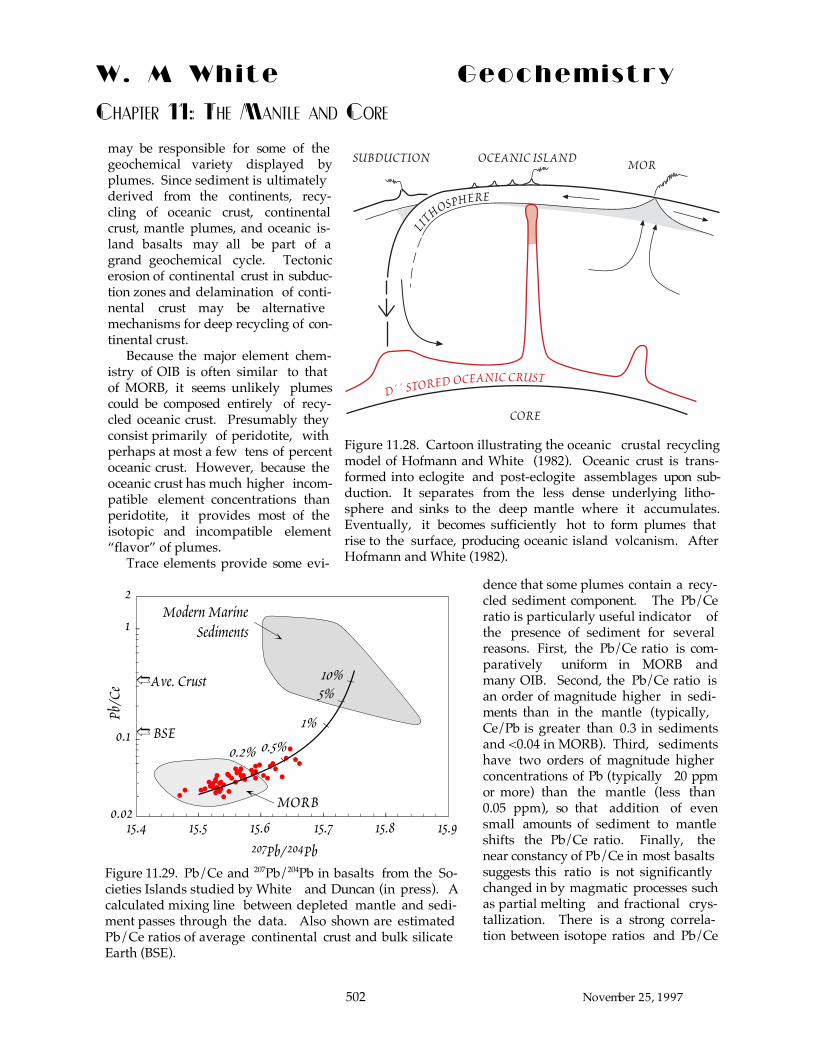
W . M W h i t e G e o c h e m i s t r y
Chapter 11: The Mantle and Core
502 November 25, 1997
may be responsible for some of thegeochemical variety displayed byplumes. Since sediment is ultimatelyderived from the continents, recy-cling of oceanic crust, continentalcrust, mantle plumes, and oceanic is-land basalts may all be part of agrand geochemical cycle. Tectonicerosion of continental crust in subduc-tion zones and delamination of conti-nental crust may be alternativemechanisms for deep recycling of con-tinental crust.
Because the major element chem-istry of OIB is often similar to thatof MORB, it seems unlikely plumescould be composed entirely of recy-cled oceanic crust. Presumably theyconsist primarily of peridotite, withperhaps at most a few tens of percentoceanic crust. However, because theoceanic crust has much higher incom-patible element concentrations thanperidotite, it provides most of theisotopic and incompatible elementÒflavorÓ of plumes.
Trace elements provide some evi-
dence that some plumes contain a recy-cled sediment component. The Pb/Ceratio is particularly useful indicator ofthe presence of sediment for severalreasons. First, the Pb/Ce ratio is com-paratively uniform in MORB andmany OIB. Second, the Pb/Ce ratio isan order of magnitude higher in sedi-ments than in the mantle (typically,Ce/Pb is greater than 0.3 in sedimentsand <0.04 in MORB). Third, sedimentshave two orders of magnitude higherconcentrations of Pb (typically 20 ppmor more) than the mantle (less than0.05 ppm), so that addition of evensmall amounts of sediment to mantleshifts the Pb/Ce ratio. Finally, thenear constancy of Pb/Ce in most basaltssuggests this ratio is not significantlychanged in by magmatic processes suchas partial melting and fractional crys-tallization. There is a strong correla-tion between isotope ratios and Pb/Ce
LIT
HOSPHERE
MOR
CORE
OCEANIC ISLANDSUBDUCTION
D´´ STORED OCEANIC CRUST
Figure 11.28. Cartoon illustrating the oceanic crustal recyclingmodel of Hofmann and White (1982). Oceanic crust is trans-formed into eclogite and post-eclogite assemblages upon sub-duction. It separates from the less dense underlying litho-sphere and sinks to the deep mantle where it accumulates.Eventually, it becomes sufficiently hot to form plumes thatrise to the surface, producing oceanic island volcanism. AfterHofmann and White (1982).
JJJ
JJJ
J JJ J
JJXJ
J
JJ
J
J
JJJJ
JJ
JJJJJJJ
JJJJJJ
JJ
J
JJ
J
J J
J
J
JJ
Ave. Crust
BSE
MORB0.02
0.1
1
2Modern Marine
Sediments
1%0.5%
5%
0.2%
10%
15.4 15.5 15.6 15.7 15.8 15.9207Pb/204Pb
Pb/C
e
➯
➯
Figure 11.29. Pb/Ce and 207Pb/204Pb in basalts from the So-cieties Islands studied by White and Duncan (in press). Acalculated mixing line between depleted mantle and sedi-ment passes through the data. Also shown are estimatedPb/Ce ratios of average continental crust and bulk silicateEarth (BSE).

W . M W h i t e G e o c h e m i s t r y
Chapter 11: The Mantle and Core
503 November 25, 1997
in basalts from the Society Islands. AsFigure 11.29 shows, the correlation isconsistent with mixing between recy-cled sediment and mantle.
An alternative origin for mantleplumes was proposed by McKenzie andOÕNions (1983). They noted the com-mon evidence for incompatible elementenrichment in the subcontinentallithosphere (which we discuss in thenext section) and suggested this mate-rial may occasionally become delami-nated. Because it is cold, it would alsosink to the deep mantle. As in the caseof the Hofmann and White model, itwould be stored in a thermal boundarylayer, heated, and rise in the form ofmantle plumes. However, recent stud-ies have shown that the Os isotopecomposition of the subcontinentallithosphere is quite distinctive, andquite different from that of mantleplumes, as we shall see in the next sec-tion. This rather strongly suggeststhat ÒdelaminatedÓ subcontinentallithosphere does not contribute to man-tle plumes. Because mantle plumescome in several geochemical varieties, it is possible that both mechanisms operate. Indeed, other asyet unknown processes may be involved as well.
Most oceanic islands show some variability in their isotopic compositions, defining elongated ar-rays on plots of isotope ratios. Such elongated arrays suggest mixing. This raises the rather obviousquestion of what is mixing with what. In a few cases, the Comores are a good example, the elongatearrays seems to reflect mixing between different plume reservoirs. The Comores data defines a trendin isotopic space that appears to be the result of mixing between an EMI and a HIMU component. Inother cases, such as the Galapagos, the plume is clearly mixing with the depleted upper mantle.However, in many cases, the cause of the isotopic variation is less clear.
Hart et al. (1992) plotted oceanic basalt isotope data in three dimensions, with axes of 87Sr/86Sr,143Nd/144Nd, and 206Pb/204Pb (Figure 11.30). Principal component analysis confirmed that 97.5% of thevariance in the oceanic basalt isotope data could be accounted for by these ratios (leaving 2.5% to beaccounted for by 207Pb/204Pb, 208Pb/204Pb, and 176Hf/177Hf). They found that most of the data plottedwithin a tetrahedron defined by the hypothetical end members EM1, EM2, HIMU, and DMM. Theyalso noticed that many arrays were elongated toward the base of this tetrahedron on the DMM-HIMU join. From this they concluded that in many, if not most cases, mantle plumes appear to mixingwith a previously unidentified component, which they named ÒFOZOÓ (an acronym for Focal Zone),that has the approximate isotopic composition of 87Sr/86Sr = 0.7025, εNd = +9, and 206Pb/204Pb = 19.5.They suggested that FOZO is the isotopic composition of the lower mantle and that plumes risingfrom the core mantle boundary entrain and mix with this lower mantle material. It is unclear, how-ever, whether such a composition for the lower mantle can be fitted to reasonable isotopic mass bal-ances for the Earth. A rather similar idea was presented by Farley et al. (1992), who point out thatthis additional component, which they called ÒPHEMÓ, seems to be associated with high 3He/4He.White (1995) concurred with these ideas, but argued that the 87Sr/86Sr of FOZO is higher, and the εNd
HIMUDMM
EM2EM 1
Mangaia
St Helena
Samoa
Tristan
MORB
Cameroon Line
Cape Verde
Haw
aiiPi
tcairn
Walv
isSo
cietie
sAzor
es
FOZO
Sr
Nd Pb
Figure 11.30. Three dimension plot of 87Sr/86Sr, 143Nd/144Nd,and 206Pb/204Pb. Most oceanic basalt data plot within a tet-rahedron defined by the composition of EMI, EMII, HIMU,and DMM components. Oceanic islands and island chainstend to form elongate isotopic arrays, many of which seem topoint toward a focal zone (FOZO) at the base of the tetrahe-dron. Adapted from Hart et al. (1992).

W . M W h i t e G e o c h e m i s t r y
Chapter 11: The Mantle and Core
504 November 25, 1997
lower, than estimated by Hart et al. (1992) and probably closer to the values chosen by Farley et al.(1992).
If Hart et al. (1992) are correct, this may explain why the isotopic composition of some volcanos,notably those of Hawaii and the Society Islands, change over time. Hawaiian volcanos commonly gothrough several evolutionary stages: a shield-building stage, during which the volcanic edifice israpidly constructed and a relatively uniform tholeiitic basalt is erupted, followed by a late stage,during which eruption rates drop dramatically and compo-sition shift to alkali basalt, and, following a significanthiatus in activity, a post-erosional stage in which smallvolumes of basanite and nephelinite are erupted. Theselatter magmas types are thought to be produced by smalldegrees of melting. Through this sequence, isotope ratiosevolve, with 87Sr/86Sr decreasing and εNd increasing (e.g.,Chen and Frey, 1985).
White and Duncan (1996) observed a similar pattern involcanos of the Society Islands. The argued that this evo-lution in isotopic composition reflects the passage of thevolcano over a compositionally zoned mantle plume (Figure11.31). The most incompatible element enriched material,which is also the hotest, is located in the center, andformed the core of the plume. This is surrounded by asheath of material that is viscously entrained by theplume as it rises. It is cooler and also not as enriched in in-compatible elements. When the volcano is over the core ofthe plume, the degree of melting is high, giving rise totholeiitic basalt with high 87Sr/86Sr and high eruptionrates during the shield building stage. When the volcano isover the sheath, the extent of melting is smaller, producingsmall volumes of nephelinite with low 87Sr/86Sr.
There is also a geographic pattern to both the distribu-tion of mantle plumes and their isotopic compositions.Mantle plumes appear to be preferentially located withinregions of slow lower mantle seismic velocities, as may beseen in Figure 11.32. There are two areas where isotopiccompositions are particularly extreme (e.g., high 87Sr/86Sr),one in the southeastern Indian Ocean and South Atlantic,the other in the central South Pacific (Hart, 1984; Castillo,1989). The anomaly in the Indian Ocean is called theDUPAL anomaly, while that in the South Pacific is calledthe SOPITA anomaly. Interestingly enough, both anoma-lies close to regions where lower mantle seismic velocitiesare particularly slow (Figure 11.32), which indicate lowdensities. The low density in turn implies that these areregions of high temperatures in the lower mantle. Whilethe exact significance of this remains unclear, it does estab-lish a connection with oceanic island volcanism and lowermantle properties, strengthening the plume hypothesis,and favoring a lower mantle origin for plumes.
There is still much to understand about the nature andevolution of the mantle. Many of the ideas presented herewill undoubtedly evolve in the future and new studies pro-
Shield-building Phase
Post-erosional Phase
Figure 11.31. Cartoon of a model thatexplains why isotopic signatures ofmagmas become more ÒdepletedÓ asvolcanos evolve. During the Òshield-building stageÓ the time of most vigor-ous growth, the volcano is located di-rectly over the plume, and magmas arederived from the hot core of theplume, which has enriched isotopicsignatures (high 87Sr/86Sr, low εNd).Because of lithopsheric plate motion,the volcano will be located over theedge of the plume during later stages,such as in the post-erosional stage.During this stage magmas are derivedfrom the viscously entrained sheath,which has more ÒdepletedÓ isotopicsignatures. After White and Duncan(1996).

W . M W h i t e G e o c h e m i s t r y
Chapter 11: The Mantle and Core
505 November 25, 1997
vide new insights into the workings of the mantle.
The Subcontinental Lithosphere
Figure 11.33a shows Sr and Nd isotopic variations in continental basalts. The data span a muchlarger range than oceanic basalts. Some, but not all, of this variation reflects the effects of assimila-tion of continental crust on the isotopic signatures of the mantle-derived magmas. Assimilation ef-fects can be avoided by considering only the data on peridotite xenoliths in continental basalts, thedata for which is shown in Figure 11.33b. As may be seen, the range of values is reduced, but never-theless much greater than that observed in oceanic basalts. One needs be cautious in directly compar-ing the heterogeneity observed in xenolith data to basalt data because the two represent differentscales of sampling of the mantle. Basalts are created by melting of regions that have characteristicscales of tens of kilometers, and perhaps greater in some cases. The magma generation process un-doubtedly averages out very small scale heterogeneities. Xenoliths, on the other hand, have charac-teristic dimensions of centimeters. Thus variations in isotope ratios in basalts reflect large scale het-erogeneity in the mantle, while xenoliths reflect small scale heterogeneity. Despite this, it appearsthat the subcontinental lithosphere is more heterogeneous, even on relatively large scales, than isthe suboceanic mantle.
It appears that the subcontinental mantle can be quite old, and often has the same age as the crustit underlies. Studies of xenoliths and inclusions in diamond from South African kimberlites suggeststhe mantle is 3 Ð3.5 Ga old in this region, ages similar to that of the South African craton. Thegreater isotopic heterogeneity of the subcontinental lithosphere probably reflects it long term stabil-ity, which allows variations in parent-daughter ratios to be expressed in variations in radiogenicisotope ratios. Convective mixing in the suboceanic mantle will tend to destroy heterogeneity in thesuboceanic mantle.
Though many xenoliths have isotopic compositions indicating incompatible element enrichment,others xenoliths show parts of the subcontinental lithosphere can be extremely incompatible elementdepleted. εNd values of +500 have been recorded in garnets in eclogites from the Roberts Victor minekimberlite. These eclogites appear to be rafts of subducted oceanic crust stranded in the subcontinen-tal lithosphere over 3 Ga ago, an interpretation supported by highly variable oxygen isotope ratiosin the eclogites. They apparently suffered extreme LRE depletion around that time, perhaps by a
H
HH
H
HHH
H
H H
HH
H
HH
H
HH
H
H
H
H
H
H
HHH
H
H
H
H
H H
HH
HH
H
20.0
0.0
-20.0
0.0 0.0
-20.0
20.0
-20.0
0.0
0.0
DUPAL
SOPITA
Figure 11.32. Map showing the distribution of mantle plumes (triangles), P-wave velocity anomalies(m/sec) averaged over the whole lower mantle (red lines), and location of the DUPAL and SOPITAisotope anomalies (pale red regions). Mantle plumes are located in regions of slow lower mantleseismic velocities, implying high temperatures. The DUPAL and SOPITA anomalies are locatednear seismic velocity minima. After Castillo (1989).

W . M W h i t e G e o c h e m i s t r y
Chapter 11: The Mantle and Core
506 November 25, 1997
small degree of melting or dehydration after subduction. Much of the subcontinental lithosphere mayconsist of mantle from which partial melts have been extracted to form the continental crust. Inter-esting, when the upper mantle undergoes melting both the melt and residual solid will have a den-sity that is less than the original material. This residue is less dense is because garnet, a very densephase, is preferentially removed during melting. Thus both the crustal and mantle parts of the conti-nental lithosphere have relatively low density, which may help to explain its stability.
If the subcontinental lithosphere is residual material from which melts have been extracted, whyare xenoliths and basalts with ÒenrichedÓ isotopic signatures so common? What process or processescould have produced this incompatible element enrichment of many parts of the subcontinental litho-sphere? One possibility, first suggested by Brooks et al. (1976), is that partial melts from mantleplumes migrate upward into the lithosphere, where they freeze. The extent to which upwellingmantle can melting will depend on the depth to which it rises. Where continental lithosphere pre-
0.5135
0.5130
0.5125
0.5120
0.5115 0.702 0.706 0.710 0.714 0.716 0.722-20
-15
-10
-5
0
5
10
15
Floodbasalts
Rio Grande
AustralianKimberlites
Laacher See
Gaussberg
Massif CentralMt. Melboure
S. African Kimberlites
N. Atlantic Tertiary
Geronimo
Basin & Range
LuciteHills
EtnaAtaq
Afar
Italian
AhaggarCONTINENTAL VOLCANICS
εNd
.5110
.5114
.5118
.5122
.5126
.5130
.5134
.702 .704 .706 .708 .712.710 .714 .716
Diopside
GarnetAmphibole
MORBOIB
143 N
d/14
4 Nd
87Sr/86Sr
InclusionsIn diamonds
0.7550.8350.732
143 N
d/14
4 Nd
87Sr/,86Sr
CONTINENTAL XENOLITHS
Figure 11.33. (a) top. Sr and Nd isotope ratios in continental basalts. (b)bottom. Sr and Nd isotope ratios in xenoliths in continental basalts. AfterZindler and Hart (1986).

W . M W h i t e G e o c h e m i s t r y
Chapter 11: The Mantle and Core
507 November 25, 1997
vents plumes from rising above 200 km depth or so, the degree of melting is likely to be quite small,meaning the melts would be quite incompatible element enriched. These melts could then migrateupward into the lithosphere, reacting with it and enriching it in incompatible elements. Yet anotherpossibility is that hydrous fluids released during dehydration of subducting oceanic lithosphere maymigrate into the continental lithosphere and react with it (Hawkesworth, 1990). Judging from studiesof island arc magmas (Chapter 12), such fluids appear to be particularly enriched in soluble incom-patible elements, such as the alkalis and alkaline earths. These processes in which lithosphere re-acts with melts or fluids is known as mantle metasomatism*. Petrographic studies of some xenolithsclearly reveal features, such as the secondary growth of hydrous minerals such as phlogopite (Mg-rich mica) and richterite (an alkali-rich amphibole) indicative of such metasomatism.
Recent studies of Os isotope ratios in xenoliths from the subcontinental lithosphere have been par-ticularly enlightening. Most xenoliths derived from below regions of old continental crust have lowOs isotope ratios, which imply that low Re/Os ratios were established long ago. The low Re/Os ra-tios are consistent with the idea that this material undergone partial melting in the past, since Re ismoderately incompatible, and would partition into the melt, while Os is highly compatible, andwould remain in the solid. Despite their low 187Os/188Os ratios, many of these same xenoliths havequite low εNd (Figure 11.34). The low εNd suggests incompatible element enrichment, and hence wouldappear to be inconsistent with the high 187Os/188Os ratios (Figure 11.34). The explanation of thisparadox appears to be that Os iswas not affected by the metaso-matism that enriched these re-gions in incompatible elementsand decreased Sm/Nd ratios(e.g., Carlson and Irving, 1994).Apparently, neither Re nor Osare transported effectively bymetasomatic fluids. If the flu-ids are aqueous, this is perhapsnot surprising, since these ele-ments have low solubilities un-der reducing conditions. If thefluids are silicate melts, it is un-clear why they do not transportRe. The answer may have to dowith dependence of the Re pari-tion coefficient on compositionand oxygen fugacity.
Regardless of why it arises,these unusual Os-Nd isotopesystematics provide the conti-nental lithosphere with a dis-tinctive isotopic signature, andgeochemists a means of identi-fying continental lithosphere.In an earlier section, we dis-cussed the hypothesis of
* Metasomatism is defined in metamorphic petrology as a subsolidus process that results in a net changein the composition of the metamorphic rock. Usually this is accomplished by the flow of aqueoussolutions through the rock. The term Ômantle metasomatismÕ is widely used to refer to reaction betweenrock and silicate liquid as well as between rock and aqueous solution.
J
J J
J
J
J
J
J
E
E
E
E
CCCCC CC
F FAAA A
AA AAAAAA AAAAAA ???? ?H
HHH
HH H
2B
-50
-40
-30
-20
-10
0
10
20
-20 0 20 40 60
εNd
γOs
DUM
J WyomingE SiberiaC SamoaF SocietyA Australs
? St. HelenaH Comores2 KerguelenB Pitcairn
OIB (Mantle Plumes)
Subcontinental Lithosphere
Figure 11.34. εNd vs. γOs in xenoliths from the subcontinentallithosphere and oceanic island basalts. Despite low andvariable εNd, the subcontinental lithosphere appears to becharacterized by systematically low γOs (γOs is the percentdeviation of the 187Os/188Os ratio from the condritic value).

W . M W h i t e G e o c h e m i s t r y
Chapter 11: The Mantle and Core
508 November 25, 1997
McKenzie and OÕNions that subcontinentallithosphere can delaminate and sink to thebottom of the mantle where it is incorporatedinto mantle plumes. The distinctive isotopesignatures of mantle plumes on the one handand subcontinental lithosphere on the other(Figure 11.34) is inconsistent with this hy-pothesis.
Continental flood basalts provide anotherinteresting example. These are hugh outpour-ing of basaltic lava that apparently occurredwithin relatively short time intervals, a fewmillion years and possibly less in some cases.The great oceanic plateaus, such as Ontong-Java and Kerguelen are the marine equiva-lents. A number of continental floods basaltscan be clearly associated with mantle plumes.For example, the Deccan Traps erupted 65 mil-lion years ago when India lay directly overthe Reunion mantle plume, and the Parana inBrazil and Etendeka in Namibia were erupted130 million years ago over the Tristan daCunha mantle plume when Africa and South
America were rifting. These observations have given rise to the idea that continental flood basaltsare produced when new mantle plumes arrive at the surface. Fluid dynamic experiments and simula-tions show that new plumes will have large bulbous heads. When the heads arrive in the uppermantle, they melt, producing a pulse of volcanism. Others, however, have argued on geochemicalgrounds that continental flood basalts are produced by melting of the continental lithosphere. Be-cause mantle plumes and continental lithosphere have such different Os and Nd isotope signatures,Os-Nd systematics provide a means of discriminating between these possibilities. Because of the dif-ficulties in determining Os isotope ratios in basalts, only one such study has been carried out thus far.In it, Ellam et al. (1992) found that the Karroo flood basalts, erupted in South Africa 190 millionyears ago, have Os and Nd isotope compositions that lie on mixing lines connecting mantle plumecompositions and continental lithosphere compositions (Figure 11.35). Thus at least in this case, thenboth a mantle plume and continental lithosphere appear to have contibuted to the magmas. Thedata also demonstrate the assimilation of continental crust cannot explain the low εNd observed inthese basalts.
References and Suggestions for Further Reading
Ahrens, T. J. and R. Jeanloz. 1987. Pyrite: shock compression, isentropic release, and composistion ofthe Earth's core. J. Geophys. Res. 92: 10363-10375.
Albar�de, F. 1995. Introduction to Geochemical Modeling. Cambridge: Cambridge Univ. Press.All�gre C. J., Dupr�, B., and Lewin, E., 1986. The thorium/uranium ratio of the Earth, Chem. Geol.,
56: 219-227.All�gre, C. J., J. P. Poirier, E. Humler and A. W. Hofmann. 1995. The chemical composition of the
Earth. Earth Planet Sci. Lett. 134: 515-526.All�gre, C. J., O. Br�vart, B. Dupr�, and J. F. Minster, 1980. Isotopic and chemical effects produced in a
continuously differentiating convecting Earth mantle, Phil Trans. R. Soc. Lond. A 297, 447-477.Anderson, D. L. 1989. Theory of the Earth. Boston: Blackwell Scientific Publishers.Armstrong, R. L., 1968. A model for the evolution of strontium and lead isotopes in a dynamic Earth,
Rev. Geophys., 6, 175-199.
+25+20+15+10+50-5-10
-10-50
+5
+10
+15
-15
γOS
εNd
J
J
J
JJ
E E
E
OIB
MORB
HIMU
LithosphericPeridotites
PlumeMelt
a
bc Continental
Crust
Figure 11.35. εNd of picritic basalts from the Karrooflood basalts plotted against γOs . The fall betweenthe fields. Three lines, illustrating 3 mixingmodels (different concentrations of Os and Nd inthe end-members), connect the fields of xenolithsfrom the subcontinental lithosphere and oceanicisland basalts (i.e., mantle plumes). The data fallclose to these lines, suggesting they are mixtures ofmelts of lithosphere and a mantle plume. AfterEllam et al. (1992).

W . M W h i t e G e o c h e m i s t r y
Chapter 11: The Mantle and Core
509 November 25, 1997
Brooks, C., D. E. James and S. R. Hart, Ancient lithosphere: its role in young continental volcanism.,Science, 193, 1086-1094, 1976.
Carlson, R. W. and A. J. Irving. 1994. Depletion and enrichment history of subcontinentallithospheric mantle; an. Earth and Planetary Science Letters. 126: 457-472.
Castillo, P. 1989. The Dupal anomaly as a trace of the upwelling lower mantle. Nature. 336: 667-670.Chase, C. G. and P. J. Patchett, 1988. Stored mafic/ultramafic crust and early Archean mantle deple-
tion, Earth Planet. Sci. Lett., 91, 66-73.Chen, C.-Y. and F. A. Frey. 1985. Trace element and isotopic geochemistry of lavas from Haleakala
Volcano, east Maui, Hawaii: implications for the origin of Hawaiian basalts. Jour. Geophys. Res.90: 8743-8768.
Chopelas, A., R. Beohler and K. T. 1994. Thermodynamics and behavior of γ-Mg2SiO4 at high pres-sure: implications for Mg2SiO4 phase equilibrium. Phys. Chem. Mineral. 21: 351-359.
DePaolo, D. J., 1980. Crustal growth and mantle evolution: inferences from models of element trans-port and Nd and Sr isotopes, Geochim Cosmochim Acta, 44, 1185-1196.
DePaolo, D., 1983. The mean life of continents: estimates of continent recycling rates from Nd and Hfisotopic data and implications for mantle structure, Geophys. Res. Lett., 10: 705-708.
Dickin, A. 1995. Radiogenic Isotope Geochemistry. Cambrige: Cambridge University Press.Ellam, R. M., R. W. Carlson and S. B. Shirey. 1992. Evidence from Re-Os isotopes for plume-litho-
sphere mixing in Karoo flood basalt genesis. Nature. 359: 718-721.Farley, K. A., J. H. Natland and H. Craig. 1992. Binary mixing of enriched and undegassed
(primitive ?) mantle components (He, Sr, Nd, Pb) in Samoan lavas. Earth Planet. Sci. Lett. 111: 183-199.
Galer, S. J. G. and R. K. O'Nions, 1985. Residence time of thorium, uranium and lead in the mantlewith implications for mantle convection., Nature, 316, 778-782.
Hart, S. R. 1984. The DUPAL anomaly: A large scale isotopic mantle anomaly in the Southern Hemi-sphere. Nature. 309: 753-757.
Hart, S. R. and A. Zindler, 1986. In search of a bulk-earth composition. Chem. Geol., 57: 247-267.Hart, S. R., E. H. Hauri, L. A. Oschmann and J. A. Whitehead, 1992. Mantle Plumes and entrainment:
isotopic evidence, Science, 256, 517-520.Hawkesworth, C. J., P. D. Kempton, N. W. Rogers, R. M. Ellam and P. W. van Calsteren. 1990. Conti-
nental mantle lithosphere, and shallow level enrichment processes in the Earth's mantle. EarthPlanet Sci. Lett. 96: 256-268.
Hofmann, A. W. and W. M. White, 1982. Mantle Plumes from ancient oceanic crust, Earth Planet. Sci.Lett., 57, 421-436.
Hofmann, A. W. and W. M. White. 1983. Ba, Rb, and Cs in the Earth's mantle. Z. Naturforsch. 38:256-266.
Hofmann, A. W., Chemical differentiation of the Earth: the relationship between mantle, continen-tal crust, and oceanic crust, Earth Plan Sci Lett, 90, 297-314, 1988.
Jahn, Bor-Ming, G. Gerau, and A. Y. Glikson, 1982. Komatiites of the Onverwacht Group, S. Africa:REE geochemistry, Sm/Nd age and mantle evolution. Contrib. Mineral. Petrol. 80: 25-40.
Jones, J. H., and M. J. Drake, 1986. Geochemical constraints on core formation in the Earth, Nature,322: 221-228.
Kato, T., A. E. Ringwood and T. Irifune, 1988. Constraints on element partition coefficients betweenMgSiO3 perovskite and liquid determined by direct measurements, Earth Plan. Sci. Lett., 90, 65-68.
Kesson, S. E., J. D. Fitz Gerald and J. M. G. Shelley. 1994. Mineral chemistry and density of subductedbasaltic crust at lower mantle pressures. Nature. 372: 767-769.
McDonough, W. F. and S.-S. Sun. 1995. The composition of the Earth. Chem. Geol. 120: 223-253.McKenzie, D. P. and R. K. O'Nions, 1983. Mantle reservoirs and ocean island basalts, Nature, 301,
229-231.Menzies, M. A. and C. J. Hawkesworth (ed.), 1987, Mantle Metasomatism, London: Academic Press.
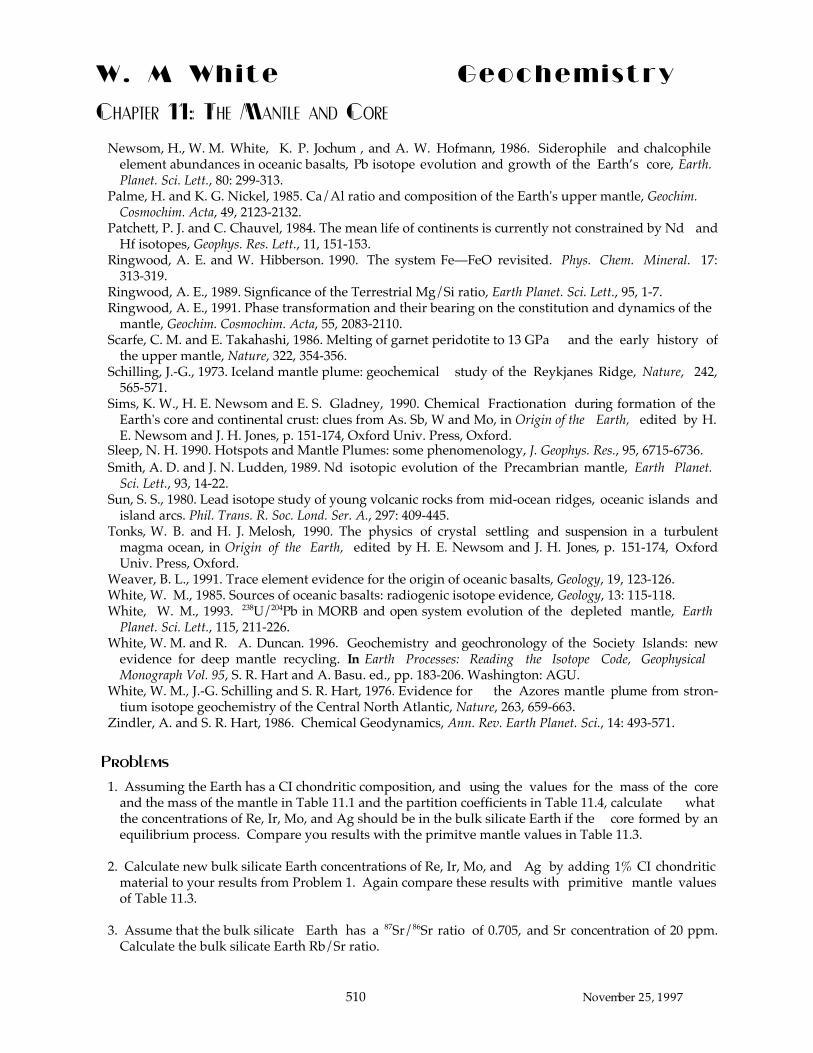
W . M W h i t e G e o c h e m i s t r y
Chapter 11: The Mantle and Core
510 November 25, 1997
Newsom, H., W. M. White, K. P. Jochum , and A. W. Hofmann, 1986. Siderophile and chalcophileelement abundances in oceanic basalts, Pb isotope evolution and growth of the EarthÕs core, Earth.Planet. Sci. Lett., 80: 299-313.
Palme, H. and K. G. Nickel, 1985. Ca/Al ratio and composition of the Earth's upper mantle, Geochim.Cosmochim. Acta, 49, 2123-2132.
Patchett, P. J. and C. Chauvel, 1984. The mean life of continents is currently not constrained by Nd andHf isotopes, Geophys. Res. Lett., 11, 151-153.
Ringwood, A. E. and W. Hibberson. 1990. The system FeÑFeO revisited. Phys. Chem. Mineral. 17:313-319.
Ringwood, A. E., 1989. Signficance of the Terrestrial Mg/Si ratio, Earth Planet. Sci. Lett., 95, 1-7.Ringwood, A. E., 1991. Phase transformation and their bearing on the constitution and dynamics of the
mantle, Geochim. Cosmochim. Acta, 55, 2083-2110.Scarfe, C. M. and E. Takahashi, 1986. Melting of garnet peridotite to 13 GPa and the early history of
the upper mantle, Nature, 322, 354-356.Schilling, J.-G., 1973. Iceland mantle plume: geochemical study of the Reykjanes Ridge, Nature, 242,
565-571.Sims, K. W., H. E. Newsom and E. S. Gladney, 1990. Chemical Fractionation during formation of the
Earth's core and continental crust: clues from As. Sb, W and Mo, in Origin of the Earth, edited by H.E. Newsom and J. H. Jones, p. 151-174, Oxford Univ. Press, Oxford.
Sleep, N. H. 1990. Hotspots and Mantle Plumes: some phenomenology, J. Geophys. Res., 95, 6715-6736.Smith, A. D. and J. N. Ludden, 1989. Nd isotopic evolution of the Precambrian mantle, Earth Planet.
Sci. Lett., 93, 14-22.Sun, S. S., 1980. Lead isotope study of young volcanic rocks from mid-ocean ridges, oceanic islands and
island arcs. Phil. Trans. R. Soc. Lond. Ser. A., 297: 409-445.Tonks, W. B. and H. J. Melosh, 1990. The physics of crystal settling and suspension in a turbulent
magma ocean, in Origin of the Earth, edited by H. E. Newsom and J. H. Jones, p. 151-174, OxfordUniv. Press, Oxford.
Weaver, B. L., 1991. Trace element evidence for the origin of oceanic basalts, Geology, 19, 123-126.White, W. M., 1985. Sources of oceanic basalts: radiogenic isotope evidence, Geology, 13: 115-118.White, W. M., 1993. 238U/204Pb in MORB and open system evolution of the depleted mantle, Earth
Planet. Sci. Lett., 115, 211-226.White, W. M. and R. A. Duncan. 1996. Geochemistry and geochronology of the Society Islands: new
evidence for deep mantle recycling. In Earth Processes: Reading the Isotope Code, GeophysicalMonograph Vol. 95, S. R. Hart and A. Basu. ed., pp. 183-206. Washington: AGU.
White, W. M., J.-G. Schilling and S. R. Hart, 1976. Evidence for the Azores mantle plume from stron-tium isotope geochemistry of the Central North Atlantic, Nature, 263, 659-663.
Zindler, A. and S. R. Hart, 1986. Chemical Geodynamics, Ann. Rev. Earth Planet. Sci., 14: 493-571.
Problems
1. Assuming the Earth has a CI chondritic composition, and using the values for the mass of the coreand the mass of the mantle in Table 11.1 and the partition coefficients in Table 11.4, calculate whatthe concentrations of Re, Ir, Mo, and Ag should be in the bulk silicate Earth if the core formed by anequilibrium process. Compare you results with the primitve mantle values in Table 11.3.
2. Calculate new bulk silicate Earth concentrations of Re, Ir, Mo, and Ag by adding 1% CI chondriticmaterial to your results from Problem 1. Again compare these results with primitive mantle valuesof Table 11.3.
3. Assume that the bulk silicate Earth has a 87Sr/86Sr ratio of 0.705, and Sr concentration of 20 ppm.Calculate the bulk silicate Earth Rb/Sr ratio.
W . M W h i t e G e o c h e m i s t r y
Chapter 11: The Mantle and Core
511 November 25, 1997
4. Suppose a rising mantle plume is 220¡ hotter than surrounding mantle and that the γ-olivineÐMg-perovskite transition occurs at 600 km depth in the surrounding mantle. Assume a homgeneous man-tle density of 3.5 g/cc at 660 km and above. At what depth does the γ-olivineÐMg-perovskite tran-sition occur within the mantle plume?
5. Whether the γ-olivineÐMg-perovskite transition is endothermic or exothermic will affect mantleconvection (i.e., sinking of lithospheric slabs, rise of mantle plumes). Discuss why this is so, ex-plaining the effects of both endothermic and exothermic phase transitions on rising mantle plumesand sinking lithospheric slabs.
W . M W h i t e G e o c h e m i s t r y Chapter 10: The Mantle and Core
418 November 25, 1997