chapter 11 evaluating the performance of fabrics for
TRANSCRIPT

J ai Shri Ram J ai Hanum an
Chapter 11 Evaluating the performance of fabrics for sportswear
Praburaj Venkatraman
Table of contents
Introduction .........................................................................................................................................1
Physical measurements for woven and knitted fabrics ................................................................4
Fabric area density: ........................................................................................................................5
Fabric Thickness: ............................................................................................................................6
Fabric bulk density .........................................................................................................................8
Fabric construction .........................................................................................................................8
Fabric cover factor........................................................................................................................10
Fabric count ...................................................................................................................................10
Evaluating durability .......................................................................................................................11
Abrasion resistance .......................................................................................................................12
Fabric handle in sportswear............................................................................................................17
Fabric stiffness...............................................................................................................................18
Fabric drape ...................................................................................................................................19
Fabric stretch and recovery ........................................................................................................20
Measurement of fabric comfort ......................................................................................................22
Wicking and its effect on fabric comfort ..................................................................................23
Moisture Management Tester (MMT) ......................................................................................23
Influence of moisture transfer in functional clothing (Permetest) ......................................27
Fabric specifications and interpreting results .............................................................................30
References ...........................................................................................................................................35
Introduction
Evaluation of fabrics for its performance is mandatory particularly during design and
development of sportswear and performance apparel. By investigating the properties of
fabrics through textile testing it is possible to determine its suitability for its intended
application. Specific fibre types can be blended to meet consumer requirements, for

J ai Shri Ram J ai Hanum an
instance, in sportswear stretch plays an important role in adapting to various body
movements (Roy, 2014). Stretch can also controlled in specific directions which allows
support to specific muscles. X-bionic bib tight (X-Bionic®, 2014) has the ability to apply
pressure to specific muscles as well as to transport moisture during intensive nature of
the sport. Such a product design could would not exist if properties of materials were not
explored in the first instance. ISPO textrends 2015/16 categorises fabrics used in sports
apparel into eight applications, base layer, second layer, outer layer, membrane and
coatings, fibres for insulation, trims, accessories and soft equipment used in sports.
Evaluation of sportswear involve a series of tests to ascertain the performance of the
garment and accessories and it varies based on the application and requirements (Table
1). The most important aspect in sportswear is moisture management and thermal balance.

J ai Shri Ram J ai Hanum an
In this chapter, specific test methods relating to fabric durability, fabric handle, stretch
and recovery, moisture transport, water vapour permeability and thermal resistance are
discussed. The test methods are referred to British standards which provide definition of
various parameters, examples are included to enable the reader to interpret the test results
and explanation is provided on how those parameters affect garment performance and
research relating to these parameters (Figure 1).
Table 1 Various sports and their requirements
Popular sports Fabrics usedFrequently used
product nameSpecific properties
CyclingBrushed knitted fabrics
with stretch
Cycling tights Three-way stretch
Insulation during winter
Soft next to the skin
Skiing
Warp knitted fabric
Base layer thermal Thermal resistance
Stretch and recovery
Moisture permeable
Single weft knit, napped
technical back
Mid layer fleeceThermal insulation
Breathable coated woven
fabrics (high density)
Outer shell jackets Water proof
Breathable
Durable
Running
Warp/weft knitted fabric
with bi-directional stretch
Compression tights – Stretch and recovery
Comfort
Knitted fabric Tops and leggings
Woven fabricJogging shorts Light weight
Quick drying
Football
Warp and weft knitTights Stretch and recovery
Moisture permeable
Knitted fabricTops Comfortable/moisture
management
Woven fabric Trousers Durable
Swimming
Woven and knit fabrics
with elastomeric
filaments
Female/male swim
suitsStretch and recovery
Quick drying
DurableTraining jackets and
trousers

J ai Shri Ram J ai Hanum an
Figure 1 Different type of individual sport
Physical measurements for woven and knitted fabrics
Fabric’s physical parameters play an important role in determining their characteristics
which is widely used by professionals as ‘specifications’ whilst making decisions such as
suitability for a particular end use or to communicate across the fashion supply chain. In
this section, the following parameters will be discussed:
• Fabric area density or fabric weight
• Fabric thickness
• Fabric bulk density

J ai Shri Ram J ai Hanum an
• Fabric construction
• Fabric count
• Fabric cover factor
Fabric area density:
Fabric weight is mass per unit area, denoted in grams per square metre (g/m2). It is an
important fabric property that is often used in determining the fabric cost and quality. For
woven fabrics it is calculated by preparing a fabric specimen to dimension 100 x 100 mm
and weighing them in a scale. The resultant value is multiplied by 100 to calculate it for
a metre. In industry, the fabric area density is also calculated using gsm cutter (Figure 2),
which is circular in shape.
For knitted fabrics, ���� ������� = (� � � � �) ÷ 100
Where, s – stitch density per cm2; l – stitch length is length of yarn in a knitted loop, and
T – yarn count in tex (Anand, 2000).
Stitch density refer to the total number of loops and is obtained by determining the wales
per cm (wpc) and courses per cm (cpc) in a measured area and multiplying both the
values, which is 315 cm2. For example wpc – 15 and cpc – 21 for single jersey fabric, the
stitch density is obtained multiplying these values. A typical stitch length of 2.55 and
yarn count 16 tex. The area density for a knitted fabric is obtained using the above formula
1, which is 128.5 g/m2. Fabric weight affects the fabric stiffness especially the bending
rigidity particularly in the warp direction (Mandal and Abraham, 2009). Table 2 classifies
area density of fabrics based on the application.

J ai Shri Ram J ai Hanum an
Figure 2 Fabric gsm cutter(Image courtesy of MMU Textile Lab)
Table 2 Fabric weight for fabrics used in sportswear
Fabric type grams/square
metre (g/m2)
Function /end uses
Very light weight
fabric
18 Base layer, light weight, moisture management
smooth fabric worn next to skin
Light weight fabric < 100 Mid layer fabric used for tops, trousers, trainers,
etc.
Medium weight
fabric
130 - 180 Soft shell fabrics used outer layer jackets, these
are either laminated or coated with finishes
Heavy weight fabrics 250+ Hard shell heavy weight fabrics used for jackets,
trousers, and high performance technical
materials used for outdoor applications
Fabric Thickness:
It is the distance between the upper and lower surface of the fabric and is measured using
a thickness gauge or tester (Figure 3). The test sample is placed between two reference
plates which exerts a known pressure on the sample. The distance between plates is
recorded in mm (BS EN ISO 5084). The fabric thickness affects garment production

J ai Shri Ram J ai Hanum an
especially in adjusting the sewing machine settings. This could be selection of a needle
or fabric feed system. Selection of needle depends on the stitch density (seams per inch)
required. In sportswear stitch density is finer than for a jacket. For knitwear, a ball pointed
tip is preferred which prevents from fabric damage (laddering effect). For instance, in the
case of knitted stretch fabrics with fine thickness that slips during sewing due to slippage
results in fabric being gathered or staggered, in this case, a differential feed system at the
top and bottom will be used in sewing machine, one end will feed the fabric quicker and
the other feeds slowly resulting in a good quality seam. Fabric thickness also affects the
overall performance of a garment, especially, the abrasion resistance of fabrics, the higher
the fabric thickness, the higher resistance to abrasive action (Özdil et al, 2012). Table 3
generally classifies the thickness of fabrics.
Figure 3 Fabric thickness tester
(Image courtesy of MMU Textile Lab)

J ai Shri Ram J ai Hanum an
Fabric bulk density
Fabric bulk density takes into account the fabric weight and thickness. It represent the
bulkiness of the fabric relative to its thickness. It is an important factor in determining
the garment comfort. A thick fabric with an average weight is more comfortable in cold
conditions or outdoor sports on the other hand a thin fabric of same weight will be ideal
in warm conditions. It is generally expressed in g/cm3. Bulk density is calculated using
the equation given below.
���� ������� =������ �ℎ�������� �� �� � ������ ����ℎ� �� �/���
10,000
Fabric construction
The repeat of the design is presented by shading the box that represents the warp
interlacing over the weft yarn (Figure 4 and 5). This is called ‘fabric design’ construction.
Table 3 Fabric Thickness
Type Thickness (mm)
Thin < 0.20
Medium 0.23 – 0.46
Thick > 0.47
Source: Collier and Epps (1999)

J ai Shri Ram J ai Hanum an
Figure 5 Point paper for weft knitted fabric representation
(Source: Taylor, 1999)

J ai Shri Ram J ai Hanum an
Fabric cover factor
Cover factor for woven fabrics indicates the extent to which a fabric area is covered by
one set of yarns. In woven fabrics, cover factor is determined in warp and weft direction.
In knitted fabrics cover factor is also termed as tightness factor. It is generally denoted
by K.
It is calculated using the formula, � =������� ��� �� √���
��for woven fabrics
Tightness factor � =√���
������ ������ �� ��for knitted fabrics
Fabric count
A fabric counter or magnifying glass is used to determine fabric count. Fabric count is
assessed by counting the number of warp or weft yarns in woven fabric (Figure 6b) and
counting the number of courses and wales in knitted fabrics (Figure 6a). The fabric count
plays an important role in determining the closeness of the weave or knit that affects
various properties such as porosity, permeability, durability of the fabric.
Figure 6 a Knitted fabric structure Figure 6b Woven fabric structure
(Source: Dreamstime)
Co
urs
ep
er
inch
Wales per inchW
eft
yarn
sWarp yarns

J ai Shri Ram J ai Hanum an
Evaluating durability
Durability is one of the important parameter when selecting a fabric for a particular end
use. Sports activity involves repeated body movements and sportswear can abrade in
several ways, for instance fabric rubbing with another layer of fabric, fabric abrading in
particular areas including, crotch, knee, and under arms; rubbing against another object
due to trip or fall; garment abrasion while laundering; and abrasion can also occur
between yarns and fibres when fabric is stretched repeatedly. The effect of fabric abrasion
depends on various elements, fibre type and its properties; yarn quality and its structure;
and fabric construction.
Factors that affect abrasion resistance of fabrics
• Presence of longer fibres in the yarn offer better resistance to abrasion than short
fibres
• Increased in fibre diameter enhances resistance to a certain extent
• Optimum yarn twist offers good resistance to abrasion
• Increasing yarn linear density increases resistance with a constant fabric density
• Uniform yarn crimp in the fabric (warp and weft) enables even wear across the
fabric
• Warp or weft floats are highly susceptible to abrasion
• Fabric weight and its relative thickness affects the abrasion resistance
• Abrasion also depends on fabric count (ends and picks per inch) the more threads
per inch the lesser the wear
• Type of yarns also affects abrasion resistance, for instance, air jet spun yarn – high
resistance to abrasion; ring spun yarn possess moderate resistance and open –end
spun yarn possess low resistance to abrasion

J ai Shri Ram J ai Hanum an
Abrasion resistance
The usual method to evaluate fabric abrasion is Martindale abrasion tester, where the
instrument (BS EN ISO 12947-2/2014) subjects specimen to a uniform rubbing motion
(Lissajou’s figure) and is repeated until two threads are broken (woven fabric). Various
methods are used to determine the end of the test are the evaluation of change in before
and after sample weight, change in colour using a colour change chart (ISO 105 A02) or
examining whether the sample distortion or being rubbed away and completion of
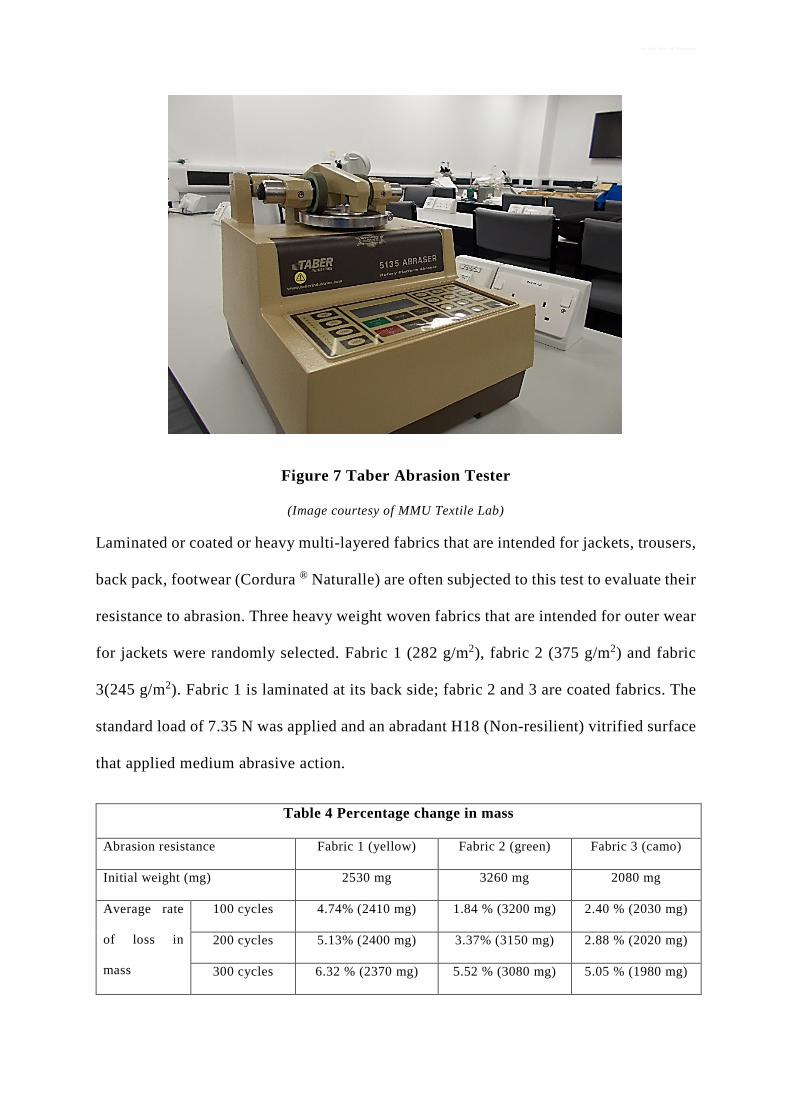
specified number of cycles (Johnson and Cohen, 2010). However, in this section Taber
Abrasion tester is discussed (BS EN ISO 5470-1/1999) that works on the principle of
rotary platform which tests flat abrasion and is intended for heavier woven and knitted
fabrics as the abrading action is severe (Figure 7). In this method, the instrument uses a
flat abrasive action in which the fabric is placed on a rotatory platform and is abraded by
two abrasive wheels. Six samples of dimension 114 ±1 mm diameter with a central hole
of diameter 6.35 mm is chosen and is conditioned. The load applied can be varied
depending upon the type of abrasion required for instance from very gentle (2.5 N) to
harsh action (9.8 N). Similarly, the rotary wheels can be either rubber and abrasive grain
or vitrified version depending on the required abrasive action. The sample weight is
measured prior to test in milligrams. To determine the average rate of loss in mass, the
loss in mass for every 100 cycles should be recorded. The end of test is determined by
change in colour of abraded portion, change in mass, or change in surface distortion.
J ai Shri Ram J ai Hanum an
Figure 7 Taber Abrasion Tester
(Image courtesy of MMU Textile Lab)
Laminated or coated or heavy multi-layered fabrics that are intended for jackets, trousers,
back pack, footwear (Cordura ® Naturalle) are often subjected to this test to evaluate their
resistance to abrasion. Three heavy weight woven fabrics that are intended for outer wear
for jackets were randomly selected. Fabric 1 (282 g/m2), fabric 2 (375 g/m2) and fabric
3(245 g/m2). Fabric 1 is laminated at its back side; fabric 2 and 3 are coated fabrics. The
standard load of 7.35 N was applied and an abradant H18 (Non-resilient) vitrified surface
that applied medium abrasive action.
Table 4 Percentage change in mass
Abrasion resistance Fabric 1 (yellow) Fabric 2 (green) Fabric 3 (camo)
Initial weight (mg) 2530 mg 3260 mg 2080 mg
Average rate
of loss in
mass
100 cycles 4.74% (2410 mg) 1.84 % (3200 mg) 2.40 % (2030 mg)
200 cycles 5.13% (2400 mg) 3.37% (3150 mg) 2.88 % (2020 mg)
300 cycles 6.32 % (2370 mg) 5.52 % (3080 mg) 5.05 % (1980 mg)

J ai Shri Ram J ai Hanum an
400 cycles 7.50% (2340 mg) 6.44 % (3050 mg) 5.76 % (1960 mg)
500 cycles 7.90% (2330 mg) 8.58 % (2980 mg) 6.25% (1950 mg)
Average 6.32 % 5.15% 4.46%
Figure 8 Taber abrasion test samples
It could be observed from Table 4 that in the case of fabric1, the specimen endured surface
distortion between 300-500 cycles and rate of loss of mass is higher especially at 500
cycles. At 500 cycles, the top surface of the fabric had been lost leaving the coating
exposed. In the case of fabric 2, the rate of loss of mass varied and the fabric surface was
distorted and loss of colour was also noted. However, the fabric structure remained
unaltered. The thickness of fabric 3 was less compared to remaining samples and fabric
surface was distorted with change in colour and thread bare was also noted at 500 cycles.
The samples are illustrated in Figure 8 which shows the material at the start and at the
end of 500 cycles.
Fabric pilling
Pilling is a fault commonly observed in knitted woollen goods or fabrics made from soft
twist yarns. Pilling occurs when rubbing action in wear causes loose fibres from surface
J ai Shri Ram J ai Hanum an
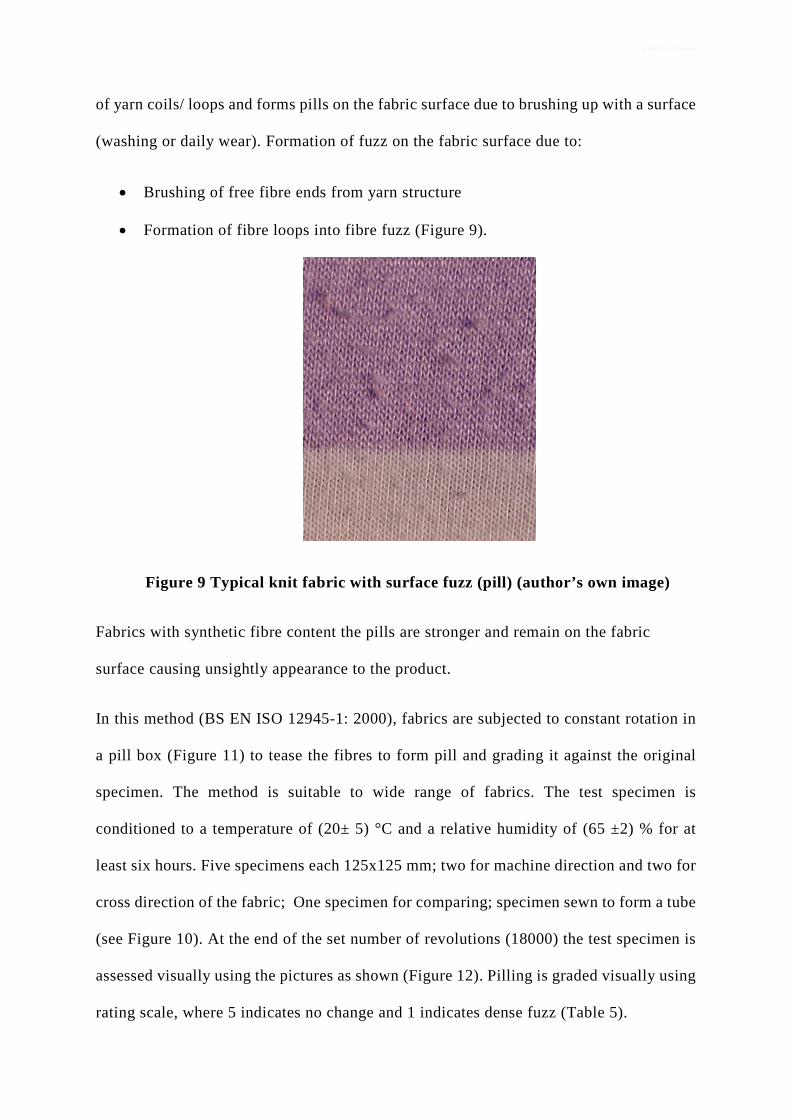
of yarn coils/ loops and forms pills on the fabric surface due to brushing up with a surface
(washing or daily wear). Formation of fuzz on the fabric surface due to:
• Brushing of free fibre ends from yarn structure
• Formation of fibre loops into fibre fuzz (Figure 9).
Figure 9 Typical knit fabric with surface fuzz (pill) (author’s own image)
Fabrics with synthetic fibre content the pills are stronger and remain on the fabric
surface causing unsightly appearance to the product.
In this method (BS EN ISO 12945-1: 2000), fabrics are subjected to constant rotation in
a pill box (Figure 11) to tease the fibres to form pill and grading it against the original
specimen. The method is suitable to wide range of fabrics. The test specimen is
conditioned to a temperature of (20± 5) °C and a relative humidity of (65 ±2) % for at
least six hours. Five specimens each 125x125 mm; two for machine direction and two for
cross direction of the fabric; One specimen for comparing; specimen sewn to form a tube
(see Figure 10). At the end of the set number of revolutions (18000) the test specimen is
assessed visually using the pictures as shown (Figure 12). Pilling is graded visually using
rating scale, where 5 indicates no change and 1 indicates dense fuzz (Table 5).

J ai Shri Ram J ai Hanum an
Figure 10 Preparation of sample for pilling test
(Author’s image)
Figure 11 Pilling box used to measure pilling resistance of fabrics
(Image courtesy of MMU Textile Lab)

J ai Shri Ram J ai Hanum an
Figure 12 Pilling assessment photographs
(Image courtesy of MMU Textile Lab)
Table 5 Visual Assessment: Fabric pilling
Rating Description Notes
5 No change No visible change
4 Slight change Slight surface fuzzing
3 Moderate change Exhibits fuzzing and/or pills
2 Significant change Distinct fuzzing and/or pilling
1 Severe change Dense fuzzing and/or pilling covering specimen.
Fabric handle in sportswear
In fashion industry, a number of personnel handle fabrics for its suitability to an end-use
especially during manufacturing. Fabric handle is an individual’s response to touch when
a fabric is handled. This could also refer to how a fabric drape. A number of subjective
attributes have been used to refer fabric handle, for instance, smooth, rough, stiff, soft,
crisp, silky, etc. Subjective grading is often not consistent, as what a person perceives as
J ai Shri Ram J ai Hanum an
appealing may not be for the other person. In this section, various methods to determine
the fabric handle are discussed which can be utilised to characterise the fabrics for its
performance and determine its relevance to a particular end use. These are fabric stiffness,
fabric drape and crease recovery. Fabric stiffness refers ability of the fabric to bend on
its own weight. Stiffness refers to resistance to bending. In casual sports tops, the most
widely preferred fabric is a single jersey which is not stiff compared to a tightly woven
twill fabric.
Fabric stiffness
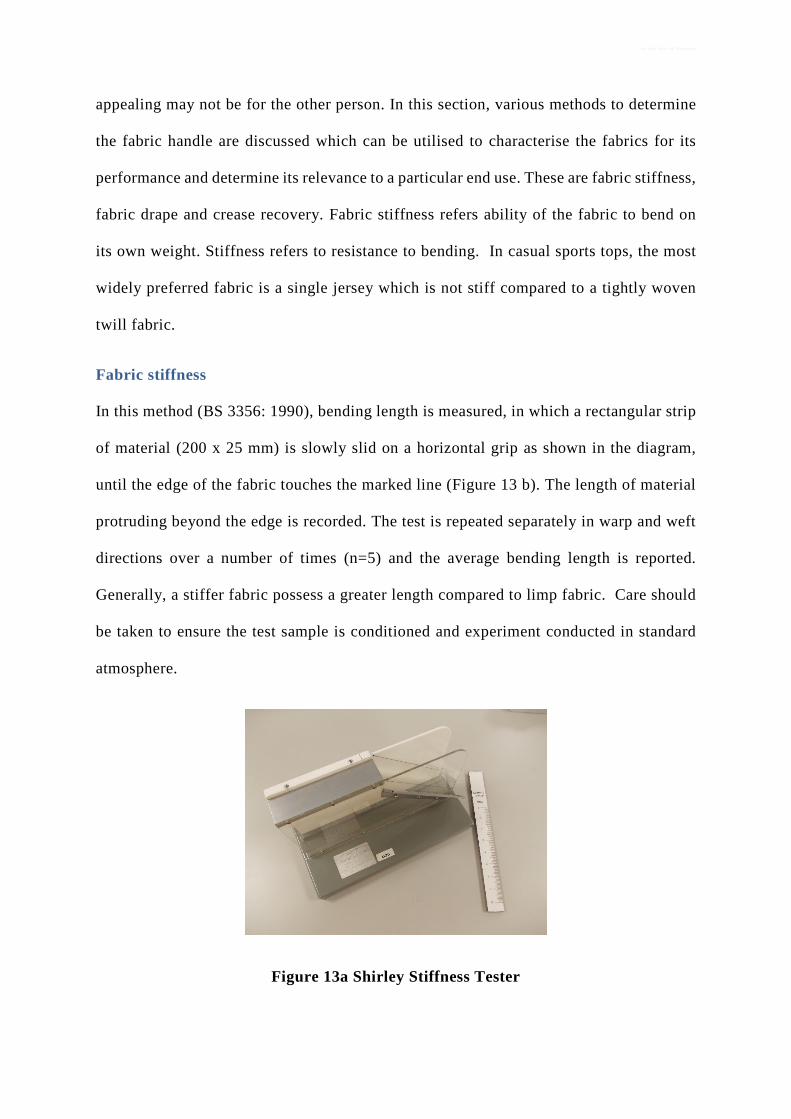
In this method (BS 3356: 1990), bending length is measured, in which a rectangular strip
of material (200 x 25 mm) is slowly slid on a horizontal grip as shown in the diagram,
until the edge of the fabric touches the marked line (Figure 13 b). The length of material
protruding beyond the edge is recorded. The test is repeated separately in warp and weft
directions over a number of times (n=5) and the average bending length is reported.
Generally, a stiffer fabric possess a greater length compared to limp fabric. Care should
be taken to ensure the test sample is conditioned and experiment conducted in standard
atmosphere.
Figure 13a Shirley Stiffness Tester

J ai Shri Ram J ai Hanum an
Figure 13b. Close-up view here >
(Image courtesy of MMU Textile Lab)
Flexural rigidity (G) is calculated using the equation given below which determines the
resistance of fabrics to bending by external forces. Flexural rigidity,� = 0.1 ��� where,
M is mass per unit area in g/cm2 and C is bending length in cm. Flexural rigidity is
reported in mg.cm.
Fabric drape
Drape is a characteristic of a material to freely fall or hang over a three dimensional form.
This parameter is important to determine fabric handle. In this method, (BS 5058: 1973),
a fabric specimen of diameter 30 cm for medium fabrics (24 cm diameter for limp fabrics;
36 cm diameter for stiff fabrics) is placed on a circular disc (Figure 14) and the specimen
is allowed to drape on its own weight. Using a light source placed beneath the specimen,
a shadow of the draped specimen is cast on a paper ring (Figure 14b). The outline of the
fabric shadow traced on the paper (of known mass, ��) and traced paper ring is weighed
(��). Drape coefficient is calculated as the percentage of the total area of the paper ring
obtained by vertically projecting the shadow of the draped specimen.
A fabric with a drape coefficient closer to 100% is stiffer, whilst a fabric with drape
coefficient closer to zero is pliable and more drapeable. In woven fabric grain affects

J ai Shri Ram J ai Hanum an
drape in garments. Figure 1 illustrates a plain single jersey fabric whose drape coefficient
was 20% indicating a limp fabric.
Figure 14a Drape meter Figure 14b Shadow of the draped specimen
(Image courtesy of MMU Textile Lab)
����� ����������� (%) =��
��� 100
where, �� is weight of paper in the shadow region (g); �� is weight of paper ring (g). The
experiment is repeated for six specimens and average is reported and is carried out in
standard atmospheric conditions (BS 1051), i.e. a relative humidity of 65 ± 2 % and a
temperature of 20 ± 2 °C. Limp fabrics are difficult to handle during the garment
manufacture mainly during fabric laying-up, spreading and stitching. Stiff fabrics are
difficult to form body form shapes particularly shoulder, arm hole, etc.
Fabric stretch and recovery
Importance of stretch and recovery was highlighted in Chapter 7. During wearing and
removal of knitwear or certain sportswear stretch is an important parameter. BS
4294:1968 is commonly used to determine the stretch and recovery of woven and knit
fabrics using the apparatus Fryma fabric extensiometer. It consists of two jaws (75 mm
wide), a fixed and a movable jaw capable of holding the specimen without slippage (see

J ai Shri Ram J ai Hanum an
Figure 15). The apparatus is capable of applying a load of 6 kg. The conditioned test
specimen is prepared to 200 x 75 ±1 mm in both warp and weft direction for woven fabrics
and course and weft directions for knit fabrics. The number of test specimen is usually
five in both directions.
Figure 15 Fryma Extensiometer
(Image courtesy of MMU Textile Lab)
For most knitted fabrics, the distance between the inner edges of two clamps is set at 75
mm (L1) and for 200mm for woven fabrics. A reference ‘mark’ is made on the fabric at
the inner edges of the clamp using a marker. The load (eg. 6 kg for knits) is applied slowly
for 10 seconds and immediately reduced within 7.5 seconds and test specimen return to
original position. Immediately, the load is re-applied for 1 minute and the stretch of the
fabrics is recorded (L2). Now the load is reduced and clamps are brought to original
position. The test specimen is removed from the apparatus and allowed to remain flat for
one minute and the distance between the two reference mark is now recorded (L3). Using
the above values, the stretch properties of the fabric is calculated.
J ai Shri Ram J ai Hanum an
Mean extension (%)= 100 ��� � ��
��; Mean residual extension (%) = 100 �
�� � ��
��
On a general note, fabrics that offer stretch is expected to recover within 3% of its original
extension (Saville, 1999). The stretch and recovery properties of fabrics are essential
while designing garments for sportswear, particularly those that can stretch either in one
direction (warp or weft) or in both the directions. In addition, it is very important to
comprehend the amount of stretch required for different body movements. Voyce et al
(2005) explained how a person’s skin stretches considerably with some key areas of
stretch including 35% to 45% at knees and elbows, 13-16% at the shoulder back and with
sporting activities increasing such numbers, stretch of sportswear apparel is key element
for comfort. Normal body movement expands the skin by 10-50% and strenuous
movements in sports will require least resistance from garment and instant recovery.
Hence, it is vital that stretch and recovery vales are taken into account while creating
fabric panels for the garment manufacture particularly those that are intended for form
fitting gear for swimming, cycling, etc. For a compression top made of warp knit structure
with fibre composition 63% nylon, 23% Nylon and 14% elastane, the typical stretch and
recovery values are, stretch in course direction – 95%; wale direction – 94%; recovery
96% in course direction and 95% in wale direction (Allsop, 2012). This indicates that the
fabric can provide uniform stretch in both the directions which is ideal for compression
sportswear.
Measurement of fabric comfort
Athletes perceive comfort as an important factor while making a purchase or selecting a
garment for training or event. During intensive sport, the core temperature of the human
body changes and perspires to balance the excessive heat (Pocock and Richards, 2009).
The most important factor while designing sportswear is moisture management and

J ai Shri Ram J ai Hanum an
wicking. Performance of fabrics are affected by a combination of fibre properties and
composition, yarn formation, and fabric structure (see Chapter 3).
In sportswear, particularly athletic apparel fabrics chosen should have quick drying and
good wicking property to handle excess sweat produced by the body. Zhou et al. (2014)
highlighted that fibres with greater surface area has better wicking. Zhou et al. reported
the comfort properties of six interlock knitted fabrics made from various blends of
chemically and physically modified polyester filament (PET) with trefoil cross section
and cotton fibres. Modified polyester fibre had enhanced moisture management
particularly 35% PET and 65% cotton blend knitted fabric.
Wicking and its effect on fabric comfort
Wicking is the movement of liquid by capillary action, provided that the liquid wets the
assembly of fibres so that it can move from its source to some distance against the
gravitational forces by occupying the available capillary spaces. The smallest capillary
possess greater capillary forces, hence the wickability. Wicking depends upon the surface
properties of fibres, surface area, density, thickness and the capillary path through the
fabric. Moreover, the rate of wicking is different along warp (wale) than weft (coarse)
direction.
Moisture Management Tester (MMT)
The moisture management tester was developed by Hong Kong Polytechnic University
and SDL Atlas Textile Testing Solutions to determine the dynamic liquid transport
properties of knitted and woven fabrics. The test method is depends on the change in the
contact electrical resistance of fabric during moisture transport (Yao et al., 2008). The
apparatus is used to measure the liquid transport in multiple directions. MMT consists of

J ai Shri Ram J ai Hanum an
upper and lower concentric moisture sensors (Figure 16). The pre-defined amount of
saline solution (simulated sweat) is introduced on to the upper side of the fabric, which
allows the saline to spread the fabric outer surface, through the fabric and lower surface
of the fabric. The following six moisture management properties are measured:
1. Wetting time for (top (WTt) and bottom surface (WTb) in seconds
2. Absorption rate for top (ARt) and bottom surface (ARb) of the fabric in percentage
per second
3. Maximum wetted radius (mm) for top (MWRt) and bottom surface (MWRb) of the
fabric in mm
4. Spreading speed for top surface (SSt) and bottom surface (SSb) in mm/sec
5. Accumulated one-way transport capacity in percentage
6. Overall moisture management capacity (OMMC)
MMT is connected to personal computer and software records the moisture transport
through the fabric and produces various illustration including water content vs time; water
location vs time (Figure 17); finger print of moisture management properties (Figure 18).
McQueen et al. (2013) reported a development of a protocol to assess the fabric suitability
for testing moisture management properties using MMT.
MMT grades fabric for six indices and classifies fabrics as, water proof fabric, water
repellent fabric, slow absorbing and slow drying fabric, fast absorbing and slow drying
fabric, fast absorbing and quick drying fabric, water penetration fabric and moisture
management fabric (See Finger print). The moisture management equipment have been
recognised by AATCC (American Association for Textile Chemists and Colourists) in its
test method AATCC 195:2009.

J ai Shri Ram J ai Hanum an
Figure 16 Moisture Management Tester (MMT)
(Image courtesy of MMU Textile Lab)
Figure 17 MMT output – water location Vs time
(Image courtesy of MMU Textile Lab)

J ai Shri Ram J ai Hanum an
Figure 18 Finger print for moisture management properties
(Image courtesy of MMU Textile Lab)
MMT is suitable to determine the liquid transport in multiple directions and finger print
(see Figure 16) is a useful and instant method to identify the moisture management of
fabrics. For instance, in the sample as shown above, the top wetting time is very good
(grade 4); absorption rate was good (grade 3); top surface wetting radius is very good;
spreading speed was between grade 3-4 indicating good wicking capacity; It could be
noted that top surface wicks and transports moisture better than the bottom surface. The
one way transport of liquid was also excellent. The finger print also provides the overall
moisture management as very good (grade 4). It could be observed the fabric is suitable
for moisture management where one of its surface wicks the moisture than the other
surface. The surface of the fabric that wicks away the moisture quickly would be in
contact with the skin and helps to prevent stickiness due to excess perspiration during
intense activity.

J ai Shri Ram J ai Hanum an
Influence of moisture transfer in functional clothing (Permetest)
Permetest was developed by Sensora Instrument, Czech Republic which measures water
vapour resistance, relative water vapour permeability and thermal resistance of woven,
knitted and nonwoven fabrics (Matsuiak et al., 2011). The equipment works on ISO 11092
standard that measures the thermal and water vapour resistance under steady state
conditions (sweating guarded hot plate test). Bogusławska-Bączek and Hes, (2013)
recently presented the working principle of Permetest as Skin Model that provides a
reliable measurement of the water vapour permeability of fabrics in a dry and wet state.
Permetest – often called as a ‘skin model’ where the instrument measures the water
vapour permeability of fabrics. This instrument simulates the wet and dry human skin
conditions in terms of thermal feeling and serves for the determination of water vapour
permeability of fabrics (Figure 19). The instrument works on the principle of heat flux
sensing. When water flows into the measuring head, some amount of heat is lost. This
instrument measures the heat loss from the measuring head due to the evaporation of
water in bare condition and while being covered by the fabric. The relative water vapour
permeability of the fabric sample is calculated by the ratio of heat loss from the measuring
head with and without fabric. Das et al. (2009) reported the water vapour permeability of
blended fabrics using Permetest.

J ai Shri Ram J ai Hanum an
Figure 19 Permetest
(Image courtesy of MMU Textile Lab)
The results are presented in the equipment as well as via a software connected to a PC.
The image below (Figure 20) illustrates a typical output from the Permetest. The
instrument also allows to record the test and calculate simple statistical test, mean, median
and standard deviation. The relative water vapour permeability (RWVP) is determined
using the formula:
RWVP =���� ���� ���� ��� ������ ������ �� ��������� ���� (��)
���� ���� ���� ���� ��������� ���� (��)� 100
J ai Shri Ram J ai Hanum an
Table 6 Outcomes from Permetest
Type of material Water vapour
resistance
(m2 Pa W-1)
Relative water
vapour
permeability (%)
Dry thermal
resistance
(Km2W-1)
Base layer knit 1
(Skins)
3.7 72.8 2.8
Base layer knit 1
(SUD)
4.0 75.3 2.8
Fleece 7.3 57.1 7.9
Coated fabric (grey
woven fabric)
8.5 54.0 Not applicable as
the fabric is very
thin
Outer layer 4.2 67.1 Not applicable as
the fabric is very
thin
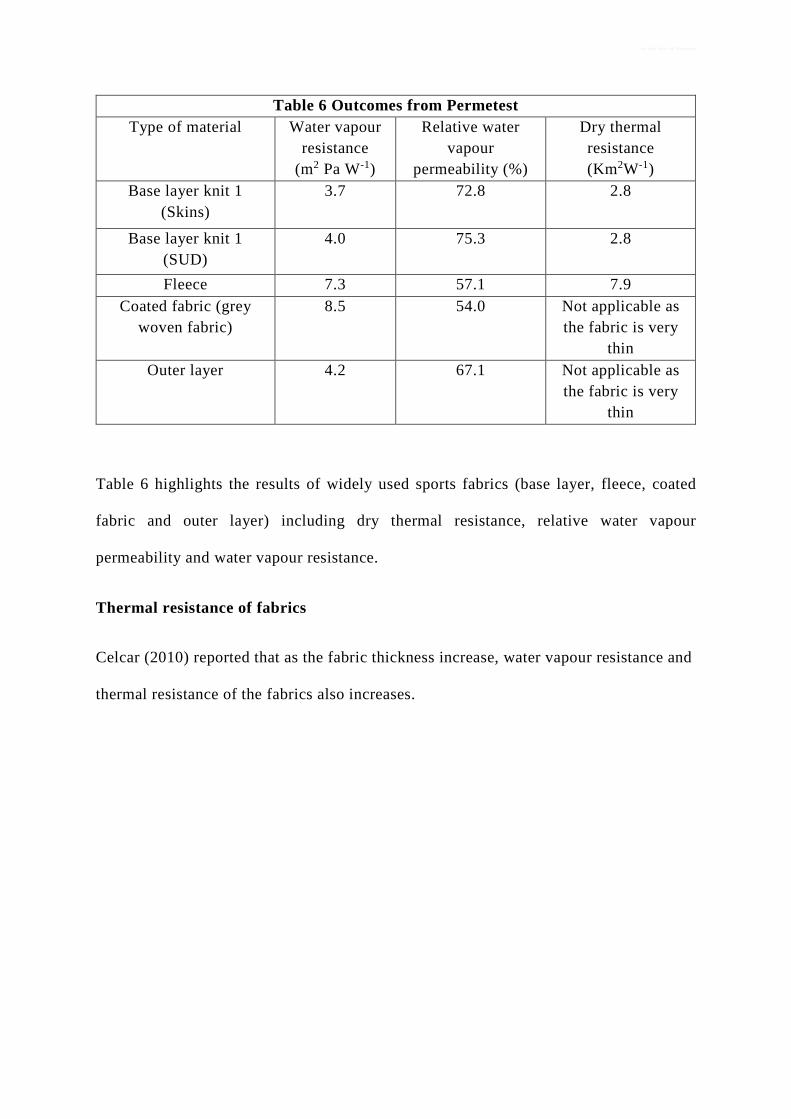
Table 6 highlights the results of widely used sports fabrics (base layer, fleece, coated
fabric and outer layer) including dry thermal resistance, relative water vapour
permeability and water vapour resistance.
Thermal resistance of fabrics
Celcar (2010) reported that as the fabric thickness increase, water vapour resistance and
thermal resistance of the fabrics also increases.

J ai Shri Ram J ai Hanum an
Figure 20 Typical output from Permetest
Fabric specifications and interpreting results
Table 7 presents the experimental values relating to fabric’s physical characteristics, durability,
aesthetics and fabric comfort which are some of the vital pre-requisites for a fabric to find its
usage in sportswear and performance clothing. The woven material made of 100% polyester is
a light weight fabric intended for mid-layer soft shell jackets that is water repellent whilst the
knitted fabric is medium weight fabric with a water repellent finish intended to be used as a
tops for men and women. The woven fabric has a 1/1 plain weave structure in which both sides
of the fabric appear similar and the knitted fabric is a single jersey, which possess a distinct
technical face and back. It is made of polyester and lycra. Fabric thickness of woven fabric is
less than 0.20 mm whilst the knitted fabric is 0.66 mm. Fabric thickness plays an important
role during joining of fabrics especially in maintaining the pressure at the presser foot of a
sewing machine. Fabric cover factor determines the extent to which a set of yarn covers the
area of a fabric. The warp cover factor 13.5 and weft cover factor 6.3 indicates that area covered

J ai Shri Ram J ai Hanum an
TABLE 7 Example fabric specification
Properties 01 Woven fabric 02 Knitted fabric
Fabric
physical
characteristics
Area density (g/m2) 115 255
Bulk density (g/cm3) 0.64 0.39
Thickness (mm) 0.18 0.66
Fabric cover (K)
factor/stitch density13.5 + 6.3 11.0
Fabric structure 1/1 plain weave Single jersey
Fibre composition (%) 100% polyester Polyester/lycra
Yarn count (tex)Warp 5.0
Weft 12.020.0
Fabric density
Woven fabric (ends per
inch x picks per inch)100 x 72 NA
Knitted fabric (courses
per cm and wales per
cm)
NA 22 x 15
Durability
Fabric pilling (grade) 5 4
Abrasion
resistance
@ 10,000
Change in
colourVery minor change Slight increase in shade
Rate of
loss of
mass
Nil 0.01
Thread
bareNo No
Aesthetics
Fabric handle stiffness
Flexural rigidity (µNm)
Bending modulus
(N/m2)
Warp
12.0
0.4
Weft
4.3
0.1
Wales
2.8
0.1
Courses
0.5
0
Fabric drape coefficient
(%)55.3 17.41
Comfort
Moisture transport
(wicking)Water proof
Water repellent fabric
(see fabric finger print)
Stretch and recovery
Mean extension
Mean residual extension
Not applicable
Wale
79%
2.66%
Courses
146%
6.75%
Water vapour
resistance (Pa m2/W) 11.7 4.3

J ai Shri Ram J ai Hanum an
by warp yarns exceed weft yarns. In the case of the knitted fabric, the tightness factor indicates
the extent to which area of the knitted fabric is covered by the yarn. Generally, yarn count
affects the tightness factor of a knitted fabric. The tightness factor of 11.0 indicates the fabric
has an optimum level of closeness. In the case of woven fabric, warp yarns are finer (5 tex)
than the weft yarn (12 tex). In the case of knitted fabric, yarn count is of medium quality (20
tex). The fabric count for woven fabric 100 x 72, indicates the fabric is an unbalanced weave,
where warp yarns (100) exceed the weft yarns (72). In the case of knitted fabric, 24 courses per
cm x 15 wales per cm indicates that the fabric has moderate closeness or compactness. This
factor affects the ability of the fabric to transmit moisture between the skin and the
environment.
Fabric pilling grade 5 reveals that the fabric performed well, with little or no surface fuzz, in
the case of knitted, there were minor surface fuzz (pilling grade 4). Fabric abrasion resistance
reveals that at 10,000 rubs there were minor colour change with no change in the mass and
thread bare. The abrasion resistance for knitted fabrics were good, with little change in mass
and no thread bare and slight increase in shade. Fabric durability depends on fibre type as well
as on fabric structure and yarn fineness. The drape coefficient of 55% indicates that the woven
fabric possess medium drape, such that it is neither stiff nor a flexible fabric. However, in the
case of knitted fabric, the drape coefficient of 17.4% indicate that the fabric is pliable. In the
case of fabric stiffness, bending length is observed from which flexural rigidity is calculated.
The flexural rigidity is a measure of stiffness that depends on fabric thickness, yarn count,
fabric structure and finishes applied on to the fabric which makes the fabric compact. Flexural
Absolute water vapour
permeability (%)45.5 65.3
Thermal resistance
(m2 K/W)
Not applicable due to
fabric thickness < 0.2 mm53.0

J ai Shri Ram J ai Hanum an
rigidity of 12.0 µNm in warp direction and 4.3 µNm in weft direction indicate that fabric
possess stiffness in the lengthwise direction compared to width wise direction. In the case of
knitted fabric, the flexural rigidity of 2.8 µNm indicates that the fabric possess little stiffness,
in other words the fabric is pliable. The moisture assessment using MMT fabric print indicated
that woven fabric is a water proof fabric (as there were no wicking) and knitted fabric was
water repellent due to its specific finish. Knitted fabric possess good stretch in width wise
direction (146%) than the lengthwise direction (7%) which is an important parameter especially
in designing base layer garments worn next to the skin that requires stretch and recovery, for
instance, in seat area, knee flex, back arm flex. It is also important to note that fabric growth
after extension is 2.6% in wale direction and 7% in course direction. This should be considered
in designing products as close fit garments such as tops for women may become baggy after
repeated usage that involves intense body stretch (yoga practice or aerobics). In the case of
comfort assessment – water vapour permeability, compact nature of the woven fabric resulted
in average permeability (45%) compared to knitted fabric which had a better permeability
(65%). The water vapour resistance for woven fabric was 11.7 (Pa m2/W) and 4.3 (Pa m2/W)
for knitted fabric. This meant that knitted fabric is comfortable to wear as the moisture
permeability is marginally better than the woven fabric. Thermal resistance of woven fabric
could not be assessed as the fabric thickness was less than 0.20 mm.
Based on the above findings, it could be inferred that the knitted fabric is durable and it is
suitable for active wear applications as it offers good resistance to pilling and abrasion. In
addition, the fabric is flexible, offers stretch in width wise direction and water repellent which
can be used for outdoor wear. Fabric possess good moisture permeability characteristics which
enables the wearer to remain comfortable during an activity. In the case of the woven fabric,
the fabric is suitable for soft shell jackets which offers resistance to wear and tear and has
average moisture permeability. Both the fabrics can be recommended for performance

J ai Shri Ram J ai Hanum an
applications which is targeted on low to medium market where the garment usage is less
frequent.
Summary
Sportswear and functional clothing sector drives innovation, particularly in the area of fabric
and accessories. Textile testing had been instrumental in determining the performance of these
innovative high performance materials. In addition, different type of sporting activity requires
different performance and the choice of fabrics vary. For example, an outdoor cycling kit
requires a fabric that is light weight, possess stretch, and offers thermal balance next to the
skin. However, a ski wear requires good thermal insulation to protect the wearer from severe
cold condition. The chapter highlighted the importance of fabric evaluation in determining the
fit for purpose using various textile parameters including physical characteristics, durability,
aesthetics and comfort. Each test parameter was referred to British standards and a brief
description of the test method was presented along with the visual illustration of the test
equipment. In addition, example results were also presented to enable the reader to understand
the outcomes and its relevance in fabric assessment (grade). The chapter also emphasized the
importance of physical characteristics of fabric on its performance. In the case of performance
assessment various test equipment including Taber abrasion tester, pilling box, stiffness tester,
drape meter, moisture management tester, Fryma extensiometer and Permetest was discussed.
The final section which outlined the fabric specification with example results between woven
and knitted fabrics will enable the reader to interpret test results and comprehend how
performance is assessed using the outcomes. The test methods discussed in the chapter were
presented in the context of evaluating fabrics used in performance clothing and will serve as
an invaluable resource to professionals and novice alike.

J ai Shri Ram J ai Hanum an
References
1. Cohen, A.C., Johnson, I., Price, A., and Pizzuto, J.J., (2010), J.J. Pizzuto’s Fabric Science,
Fairchild, New York.
2. Collier, B.J. and Epps, H.H., (1999) Textile Testing and Analysis, Pearson, Prentice-Hall Inc.
US
3. Roy, P. (2014), Making Products that Protect, AATCC News, US
4. X-bionic (2014), X-Bionic Manual for Automobili Lamborghini,
5. Carr, W. W., Posey J.E., and Tincher W.C., (1988), Frictional properties of apparel fabrics,
Textile Research Journal, Vol.58, pp- 129-136.
6. Abraham, N. and Mandal, S., (2009), Effect of fabric weight on bending rigidity – a statistical
analysis, Man-made Textiles in India, pp-161-163
7. Kadolph, S.J., (2008), Quality Assurance for textiles and apparel, Fairchild Publications Inc.,
New York ISBN: 13:978-1-56367-554-6
8. Voyce, J. Dafniotis, P. and Towlson, S. (2005) ‘Elastic Textiles’ in Shishoo, R. (eds), Textiles in
Sport, Cambridge, Woodhead Publishing.
9. Petrulis, D., (2012), The influence of fabric construction and fibre type on textile durability:
woven, knitted and nonwoven fabrics, In: Ed. Annis, P. A., Understanding and improving the
durability of textiles, Woodhead Publishing Ltd. ISBN: 978-0-85709-087-4
10. BS 4294: 1968, The stretch and recovery property of fabrics, BSI, London.
11. Pocock, G. and Richards, C.D., (2009), The regulation of body core temperature, In: The
human body, An introduction for the biomedical and health sciences, Oxford University
Press, Oxford, UK
12. Zhou, R., Yu, J. and Qin, J., (2014), Comfort properties of modified knitted polyester fabrics,
Melliand International, pp-38-41
10. Anand, S.C., (2000), Technical fabric structures – knitted fabrics, In: Handbook of Technical
Textiles, Eds. Anand, S.C. and Horrocks, A.R., Woodhead Publishing, ISBN: ISBN-
10: 1855733854

J ai Shri Ram J ai Hanum an
11. BS EN ISO 5084, (1997), Determination of thickness of textiles and textile products
12. BS EN ISO 12947-2 (1998), Textiles. Determination of the abrasion resistance of fabrics by
Martindale method.
13. BS EN ISO 5470-1, (1999), Determination of abrasion resistance of fabrics: Taber abrader
13. BS EN ISO 12945-1: (2001), Determination of fabric propensity to surface fuzzing and to
pilling - Pilling box method
14. BS 3356, (1990), Method for determination of bending length and flexural rigidity of fabrics
15. BS 5058, (1973), Method for the assessment of drape of fabrics
16. BS 4294, (1968), Methods of test for stretch and recovery properties of fabrics
14. McQueen, R.H., Batcheller, J.C., Mah, T., Hooper, P.M., (2013), Development of a protocol
to assess fabric suitability for testing liquid moisture transport properties, Journal of the
Textile Institute. 2013, Vol. 104 Issue 8, p900-905
15. Das B., Das, A., Kothari, et al., (2009), Moisture flow through blended fabrics – effect of
hydrophilicity, Journal of Engineered fibres and fabrics, Vol. 4, Issue 4, pp-20-28
16. Özdil, N., Kayseri, Ö. G., Mengüç, G.S., (2012), Analysis of abrasion characteristics
in Textiles, Abrasion resistance of materials, Eds. Adamiak, M., ISBN: 978-953-51-
0300-4 www.intechopen.com