chapter 10 strategies future competitiveness
TRANSCRIPT

Chapter 10
Strategies forFuture Competitiveness
CONTENTSPage
Measures of Competitiveness. . . . . . . . . . . . . . . . . . . . . . . . . . . . . . . . . . . . . . . . . .221Comparative Advantage. . . . . . . . . . . . . . . . . . . . . . . . . . . . . . . . . . ..........222Market Share . . . . . . . . . . . . . . . . . . . . . . . . . . . . . . . . . . . . . . . ..............223Cost of Production. . . . . . . . . . . . . . . . . . . . . . . . . . . . . . . . .................225Profitability . . . . . . . . . . . . . . . . . . . . . . . . . . . . . . . . . . . . . . . . . . . ............225Technology . . . . . . . . . . . . . . . . . . . . . . . . . . . . . . . . . . . . . + . . . . . . . . . . . . . . . ..226Staying Power . . . . . . . . . . . . . . . . . . . . . . . . . . . . . . . . . ...................227
Federal Policies Affecting Competitiveness. . .. .. .. .. .. .. .. .. .. ... . <......228Federal Tax Policy . . . . . . . . . . . . . . . . . . . . . . . . . . . . . . . . . ................229Trade Policy . . . . . . . . . . . . . . . . . . . . . . . . . . . . . . . . . . . . . . . ...............231Defense Policies. . . . . . . . . . . . . . . . . . . . . . . . . . . . . . . . ...................235Environmental Regulation . . . . . . . . . . . . . . . . . . . . . . . . . . . . . ..............237Research and Development . . . . . . . . . . . . . . . . . . . . . . . . . . . . . . . . . ........242Industrial Policy. . . . . . . . . . . . . . . . . . . . . . . . . . . . . . . . . . .................244
Industry Strategies Affectng Competit iveness . . . . . . . . . . . . . . . . . . . . . . . . . . . . .246Future Industry Options . . . . . . . . . . . . . . . . . . . . . . . . . . . . . . . . . . . . . . . . . . . .248
Box1O-A,
1O-B.10-C,
Table10-1.10-2.10-3.10-4.10-5.
10-6.
BoxesPage
State and Local Assistance and Cost Concessions Obtained by MontanaResources and Copper Range . . . . . . . . . . . . . . . . . . . . . . . . . . . . . . . . ....248Cooperative Steel/Auto Industry Research . . . . . . . . . . . . . . . . . . . . . . . . . .251Forward Integration in the Aluminum Industry . .....................252
TablesPage
U.S. Market Share in the Copper industry: 1981-86 . .................224Mineral Income Tax Comparisons . . . . . . . . . . . . . . . . . . . . . . . . . . . . . . ...230other Federal Legislation Affecting Copper Operations. . ..............240Federal R&D Expenditures Related to Mineral Resources and Production .244Strategies Adopted by U.S. Copper Companies in Response to EconomicConditions, 1980-87 . . . . . . . . . . . . . . . . . . . . . . . . . . . . . . . . . ...........2471986 R&D Expenditures in Selected Industrial Sectors. . ...............248

Chapter 10
Strategies for Future Competitiveness
The international competitiveness of firms andindustries refers to the ability of companies in onecountry to produce and sell products in rivalrywith those abroad. American industries and com-panies also compete among themselves for mar-kets, profits, and resources such as investmentcapital and quality employees. How an industrywill fare in international competition depends onfactors ranging from technology, to governments’industrial policies, to the available natural, hu-man, and financial resources.
Shifts in the international competitiveness of in-dustries affect trade balances, foreign economicpolicy, and military security, and will determinequite directly the gross domestic product, andtherefore the standard of living. The linkage be-tween competitiveness and employment is muchlooser. By greatly improving their labor produc-tivity, industries can rise in competitiveness whiledeclining in employment.
In practice, the priorities of countries, indus-tries, and firms vary and they use different meas-ures of competitiveness. These, in turn, deter-mine the government policies and industrial
management strategies used to maintain or in-crease an industry’s competitive position. Thus,under adverse market conditions, a developingcountry that uses copper exports to finance im-ports and economic development may subsidizeits copper industry directly. Developed countriestend to use indirect measures such as trade andtax policies to assist industries that are perceivedto be disadvantaged due to foreign competitionor market conditions.
Analyzing the competitiveness of the domes-tic copper industry is further compounded by thefact that copper is a fungible commodity. Onceestablished standards have been meant (e.g., thepurity of copper to be used for electrical pur-poses), there is little to distinguish copperproduced in the United States from copper pro-duced elsewhere other than its price, includingshipping costs.
This chapter discusses the measures of com-petitiveness that may be applied to the copperindustry. It then reviews legislative and industrialstrategies that could help to maintain or improvethe competitive position of the domestic industry.
MEASURES OF COMPETITIVENESS’
No single measure or statistical indicator isadequate to capture the complexity and dyna-mism of industrial competitiveness. The fullpanoply of measures might include market share,profitability, cost of production, comparativeadvantage, ability to attract investment capital,technology and innovative potential, growth rate,capacity utilization, labor productivity, and/orclosure costs. Which measures are consideredthe most important will depend on the firm’sownership and on national and corporate goals
‘Much of the material in this section is drawn from previous OTAreports on industrial competitiveness, including International Com-petitiveness in Electronics, and U.S. Industrial Competitiveness.Other sources are referenced as appropriate.
and priorities. Where making money is the toppriority, then short-term concerns will focus onproduction costs, profitability, market share, andlabor productivity compared to other companiesmaking similar products. If the primary goal is tomaintain an industry because its products are im-portant to national security or the economy, thenthe near-term concerns are more likely to be mar-ket share, capacity utilization, and staying powerin the marketplace (based on avoidable costs),regardless of profitability. To remain competitivein the long term, however, all industries must beconcerned about comparative advantage, growthand innovative potential, and the ability to attractinvestment capital.
221

222
Comparative Advantage
International competitiveness is related to whateconomists term the global structure of compara-tive advantage: countries tend to export goodsin which they are advantaged and import others.Export earnings are used to finance imports. Na-tions with the lowest average unit costs are likelyto be major exporters.2 Within this context, how-ever, one must distinguish competition betweenU.S. firms and those in industrialized countries,versus those in less developed countries (LDCs).
The potential sources of advantage within theworld copper industry include resources, labor,capital, markets, and technological capabilities.The domestic industry is both advantaged anddisadvantaged in its resource base. On one hand,
‘Gary L. Guenther, “Industrial Competitiveness: Definitions,Measures, and Key Determinants, ” Congressional Research Serv-ice, Feb. 3, 1986.
we have 17 percent of the world’s demonstratedresources of recoverable copper—more than anyother single country except Chile. Our porphyryores are suited to large-scale, open-pit miningwith relatively low stripping ratios. We also havelarge oxide deposits, which can be extracted within situ leaching technology. On the other hand,our sulfide ores are relatively low-grade, whichleads to higher production costs due to the ex-pense in handling more material to produce anequivalent amount of copper (see ch. 5).
For porphyry deposits–the majority of worldcopper resources—this difference in grade willaverage out over time. For example, ongoingmodifications at the Chuquicamata mine/mill inChile are primarily to accommodate lower oregrades. In 15 years, American mines will still beworking approximately the same grade ore theyare today, but Chuquicamata’s ore grade willhave declined more than 50 percent.

223
In newly-industrializing economies, workersoften are available in large numbers at low wagerates. This can provide a production cost advan-tage. The trade-off for industrialized economiesis high labor productivity. Domestic copper la-bor productivity is excellent, and has improvedmarkedly during the 1980s (see ch. 3). Wage re-ductions in 1986 plus continuing productivitygains have improved our cost competitive situa-tion, but labor is still a much higher percentageof the U.S. production cost than for most foreigncompetitors (see ch. 9).
Large markets allowing economies of scale inproduction and lower transportation costs can bea source of comparative advantage. in the cop-per industry, however, this is largely negated bythe extensive international trade. Moreover, asthe less developed countries (LDCs) becomemore industrialized, their domestic markets forcopper will expand.
Access to investment capital is another poten-tial source of comparative advantage. Nongov-ernmental firms in industrialized countries typi-cally raise capital through loans or sales of equityshares (stock). Cross-subsidization also can oc-cur within a firm to the extent that profits fromone product or division can be used to helpanother division over temporary hard times; thisis one advantage of diversification. Government-owned copper operations rely more heavily ondebt financing, often through international bank-ing organizations (e. g., the Multinational Devel-opment Banks). As LDC debt multiplies, however,such loans will become more difficult to obtain(see ch. 3).
Finally, technological capabilities can be asource of comparative advantage. These includethe employee skills as well as research and de-velopment (R&D) investments. While the UnitedStates has some advantage over less industrial-ized countries in this area, this often is negatedby the speed of technology transfer (see below).
Although comparative advantage theory is auseful starting point for understanding the re-source economics of international competitive-ness, it overlooks other important trends. For ex-ample, shifting trade patterns are inevitable asthird world countries become more developed.Yet it is difficult for mature markets to accommo-
date both established domestic producers and thedevelopment objectives of new market entrants,or to make the transition for domestic compa-nies less painful. Economically, the problem isascertaining the net gains from trade (e.g., tofabricators and consumers) after deducting ad-justment costs for producers. Politically, the prob-lem becomes one of determining how these netbenefits shall be distributed both within a singleeconomy and between it and its trading partners. j
An additional question is whether governmentpolicy, over time, can influence comparative re-source advantages. Such policies might includeworker training, funding for R&D related to uniqueresource endowments, or facilitating access tocapital (e.g., through tax incentives).
Market Share
International competitiveness defined in termsof market share is the definition given at the be-ginning of this chapter—the ability of firms in onecountry to design, develop, manufacture, andmarket their products in rivalry with firms and in-dustries in other countries. Market share may re-fer to a country’s portion of total world produc-tion or shipments, it may mean net exports(value of exports less imports), or it may de-scribe the fraction of the domestic market thatis met by domestic production. A major short-coming of this measure is that losses in marketshare for heavily industrialized countries are in-evitable as other nations progress economically.
American copper companies dominated theworld market until the late 1960s. Then came awave of nationalizations in Latin America andAfrica. Where foreign governments did not com-pletely take over, they exerted greater influenceon operating patterns. Government ownershipand control of foreign operations meant not onlya loss of assets, but also a loss of market power.American companies no longer could regulateforeign production during times of reduced de-mand. Companies that lost foreign properties alsowere no longer able to use low-cost overseas pro-
3J0hn Zysman and Laura Tyson (eds. ), American Industry in In-ternational Competition: Government Policies and Corporate Strat-egies (Ithaca, NY: Cornell University Press, 1983).
224
duction to offset curtailed output at higher-costdomestic mines when prices were Iowa
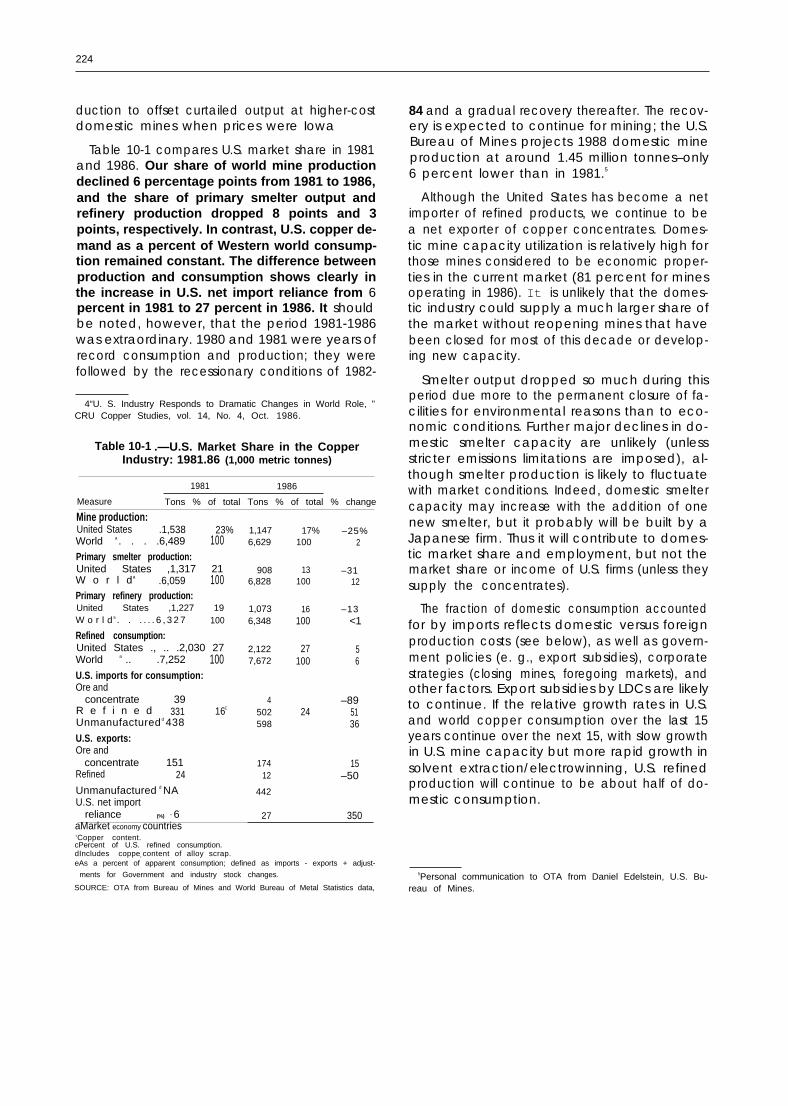
Table 10-1 compares U.S. market share in 1981and 1986. Our share of world mine productiondeclined 6 percentage points from 1981 to 1986,and the share of primary smelter output andrefinery production dropped 8 points and 3points, respectively. In contrast, U.S. copper de-mand as a percent of Western world consump-tion remained constant. The difference betweenproduction and consumption shows clearly inthe increase in U.S. net import reliance from 6percent in 1981 to 27 percent in 1986. It shouldbe noted, however, that the period 1981-1986was extraordinary. 1980 and 1981 were years ofrecord consumption and production; they werefollowed by the recessionary conditions of 1982-
4“U. S. Industry Responds to Dramatic Changes in World Role, ”CRU Copper Studies, vol. 14, No. 4, Oct. 1986.
Table 10-1 .—U.S. Market Share in the CopperIndustry: 1981.86 (1,000 metric tonnes)
1981 1986
Measure Tons % of total Tons % of total % change
Mine production:United States .1,538 23%World a . . . .6,489 100Primary smelter production:United States ,1,317 21W o r l da .6,059 100Primary refinery production:United States ,1,227 19W o r l d a . . . . . . 6 , 3 2 7 100
Refined consumption:United States ., .. .2,030 27World a .. .7,252 100U.S. imports for consumption:Ore and
concentrate 39R e f i n e d 331 16C
Unmanufactured d 438
U.S. exports:Ore and
concentrate 151Refined 24
Unmanufactured d NAU.S. net import
reliance (%) e 6aMarket economy countries
1,1476,629
9086,828
1,0736,348
2,1227,672
4502598
17412
442
27
17% –25%100 2
13 –31100 12
16 –13100 <1
27 5100 6
–8924 51
36
15–50
350
‘Copper content.cPercent of U.S. refined consumption.dIncludes copper content of alloy scrap.eAs a percent of apparent consumption; defined as imports - exports + adjust-
ments for Government and industry stock changes.
SOURCE: OTA from Bureau of Mines and World Bureau of Metal Statistics data,
84 and a gradual recovery thereafter. The recov-ery is expected to continue for mining; the U.S.Bureau of Mines projects 1988 domestic mineproduction at around 1.45 million tonnes–only6 percent lower than in 1981.5
Although the United States has become a netimporter of refined products, we continue to bea net exporter of copper concentrates. Domes-tic mine capacity utilization is relatively high forthose mines considered to be economic proper-ties in the current market (81 percent for minesoperating in 1986). It is unlikely that the domes-tic industry could supply a much larger share ofthe market without reopening mines that havebeen closed for most of this decade or develop-ing new capacity.
Smelter output dropped so much during thisperiod due more to the permanent closure of fa-cilities for environmental reasons than to eco-nomic conditions. Further major declines in do-mestic smelter capacity are unlikely (unlessstricter emissions limitations are imposed), al-though smelter production is likely to fluctuatewith market conditions. Indeed, domestic smeltercapacity may increase with the addition of onenew smelter, but it probably will be built by aJapanese firm. Thus it will contribute to domes-tic market share and employment, but not themarket share or income of U.S. firms (unless theysupply the concentrates).
The fraction of domestic consumption accountedfor by imports reflects domestic versus foreignproduction costs (see below), as well as govern-ment policies (e. g., export subsidies), corporatestrategies (closing mines, foregoing markets), andother factors. Export subsidies by LDCs are likelyto continue. If the relative growth rates in U.S.and world copper consumption over the last 15years continue over the next 15, with slow growthin U.S. mine capacity but more rapid growth insolvent extraction/electrowinning, U.S. refinedproduction will continue to be about half of do-mestic consumption.
5Personal communication to OTA from Daniel Edelstein, U.S. Bu-reau of Mines.

225
Cost of Production
Market share is only indirectly related to thecompetitiveness of individual firms, which aremore likely to be concerned with productioncosts, Gross costs are determined by wage ratesand labor productivity; the cost of materials,equipment, transportation, and energy; and thedesign of both products and manufacturing proc-esses. Net costs also account for byproductcredits.
Generalizations about production costs arepossible, but tend to be disproved by site-specificfactors. For labor-intensive technologies such asunderground mining with conventional smelting,developing countries with an abundance of in-expensive labor normally would be expected tobe the low-cost producers. Yet Canada, witharound 75 percent of its output from under-ground mines, has high gross costs but low netcosts because of their advantageous byproductcredits, Moreover, despite the advantage gainedfrom abundant human resources, developingcountries still can benefit from technologies thatare not labor intensive if they offer low capitalcosts and ease of operation (see discussion oftechnology transfer, below).
In 1986, estimated average net operating costsin the United States were 54 cents/lb. The aver-age producer price for that year was 66 cents/lb.Worldwide, the average net operating cost forthe top 12 producing countries was around 44cents/lb. The range of costs in 1986 was esti-mated to be as low as 26 cents/lb and 30 cents/lbfor Papua New Guinea/Indonesia and Chile, andas high as 70 cents/lb in the Philippines (see ch.9) .6
The United States is most competitive in refin-ing, with average costs comparable to those ofthe rest of the world. Because refining is onlyaround 7-8 percent of the total cost of produc-tion, however, it provides little leverage in over-all competitiveness. Domestic mining and mill-ing costs were high, averaging 75 percent of theoperating cost, primarily because of low domes-
6Janice L. W. Jolly and Daniel Edelstein, “copper,” preprint ‘rem
1986 Bureau of Mines Minerals Yearbook (Washington, DC: U.S.Department of the Interior, 1987).
tic ore grades with only moderate byproductcredits and high labor costs.
Although smelting accounts for only 17 percentof domestic operating costs, the United Stateshad the highest smelting costs of all the majorproducing countries in 1986 due to labor costsand the additional cost of acid production forenvironmental control (currently around 87 per-cent sulfur dioxide removal). Adding an acid plantto the production line increases operating costswithout necessarily providing a byproduct credit.Furthermore, capital costs of acid plant construc-tion are high. Copper smelters in Canada, Chile,Mexico, Peru, Zaire, and Zambia–our major for-eign competitors—are not faced with similar envi-ronmental regulations (see below). T
Profitability
The profitability of an operation or firm is itsreal net income. Profitability is largely deter-mined by the difference between the cost of pro-duction and the price at which the product issold. Other factors can affect profitability, how-ever. For instance, in Mexico, copper is tradedin U.S. dollars, but profits are measured in pesos.Shifts in the exchange rate affect the amount ofprofit at a given price. In recent years, exchangerates in market economy countries have beenfree to adjust to prevailing market conditions.One consequence of more flexible exchangerates is that domestic industries may be competi-tive at one time but not another solely becauseof exchange rate shifts.
For a nongovernmental corporation, profitabil-ity directly determines whether a company or fa-cility will continue to operate, and for how long.Profitability controls the ability to obtain debt andto attract equity investors. it also determines theamount of money available for maintenance andcapital improvements. Government-owned oper-ations in developing countries are concernedmore with generating foreign exchange than with
7Lawrence J. McDonnell, “Government Mandated Costs: TheRegulatory Burden of Environmental, Health, and Safety Standardsof U.S. Metals Production, ” paper prepared for the conference Pub-lic Policy and the Competitiveness of the U.S. and Canadian Me-tals Production, Golden, CO, January 1987.

226
profitability, and can sustain operating losses fora longer period.
Domestic copper companies lost a lot of moneyduring the depressed conditions of the early1980s. Amoco Minerals lost nearly $60 millionon copper from 1981 to 1985, when they spunoff their copper properties to Cyprus Minerals;Phelps Dodge lost $400 million between 1982and 1984; and Kennecott lost over $600 millionbetween 1982 and 1985. Anaconda–for decadesthe giant of the world mineral industry—went outof business. This situation began to change in1985, and has continued to improve since, as costsdeclined while demand and prices increased. Allthe major domestic companies except Magmahad a positive net income in 1987, and Magmaexpects to be profitable when their smelter fur-nace replacement is complete.
Technology
The definitions of competitiveness discussedabove are based on either market or resourceeconomics. Other definitions are technology-based, and refer to superior product and proc-ess technology. The types of definitions are notnecessarily unrelated—superior process technol-ogy is one way to achieve low costs; superiorproducts are one way to increase market share.
The role of technology is less important in de-termining competitiveness in the copper indus-try than in, say, electronics, for two reasons. First,technology transfer among companies and coun-tries is rapid. Second, copper is a fungible com-modity with well-established standards for purity,so distinguishing among companies’ products isdifficult.
Technology transfer is the interchange of tech-nological innovations among companies andcountries. When one company or country de-velops a new process that either reduces costs,improves productivity, or exploits new resources,it enjoys a competitive advantage as long as theinnovation remains secret or is protected by pa-tents. The innovation is then transferred to othercountries or companies through licenses underthe patent, and the licensee pays royalties. Overtime, incremental changes remove even patent
protection, and the innovation is adopted univer-sally where it can bestow some benefit. This proc-ess may occur quickly, or it may take years.
In the copper industry, technology transfer isalmost instantaneous. This occurs for several rea-sons. First, most major technological advancesin copper mining and processing are developedand introduced by equipment vendors ratherthan copper producers. The vendors have a fi-nancial interest in seeing rapid and widespreadadoption of their innovations. The value of thistrade by domestic vendors is important for ourbalance of payments. Exports accounted foraround 33 percent of U.S. mining and mineralprocessing machinery shipments in 1982, whileimports were only 7 percent of domestic con-sumption. While other countries are beginningto make inroads on world market share in min-ing and processing machinery, the United Statesremains a net exporter in this area. B
In contrast, modern smelting furnaces and thelatest advances in electrowinning (the Mt. Isaprocess) were developed in other countries. YetAmerican copper producers also benefit eco-nomically from the productivity gains and costreductions brought by foreign technological ad-vances.
Other innovations are adapted from other me-tals sectors. For example, the earliest concentra-tion techniques were developed based on meth-ods used on gold ore. The solvent extraction/electrowinning (SX/EW) process originated withuranium processing. Moreover, because each orebody is unique, copper companies typically needto engineer an innovation to suit their own situ-ation. These multiple, incremental changes largelynegate the purposes of patents.
Finally, porphyry ore bodies–which have beenthe focus of copper exploration and developmentfor much of this century–are very similar all overthe world. Their similarities have helped to stand-ardize mining and metallurgical strategies for theirexploitation, and thus facilitate rapid technologytransfer.
81 International Trade Administration (ITA), A Competitive Assess-ment of the U.S. Mining Machinery Industry (Washington, DC: U.S.Government Printing Office, 1986).
227
In searching for a competitive advantagethrough technological innovations, therefore,domestic companies need to emphasize eithertechnologies that are unattractive to develop-ing countries or that apply to a limited rangeof resource conditions. Developing countries areattracted to technologies that: 1 ) require minimalcapital, 2) can be built quickly, 3) can be amor-tized rapidly, 4) have low operating costs (includ-ing low energy consumption), and 5) require min-imal technical skills and supervision.9 Thisimplies, for instance, that developing countrieswith resources suited to SX/EW processing willfavor this technology over pyrometallurgicalmethods, because relatively simple mixers andsettlers replace grinding mills, classifiers, flotationcells, smelters, and all their controls, and recycl-able organic solutions supplant grinding mediaand flotation reagents. More importantly, SX/EWis very flexible in its applications and can be runpractically at any scale, which makes it very con-venient for application in developing countries.It’s few environmental control requirements alsomay become increasingly important outside theUnited States.
Although SX/EW is a technology that transferseasily, domestic copper companies still may gainfrom its use in situations not applicable in othercountries. For example, while all porphyry orebodies tend to have oxidized caps suitable forSX/EW methods, the United States maybe uniquein having a large resource of previously uncata-loged oxide ore bodies (apart from the porphyrycaps) particularly amenable to SX/EW treatment.Such oxide ore bodies are one resource thatcould provide a domestic competitive advantagerelatively immune to subversion through technol-ogy transfer in the short-term. Small-scale SX/EWplants also are very attractive for leaching old,“worked-out” mines and waste dumps, alsoprevalent throughout the Western United States.
New domestic operations in the near future aremore likely to exploit smaller, relatively high-grade (e.g., 3 percent) deposits, while overseasoperations that wish to capitalize on foreign ex-
9United Nations Industrial Development Organization (UNIDO),Technological Alternatives for Copper, Lead, Zinc and Tin in De-veloping Countries, report prepared for the First Consultation onthe Non-ferrous Metals Industry, Budapest, Hungary, July 1987.
change will prefer large ore bodies. The technol-ogy transfer advantages here depend on the typeof operation and the goal of copper production.For in situ leaching, this may confer an advan-tage on U.S. greenfield operations, which willemphasize small deposits until the technology isproven.
For sulfide ores, foreign and domestic opera-tions will remain dependent on pyrometallurgi-cal processing in the near-term. While the UnitedStates has a clear advantage here in the produc-tivity of their operations, this is largely negatedby lower foreign labor costs and the differencein environmental control requirements. Any im-position of air quality control regulations in for-eign countries would benefit domestic compa-nies in several ways, including a “leveling of theplaying field” on environmental control costs,their advantage in acid plant operating experi-ence, and the ability to market control tech-nology.
The rapidity of technology transfer in the cop-per industry does not mean that we should stopinvesting in innovation. I n the period before aninnovation becomes standardized, its developerenjoys a competitive advantage. I n addition todirect investments, a variety of other policies–such as tax policies on capital income, depreci-ation policies, and policies to support R&D—mayinfluence the pace of technological change andhence competitive advantage.
Staying Power10
A final measure of competitiveness is termedstaying power: the ability to survive in the mar-ketplace over the long-term despite short-termlosses of cash or market share. Staying powerstems from low current operating costs and/orhigh exit barriers, including perceived and actualcosts of closure. 11 A high-cost mine that also hashigh closure costs or operators willing to subsi-dize losses exhibits greater staying power. Its per-sistence in a depressed market also may exert
10Barbara J, Evans, “How To Assess the Staying Power of WorldCopper Mines,” Engineering & Mining Journal, April 1986.
11closure costs at 10 large open-pit copper mines in the West-ern United States that closed between 1981 and 1983 were between$0.20/lb and $0.22/lb of lost copper production during a 12-monthclosure period.

228
downward pressure on the price to a level thatforces competitors with less staying power toclose. Thus it is more the staying power of com-petitors than their profitability that affects a com-pany’s relative outlook.
Competitive rankings based solely on cost ofproduction distort the relationship between com-petitive strength and profitability. Competitivestrength is the ability to maintain a position in themarket. This ability is a prerequisite, but not aguarantee of profitability. Competitive strengthand profitability depend on different cost con-siderations. The former is a function of operat-ing cost and price, while the latter depends notonly on earnings, but also on exit barriers. Onlywhen operating earnings drop below the cost ofwithdrawing from the market does a facility standto lose its staying power.
Comparing staying power in governmentaloperations is more difficult. Closing a State-owned mine is touchy—it creates unemploymentand degrades foreign exchange. Operating lossescan be sustained so long as mineral sales gener-ate enough foreign currency to cover the foreign-currency portion of operating costs. But manyState-owned mines that operated throughout therecent recession did not have to be subsidizedbecause they are strong, low-cost competitors.In other cases, subsidization was a sound busi-ness decision to endure operating losses to avoideven greater direct closure costs. To determinethe staying power of operations with persistentsubsidization, overall closure costs can be setequal to the country’s debt capacity, as a worst-case measure, As noted previously, debt will be-come a more important consideration for futurecapital investments at copper operations in LDCs.
FEDERAL POLICIES AFFECTING COMPETITIVENESS
Federal policy toward an industry can be ex-pressed in legislation, executive orders, treaties,rulings of commissions, government participationin international organizations, etc. There is nocomprehensive national industrial policy, letalone a national minerals policy. Depending onthe philosophy of individual administrations,measures directly related to competitiveness(such as trade relief) often meet with little suc-cess. Similarly, the policies with the most far--reaching impacts on the competitiveness of theU.S. copper industry may have been institutedfor reasons totally unrelated to copper markets(e.g., environmental regulation).
Current Federal policies with potential im-pacts on the competitiveness of the domesticcopper industry include those related to taxa-tion, trade, defense, the environment, R&D, in-dustrial development in general, and foreignaid. This section reviews all of these policy areasexcept foreign aid, which is discussed in ch. 3.
The effects of these policies on the U.S. cop-per industry vary. Decisions under various tradeinitiatives generally have gone against the indus-try. When coupled with U.S. contributions to in-
ternational loans that contributed to gluts in thecopper market, trade and foreign policy have hadsignificant adverse impacts on competitiveness.On the other hand, government denial of traderelief during the 1980s forced the copper indus-try to pull itself up by its own bootstraps—in partthrough investments in new technology and in-creased productivity. These efforts are discussedin the following section.
Environmental regulation also has been verycostly to the industry (although beneficial to so-ciety as a whole). Even here, however, the pri-mary impacts (smelter closure or the capital costof new smelters) have run their course. Barringany further changes in environmental control re-quirements, the remaining burden is in slightlyhigher operating costs compared to countrieswithout similar environmental controls.
Other policy measures, such as tax policy, canbe very beneficial, depending on a company’scapital structure and investments. Still others,e.g., defense policy and the present modest Fed-eral investments in R&D and industrial incentivesrelated to education and training, are neutral orprovide small benefits.
229
Federal Tax Policy
Governments have long used tax provisions tofurther objectives such as raising revenues, pro-moting economic development, and conservingresources. For capital intensive industries likemining, the tax regime can make or break a par-ticular project. Thus, taxation relative to that ofother producing nations is an important elementin the domestic copper industry’s competitiveposition.
The major copper producing countries havedifferent tax regimes, which include income taxesas well as sales, social security, capital, and sever-ance taxes, and royalties. In the United States,Canada, and Australia, copper companies alsoare subject to State or Provincial taxation. Of allthese taxes, national income taxes probably arethe most critical in determining an industry’s in-ternational competitiveness. Moreover, incometaxes are the favored tax route for providing ben-efits to a specific industrial sector. The effects ofspecific tax provisions on an industry also canvary widely over time depending on economicvariables such as the price of the goods produced,the age of capital investments in plant and equip-ment, inflation rates, etc.
A 1986 study (i.e., before the Tax Reform Actof 1986) of the structure of international mineralincome tax systems found the U.S. tax regimevery competitive.12Based on a hypothetical 20-year copper/gold mine in British Columbia, thatstudy examined the top marginal income taxrates, capital cost recovery, investment-related in-centives (e.g., investment tax credits, depletiondeductions) and other deductions, and the result-i ng tax base as a percentage of discounted oper-ating cashflow for 8 major copper producingcountries. 13 In addition, the study discussed thesensitivity of effective tax rates to changes in prof-itability, inflation rates, and product price cy -
‘2 Keith Brewer et al, “Fiscal Systems, ” paper presented at theConference on Public Policy and the International Competitivenessof North American Metal Mining, Golden, CO, January 1987.
13Australia, Canada, Chile, Peru, Papua New Guinea, South Africa,
United States, and Zambia.
cles.14 Although the U.S. minerals industry hadthe second highest marginal tax rate, they hadthe second lowest income tax base, primarily dueto generous investment incentives and otherdeductions (see table 10-2),
According to the Congressional Budget Office(CBO), before tax reform the U.S. mining indus-try benefited more than any other sector frompreferences that reduced its taxes.15 The twomost important tax provisions targeted specificallyat the mining industry are depletion allowancesand expensing of exploration and developmentcosts, both continued under the 1986 Act. Otherpre-1 986 tax benefits applicable to all industriesincluded the accelerated cost-recovery system( A C R S) and the investment tax c red i t .
The depletion allowance enables mineral pro-ducers to deduct a percentage of taxable net in-come based on either investment cost or a speci-fied fraction of gross sales from the mineralsextracted, whichever is higher. In recent years,the depletion allowance has been limited to 50percent of taxable net income. In theory, Con-gress intended this allowance to stimulate explo-ration and thus provide for the replacement ofdepleted mineral properties. In effect, a mineralproperty usually is so long lived that the companyis able to write off its original investment severaltimes over. CBO estimated the excess of percent-age depletion over cost recovery for non-fuelminerals to be $300 million in FY 1984.16 Becausethe allowance is tied to revenues, it will vary de-pending on the health of the industry, however.
The minerals industry also may deduct a max-imum of 70 percent of the cost of exploration anddevelopment in the year incurred, and capital-ize the remaining 30 percent over a 5-year straight-
14The United States was not included in the sensitivity analyses
for profitability and inflation, but our pre-reform tax regime wassimilar to Canada’s and the results should be comparable.
15U.S. Congress, Congressional Budget Office, Federal Support
of U.S. Business (Washington, DC: U.S. Government Printing Of-fice), January 1984.
16Ibid. see also pa u I R. Thomas et a 1., The Depletion Allowance
and Domestic Minerals Availability: A Case Study in Copper (Wash-ington, DC, U.S. Bureau of Mines, Information Circular 8874), 1982.
77-353 0 - 8

230
Table 10.2.—Mineral Income Tax Comparisons
Total deductions Profitability Inflation
Top marginal Capital cost and investment Low High CyclicalCountry rate recovery incentives Tax basea Base case (5% IRR) (23% IRR) 5% prices
A u s t r a l i a b . . .Canada c . . : :Chile ..,,,..., .: :.. .Peru, ., . . . . : : : ., ... . .PNG d ......., . . .South Africa .,. . .United Statese
Zambia . , , . . . : : : : : : : ’ : : : ’ , , , : :
49.0%45.340.057.035.046.254.245.0
51.0%50.753.052.048,053.048.553.0
73.0%74.756.764.048.060.576.515.5
2 7 . 2 % 10025.3 10040.6 10035.5 10052.0 10037.3 10023.5 10016.5 100
333144174178211128NA
o
77 104 105120 127 9793 113 10297 110 9785 113 102
100 114 98NA NA 91f
175 175 75aAs a percent of operating cashflow; calculations based on a 15 pre-tax IRR mining project over a period of 20 years. Cashflows and tax bases are discounted at 5°/0.bBased on Queensland.cArithmetic average of results of Quebec, Ontar io , Mani toba, and Br i t ish Columbia . Only Federa l and provincia l income taxes are cons idered,dPNG tax system has a top marginal rate of 70% which is triggered only at a very high profitability level.eArithmetic average for States of Utah and Alaska, only Federal and State taxes are considered. Based on tax code before tax reform of 1986.
‘For Alaska only.
SOURCE” Keith Brewer et al. “Fiscal Systems, ” paper presented at the Conference on Public Policy and the International Competitiveness of North American MetalMining, Golden, CO, January 1987.
line depreciation schedule.17 This defers a por-tion of income taxes until the deductions havebeen taken. For development expenditures, onlythe amount that exceeds the net receipts of themine for a given year may be included, CBO esti-mated that expensing and depreciation under theold 80/20 formula amounted to $60 million forthe non-fuel minerals industries in FY 1984.18 Theminerals industry notes that other industries re-ceive similar benefits through tax credits for re-search and deductions for new product devel-opment.
While the Tax Reform Act of 1986 reduced thetop corporate tax rate from 46 percent to 34 per-cent, it also set the minimum tax at 20 percentand significantly reduced investment incentivesand other deductions. In addition, the 1986 lawlimited the use of foreign tax credits, repealedACRS and the investment tax credit, and changedthe depreciation schedule for mining equipmentfrom 5 years at 150 percent to 7 years at 200 per-cent. The percentage depletion allowance andexpensing of exploration and development costswere retained.
With the possible exception of effects on fi-nancing foreign operations, U.S. minerals com-panies do not view the new tax regime as bring-
17 These are the allowances under the Tax Reform Act of 1986.Previously, industry was allowed 80 percent expensing, with 20percent capitalizing.
18CBO, supra note 15.
ing major changes for them. Their current focuson restructuring and modernization, rather thanexpansion, does not raise any immediate con-cerns about the tax changes. Those expansionsthat are planned are primarily solvent extractionand electrowinning facilities, with a low capitalcost compared to smelters. Smelting and refin-ing are capital intensive, and new facilities willbe less attractive under the new tax system. Com-panies face so many other problems with a newsmelter (such as environmental costs), however,that it is unlikely that taxation would be the decid-ing factor, Mining is more oriented toward laborand equipment costs than capital investment andmay gain a slight tax advantage.19
Instead, it is the conditions the U.S. economyand its minerals industry might face in the next5 to 10 years that may raise questions about taxpolicy. The lower top tax rate benefits profitableprojects more than marginal ones.20 While thisrewards success, and thus sends appropriate mar-ket signals, it also can significantly reduce gov-ernment revenues, and budget pressures maylead to a rate increase once again.
Accelerated depreciation allowances minimizethe effect of cyclical prices on effective tax rates.
19 John J. Schanz, Jr. and Karen L Hendrixson, ‘‘Impact of Exist-
ing Federal Policies on the Copper Industry, ” Congressional Re-search Service report prepared at the request of the Subcommit-tee on Oversight and Investigations of the Committee on Energyand Commerce, U.S. House of Representatives, July 1986.
20 Brewer et al, supra note 12.
231
Firms are able to claim greater amounts of de-preciation during periods of higher profits. Thecapital cost recovery system for the U.S. mineralsindustry did not change significantly, so the in-dustry’s taxes should remain relatively sensitiveto cyclical prices. A switch toward more rigiddepreciation schedules similar to the accountingtreatment of capital costs would result in highereffective tax rates for mining. This change wasdiscussed extensively in the debate over the TaxReform Act of 1986, but was not included in thefinal package.21
The repealed investment incentives and deduc-tions also are less valuable to the more profita-ble projects. The investment tax credit primarilyprovided inflation protection for capital intensiveventures. During periods of low inflation, thisfixed investment incentive can result in very loweffective tax rates. Thus, while its removal shouldincrease government revenues over the shortterm, it also makes the current tax regime rela-tively insensitive to inflation. A return of high in-flation rates could lead to heavy industry pres-sure to reinstate the credit or other investmentincentives. 22 Incentives also could be used to en-courage investment in heavy industry and newtechnology to increase productivity in the eventof a recession.
pressure to raise revenues in order to decreasethe U.S. budget deficit may lead to higher taxrates for industry i n the short term. Obvious tar-gets would include increasing the maximum taxrate, and adjusting the depletion allowance andexpensing of exploration and development costs,which represent the greatest amount of foregonerevenues from the minerals industry.
A final aspect of tax policy that might be con-sidered affects copper consumers. If the condi-tions that occurred during the early 1980s–lower-cost imports taking over an increasingshare of the domestic market and a significant de-cline in U.S. copper production—were to recur,tax incentives could be used to stimulate the pur-chase of domestic copper. Thus, consumers whopaid more for U.S. copper might be subsidizedthrough a tax deduction or credit tied to the
2 ‘ Ibid.22Ibid
difference in cost between foreign and domes-tic copper.
Trade Policy
International trade and financing activities inthe copper industry have been highly contentiousin recent years. The U.S. industry has been se-verely critical of some foreign operations’ re-fusal to curtail production in light of the over-supply conditions existing in the world market.Domestic producers have sought to curb theseforeign activities through legislation, appeals tothe International Trade Commission, and otherpolitical and legal means, but have been largelyunsuccessful.
Because global copper trading, pricing, andfinancing are highly developed and integrated,few market activities have single, isolated ef-fects.23 Instead actions in one part of the marketare quickly felt throughout the world. The highlevel of U.S. imports subjects domestic produc-ers to constant competitive pressures from theworld market. 24 During the past decade, as im-ports gained an increasing share of the domes-tic market, the U.S. copper industry requestedon several occasions that the Federal governmentrelieve the foreign pressure through a variety oftrade measures. Some of the requests claimedthat the domestic industry needed trade relief inorder to restructure and modernize. Others com-plained that differing business environments inthe United States and abroad result in advantagesfor foreign producers.25 A few charged that for-eign activities violate international trading codes(such as the General Agreement on Tariffs andTrade, GATT) and their counterparts in U.S. law.
Section 201 Cases
The most publicized copper industry com-plaints were the Section 201 cases filed in 1978
23The copper market is characterized by high Ievels of trade ( I n
1985, trade accounted for 23, 11, and 40 percent of NSW produc-tion of ores and concentrates, blister, and refined copper, respec-tively), a very mature world pricing system, and a high level of in-ternational Investment (see ch, 3),
24The United States is the world largest importer of refined cop-
per. In 1986, U.S. imports totaled 502,000 tonnes of refined cop-per, accounting for almost a quarter of consumption (see ch. 4).
‘; The catch phrase used in this argument is that an “uneven play-ing field" exists in the copper industry.

232
and 1984. Sec. 201 of the Trade Act of 1974 (alsocalled the Escape Clause) is designed to providetemporary import relief to domestic producersseriously injured by increased import competi-tion.26 The relief is to be used for economic ad-justment programs, such as restructuring andmodernization. The fairness of trading practices(e.g., dumping or subsidization) is not at issue inSec. 201 cases; those matters are handled in an-tidumping and countervailing duty cases (seebelow).
Sec. 201 requires that an industry convinceboth the International Trade Commission (ITC)and the President that it merits trade relief. First,the ITC determines whether imports have causedthe domestic industry serious injury, and if so,recommends trade actions to prevent or remedythe injury. 27 The remedies that the ITC may rec-ommend are limited to tariffs, quotas, tariff-ratequotas, and trade adjustment assistance for work-ers. If the ITC finds serious injury, the Presidentmust review the case, and either provide importrelief or determine that doing so is not in the na-tional economic interest. Whereas the ITC’s de-termination centers on imports and the health ofthe domestic industry, the President’s decisionis based on a broader concept of economic in-terest that also includes the well being of work-ers and consumers and strategic concerns. If thePresident decides that relief is appropriate, it cantake the form of the ITC’s recommendations; adifferent package of tariffs, quotas, and tariff-ratequotas; or negotiation of orderly marketing agree-ments (bilateral agreements to restrict importsinto the United States).
26A concise description of Section 201 as well as other aspectsof U.S. trade law appears in, U.S. House of Representatives Com-mittee on Ways and Means, Subcommittee on Trade, Overviewof Current Provisions of U.S. Trade Law, USGPO WMPC:98-40(Washington, DC: 1984).
27The ITC must “determine whether an article is being imported
into the United States in such increased quantities as to be a sub-stantial cause of serious injury, or the threat thereof, to the domesticindustry producing an article like or directly competitive with theimported article. ” Substantial cause is defined as “a cause whichis important and not less than any other cause. ” If the ITC makesan affirmative injury determination, it must (1) find the amount ofthe increase in, or imposition of, any duty or other import restric-tion which is necessary to prevent or remedy the injury, or (2) ifit finds that adjustment assistance can effectively remedy the in-jury, recommend the provision of such assistance.
In 1978 and again in 1984, the ITC found thatrising imports were causing serious injury to thedomestic copper industry and recommendedthat the president remedy the injury.28 In bothinstances, the president denied import relief be-cause it was deemed not in the national economicinterest. In the 1984 case, the ITC’s findings weresent to the President 2 months before the presi-dential election. Such timing is usually a politi-cal advantage for the domestic industry becauseof the voting power and campaign contributionsof those who may benefit from trade relief. De-spite this pressure, President Reagan ruled thatimport relief was not in the national economicinterest due to the potential damage to copperfabricators (which have more employees than themining and processing industry), and the incon-sistency of such relief with the President’s freetrade philosophy. The existence of the CarbonSteel Sec. 201 case, on which the President hadto decide shortly thereafter, was probably an ad-ditional reason for denying help. If the copperindustry were granted trade relief, the steel in-dustry would have merited equally generousmeasures.
Although trade relief was denied in the 201cases, the proceedings’ publicity yielded somesecondary benefits. The attention brought to theindustry’s plight by the 1984 case probably helpedproducers negotiate wage and benefit conces-sions from labor unions and rate decreases fromelectric utilities. The cases also highlighted theproblem of access to markets. Some foreign com-panies’ production strategies are now more likelyto consider the impact on U.S. competitors in or-der to avoid conflicts.29
Unfair Trading Cases (Antidumping andCountervailing Duty)
Antidumping cases allege selling prices of lessthan fair value. Countervailing duty cases claimsubsidization. These tend to be narrower in scopeand usually are publicized less than Sec. 201
28Both cases covered unwrought, unalloyed refined copper. The1984 case also covered black copper, blister copper, and anodecopper.
29Jose Luis Mardones and Isabel Marshall, “Lobbying by ExPorters:The 1984 Copper Import Case, ” paper presented at the Copper87 Conference, Vina del Mar, Chile, Nov. 30 to Dec. 3, 1987.
233
cases. The fabricated copper products industryhas filed several of these unfair trading cases. In1986, the ITC and the Commerce Departmentfound that the brass sheet and strip producerswere being injured by imports from Brazil, Can-ada, South Korea, France, Italy, Sweden, andWest Germany that either were subsidized orsold at less than fair value (i. e., dumped).
Copper Trade Legislation
Because of the industry’s troubles, copper tradehas been the subject of a number of bills con-sidered by Congress in the early 1980s. The pro-posed legislation has dealt primarily with theoversupply situation in the copper market. An ex-ample is the Trade Act of 1984, which containeda nonbinding clause stating that the U.S. govern-ment should negotiate with foreign copper pro-ducers for lower copper production in order toraise the price. President Reagan denied this re-quest, citing the infeasibility of negotiating the re-quired agreements (Chile in particular showedsigns of being uncooperative); potential antitrustviolations in getting the required cooperationamong U.S. producers; and the negative effectsof increased costs for consumers. Congress in-cluded a binding version of this clause as anamendment to the Textile and Apparel Trade En-forcement Act of 1985, but that bill was vetoedby the President.
Another example is the Minerals and Materi-als Fair Competition Act of 1987 (S. 1042), whichhas yet to be reported out of the Senate FinanceCommittee. This legislation would amend manyU.S. trade statutes to recognize subsidized excessforeign capacity as a source of injury to produc-ers of nonagricultural fungible goods (includingcopper) .30 In addition, the Act would establishthat a principal U.S. negotiating objective withinGATT would bean agreement imposing sanctionsagainst providing subsidies for excess capacity.Furthermore, the bill instructs U.S. representa-tives to the International Monetary Fund (IMF)to ask for a ban on loans or other financing assis-tance from the Compensatory Financing Facility(CFF) to countries that do not agree to adjust pro-
30 Ma, or statutes that wouId be amended by the Minerals and Ma-
terials Fair Competition Act of 1987 Include Section 301, Section201, and antidumping and countervailing duty provisions,
duction and to refrain from adding further capac-ity. In the absence of an overall IMF ban, the U.S.representatives are to vote against all CFF loansto countries that do not agree to adjustments.
An excess capacity subsidy provision also wasincluded in the Senate version of the OmnibusTrade and Competitiveness Act of 1987. The pro-vision classified as an unreasonable trade prac-tice foreign subsidization of industries that pro-duce non-agricultural goods for which worldwideproduction exceeds demand. This provision didnot make it into the conference report that waspassed by both houses of Congress in 1988.
In 1984 and 1985, Congress also consideredbills to increase the duty on imported copper inan amount that wouId offset the cost to the do-mestic industry of complying with environmentalregulations. In 1984, legislation was passed thatsuggested that copper be given higher prioritywithin the stockpile, and added a ‘ ‘Buy Amer-ica” clause to the stockpile.
U.S.-Canada Free Trade Agreement
The United States and Canada signed an ac-cord in January 1988 that seeks to liberalize tradeand investment between the two countries. Thisbilateral agreement would eliminate all tariffs ongoods trade by 1998, reduce nontariff trade bar-riers, establish rules for bilateral investment, andcreate a dispute settlement mechanism .31 To beenacted, the U.S.-Canada Free Trade Agreement(FTA) must be approved by the U.S. Congress andthe Canadian Parliament.
The FTA is opposed by several major copperproducers, represented by the Non-Ferrous Me-tals Producers Committee (NFMPC),32 primarilybecause it fails to prohibit some Canadian sub-sidization practices. They are concerned that
3 1 The ac cord also deals with serif ices trade, b~l II llt’~~ t r<~i [’[, (’nerg}(
and natlona! secu rlty concerns, and ~ome out ~la nd I ng t rad (J I i~ LJ(l\
l~The Non. FerrOus M@a IS prod u c er~ cc) m 111 Itl t’t> ( N F IN! P~- I I \ ,1
trade association whose members are Asa rc o Phc’ii)\ D(dH(I ,] nc{
the Doe Run Co. (a lead procju( er based In St. Lou15, ,Mc)) Tht, ir
pos[tlon on the FTA 1~ c)utllnd In th{~ statement by Robert J. Mut h,President, before the ,Mlnlng and Ndtu ral Resources Subcommit-tee ot the I nterlor anci I nsu Iar Attalrs Com rn Ittee o{ the U.S. Houseot Repre~entatl\ es, Nfa rc h 10, 1988. I n add It Ion to su bsld ies, theN F,MPC IS ag,~l nst the FTA k au~e If m eaken~ ludlcial re~ Iem inu nta I r trade [ ,]w~s and t~ll m I n.lte~ tht~ ta rlrt on I m Imrts of Ca nad l,) ncopper.

234
Canadian copper companies are using below-market-rate capital from various national andprovincial government assistance programs tomodernize facilities. As an example, the NFMPCcites the C$83 million loan from a governmentacid rain program for modernization and pollu-tion control at Noranda’s copper smelter atRouyn, Quebec. Noranda does not have to re-pay the loan through monetary reimbursement;it may substitute “additional investments aimedat maintaining its commitment to Quebec’s cop-per industry.”33 There also have been suggestionsthat subsidies may be made available to reopenNoranda’s Gaspe copper mine in Murdockville,Quebec (closed in April 1987 because of a fire),and to the Hudson Bay Mining and Smelting Co.copper smelter at Flin Flon, Manitoba. These sub-sidies are especially disturbing to the U.S. pro-ducers because half of the increase in copperimports since 1985 came from Canada. More-over, even after modernization, Canadian smelt-ers will control less than half as much sulfur di-oxide as U.S. smelters.
The FTA does not actually sanction the subsidi-zation programs, but leaves their legality to beresolved by a bilateral working group establishedto iron out the differences between U.S. andCanadian unfair trade law. Until the group fin-ishes its work (up to 7 years), both countrieswould apply their own antidumping and coun-tervailing duty laws to any disputes that may arise.For cases under these laws that are investigatedduring this interim period, the FTA comes intoplay at the end of the proceedings, after the ITCand the Commerce Department (or their Cana-dian counterparts) have made their final deter-minations. Independent binational panels wouldreview contested determinations for their con-sistency with the laws of the country that madethem; national courts currently undertake suchreview .34
33"Copper,” Metals Week, vol. 59, No. 20, May 16, 1988.34 In the United States, an unfair trade case can be concluded once
the ITC and the Commerce Department have made their findings.Quite often, however, the determinations of these agencies are chal-lenged before the U.S. Court of International Trade.
Miscellaneous Domestic TradeDevelopments
The Generalized System of Preferences (GSP)program allows certain products to be importedduty-free into the United States from LDCs to pro-mote their economic development. In Decem-ber 1987, Chile’s benefits under the GSP programwere rescinded because it was determined thatChile consistently denies its workers basic laborrights. 35 This, however, does not cover a greatdeal of copper trade because blister, anode, andrefined copper from Chile were already excludedfrom the GSP program.
Miscellaneous International TradeDevelopments
In 1984, the European Economic Community(EEC) complained to the GATT Council that Jap-anese tariffs were pushing European companiesout of the copper ore and concentrates markets.Japanese tariffs are high for refined copper, butlow for concentrates (see discussion of trade inch. 4). The EEC claimed that this tariff scheduleallowed Japanese copper smelting and refiningfirms to consistently pay higher prices for con-centrates than European firms could afford, thusassuring raw material supplies for themselves tothe detriment of European competitors.36 Somedomestic copper producers also had protestedthe Japanese practices to the U.S. governmentsince their inception in the late 1960s and early1970s, but without avail.
In 1984, a working group was created withinGATT to study international trade problems af-fecting nonferrous metals and minerals. Thegroup is to identify measures taken by import-ing and exporting countries that hamper worldtrade, and make recommendations on how trademight be liberalized.
Since 1985, the United States has been work-ing with other copper producing countries to
35Under authority of the Generalized System of preferences
Renewal Act of 1984.36Janice L.W. Jolly and Dan Edelstein, ‘‘Copper, ” 1984 Minerals
Yearbook, Volurne /, (Washington, DC: U.S. Department of theInterior, Bureau of Mines, 1986).
235
establish a Producer/Consumer Forum patternedafter the International Lead Zinc Study Group.This organization will compile copper statistics,develop quantitative information on existing ca-pacities and end-uses, and provide a forum fordiscussions about the problems and opportuni-ties of the copper industry. 37 It will play only aminimal role in market development activitiessuch as advertising and promotion. The Forumwill be autonomous rather than meet under theauspices of United Nations Conference on Tradeand Development (UNCTAD).38
Intergovernmental Council of CopperExporting Countries (CIPEC)
Most of the major world copper producingcountries (Chile, Peru, Zambia, Zaire, Indonesia,Australia, Papua New Guinea, and Yugoslavia)belong to the Intergovernmental Council of Cop-per Exporting Countries (CIPEC). Established in1967, this trade association conducts marketingstudies, disseminates information on copper de-velopments, and seeks to promote expansion inthe industry. During 1974-76, in the wake ofOPEC’s success in raising oil prices, CIPEC at-tempted to establish itself as a cartel. It tried, butfailed, to stabilize then falling copper pricesthrough production cutbacks. The group has dis-cussed price stabilization numerous other timesbut has been unable to agree on a program, andCIPEC’s power to manage supply and stabilizemarkets has never been established.
Defense Policies
Copper is a strategic material—one that is es-sential in the production of equipment criticalto the U.S. economy and the national defense.In 1986, the United States imported around 27percent of its refined copper consumption. Thisis more than the total amount used by the elec-trical and electronics industry in 1986. The prin-cipal sources of imports were Chile (40 percent),
17Janice L,w. Jolly, “Copper, “ 1985 Minerals Yearbook, Volume/, (Washington, DC: U.S. Department of the Interior, Bureau ofMines, 1987).
38Creat ion Of the group was first proposed at an ad hoc meeting
c o n v e n e d b y U N C T A D t o r e v i e w c o p p e r m a r k e t c o n d i t i o n s
Canada (29 percent), Peru (8 percent), Zambia(7 percent), and Zaire (6 percent).39
While neither political instability nor hostilityis a major concern about the security of suppliesfrom these countries, their imports can be sub-ject to disruption. For example, one of the mostdisruptive interruptions in U.S. materials supplyin the last 30 years was the loss of nickel fromCanada during the 4-month labor strike againstthe Canadian nickel industry in 1969. At thattime, Canada supplied 90 percent of U.S. primarynickel supplies .40 A similar occurrence in Canada’scopper industry would cut off U.S. imports equiv-alent to the amount used for consumer goods,military applications, and chemicals in 1986.
Moreover, supplies do not actually have to beinterrupted to have significant economic im-pacts on U.S. mineral markets. A rebel invasionof Zaire’s mining country in 1978 led to fears ofa cobalt shortage that stimulated panic buying.Prices went through the roof, and domestic usersturned to cheaper substitutes and recycling wherepossible. However, mining and processing facil-ities were closed only briefly, and cobalt produc-tion in Zaire and Zambia actually increased 43percent in 1978 and 12 percent in 1979.41 Thetransportation routes from the mining districts inZaire and Zambia are considered very insecurebecause the rail lines pass through Angola,Mozambique, or South Africa.
Potential supply interruptions of imported cop-per are not considered as critical as those for met-als such as chromium and cobalt, which are notproduced in the United States and do not havereadily available substitutes. The economic con-sequences of a supply shortfall could be severefor U.S. industry, however. The price of copperand its substitutes would increase dramatically.It would take anywhere from 6 months to sev-
39Janice L. W. Jolly and Daniel Edelstein, ‘‘Copper, Mineral Com-
modity Summaries: 1987 (Washington, DC: U.S. Department ofthe Interior, Bureau of Mines) 1987.
40U.S. Congress Office of Technology Assessment, Strategic Ma-
terials: Technologies To Reduce U.S. Import Vulnerability (Wash-ington, DC: U.S. Government Printing Office, OTA-ITE-248) May1985.
41 I bid.

236
eral years to bring U.S. idle mine capacity andunexploited reserves into full production. Com-panies would not be willing to incur the capitalinvestment to do so without assurances that pro-duction would continue for long enough to re-coup the investment. Moreover, most imports arei n the form of refined and unmanufactu red cop-per. Replacing these would require either dras-tic increases in SX-EW capacity, or the reopen-ing of currently idle smelter capacity (and thussubstantial capital investment in new furnacesand pollution control), or a massive recyclingeffort.
The United States has long had legislative pol-icies designed to provide either supplies of cop-per or additional productive capacity in the eventof a supply interruption that threatens nationalsecurity. This legislation includes the Strategic andCritical Materials Stock Piling Act of 1946 and theDefense Production Act of 1950.
The National Defense Stockpile
Congress first authorized stockpiling of criticalmaterials for national security in 1939. World WarII precluded the accumulation of stocks, and itwas not until the Korean War that materials stock-piling began in earnest. Since then, U.S. stock-pile policy has been erratic and subject to peri-odic, lively debate over the amount of eachcommodity to be retained and over the disposalof stockpiled items for budgetary reasons.
Stockpile goals are currently based on havinga 3-year supply of materials needed to meet na-tional defense and industrial needs in a defenseemergency. 42 A transaction fund dedicates rev-enue from Federal sales of stockpile excesses tothe purchase of materials short of stockpilegoals. 43 In 1986, the total stockpile inventory wasvalued at approximately $10 billion. If the stock-pile had met all goals, it would have been val-ued at about $16,6 billion in 1986.44
Copper is a strategic commodity in the Na-tional Defense Stockpile. The current goal is 1million short tons, with a 1986 inventory of22,297 tons of copper, plus 6,751 tons of cop-per contained in 9,645 tons of brass.45
Over the years stockpile acquisitions and re-leases have affected copper supply and price.In 1954, market shortages due to a labor strikeled to the release of 40,000 tons. From 1959 to1963, stockpile acquisitions combined with cop-per labor strikes and strong economic expansionto push prices upward.46 The most significant re-leases–550,000 tons–occurred in 1965-66 undera declaration of national emergency due to theVietnam War. These releases occurred at a timeof growing demand, disturbances affecting over-seas production, and rising domestic prices. Con-sumers welcomed the resultant downward pres-sure on prices, but others alleged that thestockpile was being used as an economic bufferrather than for defense. Q’
In the early 197os, the overall stockpile objec-tives were reduced to a 1 -year supply, and thecopper target was reduced to zero. Virtually allof the copper remaining in the stockpile was soldduring the commodity price boom of 1974. In1979, Congress reinstated the 3-year planningperiod for defense emergencies, and the coppergoal was set at 1 million tons,
Most recently, legislation was introduced in the98th Congress (1 983-84) to purchase copper forthe National Defense Stockpile to prod the slug-gish markets, Opponents argued that the acqui-sitions wouId have been insufficient to reopenany shutdown operations, and would have estab-lished a precedent of allowing economic con-siderations to supersede defense needs.
Bringing the stockpile up to its goal of 1 mil-lion tons would require the purchase of almost971,000 tons of copper. This is equivalent to 90percent of 1986 U.S. primary refinery produc-tion, and 13 percent of Western world produc-tion. Even if spread over several years, such pur-chases would exert significant upward pressure
45lbid.46U.S. Department of the Interior, Bureau of Mines, Minerals Year-
book, varlous years,~’~c hd nz and t {end rlxson, su pra note 19.
237
on copper prices during periods of low demandor excess supply. While this could help the U.S.industry weather a market slump, it also couldsend false market signals to foreign producers,and encourage overbuilding of capacity.
The Defense Production Act
The Defense Production Act of 1950 (DPA) pro-vides several mechanisms for assuring availabil-ity of materials and industrial capacity needed fornational security. Title I authorizes the setting ofgovernment priorities for materials allocation ina national emergency or war. Title Ill providesloans or loan guarantees for corporate activitiesthat would expedite production in the event ofa national emergency. These include expansionof capacity, development of technological proc-esses, or the production of essential materials, in-cluding exploration, development and mining ofstrategic metals. Under DPA, the governmentalso may purchase metals and minerals for gov-ernment use or resale.
In the 1984 reauthorization of DPA, Congressestablished new procedures for authorization ofTitle ill projects in the absence of a national emer-gency or war.48 The law requires the Presidentto determine that Federally-supported projectsmeet essential defense needs and that the Fed-eral support offered wouId be the most “cost-effective, expedient, and practical alternatives formeeting the need. ” Industrial resource shortfallsfor which Title III assistance is sought must beidentified in the budget submitted to Congress.
Numerous DPA contracts and agreements wereestablished between 1951 and 1956, when cop-per was in short supply. These involved govern-ment loans, direct purchases, subsidies of other-wise uneconomical output, and acceleratedamortization for income tax purposes. Between1951 and 1958, the Defense Minerals ExplorationAdministration offered loans of up to 50 percentgovernment participation for copper exploration.In 1967, when copper was again in short supply,the Duval Company’s Sierrita mine received a$56 million loan. The DPA has not been usedto support the domestic copper industry since
1969, when the last copper exploration partici-pation contract expired.49
Although DPA provisions generally have beenused to encourage mining of strategic minerals,the law also could be used to ensure adequatesmelting and refining capacity to meet domesticnational security needs, and to develop advancedtechnologies considered desirable for enhancingthe security of domestic resources.
Environmental Regulation
The copper industry is subject to numerousFederal and State regulatory requirements re-lated to environmental protection and workerhealth and safety. These range from the prep-aration of an environmental impact assessmentprior to initiating a mining project, to the con-trol of air and water pollution during mining andprocessing, to the reclamation of tailing piles anddumps when an operation closes. Throughout,operations are scrutinized by the Mine Safety andHealth Administration and the OccupationalHealth and Safety Administration. Other types oflegislation either regulate the location of mineson public lands or withdraw those lands frommining altogether.
This section briefly reviews the major Federalprograms and discusses their effects on competi-tiveness; the pollutants of concern and technol-ogies for their control are described in chapter8. It is important to note that individual States alsomay have relevant legislation (especially relatedto groundwater protection) that imposes addi-tional standards and permitting, inspection, andenforcement requirements.
The National Environmental Policy Act
The National Environmental Policy Act of 1969(NEPA) requires, for “major Federal actions sig-nificantly affecting the quality of the human envi-ronment” (e.g., leasing Federal land for mining),that an agency prepare a statement that describespossible environmental impacts, any adverse ef-fects that cannot be avoided (including irrevers-ible commitments of resources), and alternativesto the proposed action and their impacts,
48Public Law 98-265, 49Schanz and Hendrixson, Supra note 19.
238
New copper mines are opened infrequently inthe United States, and copper companies rarelyhave to go through the NEPA process. When theydo, however, it can be time consuming and ex-pensive to provide all of the data needed by theagency preparing the environmental impact state-ment (EIS). Moreover, because of the extensivepublic participation in the NEPA process, it isoften the largest source of delay in any new ven-ture that comes under its aegis.
The Clean Air Act
The Clean Air Act sets standards for both am-bient concentrations of pollutants and emissionsfrom individual sources. The National AmbientAir Quality Standards (NAAQS), which addressambient concentrations, include primary stand-ards designed to protect human health and sec-ondary standards to safeguard public welfare. TheEnvironmental Protection Agency (EPA) has setprimary and secondary standards for sulfur ox-ides, particulate matter, nitrogen dioxide, hydro-carbons, photochemical oxidants, carbon mon-oxide, ozone, and lead.
Every major new source of emissions (e.g., anew smelter furnace) is required to undergo apreconstruction review to ensure it will not vio-late NAAQS. Sources in dirty-air areas, or at theopposite extreme, those where the air is alreadymuch cleaner than the standards require, are sub-ject to more stringent permitting requirements fornew sources. In addition, operating sources arerequired to use technological controls to meetemission limitations, which set quantitative limitson the amount of pollutants that can be releasedto the atmosphere.
At copper operations, the primary concerns aresulfur dioxide (SO2), particulate, and fugitiveemissions from smelting and converting; and fu-gitive dust from tailings piles and waste dumps(see ch. 8). At most smelters, meeting the emis-sion limitations has meant completely changingsmelting technology, including installing a newfurnace, collecting the various gas streams, andtreating them, first in an electrostatic precipita-tor to remove the particulate, and then in an acidplant to convert the sulfur dioxide to sulfuric acid.The acid plant adds significantly to operating
costs. The sulfuric acid may be salable and pro-vide a byproduct credit, but at most operationsit is a red ink item. While the furnace types thatare amenable to sulfur dioxide control are moreefficient than the old reverberatory furnaces, thegain in efficiency is offset by the capital andoperating costs of control. One copper companyestimates the capital cost of modifying its smelterfor pollution control at $154 million, with a netgain of perhaps 1 cent/lb lower operating costs.
The Clean Water Act
The Clean Water Act establishes water qualitystandards that focus on the uses of the waters in-volved, including public water supplies, fish andwildlife, recreation, and agriculture. The stand-ards generally are achieved through effluent limi-tations that restrict the quantities, rates, and con-centrations of chemical, physical, biological, andother types of discharges from individual sources.In general, the Act requires all categories ofsources (including copper mines, mills, smelters,and refineries) to apply the best practicable con-trol technology currently available in order tomeet the effluent limitations.
Effluent limitations and water quality standardsare implemented through State certification pro-grams and through the National Pollutant Dis-charge Elimination System (NPDES). All pointsources must obtain State certification that theiroperations will not violate any effluent limitations,water quality standards, or new source perform-ance standards. They also must obtain a NPDESpermit, which requires a demonstration that thedischarge will meet all applicable water qualityrequirements. NPDES permits are issued underEPA-approved State programs.
Effluent limitations for copper mines, mills, andleach operations cover discharges of copper,zinc, lead, and cadmium, as well as total sus-pended solids and pH. Arsenic and nickel are notspecifically mentioned in the standards becausethey are adequately controlled by the removalof other metals found in the discharges. Leach-ing operations generally are expected to achievezero discharge unless the annual precipitation ex-ceeds annual evaporation (rare in the arid andsemi-arid copper-producing areas of the West-

239
ern United States). Guidelines are being devel-oped for effluents discharged from primary cop-per smelters, copper refineries, and acid plants.These limitations aim to control the amount ofarsenic, cadmium, copper, lead, zinc, and nickelin effluents; the pH of the discharge; and the con-centration of total suspended solids.
Safe Drinking Water Act
Congress enacted the Safe Drinking Water Actin 1974 to ensure that water from public drink-ing supplies is healthful. so Primary standards, ormaximum contaminant levels (MCLs), are setbased on the contaminant concentrations atwhich no known or anticipated adverse effectson human health occur, modified by the bestavailable treatment technology (considering cost).Secondary standards set goals for contaminantsthat primarily affect the aesthetic qualities ofdrinking water.
The Safe Drinking Water Act also protects solesource aquifers, or those aquifers that supply 50percent or more of the drinking water for an area,from contamination due to projects above theaquifer. It requires States to establish “well headprotection areas” around public wells to preventpollutants from entering underground supplies.EPA has designated the groundwater systems ofthe Upper Santa Cruz Basin and the Avra-AltarBasin of copper-producing Pima, Pinal, and SantaCruz counties in Arizona as a sole source aquifer.51
Resource Conservation and Recovery Act
The EPA regulates hazardous and other solidwastes under the Resource Conservation and Re-covery Act (RCRA). Subtitle C of RCRA establishesregulations for the generation, transportation,treatment, storage, and disposal of materials iden-tified by EPA as hazardous. Subtitle D providesFederal guidelines for EPA-approved State or Re-gional solid waste plans. These address the reg-ulation of landfills, dumps, and ponds handlingnon-hazardous solid and liquid wastes. Box 8-Cin chapter 8 discusses the EPA decision that solid
W’ ‘Public” supplles are those drinking water systems serving 25or more people, or 15 serilce connections.
‘1 Donald V. Fellclano, “Sole Source Aquifers and Related Con-grwslonal Di$trlcts, ” Congressional Research Ser\lce, March 1984.
wastes from the mining and beneficiation of cop-per ores should be regulated under Subtitle D ofRCRA as non-hazardous solid waste. The ration-ale for this decision was that the large volumesof mine waste would be very difficuIt to regulateunder rules that had been designed to managemuch smaller amounts of hazardous industrialand municipal waste. EPA also reasoned that Sub-title C does not allow considerations of environ-mental necessity, technological feasibility, andeconomic practicality, which are important giventhe magnitude of mine waste, The cost of minewaste management under Subtitle C of RCRAwould result in closures at domestic mines andmills with very large amounts of waste material.
Comprehensive Environmental Response,Compensation and Liability Act(Superfund)
Superfund allows the EPA to respond to actualor threatened leaks from inactive hazardouswaste treatment, storage, and disposal faciIities,and to notify the public of such releases. It alsoprovides the authority and framework for cleanupof orphaned hazardous waste sites. Althoughmining wastes are exempt from RCRA Subtitle Cregulation, EPA has made it clear that such ma-terials are not exempt from Superfund. The EPA’spolicy on the continuing availability of the min-ing waste exclusion for inactive or closed facil-ities will affect the extent to which Superfund lia-bilities and obligations may arise from the closure
Photo credit’ Vickie Basinger Boesch
The Douglas, Arizona smelter, which was built in 1904,closed permanently in 1987 because it would have been
too costly to rebuild to bring into compliancewith air quality standards.

240
of a facility .52 Therefore, when considering clo-sure, the potential application of immediate orfuture hazardous waste regulatory scrutiny mustbe evaluated.
Worker Health and Safety
Mining activities come under the aegis of theFederal Mine Safety and Health Act of 1977,which regulates on the theory that a safe mineis a productive mine. The Act sets mandatorystandards and requires training for new employ-ees plus annual refresher training for all mineworkers. The Occupational Safety and HealthAct, which covers mills, smelters, and refineries,is similar.
Other Federal Legislation
In addition to the specific requirements of theFederal and State laws discussed above, a wide
‘*Lester Sotsky, “Closing of a Facility–Legal Concerns, ” paperpresented at American Mining Congress, Annual Mining Conven-tion, San Francisco, CA, 1985.
range of other laws affect the operations of thedomestic copper industry. These are listed in ta-ble 10-3. They fall into two main categories: lawsthat regulate mining activities on public lands,and laws that withdraw public lands from min-ing. A third group comes into play only when spe-cial circumstances arise, such as finding archaeo-logical relics on a mine site, or having protectedspecies located on or near a facility.
Effects of Environmental Regulationon Competitiveness
In general, the more developed a country is,the more detailed and comprehensive are itsenvironmental controls. In developing countries,any environmental regulation usually is the re-sult of negotiated agreement between the hostcountry and the would-be investor. Increasingly,mining agreements now include various provi-sions regarding environmental protection. Al-though there seems to be a trend toward morestringent environmental controls in LDCs, their
Table 10-3.—Other Federal Legislation Affecting Copper Operations
Public lands Withdrawals OtherAct of September 28, 1976: Provides Wilderness Act of 1964: Provides for Antiquities Act of 1906: Regulatesfor the regulation of exploration andmining within, and repeals theapplication of mining laws to, theNational Park SystemForest and Rangeland ResourcesPlanning Act of 1974: Provides for acomprehensive system of land andresource management planning forNational Forest System landsMultiple Use-Sustained Yield Act of1960: Requires management ofNational Forests under principles ofmultiple use so as to produce asustained yield of products andservicesNational Forests Management Act of1976: Provides for a comprehensivesystem of land and resourcemanagement planning for NationalForest System landsFederal Land Policy and ManagementAct of 1976: Provides forcomprehensive, multidisciplinary landuse plans for Bureau of LandManagement lands, including multipleuse of lands and resources andprotection of areas of criticalenvironmental concernSOURCE: Office of Technology Assessment, 1988.
establishment of wilderness reserves;requires preservation of wildernessareas in an unimpaired condition
Wild and Scenic Rivers Act: Providesfor preservation of certain rivers orportions thereof in their natural state
National Trails System Act: Providesfor establishment and protection oftrails
Endangered Species Act of 1973:Protects endangered and threatenedspecies and critical habitats affectedby Federal actions
antiquities excavation and collection,including fossil remains
Archaeological and HistoricalPreservation Act of 1974: Provides forrecovery of data from areas to beaffected by Federal actions
Bald Eagle Protection Act of 1969:Protects bald and golden eagles
241
impact on mining is considerably less than indeveloped countries such as the United States.53
With the exception of air quality control, fewdata are available on the costs of meeting all envi-ronmental and health and safety requirements inthe United States. Even fewer data are availableon the extent to which foreign operations pro-tect public and worker health and safety or thecosts of doing so.
Such regulation in the United States has broughtenormous—but unquantifiable—benefits, fromfewer fatal mining accidents, to fewer prema-ture deaths due to air pollution, to cleaner lakesand streams. The costs to the U.S. industry alsohave been large, with substantial negative im-pacts on competitiveness and capacity.
In 1970, when the Clean Air Act first imposedemission limitations on smelters, EPA estimatedthe total cost of compliance in the entire non-ferrous industry at $45 million. This grossly un-derestimated the capital cost of acid plants. Be-cause technological means of control were notyet mandatory, most smelters used supplemen-tal and intermittent SO2 controls54 instead, whichavoided the large capital costs but reduced pro-duction. When technological controls were im-posed in 1977, EPA estimated that, if all smelterswere assumed to progress toward full complianceby 1988, the total capital cost would be $1.9 bil-lion for the period 1974-87, with total operatingcosts of $1.1 billion (1974 dollars). If, on the otherhand, 3 smelters (Douglas, McGill, and Tacoma)were assumed to close in 1983, the EPA estimatesof total capital and operating costs for 1974-87declined slightly to $1.7 billion and $1.05 billion,respectively (1974 dollars). 55
In reality, the primary copper industry had cap-ital investments totalling $2.1 billion for air pol-
53MacDonnell, supra note 7.
54 Supplemental control systems use very tall stacks to dispersepollutants, thus diluting their ambient concentration. Intermittentcontrol consists of monitoring the ambient weather conditions toidentify when wind patterns and temperature inversions could trapthe pollutants near the source instead of dispersing the plume. Un-der these conditions, production is cut back to the point neces-sary to reduce pollutant emissions to an acceptable ambient con-centration.
55Arthur D. Little, Inc., Economic Impact of Environmental Reg-ulations on the United States Copper Industry (Washington, DC:U.S. Environmental Protection Agency, January 1978).
Iution control between 1970 and 1981 (in 1981dollars), with total annual costs of $3.1 billionover the same period. Estimated capital costs for1981-1990 are $387 million, with total annualcosts for that decade of $3.64 billion (also 1981dollars). 56 Eight copper smelters closed perma-nently from 1979-86, some because of age orcutbacks in domestic mine production, butsome because the cost of installing a new fur-nace and adding an acid plant was too great.Additional investments have been made since,and the remaining 8 smelters are in compliancewith the Clean Air Act. Present levels of controlentail capital and operating costs of between 10and 15 cents per pound of copper. 57
In comparison, copper smelters in Canada,Chile, Mexico, Peru, Zaire, and Zambia—amongour major foreign competitors—are not facedwith similar environmental regulations. If smelt-ers in these countries are controlled at all, it isonly to the extent that sulfuric acid is needed forleaching. Thus these countries achieve from O toaround 15 percent capture of the input sulfur,or about one-fifth of the present level of U.S. con-trol. Japanese smelters achieve 95 percent con-trol as part of government policy to subsidize sul-furic acid production to supply the Japanesechemical industry. 58 Information regarding thecosts of acid production in these countries is notavailable. 59 Future capital investments in Chile,Mexico, Peru, Zaire, Zambia may be funded inpart by the World Bank (see ch. 3). The WorldBank requires environmental controls as a con-dition for financing, but the standards are lessstringent than those in the Clean Air Act. Go
Costs also were incurred by the domestic in-dustry because of changes in the emission limi-tations and allowable means of control, and thedeadlines for meeting them. Several smelters in-stalled technologies that seemed promising at thetime, but later failed either in producing copper
56Mac Donnell, supra note 7.57Everest ConsuIting, Air Pollution Requirements for Copper
Smelters in the United States Compared to Chile, Peru, Mexico,Zaire and Zambia, 1985.
58CRU Copper Stud\ es, supra note 4; see discussion of trade inch. 4.
59MacDonnell, supra note 7.60 Everest ConsuIting, supra note 57.
242
or in controlling emissions (e. g., the Hobokenconverter at Inspiration Consolidated CopperCompany, and the Arbiter process at Anaconda’sButte smelter). Without major technological ad-vances, further environmental regulation (e.g.,the suggested 1-hour sulfur dioxide standard ormine waste management under Subtitle C ofRCRA) could bring further reductions in domes-tic mining and smelting capacity.
Given the health and safety implications of re-ducing the number of environmental regulatoryrequirements in the United States, that is an un-likely option. However, introduction of similarrequirements in foreign copper-producing coun-tries could “level the playing field” and reducethe impact of domestic regulation on competi-tiveness. It also would improve the quality of theenvironment in those countries. While theUnited States government has no direct controlover foreign environmental regulation, we canhave indirect influence through trade andfinancing, as well as treaties.
For example, U.S. participation in internationalfinancing of foreign copper projects (through theWorld Bank and its affiliate banks) could be usedto apply pressure for environmental controls.One example would be to provide incentivesthrough variable interest rates tied to the degreeof control. Tariffs on imported copper also couldbe tied to the degree of control in the countryof origin, although at present there are too fewdata to make this workable.
Treaties related to border issues also can influ-ence foreign control. The difference in level ofcontrol is one issue in the U.S.-Canada Free TradeAgreement. The United States and Mexico signedan agreement January 29, 1987, to control air pol-lution caused by copper smelters along their com-mon border. Under the agreement, Mexico guar-anteed that, by June 1988, SO2 emissions at theNacozari smelter will not exceed 0.065 percentby volume during any 6-hour period. This is iden-tical to the U.S. standard for new sources. In theinterim, ambient SO2 concentration levels will notexceed 0.13 parts per million over a 24 hourperiod (the U.S. standard is 0.14 ppm).61
Research and Development
Research and development could result inprocess and product technologies that wouldsignificantly improve the competitive positionof the domestic copper industry. Technologicalinnovations developed and implemented withinthe last 10 years helped the industry reduce theircosts of production and increase productivity.Additional R&D, especially in areas where theUnited States is at a competitive disadvantage orhas unique resource endowments, could providefurther boosts to competitiveness. For example,domestic mines haul larger amounts of oregreater distances, making improvements inhaulage productivity especially advantageous inthe United States. Similarly, in situ solution min-ing would enable U.S. companies to exploit largeoxide ore resources without having to haul theore. This section reviews Federal R&D fundingmechanisms; private initiatives are discussedbelow.
There is no comprehensive Federal policytoward R&D. Legislation intended to further spe-cific policy goals may authorize expenditures forR&D (although actual appropriations may fallshort of the authorization). For example, the Na-tional Materials and Minerals Policy, Researchand Development Act of 198062 was intended toprovide a basic coordinating framework for ex-ecutive branch materials policy decisions. TheAct encompasses all materials related to indus-trial, military, and essential civilian needs. It em-phasizes, however, strategic materials for whichthe United States is heavily import-dependent butcould augment supplies through substitution,recycling, and conservation. The Act also empha-sizes the importance of government support forR&D in addressing materials problems.
The Act required the President to formulate amaterials and minerals program plan. PresidentReagan submitted this plan to Congress in April1982. His report focused primarily on mineralsavailability issues associated with Federal landsand on management of the stockpile; it placedlittle emphasis on R&D. The plan assigned respon-sibility for coordination of national materials pol-icy to the Cabinet Council on Natural Resources
61 “U. S., Mexico Agree to Control Pollution from Copper SmeltersNear Common Border, ” Environment Reporter, vol. 17, No. 42,Feb. 13, 1987, p. 1738. ‘2P. L. 96-479.
243
and the Environment. Coordination of R&D notinvolving policy questions was assigned to the In-teragency Committee on Materials (COMAT),under the direction of the White House Officeof Science and Technology Policy.
Although President Reagan’s plan has been crit-icized heavily both in concept and implementa-tion,63 strategic materials R&D funding has faredfairly well. In addition, initiatives have been un-dertaken that were not specifically identified inthe plan, such as creation of a National StrategicMaterials and Minerals Program Advisory Com-mittee within the Department of the interior.b4
R&D funding for minerals and materials alsomay be provided as part of an agency’s overallprogram responsibilities. For copper productionand related technologies, this would include pri-marily R&D sponsored by (and often actually car-ried out by) the Bureau of Mines and GeologicalSurvey, both within the U.S. Department of theInterior (see table 10-4).
The Bureau of Mines conducts basic and ap-plied research on all types of minerals to improveunderstanding of the principles of mining andmineral processing and to reduce associatedhealth hazards. Their R&D budget for FY 89 isexpected to decrease by $10 million to $86 mil-Iion. 65 The proposed decrease was in applied re-search, which the Reagan Administration believesis the responsibility of private industry.66
The Geological Survey undertakes research onthe extent, distribution, and character of mineraland water resources; on geologic processes andprinciples; and on the development and appli-cation of new technologies, including remotesensing, for mapping. Their total R&D budget for
G JSee, e.g., U .S, General Accounting Office, /mp/ementdt;On ofthe IVationd/ M\nera/s and Mater\. ?/s Po/Icy Needs Better Coordi-rratlon and Focus (Washington, DC: U .S, General ,Accou nting Of-t’Ice, Mar, 20, 1984), GAO/RCED-84-63.
mOTA, supra note 40.GJThe total Federal expenditures for R&D in 1986 were $14 bil-
lion, Although the United States spends more on R&D than anyother country, it continues to lag behind some of its competitorsin the share of gross national product devoted to cwlllan R&D. WhileJapan spends nearly 3 percent of Its GNP on R&D, the U.S. shareIS only sllghtly above 2.5 percent. see “R&D SC ore board,” Busi-ness L$’eek, June 22, 1987
GGOffice of Management and Budget, Specia/ Ana/y-$es: Budget
of the LJnited States Government, Fiscal Year 1989 (Washington tDC: U.S. Government Prlntlng OttIce, 1988).
FY 89 is projected to be $224 million, a decreaseof $12 million from FY 88.67
Some Federal (and private) R&D money goesto support research programs at u diversities, in-cluding the State mineral institutes and the Bu-reau of Mines mineral technology centers. Themineral institutes originally were administered bythe Office of Surface Mining; responsibility sub-sequently was transferred to the Bureau of Mines.proposals to abolish the institutes have been in-cluded in almost every budget request since1982. Special legislative initiatives also have pro-vided for research centers, such as the 1 -yeargrant for the new Center for Advanced Studiesin Copper Research and Utilization at the Univer-sity of Arizona, whose mandate focuses primar-ily on copper product applications (such as su-perconductors), but also includes research onprocess technologies (e.g., in situ solutionmining).
Research funding for universities not onlyprovides a valuable source of technological in-novation for the minerals industry, but also sup-ports education and training for the next gen-eration of industry employees. Enrollment inmining and other engineering disciplines histori-cally has been cyclical, and currently is low dueto the poor economic performance of the min-erals industry during the early 1980s. In 1978,3,117 undergraduate students were enrolled i n26 mining engineering programs in the UnitedStates. By 1987, the number of programs haddropped to 19, with additional closings andmergers expected. As a resuIt, significant short-ages of mining engineers are predicted at leastthrough 1992.68 Evidence of Federal support fortruly innovative R&D could salvage some univer-sity programs and attract high quality students.
More specialized research on applications forcopper is funded by the National Bureau ofStandards (e.g., specialty alloys) and the Depart-ment of Energy (for example, materials for trans-mission lines or solar energy systems). The Na-tional Aeronautics and Space Administration alsofunds some research on remote sensing thatcould be applicable to mineral exploration. The
‘71 bid.b8 E, Ieen Ashki(jrt h, “Where Hake All the Graduates Gone, ’
L,4,NDAL4RC, January/February 1988.

244
Table 10-4.– Federal R&D Expenditures Related to Mineral Resources and Production (1,000 current dollars)
Bureau Percent Percent Bureau Percent PercentYear and budget category of Mines of total USGS of total Year and budget category of Mines of total USGS of total
1974, total budget:Geological and mineral resource
surveys and mappingMetallurgical researchMining researcha
1975, total budget,Geological and mineral resource
surveys and mappingMetallurgical researchMining researcha
1976, total budget:Geological and mineral resource
surveys and mappingMetallurgical researchMining researcha
1977, /eta/ budget:Geological and mineral resource
surveys and mappingMetallurgical researchMining researcha
1978, total budget:Geological and mineral resource
surveys and mappingMetallurgical researchMining researcha
1979, total budget:Geological and mineral resource
surveys and mappingMineral resources and technology
1980, total budget”Geological and mineral resource
surveys and mappingMineral resources and technology
1981, total budget:Geological and mineral resource
surveys and mappingMineral resources and technology
1982, total budget:Geological and mineral resource
surveys and mappingMinerals and materials researchMineral institutes
$81,689
15,77939,267
148,820
17,99550,437
158,818
21,74487,279
133,611
22,59333,329
138,200
25,02346,431
148,476
33,680
134,033
29,727
142,319
24,883
150,602
32,0039,244
19%48
1234
1455
1725
1834
22
17
216
---- -- .--- . -. . . ---- -- --$172,324
43,340
254,14676,268
272,836102,203
320,43396,870
375,899112,708
418,519131,640
469,862143,039
516,056160,027
507,846163,706
25%
30
37
30
29
31
30
31
32
1983, total budget:Geological and mineral resource
surveys and mappingMinerals and materials researchMineral institutes
1984, total budget:Geological and mineral resource
surveys and mappingMinerals and materials researchMineral institutes
1985, total budget:Geological and mineral resource
surveys and mappingMinerals and materials researchMineral institutes
1986, total budget:Geological and mineral resource
surveys and mappingMinerals and materials technologyMining technologyMineral institutes
1987, total budget.Geological and mineral resource
surveys and mappingMinerals and materials technologyMining technologya
Mineral institutes
1988, total budget:b
Geological and mineral resourcesurveys and mapping
Health, safety and miningtechnology
Minerals and materials scienceMineral institutes
1989, total budget: b
Geological and mineral resourcesurveys and mapping
Health, safety and miningtechnology
Minerals and materials scienceMineral institutes
$144,568
29,6809,152
136,855
32,7549,350
135,959
31,9447,822
127,711
30,69212,808
7,677
140,412
32,20818,5987,642
146.398
53,167
27,0929,160
126,605
37,735
23,4400
21‘YO6
247
236
2410
6
2313
5
36
196
30
190
$371 ,784
159,096
377,672164,289
416,368169,595
412,306169,356
431,193168,656
447,997176,430
425,253167.767
42%
43
40
41
39
39
39
alncludes research related to environment and health and safety.bAll 1988 and 1989 figures are estimates.SOURCE: Office of Management and Budget, Budget of the United States Government (Washington, DC: US. Government Printing Office, various years)
U.S. Environmental Protection Agency is respon- ever, industry can interpret it broadly with cor-sible for R&D on pollution control technologies. responding high revenue losses.Finally, the Department of Defense conducts re-search on materials for ordnance, weapons sys-tems, etc. Industrial Policy
Federal tax policy also can affect private fund- “industrial policy” was the political philoso-ing for R&D, e.g., by providing tax deductions pher’s bromide of the early 1980s, as “competi-tor credits for R&D expenditures or for demon- tiveness” has become the catchword for the mid-stration projects featuring unproven technology. 80s. Development of a coherent and consistentUnless “R&D” is defined very narrowly, how- Federal policy toward industry, and then toward
245
improving domestic industrial competitiveness,was widely touted as the solution to industrial ills.Such an integrated policy scheme is still absentin the United States.
Instead, current Federal competitiveness pol-icy is to rely primarily on private initiatives andthe market. When the importance of a particu-lar industry (e.g., for national security) or the
extraordinary scope of market changes seems tomerit public intervention, there are few policyinstruments for actively promoting domestic com-petitiveness. Instead, government actions havefocused on trade protection, including OrderlyMarketing Agreements (bilateral agreements torestrict imports into the United States), ad hocagreements, and tariffs.
Protectionist policies insulate American pro-ducers from incentives to adjust to foreign com-petition. They also can distort markets in waysthat require increasing protection. For instance,although Orderly Marketing Agreements usuallyare intended to give American firms time to ad-just to changing market conditions, the restric-tions on imports from one country can encouragenew producers in other places. Moreover, limit-ing the volume of imports can induce U.S. fabri-cators to shift to other materials, and foreign pro-ducers to shift to higher-value goods to preservetheir foreign exchange. 69
Other policies that introduce market distortionsinclude direct or indirect subsidies, and dump-ing (selling exports at prices less than charged indomestic markets, or at less than cost). Policiesof promotion and subsidy pursued by LDCs area particular problem. While they may reduce thecost of goods to domestic consumers, they alsodisadvantage domestic producers. In addition, asdiscussed in chapter 4, the Japanese smelting in-dustry receives direct and indirect subsidies topromote sulfuric acid production. The Canadiansmelters also receive government assistance infinancing pollution control. Of course, domes-tic companies also have obtained direct subsidies(see box 10-A, below).
Although the domestic copper industry sur-vived the economic vagaries of the early 1980s
~[~zy~man ancj Tyson, su pra note ~.
without significant government assistance, theylost a lot of money and capacity in the process.Their ability to survive a similar slump withinthe next 5-10 years could depend on govern-ment support now to actively promote domes-tic competitiveness. One of the keys to continu-ing competitiveness is the ability to innovate,which in turn is dependent on capital formation,or investment in plants and equipment embody-ing new, more efficient technologies; educationand job training programs; and the developmentof new commercial products and processes .70
Thus, policy support for continuing competi-tiveness would have to include both micro- andmacroeconomic policies. The former includesanti-trust, trade, defense, patent, tax, job train-ing and education, environmental protection,and R&D policies. These are considered macro-economic because each policy directly or in-directly affects ability of companies to competewith foreign-based companies in domestic andkey export markets). The second group coversfiscal and monetary policies. Fiscal policy is im-portant because it establishes the level of over-all output, inflation, and employment; and be-cause government borrowing to finance deficitsinfluences interest rates, both for industry itself,and for primary and secondary consumers. 7
1
A consistent and integrated set of governmentpolicies can gradually turn a temporary com-parative disadvantage in capital- or education-intensive commodities into an advantage. Seeni n this light, the growing comparative advantageof Japan72 and the declining share of U.S. pro-ducers result to no small degree from differentnational investment efforts influenced by differ-ent government policies.
Although a well-designed and supportive indus-trial policy is not by itself sufficient to build com-petitiveness in a given economic sector, govern-ment policies may tip the balance. The UnitedStates can expect no more than very limited suc-cess in negotiations with other nations aimed atminimizing the impacts of those countries’ indus-
“JGuenthvr ~upra note 2“ I hld“-’japanew sok ernment IxJIIcles IOL$ ard dekeloprnent (~t the’ l r
\melt I ng I nd u~try are de~( rl hed I n the W( t [on on Trade i n c h 4.
246
trial policies. Better prospects for strengthening ings). Coinage reform has been proposed for sev-the U.S. position would come with the adoption eral years, including increased copper contentof more effective industrial policies of our own. of the penny (which is currently 95 percent zinc—
A third option is to provide direct productmostly imported) and a copper dollar coin. While
support. This might include increased use of do-such measures may be small potatoes in terms
mestic copper in coinage, or mandated use ofof overall copper demand, they are symbolically
domestic copper products in governmental activ-important in demonstrating Congressional sup-
ities (e.g., plumbing and wiring in Federal build-port for domestic products.
INDUSTRY STRATEGIES AFFECTING COMPETITIVENESS
Domestic copper companies undertook anumber of initiatives from 1980-1987 in orderto reduce their costs of production and improvetheir competitive position. These are summa-rized in table 10-5. Aside from direct cost reduc-tions such as those obtained in the labor nego-tiations of 1986, these actions can be groupedin three rough categories—actions that resultedin significant corporate restructuring, those thatrequired capital investment, and those that re-duced production and/or capacity. Two compa-nies also received significant local governmentsupport and renegotiated labor and service con-tracts in order to re-open mines (see box 10-A).
Most companies invested in new technologyfor mines, mills, smelters, and refineries, or ad-ded low-cost SX-EW capacity. For example, auto-mated controls at all stages of copper productionprovide increased operating efficiency and arenow installed at almost all operations. Those com-panies that had not yet modernized their smeltersand/or furnaces did so. In addition, at least oneoperation—Kennecott—underwent major minemodification, including the addition of in-pitcrushing and conveying equipment. PD also con-verted its Morenci mine from rail to truck haulageand plans to install in-pit crushing and conveying.
A few companies actually expanded theiroperations by either purchasing developed cop-per properties, or increasing the capacity of theirexisting mines or processing facilities. CopperRange improved mine and mill efficiency andthereby substantially increased throughput. ForAsarco and PD, expansion was part of a strategyto improve the balance between mining andprocessing capacity. In Asarco’s case, such a strat-
egy was needed because they historically werenot a mining company and wished to acquire asecure supply of feed for their smelters. For PD,a mine acquisition replaced mining capacity shutdown or soon to be depleted. Cyprus also boughtsignificant new capacity, in part to fill out theiroperations after they were spun off by AmocoMinerals, and in part to replace properties thatwere closed during this period.
Other companies cut back production in re-sponse to the decreased demand and increasedimports of the early to mid-1980s. Partial capac-ity utilization is a sub-optimal policy for manymines, however. Full closure may be more ad-vantageous if the closure costs are less than themine’s anticipated operating losses during theperiod of depressed prices. 73
Several firms either sold or spun off all of theircopper operations, and are no longer in the cop-per business in the United States. After purchas-ing Cyprus Mines in 1979, Amoco Minerals spunoff this subsidiary to the shareholders in 1985.Similarly, Newmont Mining spun off 80 percentof Magma Copper (including Pinto Valley) in1986. Newmont still owns shares in foreign cop-per properties. Arco/Anaconda, Cities Service,and Louisiana Land sold or closed permanentlyand wrote off all of their domestic copper oper-ations. 74
TJEvans, supra note 10.zqLouisiana Land sold the Copper Range refinery to Echo Bay,
which plans to sell it to Northern Copper Co. (operating as Cop-per Range) within the next couple of years.

247
. x
x
x
x
.x x
x x x :xXx “ x
. . .
,,
, X x :
. .
,x.,
x
“ x
x
“ x
. xx x x . x X x
x
“ x
x
x
x
“ x “ x
:x
‘ x
“ x x “ x
“ x :Xx
x
. x
:x
‘ x‘ x x x x x x .Xx .x x
.. .,,,..
,... x X x . x x
.,
. . .. . . .. . . .
.. . . . .,.:Xx : : :x. . ,, . ,,
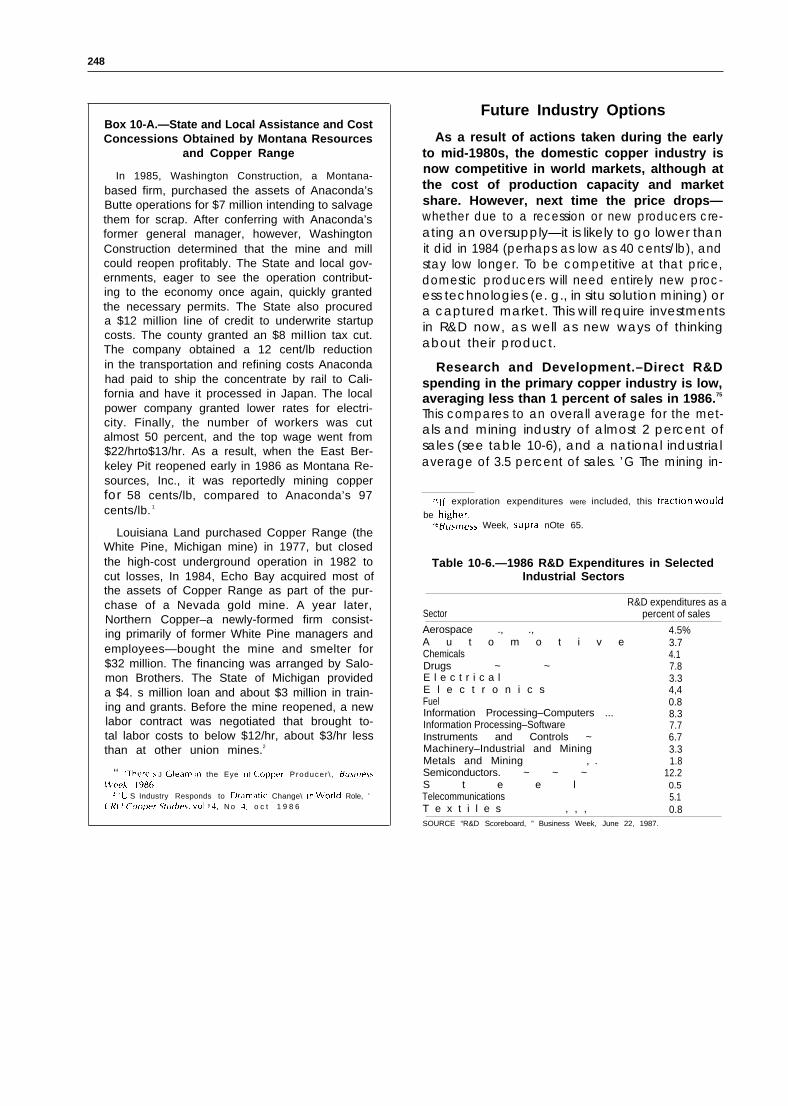
248
Box 10-A.—State and Local Assistance and CostConcessions Obtained by Montana Resources
and Copper Range
In 1985, Washington Construction, a Montana-based firm, purchased the assets of Anaconda’sButte operations for $7 million intending to salvagethem for scrap. After conferring with Anaconda’sformer general manager, however, WashingtonConstruction determined that the mine and millcould reopen profitably. The State and local gov-ernments, eager to see the operation contribut-ing to the economy once again, quickly grantedthe necessary permits. The State also procureda $12 miIlion Iine of credit to underwrite startupcosts. The county granted an $8 miIIion tax cut.The company obtained a 12 cent/lb reductionin the transportation and refining costs Anacondahad paid to ship the concentrate by rail to Cali-fornia and have it processed in Japan. The localpower company granted lower rates for electri-city. Finally, the number of workers was cutalmost 50 percent, and the top wage went from$22/hrto$13/hr. As a result, when the East Ber-keley Pit reopened early in 1986 as Montana Re-sources, Inc., it was reportedly mining copperfor 58 cents/lb, compared to Anaconda’s 97cents/lb. 1
Louisiana Land purchased Copper Range (theWhite Pine, Michigan mine) in 1977, but closedthe high-cost underground operation in 1982 tocut losses, In 1984, Echo Bay acquired most ofthe assets of Copper Range as part of the pur-chase of a Nevada gold mine. A year later,Northern Copper–a newly-formed firm consist-ing primarily of former White Pine managers andemployees—bought the mine and smelter for$32 million. The financing was arranged by Salo-mon Brothers. The State of Michigan provideda $4. s million loan and about $3 million in train-ing and grants. Before the mine reopened, a newlabor contract was negotiated that brought to-tal labor costs to below $12/hr, about $3/hr lessthan at other union mines.2
‘‘ ‘There’s J Gleam In the Eye ot Copper Producer \ , Buslnesjtt’eclx 1986
“‘U S Industry Responds to E)r.]rnatlc Change\ In world Role, ’C-RLI Copper .SIdle$, VOI 14, N o 4, o c t 1 9 8 6
Future Industry Options
As a result of actions taken during the earlyto mid-1980s, the domestic copper industry isnow competitive in world markets, although atthe cost of production capacity and marketshare. However, next time the price drops—whether due to a recession or new producers cre-ating an oversupply—it is likely to go lower thanit did in 1984 (perhaps as low as 40 cents/lb), andstay low longer. To be competitive at that price,domestic producers will need entirely new proc-ess technologies (e. g., in situ solution mining) ora captured market. This will require investmentsin R&D now, as well as new ways of thinkingabout their product.
Research and Development.–Direct R&Dspending in the primary copper industry is low,averaging less than 1 percent of sales in 1986.75
This compares to an overall average for the met-als and mining industry of almost 2 percent ofsales (see table 10-6), and a national industrialaverage of 3.5 percent of sales. ’G The mining in-
7Jl~ exploration expenditures were included, this fraction would
be higher,T6Bu$lness Week, supra nOte 65.
Table 10-6.—1986 R&D Expenditures in SelectedIndustrial Sectors
R&D expenditures as aSector percent of sales
Aerospace ., ., 4.5%A u t o m o t i v e 3.7Chemicals 4.1Drugs ~ ~ 7.8E l e c t r i c a l 3.3E l e c t r o n i c s 4,4Fuel 0.8Information Processing–Computers ... 8.3Information Processing–Software 7.7Instruments and Controls ~ 6.7Machinery–Industrial and Mining 3.3Metals and Mining , . 1.8Semiconductors. ~ ~ ~ 12.2S t e e l 0.5Telecommunications 5.1T e x t i l e s , , , 0.8SOURCE “R&D Scoreboard, ” Business Week, June 22, 1987.
249
dustry considers exploration to be research, andtraditionally has sought better deposits rather thanbetter technology. Members of the copper indus-try argue that most innovations are developed byequipment vendors, yet the Industrial and Min-ing Machinery sector also lags behind the nationalaverage in R&D expenditures. Further, the U.S.mining machinery industry has consistently lostmarket share to foreign competitors throughoutthe 1980s, and currently is operating with sub-stantial excess capacity. 77 If this trend continues,
their R&D expenditures can be expected to de-cline. Further shifts of R&D to overseas also willshift the research’s focus to solving foreignproblems.
One option for increasing the level of R&Don production technology is for the domesticcopper industry to actively pursue cooperativeresearch ventures involving copper companies,vendors, universities, and government agencies.Anti-trust and patent concerns about such ven-tures were addressed in the National Coopera-tive Research Act of 1984 (P. L. 98-462). In thepast, cooperative research has been limited tovendors or the Bureau of Mines borrowing plantspace for small but time-consuming developmentand demonstration projects—often the most ex-pensive aspect of R&D. Within the last year, allthese groups have begun to explore avenues forcooperative research in an organized way. Oneconcern is the continuity of funding from all par-ties once a project is underway.
New Copper Products.-The domestic copperindustry is still faced with competition for mar-kets, both from foreign imports and from othermetals and materials (e.g., aluminum). If theywant to offset further market losses, two basicoptions are available—expand sales in currentmarkets or develop new products and uses forcopper and market them aggressively.
The companies argue that marketing for expan-sion would be futile because they already are sell-
771TA, supra n o t e 8.
ing all the copper they produce. In the samebreath, they complain about idle capacity andlow prices due to excess supplies. Simultaneouslydeveloping new markets and capturing a largershare of them could address both problems.
One key to expanding sales is marketing basedon product differentiation. Superior quality maycommand higher prices in the marketplace, mak-ing production costs less significant.78 Although,copper traditionally has been considered a non-differentiable commodity of uniform quality, atleast one domestic company prides itself on thequality of its final product–copper rod. Thatcompany brags that its final metallurgical testingis good enough to produce a zero rate of rejectsduring wire manufacture. indeed, if a wire cus-tomer complains about breakage or other fail-ures, the company sends consultants to visit thewire plant to trace the source of the problemthere. Yet this company advertises neither the su-perior quality of its product nor its backup serv-ices. product differentiation based on quality islikely to become more important as specialty cop-per alloys and high-technology applications suchas superconducting materials occupy an increas-ing share of the end-use market.
Similarly, copper has properties that make itsuperior to the materials that often are substitutedfor it. When faced with direct market threats (e.g.,aluminum wiring in houses), copper industryassociations have publicized the disadvantagesof the substitute material. Yet neither individualcompanies nor their associations regularly adver-tise copper as part of a consistent strategy of mar-ket development. In contrast, one of copper’smajor competitors—the aluminum industry—regularly advertises both its product and its inno-vative research programs in the trade press.
zBNote also the difference in table 10-6 for R&D expenses for thetwo extractive industries (fuel and metals/mining), which see littleopportunity for product differentiation, \’ersus the remaining man-ufacturing and processing industnes, wh~ch can profit from differen-tiation.

250
Where MurielGets HerMuscleMighty Muriel can lift 1,000 aluminum beveragecan bodies.
No mirrors No invisible wires It’s all done with a seriesof technological breakthroughs that have thinned thewalls of the latest can bodies down to 0038:"
Early beverage cans were steel, 1000 empties weighedover 100 pounds. By 1975, new aluminum alloys had re-duced the load to 43.5 pounds And today?What Muriel is demonstrating is brains, not brawn. It’snow practical to get 1,000 bodies out of 25 pounds ofmetal–because Alcoa scientists developed remarkablytough alloys for rigid container sheet the automatedprocessing to keep thin sheet consistent in propertiesand gauge, and a whole family of new lubricants toadapt these ultra-thin gauges to high-speed processingby canmakers and beverage companies.
And now, for an encore...These same advances plus a few more have madealuminum competitive not only for beverage cans butfor food cans as well. And we’ve been working on newlaminates. composites, and polymers that will figureprominently in the comingage of aseptic and high-barrier food packaging.We’re out to make a material difference,and our progress is accelerating.For a closer look at what’s happeningat Alcoa Laboratories, send forour book, The Material Difference.Write to Dr. Peter R. Bridenbaugh,Vice President–Research &Development,Box One, Alcoa Laboratories,Alcoa Center, PA 15069.
Photo credit: Engineering and Mining Journal
An aluminum company advertisement highlighting product research.

251
Another aspect of product differentiationthrough marketing is based on the advantages ofpurchasing from domestic producers. For exam-ple, orders can be filled more quickly. In the past,fabricators and manufacturers often heId largestockpiles as hedges against price increasesand/or supply shortfalls. In today’s tight economy,this can be disadvantageous to cash flow. Manyconsumers already have changed their purchas-ing policy to smaller stockpiles; using domesticsupplies facilitates this policy. Reliance ondomestically-produced copper also would makereturn and replacement of defective productssimpler.
Finally, a “Buy American” campaign backedup with ads about the problems faced by the do-mestic copper industry could be very effective—especially if aimed toward the effects of importson domestic capacity and employment. Purchas-ing foreign products and components means notonly losses of present domestic employment and
market share, but also the advancement of for-eign manufacturing expertise and thus future mar-ket share. This includes larger volumes overwhich to spread manufacturing, tooling, and R&Dcosts; an accelerated learning curve; and ex-panded opportunities for innovation, and proc-ess development and demonstration. ’g
R&D for developing new products and usesfor copper shares a common problem with re-search on mining and processing technologies—the primary copper industry assumes the con-sumers (including the government) will take theinitiative. Associations representing the primarycopper industry regularly publicize promisingnew applications, but do little direct research. Yetother metals in decline have found cooperativeR&D with major consumers on new productsvery promising. Box 10-B presents an examplefrom the steel industry.
79K. K. Kappmeyer, “Steel/Auto Partnership: A Blueprint for Com-petitive Advantage, ” Materia/s and Society, \ol. 11, No. 2, 1987.
Box IO-B.—Cooperative Steel/Auto Industry Research1
In the early 1980s, the steel industry began to take an active role in dealing with trends related tosubstitution of materials, and foreign capture of markets, for steel parts in the automotive industry. Thisbegan as a defensive move and gradually shifted to aggressive action to create a domestic competitiveadvantage.
The American Iron and Steel Institute (AISI), the trade association for the North American steel indus-try, has an Automotive Applications Committee that sets priorities for, and commissions original researchon, the use of steel in the automotive industry. It also educates the U.S. automotive industry about theeffects of materials substitution on domestic competitiveness (i e., the Japanese auto industry is more com-petitive with steel parts than the domestic industry is with plastics and composites).
Recognizing that the competitive futures of the American steel and auto industries are intertwined,the steel industry began seeking solutions that would help both. An early initiative was seminars for steelindustry executives; the speakers were advanced product engineers in the auto industry. The aim wasto discuss differences between what the steel industry was producing (under 30-year old process and productstandards) compared with what the auto industry needed.
The seminars resulted in three major projects: 1 ) a design manual prepared by a task force of 9 steelcompany representatives, 13 auto company advisors, and a wide variety of outside consultants in, e.g.,welding and computerized structural design; 2) a commissioned study of the relative tooling costs for steeland plastics to determine what influences steel tooling costs and to initiate steps to lower them; and 3)analyses of gauge specifications, materials characteristics and uniformity, and manufacturing costs andtheir relationships to product uniformity, intended to reduce auto manufacturing costs.
In addition, this steel/auto partnership established a University Steel Resource Center at NorthwesternUniversity. The Center aims to bring steel producers and consumers together to work on common techni-cal and institutional issues. AISI provides direct funding; Northwestern obtains State and local support.
) K K Kappmeyer, ‘ ‘Steel Auto P.]rtner\hlp A F3[ueprlnt for Competttl\ e ,4dvantage, ’ tl.~terI.?/s ,Jnd .$OC Iet) , \ 0 1 1 1 n o 2 1 9 8 7
252
The chief advantages of the strategies describedin box 1O-B are knowing the needs of the con-sumers and being able to find ways of servingthose needs with copper rather than alternativematerials. Attempts to ascertain customer needsalso create a positive external image that wouldbe useful in designing marketing and promotionpolicies.
One difference between the steel industry ex-ample and the copper industry is that very ex-acting standards for particular uses of copperhave existed for some time (e.g., electrolytic cop-per, oxygen-free copper; see ch. 6). However,steel industry studies will produce analyses of “asreceived” variability, which could support mar-keting based on product quality. In the copperindustry, similar analyses could examine the ex-tent to which delivered products met establishedstandards (e,g, based on percentage of productreturns for failures during fabrication or manu-facturing), and therefore consumer costs associ-ated with such failures.
A second approach to giving more attentionto demand is modeled on the aluminum indus-try’s strategy. Trends in aluminum originally weresimilar to those in copper. Aluminum productionexpanded into a global business, and the U.S.share of world capacity dropped. Although mostore had always come from overseas mines, theywere controlled by U.S. firms. Then many for-eign mines were nationalized, and a growing per-centage of new capacity is government-controlled.The LME and COMEX began trading aluminumingot, and prices became volatile. Scrap emergedas a growing source of supply. Expanding foreigntrade meant the United States became a net im-porter of ingot and increasingly of semi-fabricatedaluminum products. Profits dropped and somecompanies went out of the aluminum business.Others pursued strategies to ensure their positionsas viable aluminum producers with long-termprofitable growth. These strategies were much thesame as those followed by copper producers(plant modernizations, renegotiated contracts,etc. ) with one major exception—the aluminumindustry expanded into more value added alu-minum products and related businesses (see box1 o-c).
Box IO-C.—Forward Integration in theAluminum lndustry1
To maintain profitability, many of the majoraluminum companies have undertaken strate-gies of forward integration into value addedproducts and/or diversification into non-alumi-num (but mostly materials-related) businesses.Alcoa has done both simultaneously. In thevalue added products area, Alcoa is now pro-ducing aluminum memory disks for the com-puter industry instead of just aluminum blanks.Alcoa hopes to have 25 percent of sales fromnon-aluminum products by 1990, up from 10percent in 1984. They have acquired a defensematerials research company, and are applyingwhat they know about aluminum to other ma-terials to aid in ventures in structural ceramics,chemical separations, and polymer packaging.
Reynolds is continuing to pursue fabricatedand value added aluminum products. They in-troduced a new line of aluminum can sizes plusa new nitrogen technology for packaging. Also,combining aluminum and plastic, Reynolds hasdeveloped a lightweight meal pouch for militaryuse.
Kaiser already was very diverse, including oiland gas ventures, and real estate. They have nowforward-integrated into aluminum memory disks.
Alcan entered the U.S. market by purchasingArco’s aluminum assets. They are developing thenew business through new projects, joint ven-tures, and acquisitions in the areas of aerospace,packaging materials, electronics, and commu-nications and transportation markets.
‘Joseph J. Trlbendls, “The U.S. Aluminum Industry: Into Its Sec-ond Century, ” Materials and Society, vol. 10, no. 2, 1986.
A significant difference between the two indus-tries is that copper historically has experienceddemand growth from electricity and communi-cations. Thus investment strategies focused onproduction rather than consumption. As thenumber of copper producers grew, the compa-nies dis-integrated vertically. The technologiesassociated with fabrication and manufacture ofcopper products became standardized, which ledto numerous independent fabricators.

253
In the aluminum industry, in contrast, earlyhigh prices limited use and cheaper and moreabundant metals captured markets. When thealuminum price did come down with the inven-tion of electrolytic processing, the major compa-nies adopted aggressive market expansion as theircentral policy. They integrated vertically towardproduction of consumer products, created newapplications through R&D, and undertook an in-tensive campaign to publicize and promote theadvantages of their products. This strategy madeit possible to charge lower prices for productscompeting with those manufactured from cop-per, steel, brass, pewter, or glass, and thus cap-ture a significant share of those markets.80
Aluminum’s success highlights the advantagesof integrating operations forward to create de-mand. Yet during the copper industry’s recentrestructuring, significant further dis-integrationoccurred. Although most major U.S. copper
80Jose Luis Mardones et al, “The Copper and Aluminum lndus-tnes: A Review ot’ Structural Changes, ” Resources Po/icy, March1985,
refineries also produce continuously cast rod,most ties between copper mines and wire andbrass mills have been severed. Historically, theseties were valuable to ensure low-cost, secure sup-plies of copper. With the changes in pricing, andthe increased supply of foreign copper and scrap,however, the traditional reasons for strong tiesbetween mining and fabrication have disap-peared. For example, in 1980, PD had 15 millsand plants producing tube, brass and bronze al-loy products, cable wire rod, and other manu-factured products. As part of their asset restruc-turing program, PD has since sold all of theirdownstream fabricating and wire business exceptmagnet wire.
Essentially, the copper producers consider ver-tical integration to be competing with their cus-tomers. Demand growth is no longer rapid, how-ever, and coupling forward integration with thedevelopment of new products and uses could beeffective in helping the domestic copper indus-try retain their market share.