chapter 10: lifestyle characteristics among people with
TRANSCRIPT

10–1
CHAPTER 10
LIFESTYLE CHARACTERISTICS AMONG PEOPLE WITH DIABETES AND PREDIABETESRachel P. Ogilvie, MPH, Azadeh Zabetian, MD, Ali H. Mokdad, PhD, and K.M. Venkat Narayan, MD, MSc, MBA
Rachel P. Ogilvie is a Predoctoral Fellow in Cardiovascular Epidemiology at the University of Minnesota, Minneapolis, MN. Dr. Azadeh Zabetian is a Postdoctoral Research Associate at Yale University, New Haven, CT. Dr. Ali H. Mokdad is a Professor of Global Health at the University of Washington, Seattle, WA. Dr. K.M. Venkat Narayan is the Ruth and O.C. Hubert Chair of Global Health, Professor of Epidemiology and Medicine at Emory University, Atlanta, GA.
Received in final form May 15, 2015.
SUMMARY
This chapter describes lifestyle characteristics of the diabetes population in the United States, including information on dietary habits, physical activity, smoking, and health-seeking behaviors. In general, data indicate that many people with diabetes, like the rest of the U.S. population, are not meeting dietary recommendations, especially for fruits and vegetables, where only about one-quarter are consuming the suggested amount. Fruits, vegetables, and percent calories from macronutrients are measured most frequently, while micronutrients are rarely examined in national studies.
Overall, only one-third of people with diabetes meet physical activity recommendations, and people with diabetes engage in less phys-ical activity than those without diabetes.
According to nationally representative data, people who smoke comprise about one-fifth of the diabetes population compared to a slightly higher proportion of smokers among those without diabetes. There has been a decreasing trend in the proportion of smokers among people with and without diabetes, ranging from a high of 35.6% in the 1970s to a low of 19.9% in the 1990s.
The available published national data on health-seeking behaviors among people with diabetes suggest a greater percentage of people with diabetes have reduced their intake of high fat foods, received advice to quit smoking, visited a physician regularly, and changed their physical activity than those without diabetes, although most people reported engaging in these behaviors regardless of diabetes status. Across diabetes status groups, most people report that they are practicing weight control.
This comprehensive review and compilation of data on lifestyle characteristics among people with diabetes demonstrates that healthy lifestyle behaviors are not at optimal rates in America’s diabetes population. Although a number of lifestyle education programs have been designed and implemented in the country since Diabetes in America’s last publication, more creative ideas are still necessary for sustainable, efficient, and cost-effective national programs.
INTRODUCTION
This chapter presents an overview of the prevalence of lifestyle characteristics of people with diabetes in the United States. Information about these characteristics as risk factors for diabetes can be found in Chapters 11 Risk Factors for Type 1 Diabetes and 13 Risk Factors for Type 2 Diabetes. The chapter describes existing data and presents new findings on various facets of lifestyle characteristics, such as nutrition status, physical activity level, smoking, and health-seeking behaviors. Published studies were selected for inclusion due to their large sample sizes and nationally representative populations. Since the last edition of Diabetes in America, several new studies have been published in this area.
DATA SOURCES AND LIMITATIONSData sources used in this chapter include both original and published analyses of the National Health and Nutrition Examination Surveys (NHANES), a yearly nationally representative survey that uses interviews and physical examinations to assess health status. New analyses for Diabetes
in America, 3rd edition, using NHANES data from 2007–2010 used glycosylated hemoglobin (A1c), fasting plasma glucose, and oral glucose tolerance tests to classify undiagnosed (previously undetected) diabetes two ways: one based only on A1c and fasting plasma glucose (defined by A1c ≥6.5% [≥48 mmol/mol] or fasting plasma
glucose ≥126 mg/dL [≥6.99 mmol/L]), tests which are more likely to be used in the clinical practice community, and another based on adding a glucose toler-ance test (defined by A1c ≥6.5%, fasting plasma glucose ≥126 mg/dL, or 2-hour plasma glucose from an oral glucose toler-ance test ≥200 mg/dL [≥11.10 mmol/L]),
10–2
DIABETES IN AMERICA, 3rd Edition
tests more likely to be used in a research setting by virtue of the added glucose tolerance test. In the actual clinical prac-tice community, tests would be repeated to confirm diagnoses. Prediabetes was defined by A1c 5.7%–<6.5% (39–<48 mmol/mol), fasting plasma glucose 100–<126 mg/dL (5.55–<6.99 mmol/L), or a 2-hour plasma glucose from an oral glucose tolerance test of 140–<200 mg/dL (7.77–<11.10 mmol/L). Data were also examined for those with self-reported diagnosed diabetes (diagnosed before being examined in the NHANES) and those with normal glucose levels.
Other original and published analyses of nationally representative data include the Behavioral Risk Factor Surveillance System (BRFSS), a yearly telephone survey that assesses risk factors for state-level surveil-lance, and the National Health Interview
Survey (NHIS), a survey using personal interviews to monitor disease trends. Other data sources include published analyses of the SEARCH for Diabetes in Youth Study (SEARCH), a multicenter study of youth age <20 years with physician-diagnosed type 1 or type 2 diabetes; the baseline assess-ment of Look AHEAD (Action for Health in Diabetes), a multicenter trial of overweight and obese adults age 45–75 years with confirmed type 2 diabetes; the Strong Heart Study (SHS), a study of cardiovas-cular disease and risk factors in American Indians; and the Diabetes Control and Complications Trial (DCCT), a multicenter trial of people with type 1 diabetes age 13–39 years at baseline.
Despite the richness of the data on life-style characteristics among individuals with diabetes in the United States, there are still many limitations. Considering
the evidence on nutrition characteris-tics among people with diabetes, most dietary markers have not been analyzed consistently or with standardized methods, making comparisons among studies difficult to assess. It is also hard to draw general conclusions about the level of physical activity among people with diabetes, because the definitions and assessment methods have changed frequently over time. Most data on physical activity are self-reported, and only the NHANES objectively measures physical activity. Furthermore, data about health-seeking behaviors are frequently collected but rarely analyzed. In all areas, the estimates are subject to reporting bias due to social desirability. Future data collection strategies should focus on consistent, comparable methods of objec-tive measures of lifestyle characteristics among people with diabetes.
NUTRITION
Data on nutrition among people with diabetes span several categories, including total calories, macronutrients, cholesterol, fiber, alcohol, micronutrients, fruits and vegetables, and other foods. Although smaller studies on these topics exist, most were excluded from discus-sion in this chapter because they are not generalizable to the U.S. population. The population-based studies used a variety of methods to assess nutrition intake, including 24-hour dietary recall (NHANES and SHS), food frequency questionnaires (Look AHEAD and SEARCH), diet history (DCCT), dietary screeners, and self-re-ported intake (BRFSS). When reading the data, it is important to keep in mind that people with diabetes tend to be older and that older people tend to consume fewer calories overall.
TOTAL CALORIES Table 10.1 presents published data on total calorie intake among people with diabetes. In the DCCT, participants in the intensive arm at baseline consumed approximately 2,500 kcal per day (1). NHANES 1988–2004 data demon-strated a significant increase in reported consumption of calorie intake only
among individuals age 45–64 years with self-reported diabetes from 1,771 kcal in 1988–1990 to 2,100 kcal in 2003–2004 (2). In the SHS, men reported consuming an average of 1,595 kcal per day and women reported consuming 1,422 kcal per day (3). The SEARCH study found that adolescents with type 1 diabetes reported consuming more calories than those with type 2 diabetes (4,5); older adolescents reported consuming more calories than younger ones. During the baseline assessment of Look AHEAD in 2001–2004, men reported consuming an average of 2,000 kcal per day, and women reported consuming 1,774 kcal per day (6).
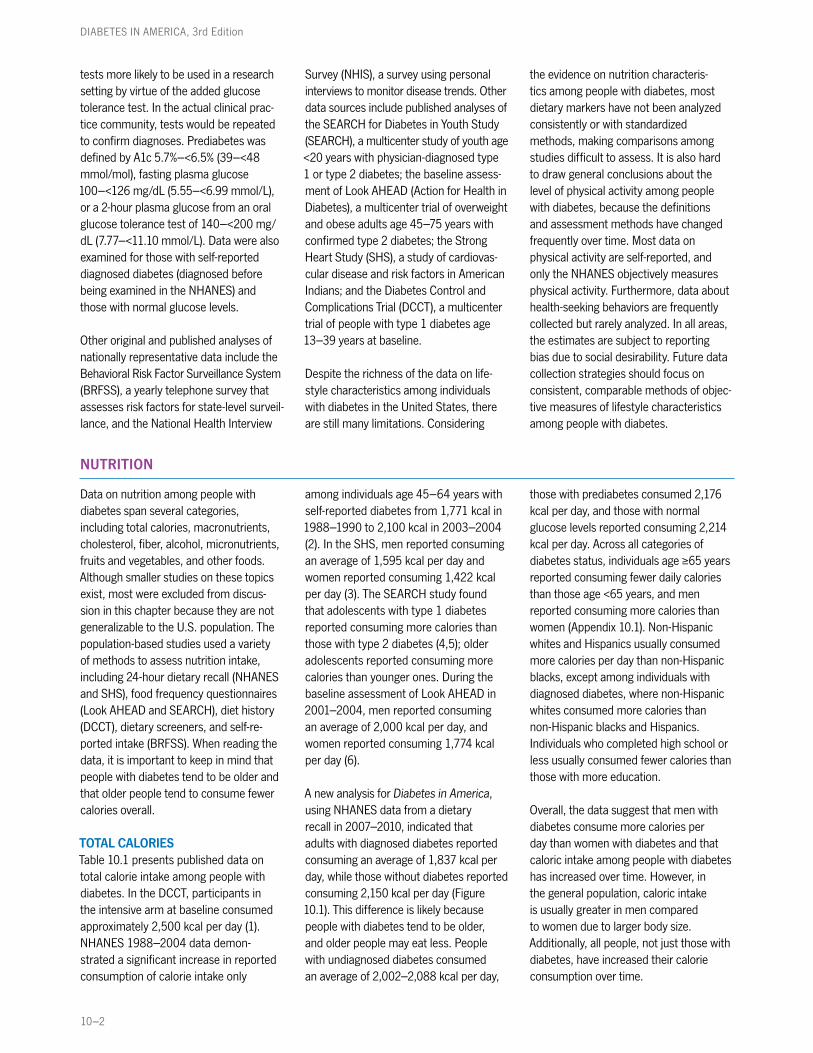
A new analysis for Diabetes in America, using NHANES data from a dietary recall in 2007–2010, indicated that adults with diagnosed diabetes reported consuming an average of 1,837 kcal per day, while those without diabetes reported consuming 2,150 kcal per day (Figure 10.1). This difference is likely because people with diabetes tend to be older, and older people may eat less. People with undiagnosed diabetes consumed an average of 2,002–2,088 kcal per day,
those with prediabetes consumed 2,176 kcal per day, and those with normal glucose levels reported consuming 2,214 kcal per day. Across all categories of diabetes status, individuals age ≥65 years reported consuming fewer daily calories than those age <65 years, and men reported consuming more calories than women (Appendix 10.1). Non-Hispanic whites and Hispanics usually consumed more calories per day than non-Hispanic blacks, except among individuals with diagnosed diabetes, where non-Hispanic whites consumed more calories than non-Hispanic blacks and Hispanics. Individuals who completed high school or less usually consumed fewer calories than those with more education.
Overall, the data suggest that men with diabetes consume more calories per day than women with diabetes and that caloric intake among people with diabetes has increased over time. However, in the general population, caloric intake is usually greater in men compared to women due to larger body size. Additionally, all people, not just those with diabetes, have increased their calorie consumption over time.

Lifestyle Characteristics Among People With Diabetes and Prediabetes
10–3
TABLE 10.1. Published Studies on Caloric Intake Among People With Diabetes
STUDY, YEARS (REF.) POPULATION AND SAMPLE SIZE STUDY METHODOLOGY CALORIES (KCAL/DAY)DCCT, 1983–1989 (1) 532 adults with type 1 diabetes age 13–39 years at baseline who
were enrolled in the intensive treatment groupDiet history Mean: 2,496
Median: 2,325
NHANES, 1988–1990, 1991–1994, 1999–2004 (2)
1,404 adults age 20–74 years with self-reported diabetes 24-hour recall 1988–1990: 1,9411991–1994: 1,9801999–2000: 2,0582001–2002: 1,948 2003–2004: 2,109
NHANES, 1999–2000; SHS, 1997–1999 (3)
1,381 adults age 51–84 years with self-reported diabetes for ≥1 year, no medical conditions affecting intake
24-hour recall NHANES Men: 1,852 Women: 1,384
SHS Men: 1,595 Women: 1,422
SEARCH, 2001 (4) 1,697 youth with physician-diagnosed diabetes age 10–19 years FFQ Type 1 diabetesAge 10–14 years: 1,925Age ≥15 years: 2,056
Type 2 diabetes Age 10–14 years: 1,849Age ≥15 years: 1,964
SEARCH, 2001 (5) Type 1 diabetes diagnosed by physician: 2,176Type 2 diabetes diagnosed by physician: 365All age <20 years
FFQ Type 1 diabetes 50th percentile: 1,752
Type 2 diabetes 50th percentile: 1,617
Look AHEAD, 2001 (6) 5,145 adults age 45–75 years with type 2 diabetes* FFQ Men: 2,000 Women: 1,774
Conversions for glucose values are provided in Diabetes in America Appendix 1 Conversions. DCCT, Diabetes Control and Complications Trial; FFQ, food frequency questionnaire; Look AHEAD, Action for Health in Diabetes; NHANES, National Health and Nutrition Examination Survey; SEARCH, SEARCH for Diabetes in Youth Study; SHS, Strong Heart Study.* Type 2 diabetes was confirmed by medical record, current diabetes treatment, confirmation from a primary health-care provider, fasting glucose of 126 mg/dL or more, symp-
toms of hyperglycemia with nonfasting plasma glucose of 200 mg/dL or more, or 2-hour plasma glucose of 200 mg/dL or more after ingestion of a 75-g oral glucose solution on at least two tests.
SOURCE: References are listed within the table.
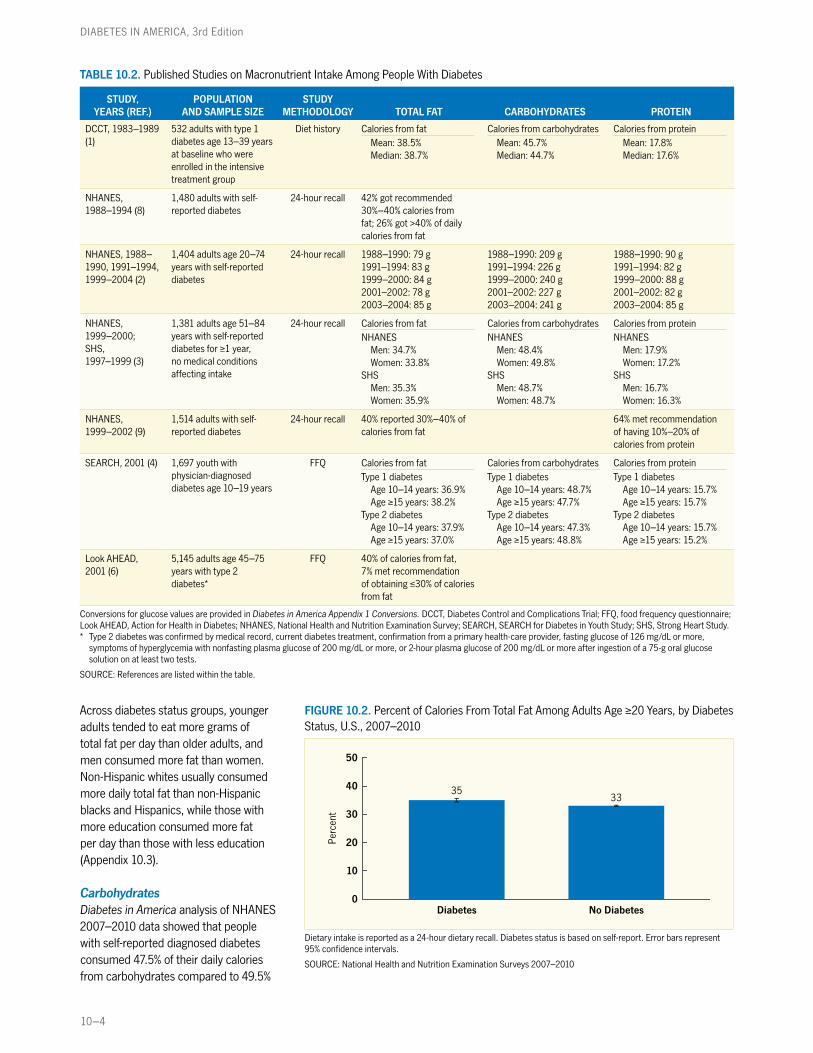
MACRONUTRIENTSSeveral published analyses of nationally representative data have explored the amount of fat, carbohydrate, and protein content that people with diabetes reported consuming using percent of calories from these macronutrients (Table 10.2). As of 2013, the American Diabetes Association (ADA) recommends no specific intake of total fat, carbohydrates, and protein for all people with diabetes (7). In 1988–1994, NHANES data indicated that 26% of the population consumed >40% of their daily calories from fat, while in 1999–2002, 40% of the population with self-reported diabetes consumed 30%–40% of calories from fat (8,9). In community-based studies, consumption patterns were similar across age groups and types of diabetes, with 35%–40% of daily calories coming from fat, 44%–49% from carbohydrates, and 15%–18% from protein (1,3,4,6).
In a trend analysis of nationally represen-tative data, carbohydrate consumption was the only macronutrient that increased over time, from 209 g in 1988–1990 to 241 g in 2003–2004 (2).
Total FatA new Diabetes in America analysis of the NHANES 2007–2010 indicated that people with self-reported diagnosed diabetes obtained 35% of their calories from fat, while people without diabetes obtained 33% of calories from fat (Figure 10.2). Non-Hispanic whites consumed a greater percentage of calories from fat compared to the other racial/ethnic groups,
while people with more education usually consumed a greater percentage than people with less education (Appendix 10.2).
Another new analysis of NHANES 2007–2010 data showed that people with self-reported diagnosed diabetes reported consuming an average of 73.6 g of total fat per day, while people without diabetes consumed 80.4 g per day (Table 10.3).
FIGURE 10.1. Energy Intake Among Adults Age ≥20 Years, by Diabetes Status, U.S., 2007–2010
1,837
Diabetes
2,150
No Diabetes0
500
1,000
1,500
2,000
2,500
Kilo
calo
ries
per
day
Dietary intake is reported as a 24-hour dietary recall. Diabetes status is based on self-report. Error bars represent 95% confidence intervals.
SOURCE: National Health and Nutrition Examination Surveys 2007–2010
10–4
DIABETES IN AMERICA, 3rd Edition
TABLE 10.2. Published Studies on Macronutrient Intake Among People With Diabetes
STUDY, YEARS (REF.)
POPULATION AND SAMPLE SIZE
STUDY METHODOLOGY TOTAL FAT CARBOHYDRATES PROTEIN
DCCT, 1983–1989 (1)
532 adults with type 1 diabetes age 13–39 years at baseline who were enrolled in the intensive treatment group
Diet history Calories from fatMean: 38.5%Median: 38.7%
Calories from carbohydratesMean: 45.7%Median: 44.7%
Calories from proteinMean: 17.8%Median: 17.6%
NHANES, 1988–1994 (8)
1,480 adults with self-reported diabetes
24-hour recall 42% got recommended 30%–40% calories from fat; 26% got >40% of daily calories from fat
NHANES, 1988–1990, 1991–1994, 1999–2004 (2)
1,404 adults age 20–74 years with self-reported diabetes
24-hour recall 1988–1990: 79 g 1991–1994: 83 g 1999–2000: 84 g 2001–2002: 78 g 2003–2004: 85 g
1988–1990: 209 g 1991–1994: 226 g 1999–2000: 240 g 2001–2002: 227 g 2003–2004: 241 g
1988–1990: 90 g 1991–1994: 82 g 1999–2000: 88 g 2001–2002: 82 g 2003–2004: 85 g
NHANES, 1999–2000;SHS, 1997–1999 (3)
1,381 adults age 51–84 years with self-reported diabetes for ≥1 year, no medical conditions affecting intake
24-hour recall Calories from fatNHANES
Men: 34.7%Women: 33.8%
SHSMen: 35.3%Women: 35.9%
Calories from carbohydratesNHANES
Men: 48.4%Women: 49.8%
SHS Men: 48.7% Women: 48.7%
Calories from proteinNHANES
Men: 17.9%Women: 17.2%
SHS Men: 16.7% Women: 16.3%
NHANES, 1999–2002 (9)
1,514 adults with self-reported diabetes
24-hour recall 40% reported 30%–40% of calories from fat
64% met recommendation of having 10%–20% of calories from protein
SEARCH, 2001 (4) 1,697 youth with physician-diagnosed diabetes age 10–19 years
FFQ Calories from fatType 1 diabetes
Age 10–14 years: 36.9%Age ≥15 years: 38.2%
Type 2 diabetesAge 10–14 years: 37.9%Age ≥15 years: 37.0%
Calories from carbohydratesType 1 diabetes
Age 10–14 years: 48.7%Age ≥15 years: 47.7%
Type 2 diabetes Age 10–14 years: 47.3%Age ≥15 years: 48.8%
Calories from proteinType 1 diabetes
Age 10–14 years: 15.7%Age ≥15 years: 15.7%
Type 2 diabetes Age 10–14 years: 15.7%Age ≥15 years: 15.2%
Look AHEAD, 2001 (6)
5,145 adults age 45–75 years with type 2 diabetes*
FFQ 40% of calories from fat, 7% met recommendation of obtaining ≤30% of calories from fat
Conversions for glucose values are provided in Diabetes in America Appendix 1 Conversions. DCCT, Diabetes Control and Complications Trial; FFQ, food frequency questionnaire; Look AHEAD, Action for Health in Diabetes; NHANES, National Health and Nutrition Examination Survey; SEARCH, SEARCH for Diabetes in Youth Study; SHS, Strong Heart Study.* Type 2 diabetes was confirmed by medical record, current diabetes treatment, confirmation from a primary health-care provider, fasting glucose of 126 mg/dL or more,
symptoms of hyperglycemia with nonfasting plasma glucose of 200 mg/dL or more, or 2-hour plasma glucose of 200 mg/dL or more after ingestion of a 75-g oral glucose solution on at least two tests.
SOURCE: References are listed within the table.
FIGURE 10.2. Percent of Calories From Total Fat Among Adults Age ≥20 Years, by Diabetes Status, U.S., 2007–2010
3533
Diabetes No Diabetes0
10
20
30
40
50
Perc
ent
Dietary intake is reported as a 24-hour dietary recall. Diabetes status is based on self-report. Error bars represent 95% confidence intervals.
SOURCE: National Health and Nutrition Examination Surveys 2007–2010
Across diabetes status groups, younger adults tended to eat more grams of total fat per day than older adults, and men consumed more fat than women. Non-Hispanic whites usually consumed more daily total fat than non-Hispanic blacks and Hispanics, while those with more education consumed more fat per day than those with less education (Appendix 10.3).
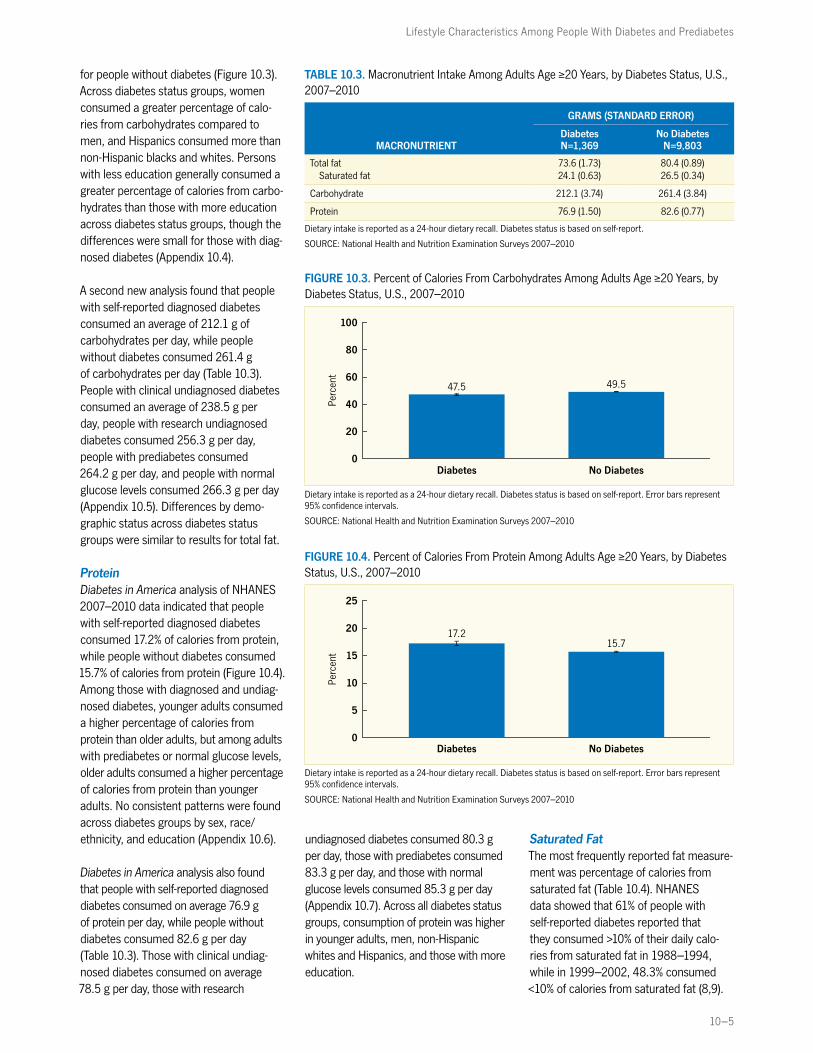
CarbohydratesDiabetes in America analysis of NHANES 2007–2010 data showed that people with self-reported diagnosed diabetes consumed 47.5% of their daily calories from carbohydrates compared to 49.5%
Lifestyle Characteristics Among People With Diabetes and Prediabetes
10–5
for people without diabetes (Figure 10.3). Across diabetes status groups, women consumed a greater percentage of calo-ries from carbohydrates compared to men, and Hispanics consumed more than non-Hispanic blacks and whites. Persons with less education generally consumed a greater percentage of calories from carbo-hydrates than those with more education across diabetes status groups, though the differences were small for those with diag-nosed diabetes (Appendix 10.4).
A second new analysis found that people with self-reported diagnosed diabetes consumed an average of 212.1 g of carbohydrates per day, while people without diabetes consumed 261.4 g of carbohydrates per day (Table 10.3). People with clinical undiagnosed diabetes consumed an average of 238.5 g per day, people with research undiagnosed diabetes consumed 256.3 g per day, people with prediabetes consumed 264.2 g per day, and people with normal glucose levels consumed 266.3 g per day (Appendix 10.5). Differences by demo-graphic status across diabetes status groups were similar to results for total fat.
ProteinDiabetes in America analysis of NHANES 2007–2010 data indicated that people with self-reported diagnosed diabetes consumed 17.2% of calories from protein, while people without diabetes consumed 15.7% of calories from protein (Figure 10.4). Among those with diagnosed and undiag-nosed diabetes, younger adults consumed a higher percentage of calories from protein than older adults, but among adults with prediabetes or normal glucose levels, older adults consumed a higher percentage of calories from protein than younger adults. No consistent patterns were found across diabetes groups by sex, race/ethnicity, and education (Appendix 10.6).
Diabetes in America analysis also found that people with self-reported diagnosed diabetes consumed on average 76.9 g of protein per day, while people without diabetes consumed 82.6 g per day (Table 10.3). Those with clinical undiag-nosed diabetes consumed on average 78.5 g per day, those with research
undiagnosed diabetes consumed 80.3 g per day, those with prediabetes consumed 83.3 g per day, and those with normal glucose levels consumed 85.3 g per day (Appendix 10.7). Across all diabetes status groups, consumption of protein was higher in younger adults, men, non-Hispanic whites and Hispanics, and those with more education.
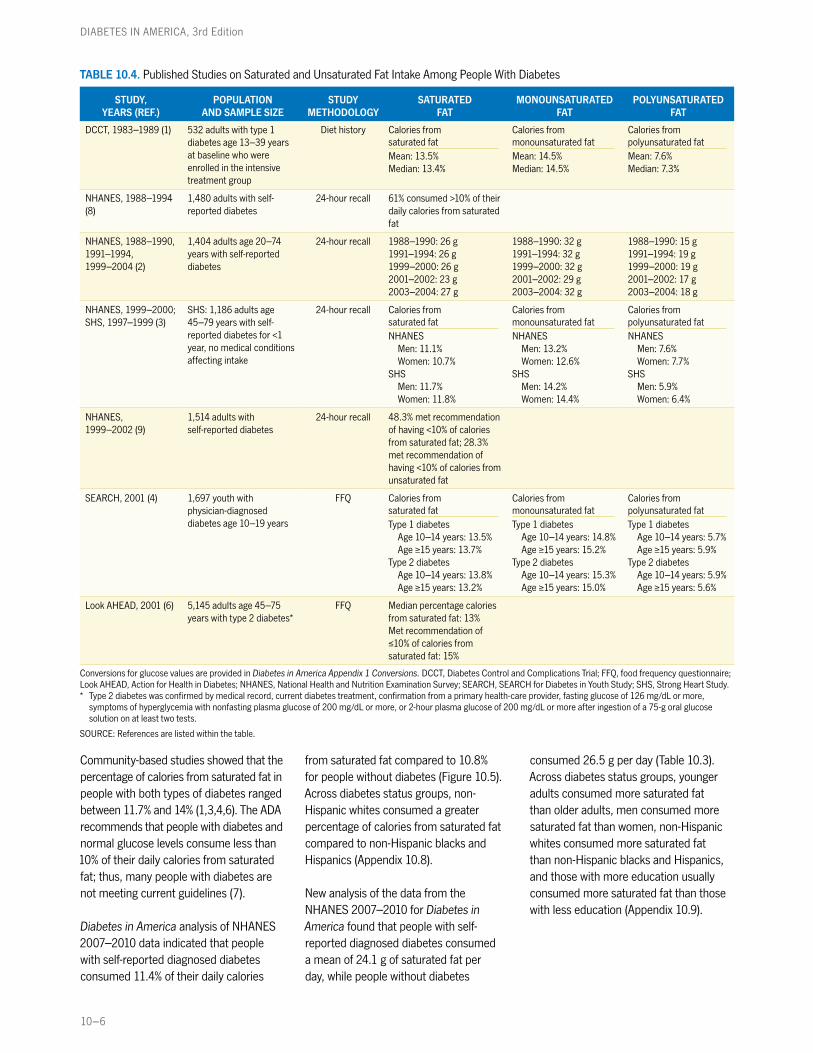
Saturated FatThe most frequently reported fat measure-ment was percentage of calories from saturated fat (Table 10.4). NHANES data showed that 61% of people with self-reported diabetes reported that they consumed >10% of their daily calo-ries from saturated fat in 1988–1994, while in 1999–2002, 48.3% consumed <10% of calories from saturated fat (8,9).
TABLE 10.3. Macronutrient Intake Among Adults Age ≥20 Years, by Diabetes Status, U.S., 2007–2010
MACRONUTRIENT
GRAMS (STANDARD ERROR)
DiabetesN=1,369
No DiabetesN=9,803
Total fat 73.6 (1.73) 80.4 (0.89)Saturated fat 24.1 (0.63) 26.5 (0.34)
Carbohydrate 212.1 (3.74) 261.4 (3.84)
Protein 76.9 (1.50) 82.6 (0.77)
Dietary intake is reported as a 24-hour dietary recall. Diabetes status is based on self-report.
SOURCE: National Health and Nutrition Examination Surveys 2007–2010
FIGURE 10.3. Percent of Calories From Carbohydrates Among Adults Age ≥20 Years, by Diabetes Status, U.S., 2007–2010
49.547.5
Diabetes No Diabetes0
20
40
60
80
100 Pe
rcen
t
Dietary intake is reported as a 24-hour dietary recall. Diabetes status is based on self-report. Error bars represent 95% confidence intervals.
SOURCE: National Health and Nutrition Examination Surveys 2007–2010
FIGURE 10.4. Percent of Calories From Protein Among Adults Age ≥20 Years, by Diabetes Status, U.S., 2007–2010
17.2
Diabetes
15.7
No Diabetes0
5
10
15
20
25
Perc
ent
Dietary intake is reported as a 24-hour dietary recall. Diabetes status is based on self-report. Error bars represent 95% confidence intervals.
SOURCE: National Health and Nutrition Examination Surveys 2007–2010
10–6
DIABETES IN AMERICA, 3rd Edition
TABLE 10.4. Published Studies on Saturated and Unsaturated Fat Intake Among People With Diabetes
STUDY, YEARS (REF.)
POPULATION AND SAMPLE SIZE
STUDY METHODOLOGY
SATURATED FAT
MONOUNSATURATED FAT
POLYUNSATURATED FAT
DCCT, 1983–1989 (1) 532 adults with type 1 diabetes age 13–39 years at baseline who were enrolled in the intensive treatment group
Diet history Calories from saturated fatMean: 13.5%Median: 13.4%
Calories from monounsaturated fatMean: 14.5%Median: 14.5%
Calories from polyunsaturated fatMean: 7.6%Median: 7.3%
NHANES, 1988–1994 (8)
1,480 adults with self-reported diabetes
24-hour recall 61% consumed >10% of their daily calories from saturated fat
NHANES, 1988–1990, 1991–1994, 1999–2004 (2)
1,404 adults age 20–74 years with self-reported diabetes
24-hour recall 1988–1990: 26 g1991–1994: 26 g1999–2000: 26 g2001–2002: 23 g2003–2004: 27 g
1988–1990: 32 g1991–1994: 32 g1999–2000: 32 g2001–2002: 29 g2003–2004: 32 g
1988–1990: 15 g1991–1994: 19 g1999–2000: 19 g2001–2002: 17 g2003–2004: 18 g
NHANES, 1999–2000;SHS, 1997–1999 (3)
SHS: 1,186 adults age 45–79 years with self-reported diabetes for <1 year, no medical conditions affecting intake
24-hour recall Calories from saturated fatNHANES
Men: 11.1%Women: 10.7%
SHSMen: 11.7%Women: 11.8%
Calories from monounsaturated fatNHANES
Men: 13.2%Women: 12.6%
SHSMen: 14.2%Women: 14.4%
Calories from polyunsaturated fatNHANES
Men: 7.6%Women: 7.7%
SHSMen: 5.9%Women: 6.4%
NHANES, 1999–2002 (9)
1,514 adults with self-reported diabetes
24-hour recall 48.3% met recommendation of having <10% of calories from saturated fat; 28.3% met recommendation of having <10% of calories from unsaturated fat
SEARCH, 2001 (4) 1,697 youth with physician-diagnosed diabetes age 10–19 years
FFQ Calories from saturated fatType 1 diabetes
Age 10–14 years: 13.5%Age ≥15 years: 13.7%
Type 2 diabetesAge 10–14 years: 13.8% Age ≥15 years: 13.2%
Calories from monounsaturated fat Type 1 diabetes
Age 10–14 years: 14.8%Age ≥15 years: 15.2%
Type 2 diabetesAge 10–14 years: 15.3% Age ≥15 years: 15.0%
Calories from polyunsaturated fat Type 1 diabetes
Age 10–14 years: 5.7%Age ≥15 years: 5.9%
Type 2 diabetesAge 10–14 years: 5.9% Age ≥15 years: 5.6%
Look AHEAD, 2001 (6) 5,145 adults age 45–75 years with type 2 diabetes*
FFQ Median percentage calories from saturated fat: 13%Met recommendation of ≤10% of calories from saturated fat: 15%
Conversions for glucose values are provided in Diabetes in America Appendix 1 Conversions. DCCT, Diabetes Control and Complications Trial; FFQ, food frequency questionnaire; Look AHEAD, Action for Health in Diabetes; NHANES, National Health and Nutrition Examination Survey; SEARCH, SEARCH for Diabetes in Youth Study; SHS, Strong Heart Study.* Type 2 diabetes was confirmed by medical record, current diabetes treatment, confirmation from a primary health-care provider, fasting glucose of 126 mg/dL or more,
symptoms of hyperglycemia with nonfasting plasma glucose of 200 mg/dL or more, or 2-hour plasma glucose of 200 mg/dL or more after ingestion of a 75-g oral glucose solution on at least two tests.
SOURCE: References are listed within the table.
Community-based studies showed that the percentage of calories from saturated fat in people with both types of diabetes ranged between 11.7% and 14% (1,3,4,6). The ADA recommends that people with diabetes and normal glucose levels consume less than 10% of their daily calories from saturated fat; thus, many people with diabetes are not meeting current guidelines (7).
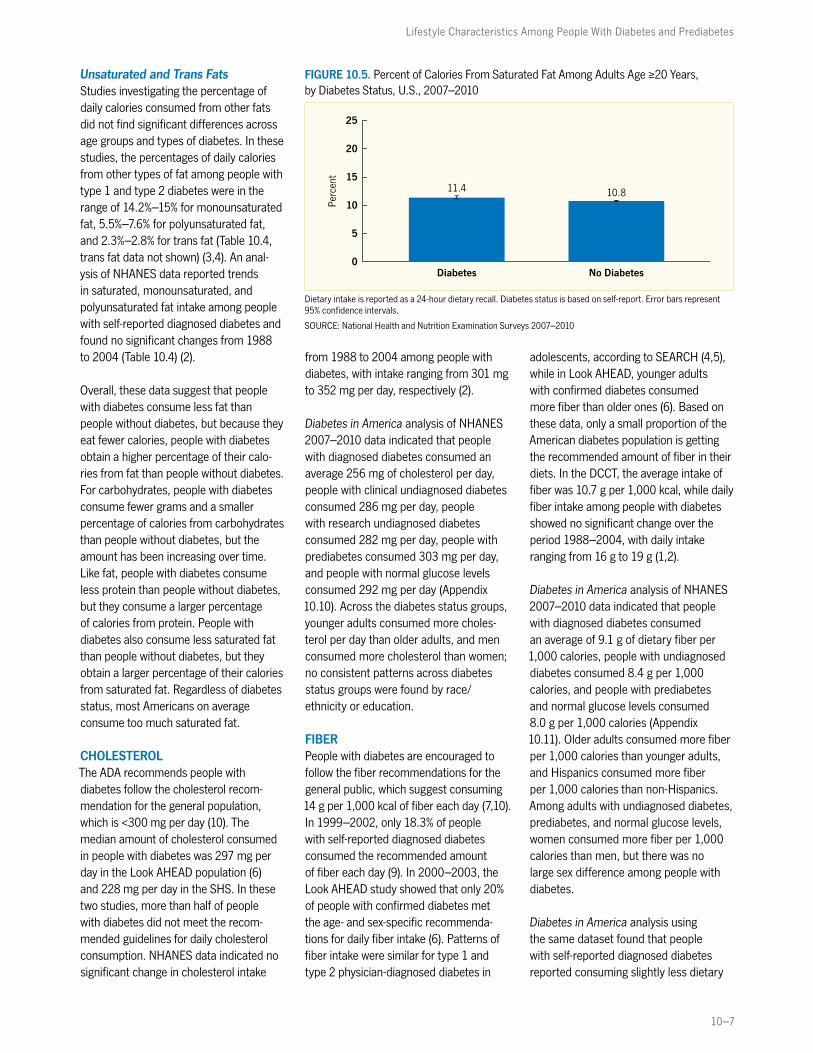
Diabetes in America analysis of NHANES 2007–2010 data indicated that people with self-reported diagnosed diabetes consumed 11.4% of their daily calories
from saturated fat compared to 10.8% for people without diabetes (Figure 10.5). Across diabetes status groups, non- Hispanic whites consumed a greater percentage of calories from saturated fat compared to non-Hispanic blacks and Hispanics (Appendix 10.8).
New analysis of the data from the NHANES 2007–2010 for Diabetes in America found that people with self- reported diagnosed diabetes consumed a mean of 24.1 g of saturated fat per day, while people without diabetes
consumed 26.5 g per day (Table 10.3). Across diabetes status groups, younger adults consumed more saturated fat than older adults, men consumed more saturated fat than women, non-Hispanic whites consumed more saturated fat than non-Hispanic blacks and Hispanics, and those with more education usually consumed more saturated fat than those with less education (Appendix 10.9).
Lifestyle Characteristics Among People With Diabetes and Prediabetes
10–7
Unsaturated and Trans FatsStudies investigating the percentage of daily calories consumed from other fats did not find significant differences across age groups and types of diabetes. In these studies, the percentages of daily calories from other types of fat among people with type 1 and type 2 diabetes were in the range of 14.2%–15% for monounsaturated fat, 5.5%–7.6% for polyunsaturated fat, and 2.3%–2.8% for trans fat (Table 10.4, trans fat data not shown) (3,4). An anal-ysis of NHANES data reported trends in saturated, monounsaturated, and polyunsaturated fat intake among people with self-reported diagnosed diabetes and found no significant changes from 1988 to 2004 (Table 10.4) (2).
Overall, these data suggest that people with diabetes consume less fat than people without diabetes, but because they eat fewer calories, people with diabetes obtain a higher percentage of their calo-ries from fat than people without diabetes. For carbohydrates, people with diabetes consume fewer grams and a smaller percentage of calories from carbohydrates than people without diabetes, but the amount has been increasing over time. Like fat, people with diabetes consume less protein than people without diabetes, but they consume a larger percentage of calories from protein. People with diabetes also consume less saturated fat than people without diabetes, but they obtain a larger percentage of their calories from saturated fat. Regardless of diabetes status, most Americans on average consume too much saturated fat.
CHOLESTEROLThe ADA recommends people with diabetes follow the cholesterol recom-mendation for the general population, which is <300 mg per day (10). The median amount of cholesterol consumed in people with diabetes was 297 mg per day in the Look AHEAD population (6) and 228 mg per day in the SHS. In these two studies, more than half of people with diabetes did not meet the recom-mended guidelines for daily cholesterol consumption. NHANES data indicated no significant change in cholesterol intake
from 1988 to 2004 among people with diabetes, with intake ranging from 301 mg to 352 mg per day, respectively (2).
Diabetes in America analysis of NHANES 2007–2010 data indicated that people with diagnosed diabetes consumed an average 256 mg of cholesterol per day, people with clinical undiagnosed diabetes consumed 286 mg per day, people with research undiagnosed diabetes consumed 282 mg per day, people with prediabetes consumed 303 mg per day, and people with normal glucose levels consumed 292 mg per day (Appendix 10.10). Across the diabetes status groups, younger adults consumed more choles-terol per day than older adults, and men consumed more cholesterol than women; no consistent patterns across diabetes status groups were found by race/ethnicity or education.
FIBERPeople with diabetes are encouraged to follow the fiber recommendations for the general public, which suggest consuming 14 g per 1,000 kcal of fiber each day (7,10). In 1999–2002, only 18.3% of people with self-reported diagnosed diabetes consumed the recommended amount of fiber each day (9). In 2000–2003, the Look AHEAD study showed that only 20% of people with confirmed diabetes met the age- and sex-specific recommenda-tions for daily fiber intake (6). Patterns of fiber intake were similar for type 1 and type 2 physician-diagnosed diabetes in
adolescents, according to SEARCH (4,5), while in Look AHEAD, younger adults with confirmed diabetes consumed more fiber than older ones (6). Based on these data, only a small proportion of the American diabetes population is getting the recommended amount of fiber in their diets. In the DCCT, the average intake of fiber was 10.7 g per 1,000 kcal, while daily fiber intake among people with diabetes showed no significant change over the period 1988–2004, with daily intake ranging from 16 g to 19 g (1,2).
Diabetes in America analysis of NHANES 2007–2010 data indicated that people with diagnosed diabetes consumed an average of 9.1 g of dietary fiber per 1,000 calories, people with undiagnosed diabetes consumed 8.4 g per 1,000 calories, and people with prediabetes and normal glucose levels consumed 8.0 g per 1,000 calories (Appendix 10.11). Older adults consumed more fiber per 1,000 calories than younger adults, and Hispanics consumed more fiber per 1,000 calories than non-Hispanics. Among adults with undiagnosed diabetes, prediabetes, and normal glucose levels, women consumed more fiber per 1,000 calories than men, but there was no large sex difference among people with diabetes.
Diabetes in America analysis using the same dataset found that people with self-reported diagnosed diabetes reported consuming slightly less dietary
FIGURE 10.5. Percent of Calories From Saturated Fat Among Adults Age ≥20 Years, by Diabetes Status, U.S., 2007–2010
11.4 10.8
Diabetes No Diabetes0
5
10
15
20
25
Perc
ent
Dietary intake is reported as a 24-hour dietary recall. Diabetes status is based on self-report. Error bars represent 95% confidence intervals.
SOURCE: National Health and Nutrition Examination Surveys 2007–2010

10–8
DIABETES IN AMERICA, 3rd Edition
fiber (15.7 g/day) than people with no diabetes (16.6 g/day) (Figure 10.6). People with clinical undiagnosed diabetes consumed an average of 15.9 g of dietary
fiber per day, people with research undi-agnosed diabetes consumed 16.7 g per day, people with prediabetes consumed 16.3 g per day, and those with normal
glucose levels consumed 16.7 g per day (Appendix 10.12). This is likely because people with diabetes tend to be older, and older people may consume less food. Individuals age 45–64 years usually consumed more fiber than the older and younger groups, while men consumed more fiber than women. Non-Hispanic whites and Hispanics consumed more fiber than non-Hispanic blacks, and college graduates usually consumed more fiber than those with less education.
Overall, the data suggest that people with diabetes consume similar amounts of fiber as people without diabetes, but on average, most people in the United States are not meeting the recommendations for fiber intake.
FIGURE 10.6. Fiber Intake Among Adults Age ≥20 Years, by Diabetes Status, U.S., 2007–2010
15.7 16.6
0
5
10
15
20
25
Diabetes No Diabetes
Gra
ms
per
day
Dietary intake is reported as a 24-hour dietary recall. Diabetes status is based on self-report. Error bars represent 95% confidence intervals.
SOURCE: National Health and Nutrition Examination Surveys 2007–2010
TABLE 10.5. Published Studies on Alcohol Consumption Among People With Diabetes
STUDY, YEARS (REF.) POPULATION AND SAMPLE SIZE STUDY METHODOLOGY STATISTICS
NHANES, 1988–1990, 1991–1994, 1999–2004 (2)
1,404 adults age 20–74 years with self-reported diabetes
24-hour recall 1988–1990: 8 g1991–1994: 4 g1999–2000: 3 g2001–2002: 8 g2003–2004: 10 g
NHANES, 1988–1994 (13) 218 women with self-reported diabetes, 85 with self-reported gestational diabetes, and 4,325 with no diabetes
Self-report Drinks per dayDiabetes: 0.03Gestational diabetes: 0.12No diabetes: 0.44
NHANES, 1988–1994 (14) 1,024 adults with diabetes Self-report Mean drinks per monthDiabetes
Beer: 2.1Wine: 0.8Hard alcohol: 1.1Total: 4.8
No diabetesBeer: 5.3Wine: 1.6Hard alcohol: 2.0Total: 8.9
NHANES, 1999–2000;SHS, 1997–1999 (3)
1,381 adults age 51–84 years with self-reported diabetes for ≥1 year, no medical conditions affecting intake
24-hour recall Current drinkersNHANES
Men: 49.8%Women: 29.1%
SHSMen: 27.6%Women: 10.5%
BRFSS, 2001 (11) 10,980 adults with self-reported diabetes Self-report Non-drinkers: 70% Moderate drinkers: 28%Heavy drinkers: 2%
Look AHEAD, 2001 (12) 5,145 adults age 45–74 years with type 2 diabetes* Self-report Reported drinking alcohol in the last yearAll: 59.7%Men: 70.6%Women: 52.2%
Conversions for glucose values are provided in Diabetes in America Appendix 1 Conversions. BRFSS, Behavioral Risk Factor Surveillance System; Look AHEAD, Action for Health in Diabetes; NHANES, National Health and Nutrition Examination Survey; SHS, Strong Heart Study.* Type 2 diabetes was confirmed by medical record, current diabetes treatment, confirmation from a primary health-care provider, fasting glucose of 126 mg/dL or more, symp-
toms of hyperglycemia with nonfasting plasma glucose of 200 mg/dL or more, or 2-hour plasma glucose of 200 mg/dL or more after ingestion of a 75-g oral glucose solution on at least two tests.
SOURCE: References are listed within the table.
Lifestyle Characteristics Among People With Diabetes and Prediabetes
10–9
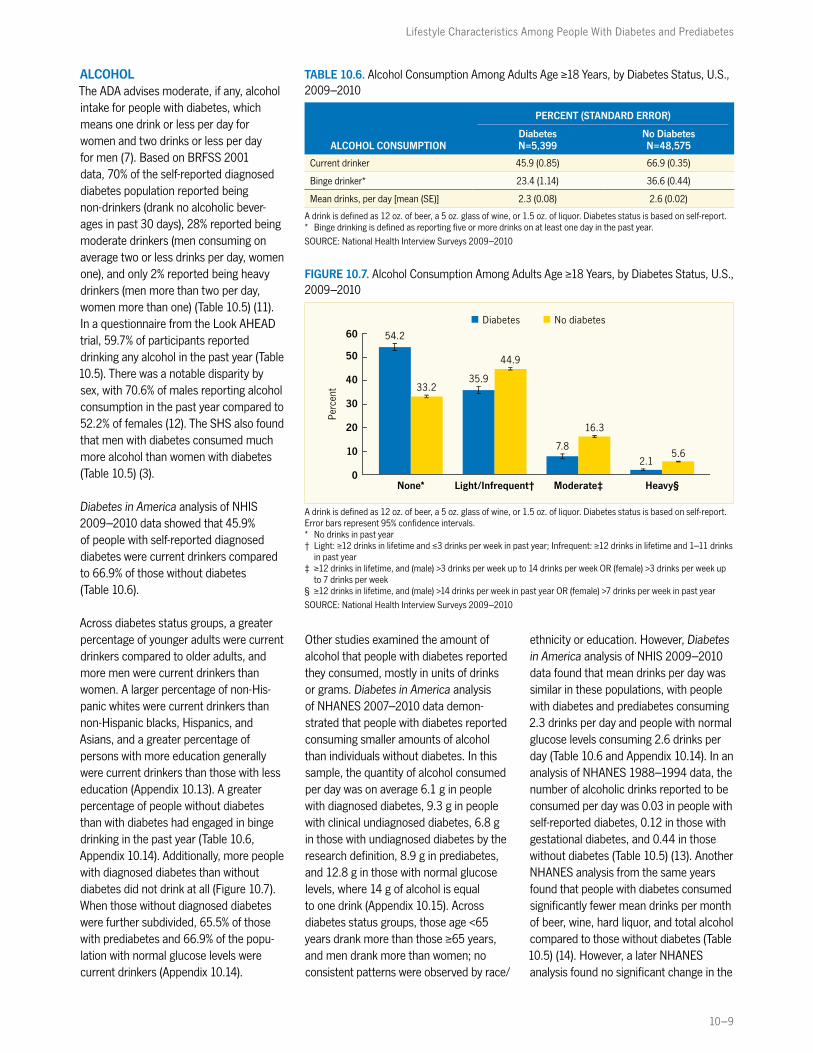
ALCOHOLThe ADA advises moderate, if any, alcohol intake for people with diabetes, which means one drink or less per day for women and two drinks or less per day for men (7). Based on BRFSS 2001 data, 70% of the self-reported diagnosed diabetes population reported being non-drinkers (drank no alcoholic bever-ages in past 30 days), 28% reported being moderate drinkers (men consuming on average two or less drinks per day, women one), and only 2% reported being heavy drinkers (men more than two per day, women more than one) (Table 10.5) (11). In a questionnaire from the Look AHEAD trial, 59.7% of participants reported drinking any alcohol in the past year (Table 10.5). There was a notable disparity by sex, with 70.6% of males reporting alcohol consumption in the past year compared to 52.2% of females (12). The SHS also found that men with diabetes consumed much more alcohol than women with diabetes (Table 10.5) (3).
Diabetes in America analysis of NHIS 2009–2010 data showed that 45.9% of people with self-reported diagnosed diabetes were current drinkers compared to 66.9% of those without diabetes (Table 10.6).
Across diabetes status groups, a greater percentage of younger adults were current drinkers compared to older adults, and more men were current drinkers than women. A larger percentage of non-His-panic whites were current drinkers than non-Hispanic blacks, Hispanics, and Asians, and a greater percentage of persons with more education generally were current drinkers than those with less education (Appendix 10.13). A greater percentage of people without diabetes than with diabetes had engaged in binge drinking in the past year (Table 10.6, Appendix 10.14). Additionally, more people with diagnosed diabetes than without diabetes did not drink at all (Figure 10.7). When those without diagnosed diabetes were further subdivided, 65.5% of those with prediabetes and 66.9% of the popu-lation with normal glucose levels were current drinkers (Appendix 10.14).
Other studies examined the amount of alcohol that people with diabetes reported they consumed, mostly in units of drinks or grams. Diabetes in America analysis of NHANES 2007–2010 data demon-strated that people with diabetes reported consuming smaller amounts of alcohol than individuals without diabetes. In this sample, the quantity of alcohol consumed per day was on average 6.1 g in people with diagnosed diabetes, 9.3 g in people with clinical undiagnosed diabetes, 6.8 g in those with undiagnosed diabetes by the research definition, 8.9 g in prediabetes, and 12.8 g in those with normal glucose levels, where 14 g of alcohol is equal to one drink (Appendix 10.15). Across diabetes status groups, those age <65 years drank more than those ≥65 years, and men drank more than women; no consistent patterns were observed by race/
ethnicity or education. However, Diabetes in America analysis of NHIS 2009–2010 data found that mean drinks per day was similar in these populations, with people with diabetes and prediabetes consuming 2.3 drinks per day and people with normal glucose levels consuming 2.6 drinks per day (Table 10.6 and Appendix 10.14). In an analysis of NHANES 1988–1994 data, the number of alcoholic drinks reported to be consumed per day was 0.03 in people with self-reported diabetes, 0.12 in those with gestational diabetes, and 0.44 in those without diabetes (Table 10.5) (13). Another NHANES analysis from the same years found that people with diabetes consumed significantly fewer mean drinks per month of beer, wine, hard liquor, and total alcohol compared to those without diabetes (Table 10.5) (14). However, a later NHANES analysis found no significant change in the
TABLE 10.6. Alcohol Consumption Among Adults Age ≥18 Years, by Diabetes Status, U.S., 2009–2010
ALCOHOL CONSUMPTION
PERCENT (STANDARD ERROR)
DiabetesN=5,399
No DiabetesN=48,575
Current drinker 45.9 (0.85) 66.9 (0.35)
Binge drinker* 23.4 (1.14) 36.6 (0.44)
Mean drinks, per day [mean (SE)] 2.3 (0.08) 2.6 (0.02)
A drink is defined as 12 oz. of beer, a 5 oz. glass of wine, or 1.5 oz. of liquor. Diabetes status is based on self-report. * Binge drinking is defined as reporting five or more drinks on at least one day in the past year.
SOURCE: National Health Interview Surveys 2009–2010
FIGURE 10.7. Alcohol Consumption Among Adults Age ≥18 Years, by Diabetes Status, U.S., 2009–2010
54.2
35.9
7.8
2.1
33.2
44.9
16.3
5.6
None* Light/Infrequent† Moderate‡ Heavy§0
10
20
30
40
50
60 Diabetes No diabetes
Perc
ent
A drink is defined as 12 oz. of beer, a 5 oz. glass of wine, or 1.5 oz. of liquor. Diabetes status is based on self-report. Error bars represent 95% confidence intervals.* No drinks in past year† Light: ≥12 drinks in lifetime and ≤3 drinks per week in past year; Infrequent: ≥12 drinks in lifetime and 1–11 drinks
in past year‡ ≥12 drinks in lifetime, and (male) >3 drinks per week up to 14 drinks per week OR (female) >3 drinks per week up
to 7 drinks per week§ ≥12 drinks in lifetime, and (male) >14 drinks per week in past year OR (female) >7 drinks per week in past year
SOURCE: National Health Interview Surveys 2009–2010

10–10
DIABETES IN AMERICA, 3rd Edition
amount of alcohol use among people with self-reported diabetes from 1988 to 2004, though values ranged from 3 g to 10 g per day over this period (Table 10.5) (2). In general, the data suggest that people with diabetes consume less alcohol than those without diabetes.
MICRONUTRIENTSSodiumAn analysis of NHANES data found no significant changes in sodium intake in individuals with self-reported diabetes, with average daily intake ranging from 3,717 mg in 1999–2000 to 3,359 mg in 2001–2002 (2). An age-stratified analysis of Look AHEAD data again found that younger participants consumed more sodium than the older members of the population (6), while in the SHS diabetes population, the mean level of sodium intake was 2,744 mg per day (3).
A Diabetes in America analysis of NHANES 2007–2010 data indicated that people with diagnosed diabetes consumed on average 3,328 mg of sodium per day, people with clinical undiagnosed diabetes consumed 3,372 mg per day, people with research undiag-nosed diabetes consumed 3,281 mg per day, people with prediabetes consumed 3,564 mg per day, and people with normal glucose levels consumed 3,680 mg per day (Appendix 10.16). Across diabetes status groups, higher sodium consumption was found among younger adults, men, non-Hispanic whites, and those with more education compared to older adults, women, non-Hispanic blacks and Hispanics, and those with less education, respectively. Since the recom-mended amount of sodium is <2,300 mg per day, most people with diabetes are not meeting this goal (7).
CalciumDepending on age, the recommended amount of daily calcium intake for adults ranges from 1,000 to 1,200 mg (10). SEARCH and Look AHEAD examined calcium intake among populations with physician-diagnosed and confirmed diabetes. In two analyses of SEARCH data, adolescents with type 1 diabetes reported
consuming more calcium than those with type 2 diabetes (4,5). In Look AHEAD, younger participants consumed more calcium than older ones, but only 20% of the total population met the age-specific recom-mendations for daily calcium intake (6).
Diabetes in America analysis of NHANES 2007–2010 data indicated that people with diagnosed diabetes consumed on average 876 mg of calcium per day, people with clinical undiagnosed diabetes consumed 987 mg, people with research undiagnosed diabetes consumed 915 mg, people with prediabetes consumed 958 mg, and people with normal glucose levels consumed 1,011 mg (Appendix 10.17). Across all diabetes status groups, younger adults, men, non-Hispanic whites, and persons with a college education consumed more calcium than older adults, women, non-Hispanic blacks and Hispanics, and those with less education, respectively.
Vitamin DThe recommended amount of vitamin D is 15 μg per day (10). Diabetes in America analysis of NHANES 2007–2010 data found that people with self-reported diagnosed diabetes consumed 4.4 μg of vitamin D per day, people with undiag-nosed diabetes consumed 5.0 μg, and people with prediabetes and normal glucose levels consumed 4.7 μg (Appendix 10.18). Men consumed greater amounts of vitamin D than women, non-Hispanic whites consumed more vitamin D than non-Hispanic blacks and Hispanics, and those with more education usually consumed more vitamin D than those with less education. Across diabetes status groups, no consistent patterns were observed by age.
Other MicronutrientsIn the SEARCH population, 69.3% met vitamin C recommendations, 15.6% met vitamin E recommendations, and 91.1% met iron recommendations, according to ADA guidelines (4).
FRUITS AND VEGETABLESTable 10.7 presents data on fruit and vegetable consumption among people with diabetes. NHANES data indicated
that 38% of people with diabetes met the recommendation of eating five or more servings of fruits and vegetables per day in 1988–1994 (9). Among those with gestational diabetes in the BRFSS 2001–2003, 26% consumed the recom-mended daily servings of fruits and vegetables (15). BRFSS 2005 data found that 26%–28% of people with diabetes consumed five or more servings of fruits and vegetables (16,17).
In SEARCH, the median servings of fruit per week was 6.5 per 1,000 kcal in people with type 1 diabetes and 4.5 per 1,000 kcal in those with type 2 diabetes. For vegetables, the median servings per week consumed by adolescents with type 1 diabetes was 5.5 per 1,000 kcal, while it was 6.5 per 1,000 kcal among those with type 2 diabetes (5). In Look AHEAD, 36% of people with type 2 diabetes met the recommendation of two servings of fruit per day, and the median number of servings per day was two. For vegetables, 38% met the recommendation of three servings per day, which was also the median number of daily servings in this population (6).
Diabetes in America analysis using BRFSS 2007 and 2009 data based on self-report indicated that 24.2% of people with diabetes, 22.1% of people with prediabetes, and 24.3% of people with normal glucose levels were consuming at least five servings of fruits and vegetables per day (Table 10.8). In the same years, the mean servings of fruits and vegetables per day were similar in adults in the three diabetes status groups, ranging from 1.41 to 1.52 for fruits and 2.27 to 2.37 for vegetables (Figure 10.8). In people with and without diabetes, women consumed more fruits and vegetables than men, non-Hispanic Asians consumed more than the other racial groups, and those with some college education and college graduates consumed more than those with less education (Appendix 10.19). Among people without diabetes, a greater percentage of adults age ≥65 years met the fruit and vegetable recommenda-tions compared to younger adults.

Lifestyle Characteristics Among People With Diabetes and Prediabetes
10–11
TABLE 10.7. Published Studies on Consumption of Fruits and Vegetables Among People With Diabetes
STUDY, YEARS (REF.) POPULATION AND SAMPLE SIZE STUDY METHODOLOGY FRUITS AND VEGETABLES
NHANES, 1988–1994 (8) 1,480 adults with self-reported diabetes FFQ Ate ≥5 servings of daily fruits and vegetables: 38%
SEARCH, 2001 (5) Type 1 diabetes diagnosed by physician: 2,176Type 2 diabetes diagnosed by physician: 365All age <20 years
FFQ Median weekly servings of fruit per 1,000 kcalType 1 diabetes: 6.5Type 2 diabetes: 4.5
Median weekly servings of vegetables per 1,000 kcalType 1 diabetes: 5.5 Type 2 diabetes: 6.5
Look AHEAD, 2001 (6) 5,145 adults age 45–75 years with type 2 diabetes*
FFQ Median daily fruit servings: 2Met recommendation: 36%Median daily vegetable servings: 3Met recommendation: 38%
BRFSS, 2001–2003 (15) 4,718 women age 18–44 years with self-reported gestational diabetes
Self-report Ate ≥5 daily servings of fruits and vegetables: 25.6%
BRFSS, 2005 (16) 33,320 adults with self-reported diabetes Self-report Ate ≥5 daily servings of fruits and vegetables: 26%
BRFSS, 2005 (17) 16,428 adults with self-reported diabetes Self-report Ate ≥5 servings of daily fruits and vegetables: 27.9%
Conversions for glucose values are provided in Diabetes in America Appendix 1 Conversions. BRFSS, Behavioral Risk Factor Surveillance System; FFQ, food frequency questionnaire; Look AHEAD, Action for Health in Diabetes; NHANES, National Health and Nutrition Examination Survey; SEARCH, SEARCH for Diabetes in Youth Study; SHS, Strong Heart Study.* Type 2 diabetes was confirmed by medical record, current diabetes treatment, confirmation from a primary health-care provider, fasting glucose of 126 mg/dL or more,
symptoms of hyperglycemia with nonfasting plasma glucose of 200 mg/dL or more, or 2-hour plasma glucose of 200 mg/dL or more after ingestion of a 75-g oral glucose solution on at least two tests.
SOURCE: References are listed within the table.
In contrast, data from the NHANES 2009–2010 dietary screener showed that only 6.0% of people with self-reported diagnosed diabetes and 7.1% of people without diabetes reported consuming at least five servings of fruits and vegetables each day (Appendix 10.20). All diabetes status groups reported consuming similar mean servings of fruits and vegetables. The percentage meeting the recommen-dation ranged from 5.0% to 9.5%, and on average, all groups consumed similar amounts of fruits and vegetables every day (Appendix 10.21).
Overall, a small proportion of people with diabetes are meeting the recommenda-tions for fruit and vegetable intake, just like in the general population.
OTHER FOODSSeveral studies looked at specific foods and food groups consumed in people with diabetes. In the SEARCH study, those with type 1 diabetes reported consuming a median of 6.5 servings of dairy and no weekly servings of soda; for those with type 2 diabetes, 4.5 servings of dairy and 1.5 servings of soda per 1,000 kcal were consumed (5). In the Look AHEAD popu-lation, individuals with diabetes reported eating a median of three servings of grains per day, two servings of dairy, three servings of meat, and two servings
of fats, oils, and sweets (6). An analysis of NHANES 1988–1994 data found that people with diabetes consumed more diet soda but less regular soda than people without diabetes. The same study found
that people with and without diabetes consumed similar amounts of caffeinated coffee, caffeinated tea, and juice, but people with diabetes consumed more milk than those without diabetes (14).
TABLE 10.8. Fruit and Vegetable Servings Per Day Among Adults Age ≥18 Years, by Diabetes Status, U.S., 2007 and 2009
SERVINGS PER DAY
PERCENT (STANDARD ERROR)
DiabetesN=96,508
PrediabetesN=12,260
Normal GlucoseN=711,910
No daily servings 0.2 (0.02) 0.3 (0.07) 0.1 (0.01)
1–<3 39.7 (0.33) 41.1 (0.94) 39.9 (0.13)
3–<5 35.9 (0.32) 36.5 (0.91) 35.7 (0.12)
≥5 24.2 (0.29) 22.1 (0.81) 24.3 (0.11)
Diabetes status and fruit and vegetable consumption are based on self-report.
SOURCE: Behavioral Risk Factor Surveillance System 2007 and 2009
FIGURE 10.8. Mean Fruit and Vegetable Consumption Among Adults Age ≥18 Years, by Diabetes Status, U.S., 2007 and 2009
1.45
2.37
Diabetes
1.41
2.27
Prediabetes
1.52
2.33
Normal Glucose0
0.5
1.0
1.5
2.0
2.5
Mea
n se
rvin
gs p
er d
ay
Fruit Vegetable
Diabetes status and fruit and vegetable consumption are based on self-report. Error bars represent 95% confidence intervals.
SOURCE: Behavioral Risk Factor Surveillance System 2007 and 2009
10–12
DIABETES IN AMERICA, 3rd Edition
One community-based study used a tele-phone survey to examine fast food habits and unplanned eating in adolescents with diabetes. In this population, 48% reported eating fast food four or more times a month, 32% had fast food two or three times a month, and 20% consumed fast food zero or one time in the past month. In the same sample, 76% reported overeating at least once a week, and 69% consumed unplanned snacks at least once
per week. Only 38% reported no daily soda consumption, while 42% reported less than a serving per day versus 20% having more than a serving per day (18).
Diabetes in America analysis of the NHANES 2009–2010 dietary screener showed that on average, all diabetes status groups reported consuming less than one serving of regular soda per day (Appendix 10.22). Across diabetes
status groups, younger adults reported consuming more soda than older adults. Women with self-reported diabetes consumed more soda than men with diabetes, but women with normal glucose levels consumed less soda than men without diabetes. Although there were no consistent patterns by race/ethnicity, those with a college education consumed less soda than those with less education across diabetes groups.
PHYSICAL ACTIVITY
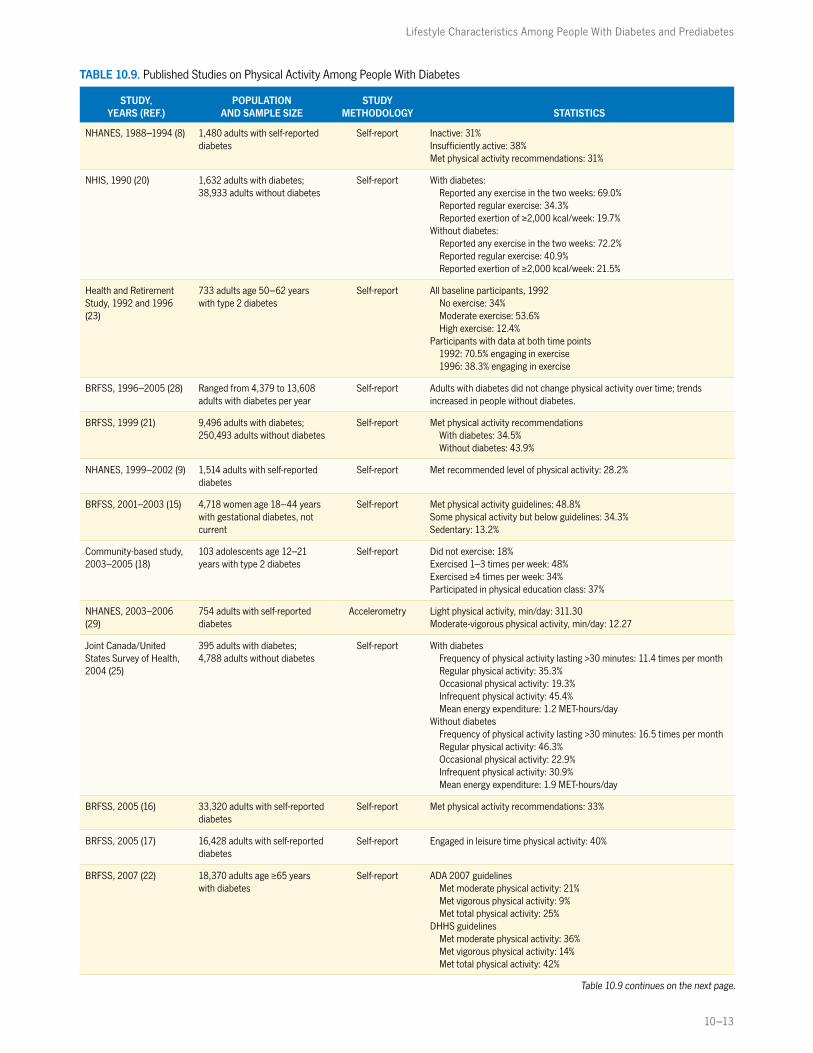
Several nationally representative studies examined self-reported physical activity among people with diabetes (Table 10.9). Although these published studies were based on U.S. represen-tative data, it was difficult to interpret and compare their results because the studies came from different time periods and considered different recommendation guidelines on physical activity. Sources of physical activity data include previously described studies, such as the BRFSS, NHANES, and NHIS. Other studies described in Table 10.9 include the Health and Retirement Study, a longitudinal panel study that surveys adults age >50 years on health, social, and financial issues every 2 years; the Regenstrief Physical Activity Questionnaire, a survey of older adults designed to develop physical activity measures to use in a low- income primary care population; the U.S. portion of the Joint Canada/United States Survey of Health, a telephone survey based on the NHIS; the Study to Help Improve Early Evaluation and Management of Risk Factors Leading to Diabetes (SHIELD), a population-based study that measures health behav-iors, provider recommendations, and intentions to follow recommendations among people with type 2 diabetes; and the Treatment Options for Type 2 Diabetes in Adolescents and Youth (TODAY) study, a multisite randomized trial that evaluates treatments for type 2 diabetes in youth. 2010 ADA recommen-dations state that people with diabetes should engage in at least 150 minutes a week of moderate to vigorous aerobic
exercise at least three days per week and moderate to vigorous resistance training two to three days per week (19).
A nationally representative study from 1990 found that 34.3% of people with diagnosed diabetes reported regular exer-cise in the past 2 weeks, while 40.9% of people without diabetes reported regular exercise (20). Three nationally represen-tative studies in the following decade found similar results, with 28.2%–34.5% of people with diagnosed diabetes meeting the current physical activity recommendations (8,9,21). Data from the 2000s showed that 25%–42% of people with diagnosed diabetes met the recom-mended guidelines for physical activity. Based on ADA and U.S. Department of Health and Human Services guidelines, 21%–36% of people with diabetes met the moderate physical activity guideline, and 9%–14% met the vigorous physical activity guidelines (16,17,22).
Other evidence on physical activity in people with diabetes has come from smaller surveys and community-based studies. These studies are also hetero-geneous in the method of assessment, definitions used, time periods, and the populations surveyed. These data showed that 18%–55% of people with type 2 diabetes engaged in no physical activity, 22.0%–53.6% engaged in moderate level activity, and 12.4%–23.0% in high level activity (Table 10.9) (18,23,24). Published studies from the U.S. portion of the Joint Canada/United States Survey of Health also found that people with diabetes engaged in less regular physical activity
than those without diabetes (Table 10.9) (25). An analysis of SHIELD 2007 survey data looked at sex and race/ethnicity and breakdowns of physical activity among people with diabetes and found that Hispanic men were the most active, while non-Hispanic white women were the least active (26). In addition, the TODAY study found that boys and girls age 10–18 years with type 2 diabetes got 353.1–375.2 minutes of total activity per day, but only 8.2–35.0 minutes of activity per day included moderate to vigorous activity (27).
Nationally representative data from 2001–2003 indicated that 48.8% of women with gestational diabetes met physical activity guidelines, 34.3% got some physical activity but did not meet the guidelines, and 13.2% were sedentary (15).
Only one study has examined trends over time in physical activity among people with diabetes. An analysis of BRFSS 1996–2005 data found that people with self-reported diagnosed diabetes engaged in less physical activity than people without diabetes, and the percentage did not change over the time period. In contrast, the prevalence of physical activity among people without diabetes increased linearly over the study period (28).
Diabetes in America analysis of the NHIS 2009–2010 indicated that 17.4% of people with self-reported diagnosed diabetes engaged in ≥75 minutes per week of vigorous physical activity compared to 33.5% of people without diabetes (Table 10.10). Although a similar percentage of people with and without
Lifestyle Characteristics Among People With Diabetes and Prediabetes
10–13
TABLE 10.9. Published Studies on Physical Activity Among People With Diabetes
STUDY, YEARS (REF.)
POPULATION AND SAMPLE SIZE
STUDY METHODOLOGY STATISTICS
NHANES, 1988–1994 (8) 1,480 adults with self-reported diabetes
Self-report Inactive: 31%Insufficiently active: 38% Met physical activity recommendations: 31%
NHIS, 1990 (20) 1,632 adults with diabetes; 38,933 adults without diabetes
Self-report With diabetes:Reported any exercise in the two weeks: 69.0%Reported regular exercise: 34.3%Reported exertion of ≥2,000 kcal/week: 19.7%
Without diabetes:Reported any exercise in the two weeks: 72.2%Reported regular exercise: 40.9%Reported exertion of ≥2,000 kcal/week: 21.5%
Health and Retirement Study, 1992 and 1996 (23)
733 adults age 50–62 years with type 2 diabetes
Self-report All baseline participants, 1992No exercise: 34%Moderate exercise: 53.6%High exercise: 12.4%
Participants with data at both time points1992: 70.5% engaging in exercise1996: 38.3% engaging in exercise
BRFSS, 1996–2005 (28) Ranged from 4,379 to 13,608 adults with diabetes per year
Self-report Adults with diabetes did not change physical activity over time; trends increased in people without diabetes.
BRFSS, 1999 (21) 9,496 adults with diabetes; 250,493 adults without diabetes
Self-report Met physical activity recommendationsWith diabetes: 34.5%Without diabetes: 43.9%
NHANES, 1999–2002 (9) 1,514 adults with self-reported diabetes
Self-report Met recommended level of physical activity: 28.2%
BRFSS, 2001–2003 (15) 4,718 women age 18–44 years with gestational diabetes, not current
Self-report Met physical activity guidelines: 48.8%Some physical activity but below guidelines: 34.3% Sedentary: 13.2%
Community-based study, 2003–2005 (18)
103 adolescents age 12–21 years with type 2 diabetes
Self-report Did not exercise: 18%Exercised 1–3 times per week: 48%Exercised ≥4 times per week: 34%Participated in physical education class: 37%
NHANES, 2003–2006 (29)
754 adults with self-reported diabetes
Accelerometry Light physical activity, min/day: 311.30Moderate-vigorous physical activity, min/day: 12.27
Joint Canada/United States Survey of Health, 2004 (25)
395 adults with diabetes; 4,788 adults without diabetes
Self-report With diabetesFrequency of physical activity lasting >30 minutes: 11.4 times per monthRegular physical activity: 35.3%Occasional physical activity: 19.3%Infrequent physical activity: 45.4%Mean energy expenditure: 1.2 MET-hours/day
Without diabetesFrequency of physical activity lasting >30 minutes: 16.5 times per monthRegular physical activity: 46.3%Occasional physical activity: 22.9%Infrequent physical activity: 30.9%Mean energy expenditure: 1.9 MET-hours/day
BRFSS, 2005 (16) 33,320 adults with self-reported diabetes
Self-report Met physical activity recommendations: 33%
BRFSS, 2005 (17) 16,428 adults with self-reported diabetes
Self-report Engaged in leisure time physical activity: 40%
BRFSS, 2007 (22) 18,370 adults age ≥65 years with diabetes
Self-report ADA 2007 guidelines Met moderate physical activity: 21%Met vigorous physical activity: 9%Met total physical activity: 25%
DHHS guidelinesMet moderate physical activity: 36%Met vigorous physical activity: 14%Met total physical activity: 42%
Table 10.9 continues on the next page.

10–14
DIABETES IN AMERICA, 3rd Edition
TABLE 10.9. (continued)
STUDY, YEARS (REF.)
POPULATION AND SAMPLE SIZE
STUDY METHODOLOGY STATISTICS
SHIELD, 2007 (26) 3,411 adults with type 2 diabetes
Self-report Non-Hispanic white menHigh physical activity: 17.1%Minimally active: 25.7%Inactive: 57.2%
Non-Hispanic black menHigh physical activity: 13.6% Minimally active: 24.3%Inactive: 62.1%
Hispanic menHigh physical activity: 23.5% Minimally active: 18.5% Inactive: 58.0%
Non-Hispanic white womenHigh physical activity: 10.2%Minimally active: 19.3%Inactive: 70.5%
Non-Hispanic black women High physical activity: 12.4%Minimally active: 19.4%Inactive: 68.2%
Hispanic womenHigh physical activity: 19.4%Minimally active: 17.3%Inactive: 63.3%
TODAY (27) 699 youth age 10–18 years with diagnosed type 2 diabetes
Accelerometry Total activity, min/dayBoys 10–14 years: 373.3 Girls 10–14 years: 375.2Boys 15–18 years: 356.4 Girls 15–18 years: 353.1
Light physical activity, min/dayBoys 10–14 years: 338.3 Girls 10–14 years: 348.6Boys 15–18 years: 330.1 Girls 15–18 years: 344.9
Moderate-vigorous physical activity, min/dayBoys 10–14 years: 35.0 Girls 10–14 years: 26.6Boys 15–18 years: 26.3 Girls 15–18 years: 8.2
Subset of Regenstrief Physical Activity and Health Survey (24)
260 adults age ≥55 years with medical diagnosis of diabetes
Self-report Reported 0 minutes of weekly physical activity: 55%Reported 1–60 minutes/week: 22% Reported >60 minutes/week: 23%
ADA, American Diabetes Association; BRFSS, Behavioral Risk Factor Surveillance System; DHHS, Department of Health and Human Services; MET, Metabolic Equivalent of Task, the ratio of the rate of energy expended during an activity to the rate of energy expended at rest; NHANES, National Health and Nutrition Examination Survey; NHIS, National Health Interview Survey; SHIELD, Study to Help Improve Early Evaluation and Management of Risk Factors Leading to Diabetes; TODAY, Treatment Options for Type 2 Diabetes in Adolescents and Youth study.
SOURCE: References are listed within the table.
TABLE 10.10. Physical Activity Among Adults Age ≥18 Years, by Diabetes Status, U.S., 2009–2010
PHYSICAL ACTIVITY LEVEL
PERCENT (STANDARD ERROR)
DiabetesN=5,099
No DiabetesN=47,782
Vigorous* 17.4 (0.76) 33.5 (0.34)
Moderate† 12.0 (0.62) 12.4 (0.19)
Insufficient 25.7 (0.90) 24.0 (0.29)
None/not active 44.9 (0.92) 30.1 (0.39)
Diabetes status is based on self-report.* ≥75 minutes per week† ≥150 minutes per week; includes combination of moderate and vigorous activity.
SOURCE: National Health Interview Surveys 2009–2010
TABLE 10.11. Physical Activity Among Adults Age ≥20 Years, by Diabetes Status, U.S., 2007–2010
PERCENT (STANDARD ERROR)
DiabetesN=1,480
No DiabetesN=10,641
Meet physical activity standards 36.0 (1.50) 56.6 (0.95)
Less than recommended amount of physical activity 14.5 (1.21) 15.3 (0.41)
No physical activity 49.5 (1.60) 28.1 (0.99)
Physical activity standards are defined as ≥150 minutes of moderate or ≥75 minutes of vigorous leisure-time or work-related physical activity per week; physical activity is self-reported. Diabetes status is based on self-report.
SOURCE: National Health and Nutrition Examination Surveys 2007–2010
diabetes engaged in moderate and insuf-ficient physical activity, 44.9% of people with diabetes were not active, while 30.1% of people without diabetes were not active.
Across diabetes status groups, a greater percentage of younger adults, men, and non-Hispanic whites and Asians met current exercise recommendations compared to older adults, women, and other racial/ethnic groups, respectively; persons with more education were more likely to meet the recommendations than those with less education (Appendix 10.23). Persons with normal glucose levels engaged in more weekly physical activity minutes than those with diabetes or predi-abetes (Appendix 10.24).
NHANES 2007–2010 data also demon-strated disparities in physical activity between people with and without diabetes, where 36.0% of those with self-reported diagnosed diabetes met the physical activity standards compared to 56.6% of those without diabetes (Table 10.11). When the category of

Lifestyle Characteristics Among People With Diabetes and Prediabetes
10–15
those without diabetes was expanded, a smaller percentage of people with clin-ical and research undiagnosed diabetes (38.0%–38.3%) met the physical activity recommendations compared to individ-uals with prediabetes (55.9%) and normal glucose levels (60.9%) (Appendix 10.25). Across diabetes status groups, more young adults met the physical activity recommendations than older adults, more men met the standards than women, and persons with more education met the recommendations more often than those with less education; no consistent patterns were observed by race/ethnicity (Appendix 10.26).
Although most data on physical activity are self-reported, the NHANES 2003–2006 used a physical activity monitor to obtain objective data. A published study found that people with diabetes on average engaged in 311.3 minutes of physical activity per day, but only 12.27 minutes of moderate-vigorous activity per day (29). New data analysis for Diabetes in America showed that individuals with diagnosed diabetes engaged in fewer daily minutes of moderate-vigorous physical activity compared to those with undiag-nosed diabetes, prediabetes, and normal glucose levels (Appendix 10.27). People with diagnosed diabetes also spent more minutes per day being sedentary than the other diabetes groups. Across diabetes status groups, younger people engaged in more minutes of total and moderate- vigorous physical activity than older adults (Appendix 10.28). Men participated in more minutes of moderate-vigorous phys-ical activity but fewer total minutes than women (latter data not shown). Persons with less education engaged in more total activity (data not shown) than the more educated but usually less moderate- vigorous physical activity (latter data in Appendix 10.28).
Data from 2001–2006 were analyzed to determine the number of Metabolic Equivalent of Task (MET) hours that the different diabetes status groups expended each week. A MET is the ratio of the metabolic rate during phys-ical activity to the resting metabolic
rate. Regardless of the way the group with no diabetes was divided, people with diagnosed diabetes, undiagnosed diabetes, and prediabetes engaged in fewer weekly MET-hours of physical activity than individuals with normal glucose levels (Figure 10.9, Appendix 10.29). Across diabetes status groups, men participated in more weekly MET-hours of physical activity than women. Younger people with prediabetes and normal glucose levels engaged in more weekly MET-hours than older adults, but that pattern did not hold for individuals with diagnosed and undiagnosed diabetes. No consistent relationships were observed by race/ethnicity or education (Appendix 10.30). A larger percentage of people with
normal glucose levels engaged in ≥50 weekly MET-hours of physical activity compared to the other diabetes groups (Table 10.12).
Taken together, these nationally represen-tative studies, cohorts, and new analyses demonstrate a suboptimal level of phys-ical activity among people with diabetes. Additionally, people with diabetes engage in less physical activity than their peers without diabetes, and their levels of phys-ical activity have not changed significantly over the past 20 years.
FIGURE 10.9. Mean MET-Hours Per Week of Physical Activity Among Adults Age ≥20 Years, by Diabetes Status, U.S., 2001–2006
23.3 27.9
Diabetes No Diabetes0
10
20
30
MET
-Hou
rs p
er w
eek
Metabolic Equivalent of Task (MET) is the ratio of the rate of energy expended during an activity to the rate of energy expended at rest; self-reported based on the type of leisure-time activity and duration. Diabetes status is based on self-report. Error bars represent 95% confidence intervals.
SOURCE: National Health and Nutrition Examination Surveys 2001–2006
TABLE 10.12. Percent Distribution of MET-Hours Per Week of Physical Activity Among Adults, by Diabetes Status, U.S., 2001–2006
MET-HOURS PER WEEK
PERCENT (STANDARD ERROR)
Diagnosed Diabetes*N=680
Undiagnosed Diabetes (Clinical Definition)†
N=188Prediabetes†
N=1,130
Normal Glucose†N=2,101
>0–<10 43.4 (2.43) 42.9 (5.48) 40.0 (1.62) 36.4 (1.42)
10–<50 46.3 (2.23) 48.4 (5.64) 47.8 (1.54) 48.0 (1.43)
≥50 10.3 (1.57) 8.7 (3.59)1 12.2 (1.14) 15.6 (1.01)
Metabolic Equivalent of Task (MET) is the ratio of the rate of energy expended during an activity to the rate of energy expended at rest; self-reported based on type of leisure-time activity, intensity, and duration. Conversions for glucose and A1c values are provided in Diabetes in America Appendix 1 Conversions. A1c, glycosylated hemoglobin.* Diagnosed diabetes is based on self-report. † Undiagnosed diabetes (clinical definition) is defined as A1c ≥6.5% or fasting plasma glucose ≥126 mg/dL; predi-
abetes is defined as A1c 5.7%–<6.5% or fasting plasma glucose 100–<126 mg/dL; normal glucose is defined as A1c <5.7% and fasting plasma glucose <100 mg/dL. 2-hour plasma glucose from an oral glucose tolerance test was not available in all years of physical activity measurement.
1 Relative standard error >40%–50%
SOURCE: National Health and Nutrition Examination Surveys 2001–2006

10–16
DIABETES IN AMERICA, 3rd Edition
SMOKING
Research on smoking prevalence in people with diabetes is extensive and spans several decades (Table 10.13). Data sources include original and published analyses of the BRFSS, NHANES, and NHIS, as well as SEARCH, Look AHEAD, and Translating Research Into Action for Diabetes (TRIAD), a multisite study of quality of care and self-care in people with diabetes. Data on trends over time in smoking among people with diabetes are also available.
A national study conducted in 1988 found that 26.0% of people with self-reported diagnosed diabetes were current smokers, 25.9% were former smokers, and 48.1% were never smokers (Table 10.13) (30). The highest prev-alence of smoking was found among people with diabetes who did not grad-uate from high school and individuals between the ages of 18 and 34 years (30). Data from another national survey
in 1989 found similar results, with 20.2% of people with diabetes being current smokers. In this population, the highest prevalence of smoking was found among those between the ages of 18 and 44 years, men, non-Hispanic blacks, and the least educated (31). Similar percent-ages were found in other national data in 1988–1994, when a study found that 27% of people with diabetes and 36% of people with gestational diabetes were current smokers compared to 31% in people without diabetes (13). An analysis of NHANES 1999–2002 data found that 18.8% of the self-reported diag-nosed diabetes population were current smokers (9), while analysis of the BRFSS 1999 found that 15.2% of people with self-reported diagnosed diabetes and 22.9% of those without diabetes were current smokers (21). Data from the BRFSS 2001–2003 showed similar rates of smoking in people with and without self-reported gestational diabetes (15).
In 2001, 17% of people with self-reported diabetes reported current smoking (11), while in 2005, 21.6% of people with self-reported diabetes were current smokers (17).
Diabetes in America analysis using NHIS 2009–2010 and NHANES 2007–2010 data indicated that the percentage of current smokers is lower among people with diagnosed diabetes or undiag-nosed diabetes compared to those with prediabetes or normal glucose levels (Figure 10.10, Table 10.14, Appendices 10.31–10.34). However, in both data sets, former smoking was observed more frequently in people with diabetes compared to those without diabetes, while the prevalence of never having smoked was lower in those with diabetes than those without diabetes. Prevalence of smoking was higher in younger age groups and men and lower in college grad-uates in people with and without diabetes.
TABLE 10.13. Published Studies on Smoking Among People With Diabetes
STUDY, YEARS (REF.) POPULATION AND SAMPLE SIZE STUDY METHODOLOGY STATISTICS
BRFSS, 1988 (30) 3,006 adults with diabetes Self-report Current smokers: 26.0%Former smokers: 25.9% Never smokers: 48.1%
NHANES, 1988–1994 (13) 218 adults with diabetes; 85 with gestational diabetes; 4,325 with no diabetes
Self-report Current smokersDiabetes: 27%Gestational diabetes: 36%No diabetes: 31%
NHIS, 1989 (31) 2,405 adults with diabetes Self-report Current smokersWith diabetes: 20.2%Without diabetes: 26.1%
BRFSS, 1999 (21) 9,496 adults with diabetes; 250,493 without diabetes Self-report Current smokersWith diabetes: 15.2%Without diabetes: 22.9%
NHANES, 1999–2002 (9) 1,514 adults with self-reported diabetes Self-report 18.8% smokers
BRFSS, 2001 (11) 10,980 adults with diabetes Self-report Current smokers: 17%
Look AHEAD, 2001 (12) 5,145 adults age 45–74 years with type 2 diabetes Self-report Current smokers: 4.4% Former smokers: 45.4%Never smoker 50.2%
SEARCH, 2001 (32) 3,466 youth age <20 years with physician-diagnosed diabetesType 1 diabetes: 2,887 Type 2 diabetes: 579
Self-report Reported current use of tobacco products
Type 1 diabetes: 9.9%Type 2 diabetes: 15.7%
BRFSS, 2001–2003 (15) 4,718 women age 18–44 years with gestational diabetes Self-report Current smokersGestational diabetes: 23.3%No diabetes: 24.0%
TRIAD, 2002–2003 (33) 6,538 adults age ≥25 years with physician-diagnosed diabetes Self-report Current smokers: 15%
BRFSS, 2005 (17) 16,428 adults with diabetes Self-report 21.6% smokers
BRFSS, Behavioral Risk Factor Surveillance System; NHANES, National Health and Nutrition Examination Survey; NHIS, National Health Interview Survey; SEARCH, the Search for Diabetes in Youth Study; TRIAD, Translating Research Into Action for Diabetes.
SOURCE: References are listed within the table.

Lifestyle Characteristics Among People With Diabetes and Prediabetes
10–17
The prevalence of smoking has been examined in multicenter trials and community-based studies (Table 10.13). SEARCH found differences in smoking status between adolescents with type 1 and type 2 diabetes, with 9.9% of those with type 1 diabetes using tobacco products and 8.1% smoking cigarettes compared to 15.7% of those with type 2 diabetes using tobacco products and 13.1% smoking cigarettes (32). Look AHEAD found that 4.4% of people with confirmed diabetes were current smokers, 45.4% were former smokers, and 50.2% had never smoked (12). TRIAD found that 15% of their sample reported that they were current smokers, and smoking was more common in younger adults, non- Hispanic African Americans, and those with less education (33).
Several studies examined trends in smoking among people with diabetes using nationally representative data (Table 10.15). One analysis examined
FIGURE 10.10. Percent Smoking Among Adults Age ≥20 Years, by Diabetes Status, U.S., 2007–2010
16.8
34.4
48.8
20.3 20.6
59.1
Current Smoker Former Smoker Never Smoker
Diabetes No diabetes
0
10
20
30
40
50
60
Perc
ent
Diabetes status is based on self-report. Error bars represent 95% confidence intervals.
SOURCE: National Health and Nutrition Examination Surveys 2007–2010
TABLE 10.14. Smoking Among Adults Age ≥18 Years, by Diabetes Status, U.S., 2009–2010
SMOKING
PERCENT (STANDARD ERROR)
DiabetesN=5,428
No DiabetesN=49,115
Current smoker 16.8 (0.69) 20.3 (0.28)
Former smoker 34.4 (0.86) 20.6 (0.25)
Never smoker 48.8 (0.92) 59.1 (0.32)
Diabetes status is based on self-report.
SOURCE: National Health Interview Surveys 2009–2010
TABLE 10.15. Published Studies on Smoking Trends Among People With Diabetes
STUDY, YEAR (REF.) POPULATION AND SAMPLE SIZE STUDY METHODOLOGY STATISTICS
NHANES, 1971–1974, 1976–1980, 1988–1994, 1999–2000 (34)
Adults age 20–74 years with diabetes1971–1974: 5701976–1980: 557 1988–1994: 9991999–2000: 357
Self-report Age-adjusted prevalence of smoking dropped 15% over the time period; median annual change of -0.5 percentage points per year.
NHIS, 1974, 1985, 1990 (35) Adults with diabetes 1974: 487 1985: 5691990: 763
Self-report Current smokers
With diabetes:1974: 35.6%1985: 31.0%1990: 25.8%
Without diabetes:1974: 37.3%1985: 30.2% 1990: 25.6%
NHANES, 1988–1994, 1999–2008 (36)
1988–1994: 1,065 adults with diabetes1999–2008: 1,872 adults with diabetes
Self-report Current smokers1988–1994: 17.5%1999–2008: 18.1%
BRFSS, 1990–2001 (37) 4,183–14,447 adults per year with diabetes Self-report Current smokers1990: 23.6% 1991: 23.0% 1992: 24.7% 1993: 22.8% 1994: 21.8% 1995: 24.1% 1996: 24.6% 1997: 21.8% 1998: 23.4% 1999: 22.4% 2000: 24.1% 2001: 23.2%
Table 10.15 continues on the next page.

10–18
DIABETES IN AMERICA, 3rd Edition
TABLE 10.15. (continued)
STUDY, YEAR (REF.) POPULATION AND SAMPLE SIZE STUDY METHODOLOGY STATISTICS
BRFSS, 1991–1999 odd years (38) Adults with diabetes Self-report Current smokers1991: 23% 1993: 20.1% 1995: 24.7% 1997: 21.6% 1999: 19.9%
NHANES, 1999–2008 (39) Adults with diabetes: 3,111Adults with impaired fasting glucose*: 3,557Adults without diabetes: 17,981
Self-report Current smokers Diabetes: 25.7%Impaired fasting glucose: 24.2%No diabetes: 24.1%
Conversions for glucose values are provided in Diabetes in America Appendix 1 Conversions. BRFSS, Behavioral Risk Factor Surveillance System; NHANES, National Health and Nutrition Examination Survey; NHIS, National Health Interview Survey.* Impaired fasting glucose is defined as individuals who had been told by a health professional that they were “borderline” for diabetes but did not take insulin or diabetes pills, or
who had a fasting blood glucose ≥100 mg/dL and <126 mg/dL.
SOURCE: References are listed within the table.
trends in smoking from 1971 to 2000 and found that age- adjusted prevalence of smoking dropped 15% over the time period, with a median decrease of 0.5 percentage points per year (34). Another analysis of NHIS data tracked the prev-alence of current smoking in people with self- reported diagnosed diabetes in 1974, 1985, and 1990. The prevalence of smoking decreased from 35.6% to 25.8% over this time period, although different diagnostic criteria were used in the medical community to define
diabetes at these time points. A similar decrease in prevalence of smoking was also found in people without diabetes (35). A third study found no change in smoking from 1988–1994 to 1999–2008, when the prevalences were 17.5% and 18.1%, respectively (36). Another analysis of trends based on nationally represen-tative data from 1990 to 2001 found no significant decreases over time in either the diabetic or nondiabetic populations, with the prevalence of smoking ranging from 21.8% to 24.7% among those with
diabetes (37). Another study examined the prevalence of smoking in odd years from 1991 to 1999 and found a 13% decrease during this time frame, with yearly percentages ranging from 24.7% to 19.9% over the period (38). The most recent analysis of smoking trends from the NHANES 1999–2008 showed no significant differences in smoking prev-alence between those with diabetes, impaired fasting glucose, and normal glucose levels, and found no significant trends over time (39).
HEALTH-SEEKING BEHAVIORS
Data on health-seeking behaviors include information on changing dietary intake, pursuing smoking cessation, changing physical activity behavior, practicing weight control, and visiting physicians regularly. Data sources include new analyses for Diabetes in America and published analyses of NHANES, NHIS, and BRFSS data, as well as SHIELD and the Health and Retirement Study.
CHANGING DIETARY INTAKEResearch from the NHANES 2005–2006 indicated that 54.7% of people with prediabetes based on a fasting plasma glucose or an oral glucose tolerance test tried to reduce fat or calories intake in the last year, and 31.9% were advised to do so by their physician (40). In addition, a community-based study of adolescents in 2003–2005 reported that 58% of the population decreased their carbohy-drate intake, 19% decreased fats, 30%
decreased calories, and 18% added healthier foods (18).
Analyses for Diabetes in America using data from the NHANES 2007–2010 indi-cated that when instructed by a doctor, 88.2% of people with diagnosed diabetes and 81.5% of those without diagnosed diabetes reported eating fewer high fat foods (Figure 10.11). The percentage of people with undiagnosed diabetes, predi-abetes, and normal glucose levels who were eating fewer high fat foods ranged from 79.6% to 84.2% (Appendix 10.35). No consistent demographic patterns across any of the groups by diabetes status were observed (Appendix 10.36).
PURSUING SMOKING CESSATIONDiabetes in America analysis using NHIS 2009–2010 data indicated that 51.5% of individuals with self-reported diagnosed diabetes, 50.2% of individuals
with prediabetes, and 46.2% of indi-viduals with normal glucose levels who smoke were attempting to quit smoking (Figure 10.12). Among people with and without diabetes, a greater percentage of younger adults reported pursuing smoking cessation compared to older adults, and a greater percentage of non-Hispanic blacks and Hispanics tried to quit smoking than non-Hispanic whites and Asians (Appendix 10.37).
Published studies have examined trends over time in attempting to quit smoking. One nationally representative study that examined data from 1990–2001 found that the prevalence increased from 55.5% to 60.1% in people with diabetes and from 44.3% to 54.4% in those without diabetes (37). Another study found that the percentage of individuals receiving physician advice to quit smoking was higher in people with diabetes, where it

Lifestyle Characteristics Among People With Diabetes and Prediabetes
10–19
increased from 35.1% in 1974 to 60.8% in 1985, compared to those without diabetes (35).
CHANGING PHYSICAL ACTIVITY BEHAVIORSeveral studies have examined levels of increased physical activity in people with diabetes. In the SHIELD study, 47% of people with diagnosed diabetes were advised by a health care professional to increase their exercise. Of those who received this recommendation, 33%–46% intended to follow it all or most of the time (26). In a population of people with diag-nosed prediabetes, 48.5% had increased their physical activity in the past 12 months, and 34.2% had been advised to do so by a physician (40). In both populations, minorities were more likely to follow the recommendation than non-Hispanic whites.
A new analysis for Diabetes in America using NHANES 2007–2010 data showed that a higher percentage of people with normal glucose levels reported increasing their physical activity compared to those with diagnosed diabetes, undiagnosed diabetes, or prediabetes (Figure 10.11, Appendices 10.35 and 10.38). No consis-tent patterns were found by age, sex, race/ethnicity, or education level.
Other studies examined sedentary behaviors. One community-based study examined sedentary behaviors in adolescents with type 2 diabetes and found that 32% of their population watched less than 1 hour of television per day, 39% watched 2–3 hours, and 29% watched more than 4 hours (18). In the TODAY study, adolescents with type 2 diabetes engaged in 479.0–546.5 minutes of sedentary time per day (27).
PRACTICING WEIGHT CONTROLIn the 1992 wave of the Health and Retirement Study, 78%–80% of the popu-lation with diagnosed diabetes were on a special diet, and 58%–59% were trying to lose weight. However, in the 1996 wave, only 61.7% were on a special diet, and 53.6% were trying to lose weight (23). In 2005–2006, a nationally representative study on people with prediabetes found that 52.2% of this population had tried
to control or lose weight in the past year, while 29.7% received physician advice to lose weight (40). An analysis of SHIELD 2007 data showed that 40%–57% of the population with diagnosed diabetes had a health professional instruct them to change what they eat. Among those who received this advice, 48%–72% indicated that they would follow it most or all of the time. Additionally, higher percentages of Caucasian and Hispanic diabetic women reported trying to lose weight compared to other sex and race/ethnicity groups (26).
Diabetes in America analysis of NHANES 2007–2010 data demonstrated that similar percentages of people with self-reported diagnosed diabetes and no
diagnosed diabetes reported practicing weight control (Figure 10.11). The vast majority of people with diagnosed diabetes (86.2%), clinical undiagnosed diabetes (83.2%), research undiagnosed diabetes (84.0%), prediabetes (84.0%), and normal glucose levels (82.7%) reported practicing weight control in the past year (Appendix 10.35). Among those with undiagnosed diabetes, predi-abetes, or normal glucose levels, a greater percentage of non-Hispanic blacks and Other/Multiracial individuals reported practicing weight control than non-Hispanic whites and Hispanics, but no consistent patterns by any other type of demographic characteristic were found (Appendix 10.39).
FIGURE 10.11. Prevalence of Health Behaviors Among Adults Age ≥20 Years, by Diabetes Status, U.S., 2007–2010
88.2
75.286.2
97.5
81.5 78.3 83.4 82.6
Eating FewerHigh Fat Foods*
IncreasingActivity†
PracticingWeight Control‡
Had a HealthcareVisit in Past Year§
0
20
40
60
80
100
Perc
ent
Diabetes No diabetes
Diabetes status is based on self-report. Error bars represent 95% confidence intervals.* Question asked among persons told by a doctor to eat less fat and cholesterol in order to lower cholesterol level.† Question asked among persons told by a doctor to exercise to reduce cholesterol level.‡ Question asked among persons told by a doctor to control weight in order to improve cholesterol level.§ At least one health care visit in past year to see a doctor or health care professional at a doctor’s office, clinic,
hospital, emergency room, at home, or some other place.
SOURCE: National Health and Nutrition Examination Surveys 2007–2010
FIGURE 10.12. Prevalence of Pursuing Smoking Cessation Among Adults Age ≥18 Years, by Diabetes Status, U.S., 2009–2010
51.5
Diabetes
50.2
Prediabetes
46.2
Normal Glucose0
10
20
30
40
50
60
Perc
ent
Diabetes status is based on self-report. Error bars represent 95% confidence intervals.
SOURCE: National Health Interview Surveys 2009–2010
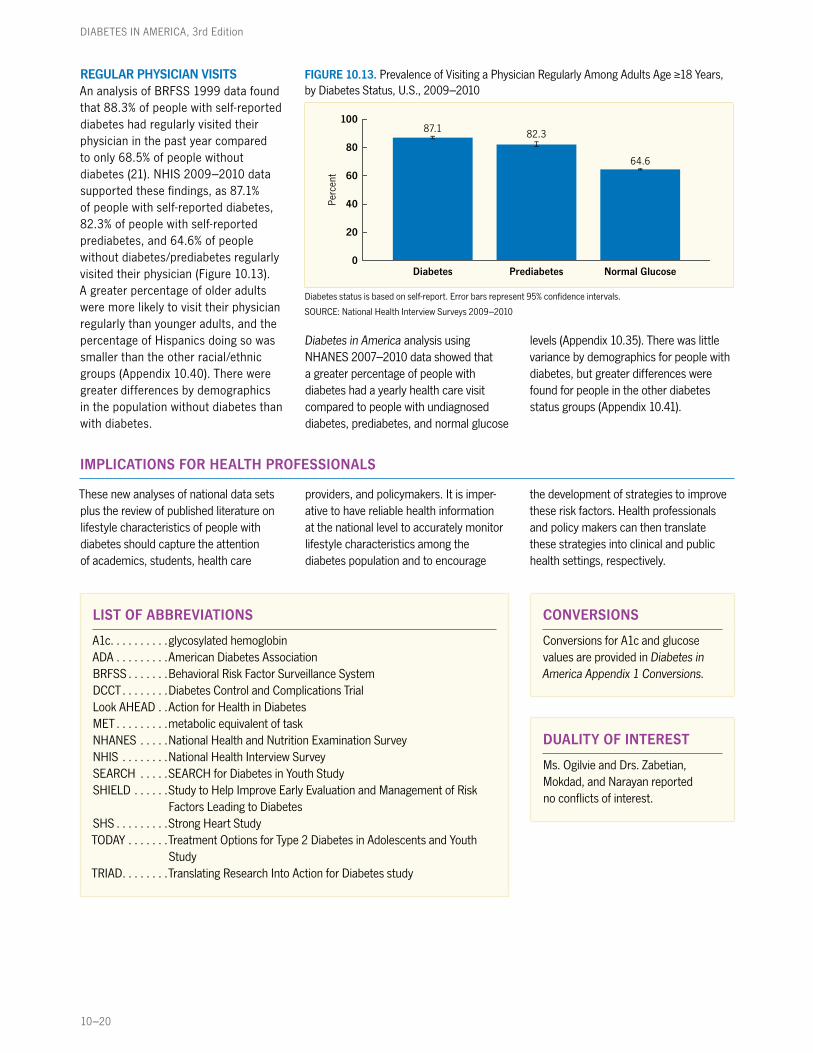
10–20
DIABETES IN AMERICA, 3rd Edition
REGULAR PHYSICIAN VISITSAn analysis of BRFSS 1999 data found that 88.3% of people with self-reported diabetes had regularly visited their physician in the past year compared to only 68.5% of people without diabetes (21). NHIS 2009–2010 data supported these findings, as 87.1% of people with self-reported diabetes, 82.3% of people with self-reported prediabetes, and 64.6% of people without diabetes/prediabetes regularly visited their physician (Figure 10.13). A greater percentage of older adults were more likely to visit their physician regularly than younger adults, and the percentage of Hispanics doing so was smaller than the other racial/ethnic groups (Appendix 10.40). There were greater differences by demographics in the population without diabetes than with diabetes.
Diabetes in America analysis using NHANES 2007–2010 data showed that a greater percentage of people with diabetes had a yearly health care visit compared to people with undiagnosed diabetes, prediabetes, and normal glucose
levels (Appendix 10.35). There was little variance by demographics for people with diabetes, but greater differences were found for people in the other diabetes status groups (Appendix 10.41).
IMPLICATIONS FOR HEALTH PROFESSIONALS
These new analyses of national data sets plus the review of published literature on lifestyle characteristics of people with diabetes should capture the attention of academics, students, health care
providers, and policymakers. It is imper-ative to have reliable health information at the national level to accurately monitor lifestyle characteristics among the diabetes population and to encourage
the development of strategies to improve these risk factors. Health professionals and policy makers can then translate these strategies into clinical and public health settings, respectively.
FIGURE 10.13. Prevalence of Visiting a Physician Regularly Among Adults Age ≥18 Years, by Diabetes Status, U.S., 2009–2010
87.1 82.3
64.6
Diabetes Prediabetes Normal Glucose0
20
40
60
80
100
Perc
ent
Diabetes status is based on self-report. Error bars represent 95% confidence intervals.
SOURCE: National Health Interview Surveys 2009–2010
LIST OF ABBREVIATIONS
A1c . . . . . . . . . .glycosylated hemoglobinADA . . . . . . . . .American Diabetes AssociationBRFSS . . . . . . .Behavioral Risk Factor Surveillance SystemDCCT . . . . . . . .Diabetes Control and Complications TrialLook AHEAD . .Action for Health in DiabetesMET . . . . . . . . .metabolic equivalent of taskNHANES . . . . .National Health and Nutrition Examination SurveyNHIS . . . . . . . .National Health Interview Survey SEARCH . . . . .SEARCH for Diabetes in Youth StudySHIELD . . . . . .Study to Help Improve Early Evaluation and Management of Risk
Factors Leading to DiabetesSHS . . . . . . . . .Strong Heart StudyTODAY . . . . . . .Treatment Options for Type 2 Diabetes in Adolescents and Youth
StudyTRIAD . . . . . . . .Translating Research Into Action for Diabetes study
CONVERSIONS
Conversions for A1c and glucose values are provided in Diabetes in America Appendix 1 Conversions.
DUALITY OF INTEREST
Ms. Ogilvie and Drs. Zabetian, Mokdad, and Narayan reported no conflicts of interest.

Lifestyle Characteristics Among People With Diabetes and Prediabetes
10–21
REFERENCES
1. Delahanty LM, Nathan DM, Lachin JM, Hu FB, Cleary PA, Ziegler GK, Wylie-Rosett J, Wexler DJ; Diabetes Control and Complications Trial/ Epidemiology of Diabetes: Association of diet with glycated hemoglobin during intensive treatment of type 1 diabetes in the Diabetes Control and Complications Trial. Am J Clin Nutr 89:518–524, 2009
2. Oza-Frank R, Cheng YJ, Narayan KM, Gregg EW: Trends in nutrient intake among adults with diabetes in the United States: 1988–2004. J Am Diet Assoc 109:1173–1178, 2009
3. Eilat-Adar S, Xu J, Zephier E, O’Leary V, Howard BV, Resnick HE: Adherence to dietary recommendations for saturated fat, fiber, and sodium is low in American Indians and other U.S. adults with diabetes. J Nutr 138:1699–1704, 2008
4. Mayer-Davis EJ, Nichols M, Liese AD, Bell RA, Dabelea DM, Johansen JM, Pihoker C, Rodriguez BL, Thomas J, Williams D; SEARCH for Diabetes in Youth Study Group: Dietary intake among youth with diabetes: the SEARCH for Diabetes in Youth Study. J Am Diet Assoc 106:689–697, 2006
5. Bortsov A, Liese AD, Bell RA, Dabelea D, D’Agostino RB, Jr., Hamman RF, Klingensmith GJ, Lawrence JM, Maahs DM, McKeown R, Marcovina SM, Thomas J, Mayer-Davis EJ: Correlates of dietary intake in youth with diabetes: results from the SEARCH for Diabetes in Youth Study. J Nutr Educ Behav 43:123–129, 2011
6. Vitolins MZ, Anderson AM, Delahanty L, Raynor H, Miller GD, Mobley C, Reeves R, Yamamoto M, Champagne C, Wing RR, Mayer-Davis E; Look AHEAD Research Group: Action for Health in Diabetes (Look AHEAD) trial: baseline evaluation of selected nutrients and food group intake. J Am Diet Assoc 109:1367–1375, 2009
7. Evert AB, Boucher JL, Cypress M, Dunbar SA, Franz MJ, Mayer-Davis EJ, Nuemiller JJ, Nwankwo R, Verdi CL, Urbanski P, Yancy WS, Jr.; American Diabetes Association: Nutrition therapy recommendations for the management of adults with diabetes. Diabetes Care 36:3821–3842, 2013
8. Nelson KM, Reiber G, Boyko EJ; NHANES III: Diet and exercise among adults with type 2 diabetes: findings from the third national health and nutrition examination survey (NHANES III). Diabetes Care 25:1722–1728, 2002
9. Resnick HE, Foster GL, Bardsley J, Ratner RE: Achievement of American Diabetes Association clinical practice recommen-dations among U.S. adults with diabetes,
1999–2002: the National Health and Nutrition Examination Survey. Diabetes Care 29:531–537, 2006
10. U.S. Department of Agriculture and U.S. Department of Health and Human Services: Dietary Guidelines for Americans, 2010. 7th Edition. Washington, DC: U.S. Government Printing Office, 2010
11. Chew LD, Nelson KM, Young BA, Bradley KA: Association between alcohol consumption and diabetes preventive practices. Fam Med 37:589–594, 2005
12. Bray G, Gregg E, Haffner S, Pi-Sunyer XF, WagenKnecht LE, Walkup M, Wing R; The Look AHEAD Research Group: Baseline characteristics of the randomised cohort from the Look AHEAD (Action for Health in Diabetes) study. Diab Vasc Dis Res 3:202–215, 2006
13. Kim C, Cheng YJ, Beckles GL: Cardiovascular disease risk profiles in women with histories of gestational diabetes but without current diabetes. Obstet Gynecol 112:875–883, 2008
14. Mackenzie T, Brooks B, O’Connor G: Beverage intake, diabetes, and glucose control of adults in America. Ann Epidemiol 16:688–691, 2006
15. Kieffer EC, Sinco B, Kim C: Health behaviors among women of reproductive age with and without a history of gesta-tional diabetes mellitus. Diabetes Care 29:1788–1793, 2006
16. Campbell HM, Khan N, Cone C, Raisch DW: Relationship between diet, exercise habits, and health status among patients with diabetes. Res Social Adm Pharm 7:151–161, 2011
17. Li C, Ford ES, Mokdad AH, Jiles R, Giles WH: Clustering of multiple healthy life-style habits and health-related quality of life among U.S. adults with diabetes. Diabetes Care 30:1770–1776, 2007
18. Rothman RL, Mulvaney S, Elasy TA, VanderWoude A, Gebretsadik T, Shintani A, Potter A, Russell WE, Schlundt D: Self-management behaviors, racial disparities, and glycemic control among adolescents with type 2 diabetes. Pediatrics 121:e912–e919, 2008
19. Colberg SR, Sigal RJ, Fernhall B, Regensteiner JG, Blissmer BJ, Rubin RR, Chasan-Taber L, Albright AL, Braun B; American College of Sports Medicine; American Diabetes Association: Exercise and type 2 diabetes: the American College of Sports Medicine and the American Diabetes Association: joint position statement. Diabetes Care 33:e147–e167, 2010
20. Ford ES, Herman WH: Leisure-time physical activity patterns in the U.S. diabetic population. Findings from the 1990 National Health Interview Survey—Health Promotion and Disease Prevention Supplement. Diabetes Care 18:27–33, 1995
21. Egede LE, Zheng D: Modifiable cardiovas-cular risk factors in adults with diabetes: prevalence and missed opportunities for physician counseling. Arch Intern Med 162:427–433, 2002
22. Zhao G, Ford ES, Li C, Balluz LS: Physical activity in U.S. older adults with diabetes mellitus: prevalence and correlates of meeting physical activity recommendations. J Am Geriatr Soc 59:132–137, 2011
23. Nothwehr F, Stump T: Health-promoting behaviors among adults with type 2 diabetes: findings from the Health and Retirement Study. Prev Med 30:407–414, 2000
24. Hays LM, Clark DO: Correlates of physical activity in a sample of older adults with type 2 diabetes. Diabetes Care 22:706–712, 1999
25. Zhang X, Geiss LS, Caspersen CJ, Cheng YJ, Engelgau MM, Johnson JA, Plotnikoff RC, Gregg EW: Physical activity levels and differences in the prevalence of diabetes between the United States and Canada. Prev Med 50:241–245, 2010
26. Gavin JR, 3rd, Fox KM, Grandy S: Race/ethnicity and gender differences in health intentions and behaviors regarding exercise and diet for adults with type 2 diabetes: a cross-sectional analysis. BMC Public Health 11:533, 2011
27. Kriska A, Delahanty L, Edelstein S, Amodei N, Chadwick J, Copeland K, Galvin B, El ghormli L, Haymond M, Kelsey M, Lassiter C, Mayer-Davis E, Milaszewski K, Syme A: Sedentary behavior and physical activity in youth with recent onset of type 2 diabetes. Pediatrics 131:e850–e856, 2013
28. Zhao G, Ford ES, Li C, Mokdad AH: Compliance with physical activity recom-mendations in US adults with diabetes. Diabet Med 25:221–227, 2008
29. Loprinzi PD, Ramulu PY: Objectively measured physical activity and inflam-matory markers among US adults with diabetes: implications for attenuating disease progression. Mayo Clin Proc 88:942–951, 2013
30. Ford ES, Newman J: Smoking and diabetes mellitus. Findings from 1988 Behavioral Risk Factor Surveillance System. Diabetes Care 14:871–874, 1991

10–22
DIABETES IN AMERICA, 3rd Edition
31. Ford ES, Malarcher AM, Herman WH, Aubert RE: Diabetes mellitus and cigarette smoking. Findings from the 1989 National Health Interview Survey. Diabetes Care 17:688–692, 1994
32. Reynolds K, Liese AD, Anderson AM, Dabelea D, Standiford D, Daniels SR, Waitzfelder B, Case D, Loots B, Imperatore G, Lawrence JM: Prevalence of tobacco use and association between cardiometabolic risk factors and cigarette smoking in youth with type 1 or type 2 diabetes mellitus. J Pediatr 158:594– 601.e1, 2011
33. Karter AJ, Stevens MR, Gregg EW, Brown AF, Tseng CW, Marrero DG, Duru OK, Gary TL, Piette JD, Waitzfelder B, Herman WH, Becles GL, Safford MM, Ettner SL: Educational disparities in rates of smoking among diabetic adults: the Translating Research Into Action for Diabetes study. Am J Public Health 98:365–370, 2008
34. Imperatore G, Cadwell BL, Geiss L, Saadinne JB, Williams DE, Ford ES, Thompson TJ, Narayan KM, Gregg EW: Thirty-year trends in cardiovascular risk factor levels among US adults with diabetes: National Health and Nutrition Examination Surveys, 1971–2000. Am J Epidemiol 160:531–539, 2004
35. Malarcher AM, Ford ES, Nelson DE, Chrismon JH, Mowery P, Merritt RK, Herman WH: Trends in cigarette smoking and physicians’ advice to quit smoking among people with diabetes in the U.S. Diabetes Care 18:694–697, 1995
36. Chatterji P, Joo H, Lahiri K: Racial/ethnic- and education-related disparities in the control of risk factors for cardiovascular disease among individuals with diabetes. Diabetes Care 35:305–312, 2012
37. Ford ES, Mokdad AH, Gregg EW: Trends in cigarette smoking among US adults with diabetes: findings from the Behavioral Risk Factor Surveillance System. Prev Med 39:1238–1242, 2004
38. Greenlund KJ, Zheng ZJ, Keenan NL, Giles WH, Casper ML, Mensah GA, Croft JB: Trends in self-reported multiple cardiovas-cular disease risk factors among adults in the United States, 1991–1999. Arch Intern Med 164:181–188, 2004
39. Clair C, Meigs JB, Rigotti NA: Smoking behavior among US adults with diabetes or impaired fasting glucose. Am J Med 126:541.e15–541.e18, 2013
40. Geiss LS, James C, Gregg EW, Albright A, Williamson DF, Cowie CC: Diabetes risk reduction behaviors among U.S. adults with prediabetes. Am J Prev Med 38:403–409, 2010

Lifestyle Characteristics Among People With Diabetes and Prediabetes
10–23
APPENDICES
APPENDIX 10.1. Mean Energy Intake, by Diabetes Status and Demographic Characteristics, U.S., 2007–2010
CHARACTERISTICS
MEAN (STANDARD ERROR)
Diagnosed Diabetes*N=1,369
Undiagnosed Diabetes (Clinical Definition)†
N=441
Undiagnosed Diabetes (Research Definition)‡
N=608Prediabetes‡
N=1,792Normal Glucose‡
N=1,701
Total 1,837 (34.1) 2,088 (59.1) 2,002 (46.2) 2,176 (31.8) 2,214 (31.1)
Age (years)20–44 2,199 (97.8) 2,396 (147.8) 2,264 (113.9) 2,424 (68.2) 2,294 (37.4)45–64 1,935 (63.5) 2,307 (113.0) 2,209 (109.6) 2,181 (41.2) 2,126 (64.2)≥65 1,625 (28.0) 1,725 (59.5) 1,702 (50.9) 1,751 (42.9) 1,785 (76.0)
SexMen 2,117 (53.7) 2,387 (72.9) 2,331 (92.8) 2,524 (44.1) 2,682 (51.4)Women 1,568 (27.4) 1,614 (63.1) 1,662 (52.5) 1,780 (27.3) 1,851 (27.1)
Race/ethnicityNon-Hispanic white 1,908 (45.3) 2,147 (81.3) 2,034 (60.8) 2,184 (45.0) 2,264 (34.5)Non-Hispanic black 1,766 (77.6) 1,821 (115.2) 1,849 (102.3) 2,150 (72.8) 2,127 (44.4)Hispanic 1,737 (50.9) 2,221 (121.3) 2,038 (82.6) 2,182 (51.7) 2,176 (63.1)
Mexican American 1,793 (70.6) 2,281 (171.3) 2,109 (110.9) 2,321 (60.6) 2,244 (90.2)Other Hispanic 1,632 (63.5) 2,121 (217.4) 1,922 (137.0) 1,911 (72.4) 2,072 (64.2)
Education<9th grade 1,565 (77.0) 1,907 (171.0) 1,770 (101.1) 1,947 (75.3) 1,981 (85.2)Some high school 1,772 (82.0) 1,825 (103.5) 1,751 (87.9) 2,270 (108.7) 2,355 (84.7)High school graduate 1,796 (60.4) 2,082 (91.5) 2,018 (66.0) 2,204 (52.5) 2,161 (56.1)Some college 1,957 (55.3) 2,204 (101.0) 2,129 (117.0) 2,167 (56.8) 2,224 (47.6)College graduate 2,008 (68.2) 2,269 (174.1) 2,164 (133.7) 2,174 (52.4) 2,222 (51.4)
Energy intake (kcal) is based on 24-hour dietary recall. Conversions for A1c and glucose values are provided in Diabetes in America Appendix 1 Conversions. A1c, glycosylated hemoglobin.* Diagnosed diabetes is based on self-report.† Undiagnosed diabetes (clinical definition) is defined as A1c ≥6.5% or fasting plasma glucose ≥126 mg/dL.‡ Undiagnosed diabetes (research definition) is defined as A1c ≥6.5% or fasting plasma glucose ≥126 mg/dL or 2-hour plasma glucose ≥200 mg/dL; prediabetes is defined as
A1c 5.7%–<6.5% or fasting plasma glucose 100–<126 mg/dL or 2-hour plasma glucose 140–<200 mg/dL; normal glucose is defined as A1c <5.7% and fasting plasma glucose <100 mg/dL and 2-hour plasma glucose <140 mg/dL.
SOURCE: National Health and Nutrition Examination Surveys 2007–2010
APPENDIX 10.2. Percent of Calories From Total Fat, by Diabetes Status and Demographic Characteristics, U.S., 2007–2010
CHARACTERISTICS
PERCENT (STANDARD ERROR)
Diagnosed Diabetes*N=1,369
Undiagnosed Diabetes (Clinical Definition)†
N=441
Undiagnosed Diabetes (Research Definition)‡
N=608Prediabetes‡
N=1,792Normal Glucose‡
N=1,701
Total 35.0 (0.40) 34.4 (0.53) 34.5 (0.46) 33.9 (0.21) 33.2 (0.31)
Age (years)20–44 35.3 (0.83) 32.8 (1.47) 32.9 (2.10) 32.8 (0.38) 32.8 (0.30)45–64 35.3 (0.58) 34.4 (0.99) 34.9 (0.64) 35.0 (0.27) 34.3 (0.63)≥65 34.5 (0.50) 35.0 (0.75) 34.8 (0.68) 33.4 (0.51) 32.8 (0.64)
SexMen 35.5 (0.48) 35.0 (0.71) 35.0 (0.81) 33.7 (0.28) 33.1 (0.48)Women 34.4 (0.55) 33.5 (0.81) 34.0 (0.57) 34.0 (0.33) 33.2 (0.32)
Race/ethnicityNon-Hispanic white 36.2 (0.44) 35.7 (0.69) 35.9 (0.60) 34.8 (0.24) 33.7 (0.38)Non-Hispanic black 34.4 (0.57) 33.0 (1.07) 33.0 (1.12) 33.4 (0.53) 33.0 (0.49)Hispanic 32.8 (0.39) 31.4 (1.17) 29.9 (0.87) 31.1 (0.48) 31.1 (0.53)
Mexican American 33.8 (0.63) 31.1 (1.22) 29.5 (0.99) 31.9 (0.63) 31.6 (0.70)Other Hispanic 30.8 (0.73) 31.9 (2.15) 30.4 (1.72) 29.4 (0.91) 30.3 (0.83)
Education<9th grade 33.7 (0.81) 32.1 (1.26) 30.8 (1.24) 29.2 (0.68) 30.6 (1.81)Some high school 34.8 (0.89) 33.2 (1.34) 33.5 (1.01) 34.2 (0.74) 31.7 (0.68)High school graduate 35.2 (0.55) 34.7 (0.67) 34.7 (0.66) 34.2 (0.66) 32.9 (0.36)Some college 35.6 (0.65) 34.5 (1.06) 34.5 (0.75) 33.8 (0.44) 33.9 (0.55)College graduate 34.8 (0.87) 36.4 (1.51) 37.6 (1.51) 34.7 (0.58) 33.4 (0.55)
Total fat intake is based on 24-hour dietary recall. Conversions for A1c and glucose values are provided in Diabetes in America Appendix 1 Conversions. A1c, glycosylated hemoglobin. * Diagnosed diabetes is based on self-report.† Undiagnosed diabetes (clinical definition) is defined as A1c ≥6.5% or fasting plasma glucose ≥126 mg/dL.‡ Undiagnosed diabetes (research definition) is defined as A1c ≥6.5% or fasting plasma glucose ≥126 mg/dL or 2-hour plasma glucose ≥200 mg/dL; prediabetes is defined as
A1c 5.7%–<6.5% or fasting plasma glucose 100–<126 mg/dL or 2-hour plasma glucose 140–<200 mg/dL; normal glucose is defined as A1c <5.7% and fasting plasma glucose <100 mg/dL and 2-hour plasma glucose <140 mg/dL.
SOURCE: National Health and Nutrition Examination Surveys 2007–2010
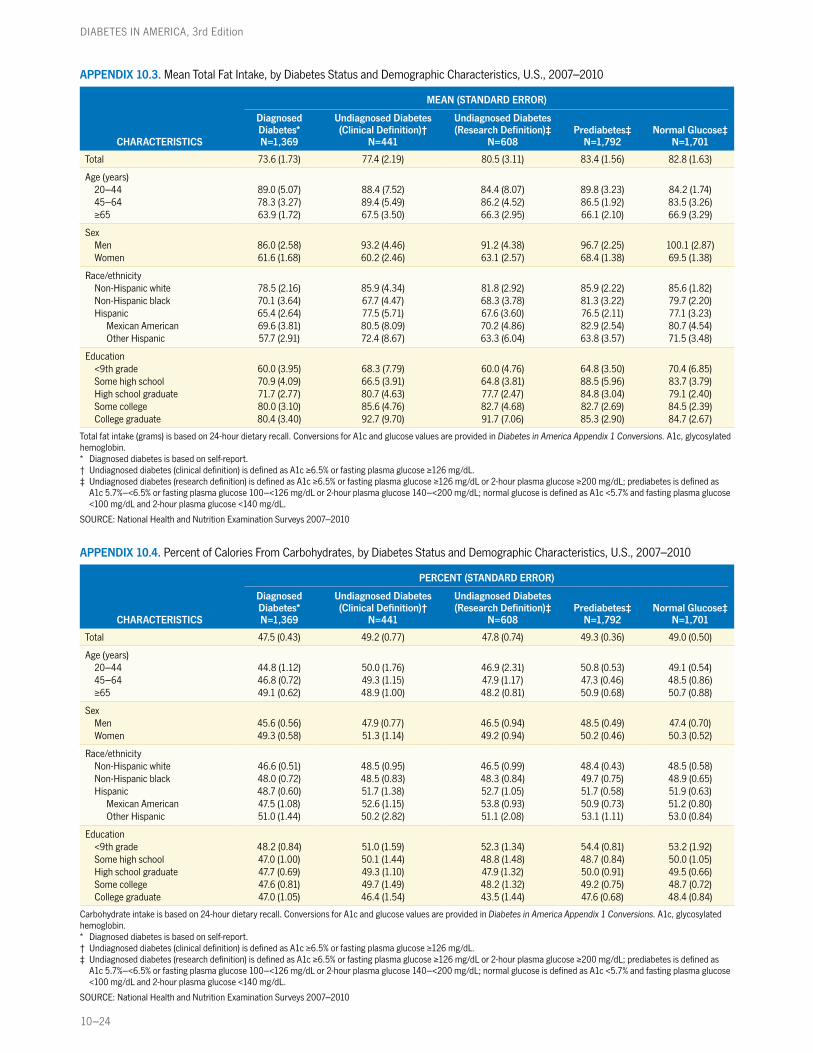
10–24
DIABETES IN AMERICA, 3rd Edition
APPENDIX 10.3. Mean Total Fat Intake, by Diabetes Status and Demographic Characteristics, U.S., 2007–2010
CHARACTERISTICS
MEAN (STANDARD ERROR)
Diagnosed Diabetes*N=1,369
Undiagnosed Diabetes (Clinical Definition)†
N=441
Undiagnosed Diabetes (Research Definition)‡
N=608Prediabetes‡
N=1,792Normal Glucose‡
N=1,701
Total 73.6 (1.73) 77.4 (2.19) 80.5 (3.11) 83.4 (1.56) 82.8 (1.63)
Age (years)20–44 89.0 (5.07) 88.4 (7.52) 84.4 (8.07) 89.8 (3.23) 84.2 (1.74)45–64 78.3 (3.27) 89.4 (5.49) 86.2 (4.52) 86.5 (1.92) 83.5 (3.26)≥65 63.9 (1.72) 67.5 (3.50) 66.3 (2.95) 66.1 (2.10) 66.9 (3.29)
SexMen 86.0 (2.58) 93.2 (4.46) 91.2 (4.38) 96.7 (2.25) 100.1 (2.87)Women 61.6 (1.68) 60.2 (2.46) 63.1 (2.57) 68.4 (1.38) 69.5 (1.38)
Race/ethnicityNon-Hispanic white 78.5 (2.16) 85.9 (4.34) 81.8 (2.92) 85.9 (2.22) 85.6 (1.82)Non-Hispanic black 70.1 (3.64) 67.7 (4.47) 68.3 (3.78) 81.3 (3.22) 79.7 (2.20)Hispanic 65.4 (2.64) 77.5 (5.71) 67.6 (3.60) 76.5 (2.11) 77.1 (3.23)
Mexican American 69.6 (3.81) 80.5 (8.09) 70.2 (4.86) 82.9 (2.54) 80.7 (4.54)Other Hispanic 57.7 (2.91) 72.4 (8.67) 63.3 (6.04) 63.8 (3.57) 71.5 (3.48)
Education<9th grade 60.0 (3.95) 68.3 (7.79) 60.0 (4.76) 64.8 (3.50) 70.4 (6.85)Some high school 70.9 (4.09) 66.5 (3.91) 64.8 (3.81) 88.5 (5.96) 83.7 (3.79)High school graduate 71.7 (2.77) 80.7 (4.63) 77.7 (2.47) 84.8 (3.04) 79.1 (2.40)Some college 80.0 (3.10) 85.6 (4.76) 82.7 (4.68) 82.7 (2.69) 84.5 (2.39)College graduate 80.4 (3.40) 92.7 (9.70) 91.7 (7.06) 85.3 (2.90) 84.7 (2.67)
Total fat intake (grams) is based on 24-hour dietary recall. Conversions for A1c and glucose values are provided in Diabetes in America Appendix 1 Conversions. A1c, glycosylated hemoglobin.* Diagnosed diabetes is based on self-report.† Undiagnosed diabetes (clinical definition) is defined as A1c ≥6.5% or fasting plasma glucose ≥126 mg/dL.‡ Undiagnosed diabetes (research definition) is defined as A1c ≥6.5% or fasting plasma glucose ≥126 mg/dL or 2-hour plasma glucose ≥200 mg/dL; prediabetes is defined as
A1c 5.7%–<6.5% or fasting plasma glucose 100–<126 mg/dL or 2-hour plasma glucose 140–<200 mg/dL; normal glucose is defined as A1c <5.7% and fasting plasma glucose <100 mg/dL and 2-hour plasma glucose <140 mg/dL.
SOURCE: National Health and Nutrition Examination Surveys 2007–2010
APPENDIX 10.4. Percent of Calories From Carbohydrates, by Diabetes Status and Demographic Characteristics, U.S., 2007–2010
CHARACTERISTICS
PERCENT (STANDARD ERROR)
Diagnosed Diabetes*N=1,369
Undiagnosed Diabetes (Clinical Definition)†
N=441
Undiagnosed Diabetes (Research Definition)‡
N=608Prediabetes‡
N=1,792Normal Glucose‡
N=1,701
Total 47.5 (0.43) 49.2 (0.77) 47.8 (0.74) 49.3 (0.36) 49.0 (0.50)
Age (years)20–44 44.8 (1.12) 50.0 (1.76) 46.9 (2.31) 50.8 (0.53) 49.1 (0.54)45–64 46.8 (0.72) 49.3 (1.15) 47.9 (1.17) 47.3 (0.46) 48.5 (0.86)≥65 49.1 (0.62) 48.9 (1.00) 48.2 (0.81) 50.9 (0.68) 50.7 (0.88)
SexMen 45.6 (0.56) 47.9 (0.77) 46.5 (0.94) 48.5 (0.49) 47.4 (0.70)Women 49.3 (0.58) 51.3 (1.14) 49.2 (0.94) 50.2 (0.46) 50.3 (0.52)
Race/ethnicityNon-Hispanic white 46.6 (0.51) 48.5 (0.95) 46.5 (0.99) 48.4 (0.43) 48.5 (0.58)Non-Hispanic black 48.0 (0.72) 48.5 (0.83) 48.3 (0.84) 49.7 (0.75) 48.9 (0.65)Hispanic 48.7 (0.60) 51.7 (1.38) 52.7 (1.05) 51.7 (0.58) 51.9 (0.63)
Mexican American 47.5 (1.08) 52.6 (1.15) 53.8 (0.93) 50.9 (0.73) 51.2 (0.80)Other Hispanic 51.0 (1.44) 50.2 (2.82) 51.1 (2.08) 53.1 (1.11) 53.0 (0.84)
Education<9th grade 48.2 (0.84) 51.0 (1.59) 52.3 (1.34) 54.4 (0.81) 53.2 (1.92)Some high school 47.0 (1.00) 50.1 (1.44) 48.8 (1.48) 48.7 (0.84) 50.0 (1.05)High school graduate 47.7 (0.69) 49.3 (1.10) 47.9 (1.32) 50.0 (0.91) 49.5 (0.66)Some college 47.6 (0.81) 49.7 (1.49) 48.2 (1.32) 49.2 (0.75) 48.7 (0.72)College graduate 47.0 (1.05) 46.4 (1.54) 43.5 (1.44) 47.6 (0.68) 48.4 (0.84)
Carbohydrate intake is based on 24-hour dietary recall. Conversions for A1c and glucose values are provided in Diabetes in America Appendix 1 Conversions. A1c, glycosylated hemoglobin.* Diagnosed diabetes is based on self-report.† Undiagnosed diabetes (clinical definition) is defined as A1c ≥6.5% or fasting plasma glucose ≥126 mg/dL.‡ Undiagnosed diabetes (research definition) is defined as A1c ≥6.5% or fasting plasma glucose ≥126 mg/dL or 2-hour plasma glucose ≥200 mg/dL; prediabetes is defined as
A1c 5.7%–<6.5% or fasting plasma glucose 100–<126 mg/dL or 2-hour plasma glucose 140–<200 mg/dL; normal glucose is defined as A1c <5.7% and fasting plasma glucose <100 mg/dL and 2-hour plasma glucose <140 mg/dL.
SOURCE: National Health and Nutrition Examination Surveys 2007–2010

Lifestyle Characteristics Among People With Diabetes and Prediabetes
10–25
APPENDIX 10.5. Mean Carbohydrate Intake, by Diabetes Status and Demographic Characteristics, U.S., 2007–2010
CHARACTERISTICS
MEAN (STANDARD ERROR)
Diagnosed Diabetes*N=1,369
Undiagnosed Diabetes (Clinical Definition)†
N=441
Undiagnosed Diabetes (Research Definition)‡
N=608Prediabetes‡
N=1,792Normal Glucose‡
N=1,701
Total 212.1 (3.74) 238.5 (5.58) 256.3 (7.22) 264.2 (4.05) 266.3 (3.66)
Age (years)20–44 239.4 (12.67) 299.8 (17.76) 264.9 (16.85) 303.1 (7.84) 277.4 (5.42)45–64 219.9 (6.03) 283.7 (13.42) 264.3 (13.38) 254.5 (5.90) 250.7 (6.97)≥65 195.7 (3.18) 209.3 (7.73) 203.5 (6.30) 219.6 (5.19) 219.9 (9.18)
SexMen 234.0 (5.66) 286.1 (9.05) 270.2 (11.43) 301.9 (5.58) 313.5 (6.92)Women 191.0 (4.29) 209.1 (11.58) 205.7 (8.49) 221.4 (3.55) 229.6 (3.71)
Race/ethnicityNon-Hispanic white 216.4 (5.22) 260.7 (9.93) 236.2 (7.47) 260.7 (5.28) 269.2 (4.26)Non-Hispanic black 206.2 (8.45) 214.9 (13.09) 219.5 (12.63) 263.5 (8.48) 255.9 (5.14)Hispanic 204.5 (4.97) 286.6 (17.43) 266.9 (11.43) 277.3 (7.19) 276.7 (7.72)
Mexican American 205.2 (7.66) 295.0 (22.39) 278.3 (14.88) 292.2 (9.43) 282.9 (11.02)Other Hispanic 203.1 (8.44) 272.5 (33.44) 248.3 (19.63) 248.2 (8.74) 267.2 (7.76)
Education<9th grade 184.9 (8.50) 242.9 (21.0) 229.9 (12.69) 255.7 (8.13) 254.2 (8.18)Some high school 201.1 (8.82) 226.4 (12.91) 211.9 (13.94) 271.7 (11.78) 288.6 (8.67)High school graduate 209.1 (7.39) 256.6 (12.52) 243.4 (11.44) 271.4 (6.54) 264.0 (7.04)Some college 226.6 (6.29) 273.1 (14.06) 255.2 (15.93) 263.3 (7.55) 266.4 (6.06)College graduate 227.7 (8.15) 265.0 (19.50) 235.6 (16.69) 257.0 (6.96) 262.5 (6.59)
Carbohydrate intake (grams) is based on 24-hour dietary recall. Conversions for A1c and glucose values are provided in Diabetes in America Appendix 1 Conversions. A1c, glyco-sylated hemoglobin.* Diagnosed diabetes is based on self-report.† Undiagnosed diabetes (clinical definition) is defined as A1c ≥6.5% or fasting plasma glucose ≥126 mg/dL.‡ Undiagnosed diabetes (research definition) is defined as A1c ≥6.5% or fasting plasma glucose ≥126 mg/dL or 2-hour plasma glucose ≥200 mg/dL; prediabetes is defined as
A1c 5.7%–<6.5% or fasting plasma glucose 100–<126 mg/dL or 2-hour plasma glucose 140–<200 mg/dL; normal glucose is defined as A1c <5.7% and fasting plasma glucose <100 mg/dL and 2-hour plasma glucose <140 mg/dL.
SOURCE: National Health and Nutrition Examination Surveys 2007–2010
APPENDIX 10.6. Percent of Calories From Protein, by Diabetes Status and Demographic Characteristics, U.S., 2007–2010
CHARACTERISTICS
PERCENT (STANDARD ERROR)
Diagnosed Diabetes*N=1,369
Undiagnosed Diabetes (Clinical Definition)†
N=441
Undiagnosed Diabetes (Research Definition)‡
N=608Prediabetes‡
N=1,792Normal Glucose‡
N=1,701
Total 17.2 (0.23) 15.9 (0.34) 16.2 (0.35) 15.6 (0.16) 15.7 (0.15)
Age (years)20–44 17.5 (0.76) 16.7 (1.00) 17.1 (0.93) 15.0 (0.17) 15.6 (0.18)45–64 17.3 (0.33) 15.7 (0.38) 16.1 (0.46) 15.9 (0.24) 15.7 (0.34)≥65 17.0 (0.24) 15.8 (0.45) 16.0 (0.29) 15.7 (0.26) 16.3 (0.45)
SexMen 17.4 (0.23) 15.8 (0.32) 15.9 (0.36) 15.7 (0.25) 16.2 (0.25)Women 16.9 (0.36) 16.0 (0.51) 16.5 (0.46) 15.4 (0.21) 15.2 (0.19)
Race/ethnicityNon-Hispanic white 17.0 (0.29) 15.5 (0.43) 16.1 (0.45) 15.5 (0.19) 15.6 (0.21)Non-Hispanic black 17.0 (0.33) 16.8 (0.97) 16.6 (0.92) 15.2 (0.33) 15.1 (0.35)Hispanic 17.5 (0.39) 16.2 (0.38) 16.3 (0.42) 15.9 (0.28) 15.5 (0.19)
Mexican American 17.2 (0.31) 16.0 (0.59) 15.8 (0.44) 16.2 (0.39) 15.4 (0.28)Other Hispanic 17.9 (1.01) 16.7 (0.68) 16.9 (0.84) 15.4 (0.31) 15.7 (0.25)
Education<9th grade 17.6 (0.45) 16.5 (0.70) 16.1 (0.46) 15.5 (0.34) 15.2 (0.37)Some high school 17.5 (0.47) 16.5 (0.80) 16.2 (0.69) 15.6 (0.38) 15.1 (0.40)High school graduate 16.7 (0.47) 15.7 (0.61) 16.7 (0.56) 14.9 (0.22) 15.2 (0.27)Some college 17.0 (0.35) 15.1 (0.57) 15.3 (0.59) 15.5 (0.27) 15.4 (0.28)College graduate 17.5 (0.42) 16.4 (0.46) 17.1 (0.54) 16.2 (0.32) 16.4 (0.26)
Protein intake is based on 24-hour dietary recall. Conversions for A1c and glucose values are provided in Diabetes in America Appendix 1 Conversions. A1c, glycosylated hemoglobin.* Diagnosed diabetes is based on self-report.† Undiagnosed diabetes (clinical definition) is defined as A1c ≥6.5% or fasting plasma glucose ≥126 mg/dL.‡ Undiagnosed diabetes (research definition) is defined as A1c ≥6.5% or fasting plasma glucose ≥126 mg/dL or 2-hour plasma glucose ≥200 mg/dL; prediabetes is defined as
A1c 5.7%–<6.5% or fasting plasma glucose 100–<126 mg/dL or 2-hour plasma glucose 140–<200 mg/dL; normal glucose is defined as A1c <5.7% and fasting plasma glucose <100 mg/dL and 2-hour plasma glucose <140 mg/dL.
SOURCE: National Health and Nutrition Examination Surveys 2007–2010

10–26
DIABETES IN AMERICA, 3rd Edition
APPENDIX 10.7. Mean Protein Intake, by Diabetes Status and Demographic Characteristics, U.S., 2007–2010
CHARACTERISTICS
MEAN (STANDARD ERROR)
Diagnosed Diabetes*N=1,369
Undiagnosed Diabetes (Clinical Definition)†
N=441
Undiagnosed Diabetes (Research Definition)‡
N=608Prediabetes‡
N=1,792Normal Glucose‡
N=1,701
Total 76.9 (1.50) 78.5 (2.26) 80.3 (2.52) 83.3 (1.41) 85.3 (1.60)
Age (years)20–44 93.2 (3.68) 95.4 (6.64) 92.2 (6.36) 90.1 (2.92) 88.0 (1.74)45–64 80.9 (2.74) 87.5 (4.55) 84.9 (3.92) 85.2 (2.02) 82.3 (3.02)≥65 67.8 (1.42) 66.5 (2.57) 66.8 (2.08) 68.0 (2.19) 71.2 (3.05)
SexMen 90.3 (2.17) 92.2 (3.63) 90.6 (3.24) 97.6 (2.12) 106.4 (2.72)Women 64.0 (1.52) 61.3 (1.40) 65.9 (2.31) 67.1 (1.33) 68.9 (1.32)
Race/ethnicityNon-Hispanic white 79.3 (2.01) 81.0 (3.76) 79.3 (3.08) 83.6 (2.07) 87.1 (1.93)Non-Hispanic black 73.5 (3.51) 72.4 (3.89) 73.4 (3.65) 79.9 (2.39) 78.1 (2.19)Hispanic 74.3 (2.02) 88.7 (4.51) 81.0 (3.16) 86.0 (1.71) 83.1 (2.32)
Mexican American 75.9 (2.96) 89.7 (6.73) 82.0 (4.27) 92.8 (1.94) 84.2 (3.73)Other Hispanic 71.3 (4.16) 87.1 (10.29) 79.3 (6.96) 72.7 (2.98) 81.3 (2.61)
Education<9th grade 67.5 (3.72) 78.7 (8.18) 70.5 (4.82) 76.9 (3.14) 74.6 (3.54)Some high school 76.5 (3.92) 72.2 (5.00) 68.1 (2.71) 89.0 (5.57) 87.8 (4.45)High school graduate 72.7 (2.89) 79.1 (4.12) 81.1 (3.20) 80.9 (2.58) 80.2 (2.34)Some college 79.9 (2.39) 81.0 (3.78) 78.6 (3.85) 82.1 (2.02) 84.3 (2.55)College graduate 87.2 (4.00) 89.1 (6.02) 88.4 (4.43) 85.7 (1.91) 89.7 (2.75)
Protein intake (grams) is based on 24-hour dietary recall. Conversions for A1c and glucose values are provided in Diabetes in America Appendix 1 Conversions. A1c, glycosylated hemoglobin.* Diagnosed diabetes is based on self-report.† Undiagnosed diabetes (clinical definition) is defined as A1c ≥6.5% or fasting plasma glucose ≥126 mg/dL.‡ Undiagnosed diabetes (research definition) is defined as A1c ≥6.5% or fasting plasma glucose ≥126 mg/dL or 2-hour plasma glucose ≥200 mg/dL; prediabetes is defined as
A1c 5.7%–<6.5% or fasting plasma glucose 100–<126 mg/dL or 2-hour plasma glucose 140–<200 mg/dL; normal glucose is defined as A1c <5.7% and fasting plasma glucose <100 mg/dL and 2-hour plasma glucose <140 mg/dL.
SOURCE: National Health and Nutrition Examination Surveys 2007–2010
APPENDIX 10.8. Percent of Calories From Saturated Fat, by Diabetes Status and Demographic Characteristics, U.S., 2007–2010
CHARACTERISTICS
PERCENT (STANDARD ERROR)
Diagnosed Diabetes*N=1,369
Undiagnosed Diabetes (Clinical Definition)†
N=441
Undiagnosed Diabetes (Research Definition)‡
N=608Prediabetes‡
N=1,792Normal Glucose‡
N=1,701
Total 11.4 (0.17) 11.5 (0.26) 11.3 (0.27) 11.0 (0.10) 10.8 (0.14)
Age (years)20–44 11.7 (0.30) 11.1 (0.72) 11.1 (1.01) 10.8 (0.18) 10.8 (0.13)45–64 11.4 (0.25) 11.5 (0.43) 11.5 (0.29) 11.4 (0.16) 11.0 (0.34)≥65 11.4 (0.21) 11.5 (0.32) 11.1 (0.28) 10.7 (0.19) 10.6 (0.29)
SexMen 11.5 (0.23) 11.6 (0.34) 11.5 (0.42) 11.0 (0.15) 10.9 (0.19)Women 11.3 (0.22) 11.2 (0.45) 11.0 (0.31) 11.1 (0.14) 10.7 (0.17)
Race/ethnicityNon-Hispanic white 12.1 (0.18) 11.9 (0.35) 11.7 (0.35) 11.5 (0.11) 11.1 (0.17)Non-Hispanic black 10.5 (0.19) 10.9 (0.48) 11.0 (0.48) 10.5 (0.22) 10.5 (0.23)Hispanic 10.5 (0.24) 10.4 (0.58) 9.7 (0.41) 9.9 (0.15) 10.0 (0.19)
Mexican American 10.7 (0.37) 10.2 (0.48) 9.6 (0.43) 10.1 (0.24) 10.0 (0.24)Other Hispanic 10.1 (0.24) 10.6 (1.34) 9.9 (0.85) 9.7 (0.36) 10.0 (0.36)
Education<9th grade 10.9 (0.41) 10.6 (0.60) 10.1 (0.57) 9.5 (0.32) 10.0 (0.87)Some high school 11.6 (0.40) 10.6 (0.49) 10.6 (0.32) 11.4 (0.35) 10.5 (0.30)High school graduate 11.3 (0.22) 12.0 (0.50) 11.7 (0.44) 11.2 (0.26) 10.8 (0.16)Some college 11.6 (0.25) 11.0 (0.32) 10.9 (0.35) 11.0 (0.19) 11.1 (0.27)College graduate 11.5 (0.32) 12.6 (0.94) 12.4 (0.78) 11.2 (0.27) 10.8 (0.22)
Saturated fat intake is based on 24-hour dietary recall. Conversions for A1c and glucose values are provided in Diabetes in America Appendix 1 Conversions. A1c, glycosylated hemoglobin.* Diagnosed diabetes is based on self-report.† Undiagnosed diabetes (clinical definition) is defined as A1c ≥6.5% or fasting plasma glucose ≥126 mg/dL.‡ Undiagnosed diabetes (research definition) is defined as A1c ≥6.5% or fasting plasma glucose ≥126 mg/dL or 2-hour plasma glucose ≥200 mg/dL; prediabetes is defined as
A1c 5.7%–<6.5% or fasting plasma glucose 100–<126 mg/dL or 2-hour plasma glucose 140–<200 mg/dL; normal glucose is defined as A1c <5.7% and fasting plasma glucose <100 mg/dL and 2-hour plasma glucose <140 mg/dL.
SOURCE: National Health and Nutrition Examination Surveys 2007–2010

Lifestyle Characteristics Among People With Diabetes and Prediabetes
10–27
APPENDIX 10.9. Mean Total Saturated Fat Intake, by Diabetes Status and Demographic Characteristics, U.S., 2007–2010
CHARACTERISTICS
MEAN (STANDARD ERROR)
Diagnosed Diabetes*N=1,369
Undiagnosed Diabetes (Clinical Definition)†
N=441
Undiagnosed Diabetes (Research Definition)‡
N=608Prediabetes‡
N=1,792Normal Glucose‡
N=1,701
Total 24.1 (0.63) 25.4 (0.91) 26.8 (1.08) 27.4 (0.60) 27.2 (0.62)
Age (years)20–44 29.4 (1.61) 30.2 (3.10) 28.7 (3.30) 29.8 (1.25) 27.9 (0.66)45–64 25.5 (1.25) 29.9 (2.11) 28.7 (1.68) 28.4 (0.75) 26.9 (1.27)≥65 21.0 (0.58) 21.9 (0.98) 20.9 (0.92) 21.2 (0.74) 21.7 (1.03)
SexMen 27.9 (0.96) 31.1 (1.78) 30.1 (1.70) 31.8 (0.89) 33.2 (1.08)Women 20.4 (0.54) 20.0 (0.81) 20.5 (1.06) 22.4 (0.50) 22.6 (0.55)
Race/ethnicityNon-Hispanic white 26.1 (0.83) 28.8 (1.63) 26.9 (1.25) 28.6 (0.81) 28.4 (0.69)Non-Hispanic black 21.5 (1.05) 22.4 (1.26) 22.6 (1.07) 25.6 (1.02) 25.8 (0.74)Hispanic 21.1 (1.20) 25.0 (1.99) 21.7 (1.23) 24.7 (0.79) 24.8 (1.04)
Mexican American 22.3 (1.61) 26.0 (2.70) 22.6 (1.61) 26.6 (1.07) 25.3 (1.44)Other Hispanic 18.8 (0.83) 23.3 (3.01) 20.2 (2.00) 21.0 (1.35) 23.9 (1.43)
Education<9th grade 19.6 (1.44) 22.0 (2.02) 19.2 (1.47) 21.3 (1.27) 23.2 (2.87)Some high school 23.9 (1.58) 21.3 (1.38) 20.4 (1.11) 29.9 (2.52) 28.3 (1.68)High school graduate 23.1 (0.98) 28.0 (1.69) 26.6 (1.06) 27.9 (1.08) 26.1 (0.86)Some college 26.0 (1.06) 27.3 (1.37) 26.2 (1.56) 26.8 (0.89) 28.1 (1.09)College graduate 26.6 (1.24) 32.0 (4.31) 30.7 (3.06) 27.9 (1.11) 27.2 (0.90)
Saturated fat intake (grams) is based on 24-hour dietary recall. Conversions for A1c and glucose values are provided in Diabetes in America Appendix 1 Conversions. A1c, glyco-sylated hemoglobin.* Diagnosed diabetes is based on self-report.† Undiagnosed diabetes (clinical definition) is defined as A1c ≥6.5% or fasting plasma glucose ≥126 mg/dL.‡ Undiagnosed diabetes (research definition) is defined as A1c ≥6.5% or fasting plasma glucose ≥126 mg/dL or 2-hour plasma glucose ≥200 mg/dL; prediabetes is defined as
A1c 5.7%–<6.5% or fasting plasma glucose 100–<126 mg/dL or 2-hour plasma glucose 140–<200 mg/dL; normal glucose is defined as A1c <5.7% and fasting plasma glucose <100 mg/dL and 2-hour plasma glucose <140 mg/dL.
SOURCE: National Health and Nutrition Examination Surveys 2007–2010
APPENDIX 10.10. Mean Total Cholesterol Intake, by Diabetes Status and Demographic Characteristics, U.S., 2007–2010
CHARACTERISTICS
MEAN (STANDARD ERROR)
Diagnosed Diabetes*N=1,369
Undiagnosed Diabetes (Clinical Definition)†
N=441
Undiagnosed Diabetes (Research Definition)‡
N=608Prediabetes‡
N=1,792Normal Glucose‡
N=1,701
Total 256 (8.1) 286 (23.4) 282 (29.1) 303 (8.6) 292 (13.8)
Age (years)20–44 286 (18.4) 374 (54.5) 438 (99.8) 334 (15.7) 309 (17.9)45–64 267 (16.0) 296 (45.1) 287 (31.2) 318 (15.9) 273 (14.1)≥65 233 (11.3) 246 (28.6) 220 (17.1) 221 (21.1) 191 (28.5)
SexMen 296 (15.4) 329 (39.3) 349 (48.1) 362 (15.5) 379 (22.6)Women 219 (9.0) 223 (14.9) 209 (15.6) 238 (11.4) 222 (11.4)
Race/ethnicityNon-Hispanic white 250 (11.7) 300 (32.3) 296 (39.2) 298 (12.5) 280 (16.8)Non-Hispanic black 275 (11.2) 247 (26.0) 240 (22.5) 325 (21.4) 303 (21.8)Hispanic 292 (23.8) 301 (42.0) 268 (26.2) 316 (15.8) 315 (35.0)
Mexican American 332 (28.9) 303 (42.6) 284 (31.2) 353 (21.8) 335 (52.7)Other Hispanic 220 (38.1) 299 (75.2) 247 (48.1) 238 (24.5) 285 (43.6)
Education<9th grade 267 (13.1) 303 (54.5) 274 (40.6) 278 (25.8) 339 (77.2)Some high school 257 (17.3) 244 (24.9) 230 (15.2) 388 (38.5) 288 (21.3)High school graduate 255 (21.5) 319 (34.5) 285 (23.2) 284 (23.7) 284 (15.1)Some college 272 (18.2) 319 (36.3) 309 (23.9) 309 (22.5) 290 (31.1)College graduate 219 (19.7) 169 (39.1) 289 (124.8)1 275 (12.7) 294 (34.6)
Cholesterol intake (mg) is based on 24-hour dietary recall. Conversions for A1c and glucose values are provided in Diabetes in America Appendix 1 Conversions. A1c, glycosylated hemoglobin.* Diagnosed diabetes is based on self-report.† Undiagnosed diabetes (clinical definition) is defined as A1c ≥6.5% or fasting plasma glucose ≥126 mg/dL.‡ Undiagnosed diabetes (research definition) is defined as A1c ≥6.5% or fasting plasma glucose ≥126 mg/dL or 2-hour plasma glucose ≥200 mg/dL; prediabetes is defined as
A1c 5.7%–<6.5% or fasting plasma glucose 100–<126 mg/dL or 2-hour plasma glucose 140–<200 mg/dL; normal glucose is defined as A1c <5.7% and fasting plasma glucose <100 mg/dL and 2-hour plasma glucose <140 mg/dL.
1 Relative standard error >40%–50%
SOURCE: National Health and Nutrition Examination Surveys 2007–2010

10–28
DIABETES IN AMERICA, 3rd Edition
APPENDIX 10.11. Grams of Dietary Fiber Per 1,000 Calories Consumed, by Diabetes Status and Demographic Characteristics, U.S., 2007–2010
CHARACTERISTICS
GRAMS (STANDARD ERROR)
Diagnosed Diabetes*N=1,369
Undiagnosed Diabetes (Clinical Definition)†
N=441
Undiagnosed Diabetes (Research Definition)‡
N=608Prediabetes‡
N=1,792Normal Glucose‡
N=1,701
Total 9.1 (0.25) 8.4 (0.31) 8.4 (0.32) 8.0 (0.17) 8.0 (0.19)
Age (years)20–44 7.2 (0.41) 7.0 (0.62) 6.9 (0.66) 7.0 (0.24) 7.5 (0.22)45–64 8.9 (0.45) 8.1 (0.49) 8.0 (0.46) 7.9 (0.27) 8.6 (0.23)≥65 9.9 (0.28) 9.3 (0.51) 9.3 (0.38) 9.8 (0.19) 10.2 (0.47)
SexMen 9.2 (0.46) 7.7 (0.29) 7.6 (0.27) 7.4 (0.18) 7.2 (0.21)Women 9.0 (0.21) 9.6 (0.56) 9.1 (0.40) 8.6 (0.21) 8.6 (0.25)
Race/ethnicityNon-Hispanic white 9.2 (0.40) 8.3 (0.45) 8.2 (0.41) 7.9 (0.22) 8.1 (0.27)Non-Hispanic black 8.1 (0.16) 7.6 (0.38) 7.2 (0.41) 7.1 (0.33) 6.2 (0.16)Hispanic 9.5 (0.34) 9.5 (0.47) 9.8 (0.43) 8.8 (0.20) 8.6 (0.22)
Mexican American 10.0 (0.47) 9.7 (0.35) 10.6 (0.49) 9.1 (0.26) 8.8 (0.30)Other Hispanic 8.6 (0.53) 9.2 (1.15) 8.6 (0.77) 8.1 (0.37) 8.3 (0.37)
Education<9th grade 9.4 (0.42) 9.9 (0.73) 10.5 (0.53) 9.1 (0.34) 9.1 (0.40)Some high school 7.9 (0.31) 9.4 (0.92) 8.8 (0.55) 6.7 (0.22) 7.1 (0.28)High school graduate 8.7 (0.33) 7.4 (0.49) 7.6 (0.43) 7.4 (0.26) 7.1 (0.30)Some college 9.1 (0.24) 8.2 (0.43) 8.0 (0.44) 7.8 (0.27) 7.6 (0.23)College graduate 10.9 (1.15) 8.6 (0.61) 8.4 (0.64) 9.1 (0.36) 9.0 (0.30)
Dietary fiber intake (grams) is based on 24-hour dietary recall. Conversions for A1c and glucose values are provided in Diabetes in America Appendix 1 Conversions. A1c, glyco-sylated hemoglobin.* Diagnosed diabetes is based on self-report.† Undiagnosed diabetes (clinical definition) is defined as A1c ≥6.5% or fasting plasma glucose ≥126 mg/dL.‡ Undiagnosed diabetes (research definition) is defined as A1c ≥6.5% or fasting plasma glucose ≥126 mg/dL or 2-hour plasma glucose ≥200 mg/dL; prediabetes is defined as
A1c 5.7%–<6.5% or fasting plasma glucose 100–<126 mg/dL or 2-hour plasma glucose 140–<200 mg/dL; normal glucose is defined as A1c <5.7% and fasting plasma glucose <100 mg/dL and 2-hour plasma glucose <140 mg/dL.
SOURCE: National Health and Nutrition Examination Surveys 2007–2010
APPENDIX 10.12. Mean Dietary Fiber Intake, by Diabetes Status and Demographic Characteristics, U.S., 2007–2010
CHARACTERISTICS
MEAN (STANDARD ERROR)
Diagnosed Diabetes*N=1,369
Undiagnosed Diabetes (Clinical Definition)†
N=441
Undiagnosed Diabetes (Research Definition)‡
N=608Prediabetes‡
N=1,792Normal Glucose‡
N=1,701
Total 15.7 (0.44) 15.9 (0.55) 16.7 (0.64) 16.3 (0.39) 16.7 (0.48)
Age (years)20–44 15.1 (1.13) 16.3 (1.30) 14.9 (1.50) 16.1 (0.54) 16.3 (0.59)45–64 16.1 (0.80) 18.1 (0.91) 16.9 (0.91) 16.2 (0.58) 17.4 (0.50)≥65 15.3 (0.27) 15.2 (0.78) 15.3 (0.58) 16.7 (0.59) 17.3 (1.07)
SexMen 17.9 (0.78) 17.9 (0.85) 17.1 (0.77) 17.7 (0.39) 18.4 (0.64)Women 13.5 (0.29) 14.8 (0.96) 14.6 (0.76) 14.6 (0.48) 15.3 (0.50)
Race/ethnicityNon-Hispanic white 16.4 (0.70) 16.6 (0.99) 15.7 (0.69) 16.0 (0.56) 17.2 (0.64)Non-Hispanic black 13.4 (0.56) 12.6 (0.63) 12.3 (0.74) 14.5 (0.54) 12.5 (0.49)Hispanic 15.4 (0.52) 20.9 (1.37) 19.6 (1.06) 18.5 (0.59) 17.8 (0.55)
Mexican American 16.6 (0.69) 21.8 (1.75) 21.6 (1.38) 20.5 (0.71) 18.7 (0.62)Other Hispanic 13.3 (0.66) 19.3 (3.69) 16.3 (2.35) 14.6 (0.69) 16.5 (0.73)
Education<9th grade 13.8 (0.53) 18.1 (1.39) 17.9 (1.03) 17.1 (0.86) 17.5 (1.13)Some high school 13.1 (0.63) 16.2 (1.78) 14.7 (1.00) 13.9 (0.53) 15.9 (0.82)High school graduate 14.3 (0.46) 14.3 (0.78) 14.4 (0.83) 15.2 (0.59) 14.3 (0.58)Some college 16.8 (0.60) 17.4 (1.12) 15.9 (0.98) 15.9 (0.47) 15.9 (0.50)College graduate 20.1 (2.04) 19.0 (1.91) 17.8 (1.72) 18.6 (0.76) 18.9 (0.82)
Dietary fiber intake (grams) is based on 24-hour dietary recall. Conversions for A1c and glucose values are provided in Diabetes in America Appendix 1 Conversions. A1c, glyco-sylated hemoglobin. * Diagnosed diabetes is based on self-report.† Undiagnosed diabetes (clinical definition) is defined as A1c ≥6.5% or fasting plasma glucose ≥126 mg/dL.‡ Undiagnosed diabetes (research definition) is defined as A1c ≥6.5% or fasting plasma glucose ≥126 mg/dL or 2-hour plasma glucose ≥200 mg/dL; prediabetes is defined as
A1c 5.7%–<6.5% or fasting plasma glucose 100–<126 mg/dL or 2-hour plasma glucose 140–<200 mg/dL; normal glucose is defined as A1c <5.7% and fasting plasma glucose <100 mg/dL and 2-hour plasma glucose <140 mg/dL.
SOURCE: National Health and Nutrition Examination Surveys 2007–2010

Lifestyle Characteristics Among People With Diabetes and Prediabetes
10–29
APPENDIX 10.13. Prevalence of Current Alcohol Consumption, by Diabetes Status and Demographic Characteristics, U.S., 2009–2010
CHARACTERISTICS
PERCENT (STANDARD ERROR)
DiabetesN=5,399
No DiabetesN=48,575
Age (years)18–44 60.9 (2.57) 70.6 (0.44)45–64 50.8 (1.32) 68.5 (0.52)≥65 33.8 (1.30) 49.9 (0.73)
SexMen 54.8 (1.27) 72.7 (0.43)Women 36.6 (1.15) 61.5 (0.45)
Race/ethnicityNon-Hispanic white 48.0 (1.12) 71.8 (0.41)Non-Hispanic black 41.5 (1.80) 56.7 (0.81)All Hispanic 44.2 (2.00) 57.5 (0.65)
Mexican American 43.5 (2.46) 57.3 (0.83)Other Hispanic 45.5 (3.24) 58.0 (1.07)
Non-Hispanic Asian 34.5 (3.44) 48.9 (1.14)
EducationElementary 23.9 (1.95) 38.8 (1.14)Some high school 34.5 (2.33) 51.1 (0.96)High school graduate 43.5 (1.56) 61.6 (0.58)Some college 52.1 (1.78) 70.5 (0.52)College graduate 63.2 (1.91) 77.9 (0.48)
Diabetes status is based on self-report.
SOURCE: National Health Interview Surveys 2009–2010
APPENDIX 10.14. Alcohol Consumption and Consumption Status Among Adults Age ≥18 Years, by Diabetes Status, U.S., 2009–2010
DIABETES PREDIABETES NORMAL GLUCOSE
N Percent (SE) N Percent (SE) N Percent (SE)
Drinking*Current drinker 5,399 45.9 (0.85) 2,211 65.5 (1.32) 46,366 66.9 (0.36)Binge drinker† 2,238 23.4 (1.14) 1,362 29.4 (1.62) 29,552 37.0 (0.44)
Mean drinks, per day [mean (SE)] 2,252 2.3 (0.08) 1,372 2.3 (0.06) 29,825 2.6 (0.02)
Drinking Status 5,389 2,207 46,191None 54.2 (0.85) 34.5 (1.33) 33.2 (0.36)Light/infrequent 35.9 (0.82) 46.8 (1.30) 44.8 (0.32)Moderate 7.8 (0.46) 14.0 (0.87) 16.4 (0.27)Heavy 2.1 (0.27) 4.7 (0.57) 5.6 (0.16)
Diabetes status is based on self-report. SE, standard error.* A drink is defined as 12 oz. of beer, a 5 oz. glass of wine, or 1.5 oz. of liquor.† Binge drinker is defined as reporting five or more drinks on at least one day in the past year.
SOURCE: National Health Interview Surveys 2009–2010
APPENDIX 10.15. Mean Alcohol Intake, by Diabetes Status and Demographic Characteristics, U.S., 2007–2010
CHARACTERISTICS
MEAN (STANDARD ERROR)
Diagnosed Diabetes*N=1,369
Undiagnosed Diabetes (Clinical Definition)†
N=441
Undiagnosed Diabetes (Research Definition)‡
N=608Prediabetes‡
N=1,792Normal Glucose‡
N=1,701
Total 6.1 (0.99) 9.3 (1.64) 6.8 (1.00) 8.9 (0.74) 12.8 (1.01)
Age (years)20–44 12.8 (2.93) 6.0 (1.84)1 13.9 (3.46) 9.7 (1.21) 14.2 (1.22)45–64 7.2 (1.65) 7.4 (1.82) 9.5 (2.55) 10.0 (1.03) 10.9 (1.47)≥65 3.1 (0.60) 6.3 (1.81) 7.3 (1.50) 5.1 (0.73) 7.4 (1.88)
SexMen 10.4 (1.63) 9.3 (1.21) 13.6 (2.35) 12.0 (1.21) 18.3 (2.08)Women 2.1 (0.61) 2.8 (1.21)2 4.8 (1.16) 5.3 (0.68) 8.6 (0.94)
Race/ethnicityNon-Hispanic white 6.8 (1.42) 5.9 (1.03) 9.3 (1.80) 8.8 (0.95) 14.0 (1.21)Non-Hispanic black 4.9 (1.03) 11.7 (4.57)1 11.7 (4.39)1 9.6 (1.54) 13.3 (1.44)Hispanic 7.2 (2.10) 7.3 (1.81) 9.2 (3.26)1 9.5 (1.57) 9.8 (1.37)
Mexican American 8.9 (2.63) 6.8 (2.18)1 9.2 (4.05)2 8.9 (2.23) 10.9 (1.98)Other Hispanic 3.9 (1.62)2 8.0 (2.90)1 3 10.6 (2.31) 8.2 (1.77)
Appendix 10.15 continues on the next page.
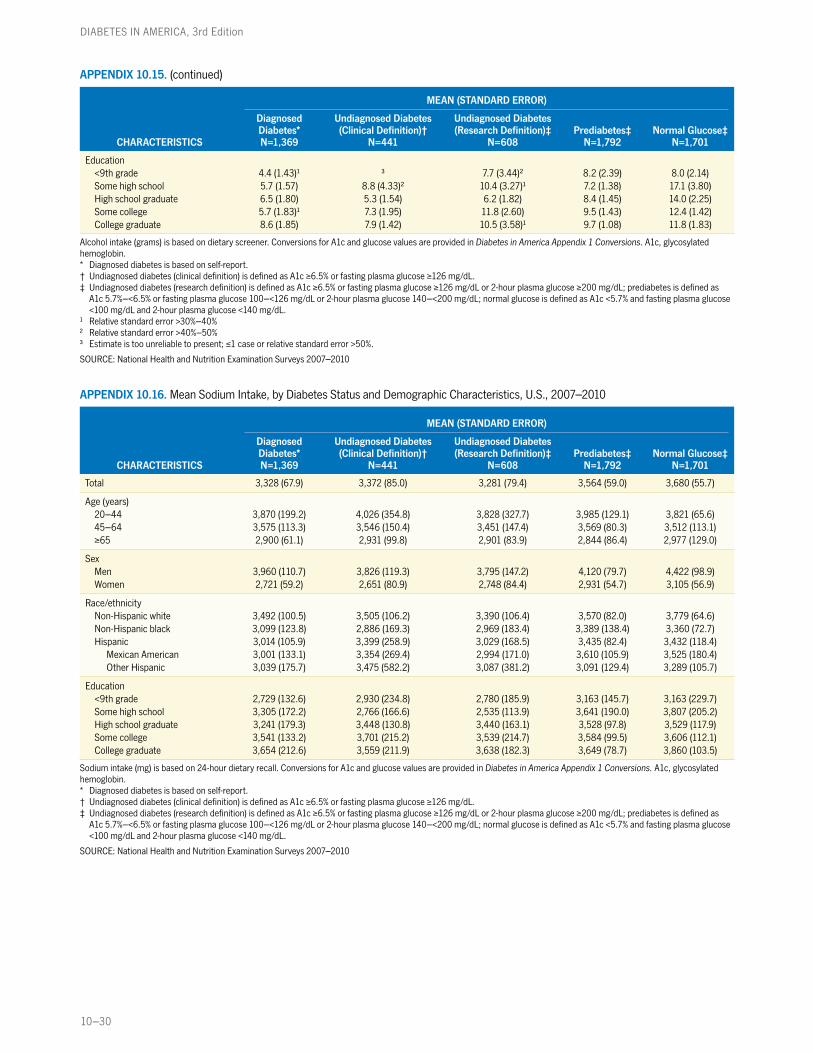
10–30
DIABETES IN AMERICA, 3rd Edition
APPENDIX 10.15. (continued)
CHARACTERISTICS
MEAN (STANDARD ERROR)
Diagnosed Diabetes*N=1,369
Undiagnosed Diabetes (Clinical Definition)†
N=441
Undiagnosed Diabetes (Research Definition)‡
N=608Prediabetes‡
N=1,792Normal Glucose‡
N=1,701
Education<9th grade 4.4 (1.43)1 3 7.7 (3.44)2 8.2 (2.39) 8.0 (2.14)Some high school 5.7 (1.57) 8.8 (4.33)2 10.4 (3.27)1 7.2 (1.38) 17.1 (3.80)High school graduate 6.5 (1.80) 5.3 (1.54) 6.2 (1.82) 8.4 (1.45) 14.0 (2.25)Some college 5.7 (1.83)1 7.3 (1.95) 11.8 (2.60) 9.5 (1.43) 12.4 (1.42)College graduate 8.6 (1.85) 7.9 (1.42) 10.5 (3.58)1 9.7 (1.08) 11.8 (1.83)
Alcohol intake (grams) is based on dietary screener. Conversions for A1c and glucose values are provided in Diabetes in America Appendix 1 Conversions. A1c, glycosylated hemoglobin.* Diagnosed diabetes is based on self-report.† Undiagnosed diabetes (clinical definition) is defined as A1c ≥6.5% or fasting plasma glucose ≥126 mg/dL.‡ Undiagnosed diabetes (research definition) is defined as A1c ≥6.5% or fasting plasma glucose ≥126 mg/dL or 2-hour plasma glucose ≥200 mg/dL; prediabetes is defined as
A1c 5.7%–<6.5% or fasting plasma glucose 100–<126 mg/dL or 2-hour plasma glucose 140–<200 mg/dL; normal glucose is defined as A1c <5.7% and fasting plasma glucose <100 mg/dL and 2-hour plasma glucose <140 mg/dL.
1 Relative standard error >30%–40%2 Relative standard error >40%–50%3 Estimate is too unreliable to present; ≤1 case or relative standard error >50%.
SOURCE: National Health and Nutrition Examination Surveys 2007–2010
APPENDIX 10.16. Mean Sodium Intake, by Diabetes Status and Demographic Characteristics, U.S., 2007–2010
CHARACTERISTICS
MEAN (STANDARD ERROR)
Diagnosed Diabetes*N=1,369
Undiagnosed Diabetes (Clinical Definition)†
N=441
Undiagnosed Diabetes (Research Definition)‡
N=608Prediabetes‡
N=1,792Normal Glucose‡
N=1,701
Total 3,328 (67.9) 3,372 (85.0) 3,281 (79.4) 3,564 (59.0) 3,680 (55.7)
Age (years)20–44 3,870 (199.2) 4,026 (354.8) 3,828 (327.7) 3,985 (129.1) 3,821 (65.6)45–64 3,575 (113.3) 3,546 (150.4) 3,451 (147.4) 3,569 (80.3) 3,512 (113.1)≥65 2,900 (61.1) 2,931 (99.8) 2,901 (83.9) 2,844 (86.4) 2,977 (129.0)
SexMen 3,960 (110.7) 3,826 (119.3) 3,795 (147.2) 4,120 (79.7) 4,422 (98.9)Women 2,721 (59.2) 2,651 (80.9) 2,748 (84.4) 2,931 (54.7) 3,105 (56.9)
Race/ethnicityNon-Hispanic white 3,492 (100.5) 3,505 (106.2) 3,390 (106.4) 3,570 (82.0) 3,779 (64.6)Non-Hispanic black 3,099 (123.8) 2,886 (169.3) 2,969 (183.4) 3,389 (138.4) 3,360 (72.7)Hispanic 3,014 (105.9) 3,399 (258.9) 3,029 (168.5) 3,435 (82.4) 3,432 (118.4)
Mexican American 3,001 (133.1) 3,354 (269.4) 2,994 (171.0) 3,610 (105.9) 3,525 (180.4)Other Hispanic 3,039 (175.7) 3,475 (582.2) 3,087 (381.2) 3,091 (129.4) 3,289 (105.7)
Education<9th grade 2,729 (132.6) 2,930 (234.8) 2,780 (185.9) 3,163 (145.7) 3,163 (229.7)Some high school 3,305 (172.2) 2,766 (166.6) 2,535 (113.9) 3,641 (190.0) 3,807 (205.2)High school graduate 3,241 (179.3) 3,448 (130.8) 3,440 (163.1) 3,528 (97.8) 3,529 (117.9)Some college 3,541 (133.2) 3,701 (215.2) 3,539 (214.7) 3,584 (99.5) 3,606 (112.1)College graduate 3,654 (212.6) 3,559 (211.9) 3,638 (182.3) 3,649 (78.7) 3,860 (103.5)
Sodium intake (mg) is based on 24-hour dietary recall. Conversions for A1c and glucose values are provided in Diabetes in America Appendix 1 Conversions. A1c, glycosylated hemoglobin.* Diagnosed diabetes is based on self-report.† Undiagnosed diabetes (clinical definition) is defined as A1c ≥6.5% or fasting plasma glucose ≥126 mg/dL.‡ Undiagnosed diabetes (research definition) is defined as A1c ≥6.5% or fasting plasma glucose ≥126 mg/dL or 2-hour plasma glucose ≥200 mg/dL; prediabetes is defined as
A1c 5.7%–<6.5% or fasting plasma glucose 100–<126 mg/dL or 2-hour plasma glucose 140–<200 mg/dL; normal glucose is defined as A1c <5.7% and fasting plasma glucose <100 mg/dL and 2-hour plasma glucose <140 mg/dL.
SOURCE: National Health and Nutrition Examination Surveys 2007–2010

Lifestyle Characteristics Among People With Diabetes and Prediabetes
10–31
APPENDIX 10.17. Mean Calcium Intake, by Diabetes Status and Demographic Characteristics, U.S., 2007–2010
CHARACTERISTICS
MEAN (STANDARD ERROR)
Diagnosed Diabetes*N=1,369
Undiagnosed Diabetes (Clinical Definition)†
N=441
Undiagnosed Diabetes (Research Definition)‡
N=608Prediabetes‡
N=1,792Normal Glucose‡
N=1,701
Total 876 (21.5) 987 (53.2) 915 (34.3) 958 (24.0) 1,011 (22.1)
Age (years)20–44 1,053 (69.7) 1,034 (110.8) 939 (71.1) 1,038 (45.6) 1,038 (26.5)45–64 892 (37.2) 1,112 (99.9) 1,025 (71.6) 958 (31.0) 981 (38.7)≥65 808 (16.3) 827 (48.8) 800 (41.0) 822 (29.9) 869 (39.6)
SexMen 978 (33.7) 1,093 (80.6) 1,034 (58.9) 1,062 (30.7) 1,175 (34.6)Women 777 (21.6) 818 (33.6) 791 (26.6) 839 (24.2) 883 (22.5)
Race/ethnicityNon-Hispanic white 940 (30.1) 1,060 (82.7) 952 (47.2) 996 (33.8) 1,075 (26.3)Non-Hispanic black 740 (35.1) 710 (44.4) 738 (44.8) 844 (40.1) 801 (23.3)Hispanic 808 (36.5) 1,001 (67.4) 893 (42.6) 935 (26.6) 917 (25.1)
Mexican American 841 (46.3) 1,059 (97.4) 943 (65.2) 976 (35.3) 923 (36.1)Other Hispanic 748 (41.4) 904 (85.1) 812 (58.2) 854 (50.2) 907 (36.6)
Education<9th grade 745 (41.1) 863 (67.9) 822 (49.7) 837 (37.7) 798 (71.8)Some high school 847 (54.9) 792 (63.2) 762 (44.3) 944 (80.5) 945 (69.8)High school graduate 830 (42.1) 946 (57.5) 926 (48.2) 954 (34.1) 938 (35.7)Some college 935 (37.1) 1,010 (71.6) 902 (50.5) 941 (32.2) 1,068 (39.0)College graduate 992 (50.3) 1,273 (181.6) 1,108 (109.6) 1,021 (27.8) 1,046 (35.9)
Calcium intake (mg) is based on 24-hour dietary recall. Conversions for A1c and glucose values are provided in Diabetes in America Appendix 1 Conversions. A1c, glycosylated hemoglobin.* Diagnosed diabetes is based on self-report.† Undiagnosed diabetes (clinical definition) is defined as A1c ≥6.5% or fasting plasma glucose ≥126 mg/dL.‡ Undiagnosed diabetes (research definition) is defined as A1c ≥6.5% or fasting plasma glucose ≥126 mg/dL or 2-hour plasma glucose ≥200 mg/dL; prediabetes is defined as
A1c 5.7%–<6.5% or fasting plasma glucose 100–<126 mg/dL or 2-hour plasma glucose 140–<200 mg/dL; normal glucose is defined as A1c <5.7% and fasting plasma glucose <100 mg/dL and 2-hour plasma glucose <140 mg/dL.
SOURCE: National Health and Nutrition Examination Surveys 2007–2010
APPENDIX 10.18. Mean Vitamin D Intake, by Diabetes Status and Demographic Characteristics, U.S., 2007–2010
CHARACTERISTICS
MEAN (STANDARD ERROR)
Diagnosed Diabetes*N=1,369
Undiagnosed Diabetes (Clinical Definition)†
N=441
Undiagnosed Diabetes (Research Definition)‡
N=608Prediabetes‡
N=1,792Normal Glucose‡
N=1,701
Total 4.4 (0.19) 5.0 (0.36) 5.0 (0.39) 4.7 (0.18) 4.7 (0.16)
Age (years)20–44 4.7 (0.41) 4.6 (0.92) 4.2 (0.57) 4.9 (0.35) 4.6 (0.20)45–64 4.2 (0.34) 5.2 (0.68) 5.2 (0.82) 4.8 (0.26) 4.7 (0.38)≥65 4.7 (0.29) 5.0 (0.34) 5.1 (0.47) 4.5 (0.28) 5.9 (0.53)
SexMen 5.0 (0.30) 5.6 (0.51) 5.4 (0.43) 5.2 (0.28) 5.5 (0.32)Women 3.9 (0.24) 4.1 (0.37) 4.6 (0.53) 4.2 (0.14) 4.1 (0.19)
Race/ethnicityNon-Hispanic white 4.6 (0.25) 5.5 (0.53) 5.4 (0.48) 5.0 (0.22) 4.9 (0.22)Non-Hispanic black 3.7 (0.26) 3.3 (0.26) 3.6 (0.50) 3.8 (0.23) 3.7 (0.39)Hispanic 4.1 (0.28) 4.7 (0.62) 4.4 (0.48) 4.8 (0.42) 4.5 (0.24)
Mexican American 4.2 (0.33) 5.0 (0.87) 4.5 (0.59) 5.2 (0.60) 4.7 (0.30)Other Hispanic 3.8 (0.37) 4.2 (0.61) 4.3 (0.89) 4.1 (0.23) 4.2 (0.34)
Education<9th grade 3.9 (0.31) 4.4 (0.39) 4.4 (0.35) 4.0 (0.26) 4.2 (0.51)Some high school 4.2 (0.24) 4.2 (0.56) 4.9 (0.88) 4.8 (0.55) 4.2 (0.50)High school graduate 4.0 (0.34) 5.4 (0.62) 5.8 (0.71) 4.7 (0.31) 4.2 (0.26)Some college 5.0 (0.53) 5.0 (0.63) 4.3 (0.37) 5.0 (0.44) 4.8 (0.32)College graduate 5.0 (0.75) 5.5 (0.90) 5.4 (0.64) 4.7 (0.21) 5.1 (0.30)
Vitamin D intake (μg) is based on 24-hour dietary recall. Conversions for A1c and glucose values are provided in Diabetes in America Appendix 1 Conversions. A1c, glycosylated hemoglobin.* Diagnosed diabetes is based on self-report.† Undiagnosed diabetes (clinical definition) is defined as A1c ≥6.5% or fasting plasma glucose ≥126 mg/dL.‡ Undiagnosed diabetes (research definition) is defined as A1c ≥6.5% or fasting plasma glucose ≥126 mg/dL or 2-hour plasma glucose ≥200 mg/dL; prediabetes is defined as
A1c 5.7%–<6.5% or fasting plasma glucose 100–<126 mg/dL or 2-hour plasma glucose 140–<200 mg/dL; normal glucose is defined as A1c <5.7% and fasting plasma glucose <100 mg/dL and 2-hour plasma glucose <140 mg/dL.
SOURCE: National Health and Nutrition Examination Surveys 2007–2010
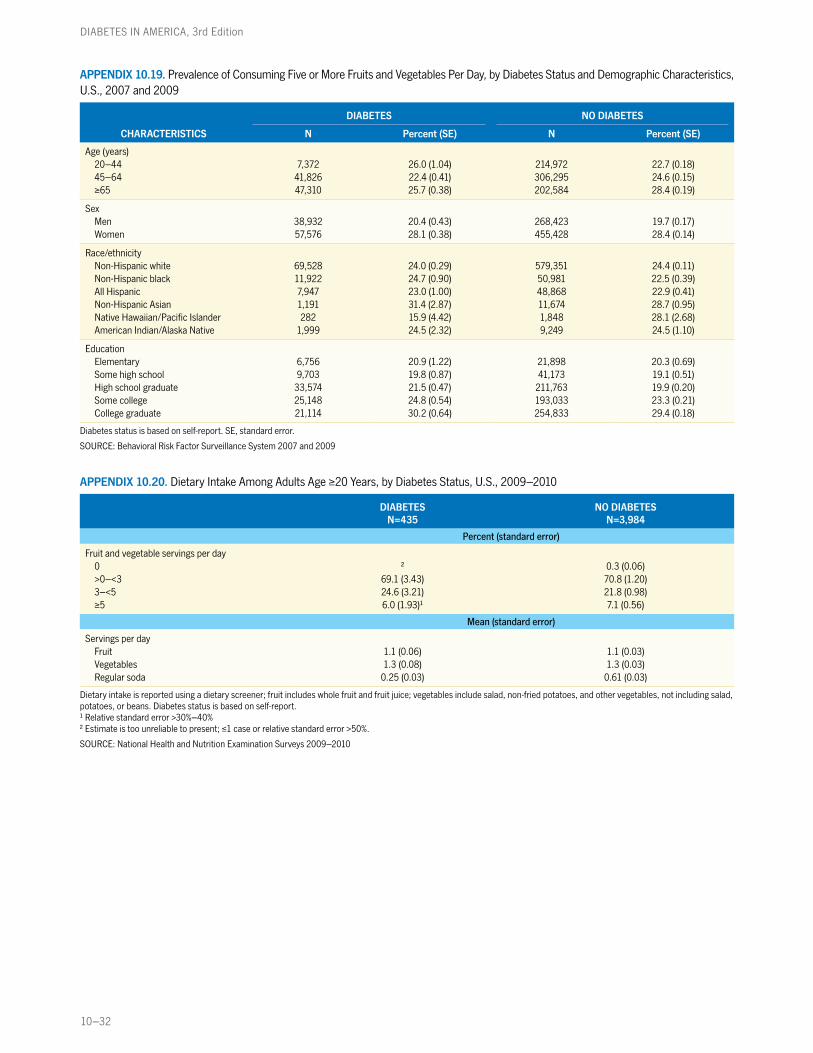
10–32
DIABETES IN AMERICA, 3rd Edition
APPENDIX 10.19. Prevalence of Consuming Five or More Fruits and Vegetables Per Day, by Diabetes Status and Demographic Characteristics, U.S., 2007 and 2009
CHARACTERISTICS
DIABETES NO DIABETES
N Percent (SE) N Percent (SE)
Age (years)20–44 7,372 26.0 (1.04) 214,972 22.7 (0.18)45–64 41,826 22.4 (0.41) 306,295 24.6 (0.15)≥65 47,310 25.7 (0.38) 202,584 28.4 (0.19)
SexMen 38,932 20.4 (0.43) 268,423 19.7 (0.17)Women 57,576 28.1 (0.38) 455,428 28.4 (0.14)
Race/ethnicityNon-Hispanic white 69,528 24.0 (0.29) 579,351 24.4 (0.11)Non-Hispanic black 11,922 24.7 (0.90) 50,981 22.5 (0.39)All Hispanic 7,947 23.0 (1.00) 48,868 22.9 (0.41)Non-Hispanic Asian 1,191 31.4 (2.87) 11,674 28.7 (0.95)Native Hawaiian/Pacific Islander 282 15.9 (4.42) 1,848 28.1 (2.68)American Indian/Alaska Native 1,999 24.5 (2.32) 9,249 24.5 (1.10)
EducationElementary 6,756 20.9 (1.22) 21,898 20.3 (0.69)Some high school 9,703 19.8 (0.87) 41,173 19.1 (0.51)High school graduate 33,574 21.5 (0.47) 211,763 19.9 (0.20)Some college 25,148 24.8 (0.54) 193,033 23.3 (0.21)College graduate 21,114 30.2 (0.64) 254,833 29.4 (0.18)
Diabetes status is based on self-report. SE, standard error.
SOURCE: Behavioral Risk Factor Surveillance System 2007 and 2009
APPENDIX 10.20. Dietary Intake Among Adults Age ≥20 Years, by Diabetes Status, U.S., 2009–2010
DIABETESN=435
NO DIABETESN=3,984
Percent (standard error)
Fruit and vegetable servings per day0 2 0.3 (0.06)>0–<3 69.1 (3.43) 70.8 (1.20)3–<5 24.6 (3.21) 21.8 (0.98)≥5 6.0 (1.93)1 7.1 (0.56)
Mean (standard error)
Servings per dayFruit 1.1 (0.06) 1.1 (0.03)Vegetables 1.3 (0.08) 1.3 (0.03)Regular soda 0.25 (0.03) 0.61 (0.03)
Dietary intake is reported using a dietary screener; fruit includes whole fruit and fruit juice; vegetables include salad, non-fried potatoes, and other vegetables, not including salad, potatoes, or beans. Diabetes status is based on self-report.1 Relative standard error >30%–40%2 Estimate is too unreliable to present; ≤1 case or relative standard error >50%.
SOURCE: National Health and Nutrition Examination Surveys 2009–2010

Lifestyle Characteristics Among People With Diabetes and Prediabetes
10–33
APPENDIX 10.21. Dietary Intake Among Adults ≥20 Years, by Diabetes Status, U.S., 2009–2010
Diagnosed Diabetes*N=435
Undiagnosed Diabetes (Clinical Definition)†
N=150
Undiagnosed Diabetes (Research Definition)‡
N=198Prediabetes‡
N=697Normal Glucose‡
N=835
Percent (standard error)
Fruit and vegetable servings per day0 3 3 3 0.4 (0.19)2 3
>0–<3 69.1 (3.43) 72.7 (3.84) 74.3 (3.34) 77.0 (1.50) 69.1 (2.55)3–<5 24.6 (3.21) 17.7 (3.55) 20.3 (3.64) 17.6 (1.08) 22.2 (1.60)≥5 6.0 (1.93)1 9.5 (3.13)1 5.3 (1.80)1 5.0 (1.30) 8.6 (1.31)
Mean (standard error)
Servings per dayFruit 1.1 (0.06) 1.0 (0.09) 0.9 (0.07) 1.1 (0.10) 1.1 (0.06)Vegetables 1.3 (0.08) 1.4 (0.14) 1.4 (0.10) 1.2 (0.05) 1.4 (0.05)Regular soda 0.3 (0.03) 0.6 (0.12) 0.5 (0.08) 0.6 (0.08) 0.6 (0.07)
Dietary intake is reported using a dietary screener; fruit includes whole fruit and fruit juice; vegetables include salad, non-fried potatoes, and other vegetables, not including salad, potatoes, or beans. Conversions for A1c and glucose values are provided in Diabetes in America Appendix 1 Conversions. A1c, glycosylated hemoglobin.* Diagnosed diabetes is based on self-report.† Undiagnosed diabetes (clinical definition) is defined as A1c ≥6.5% or fasting plasma glucose ≥126 mg/dL.‡ Undiagnosed diabetes (research definition) is defined as A1c ≥6.5% or fasting plasma glucose ≥126 mg/dL or 2-hour plasma glucose ≥200 mg/dL; prediabetes is defined as
A1c 5.7%–<6.5% or fasting plasma glucose 100–<126 mg/dL or 2-hour plasma glucose 140–<200 mg/dL; normal glucose is defined as A1c <5.7% and fasting plasma glucose <100 mg/dL and 2-hour plasma glucose <140 mg/dL.
1 Relative standard error >30%–40%2 Relative standard error >40%–50%3 Estimate is too unreliable to present; ≤1 case or relative standard error >50%.
SOURCE: National Health and Nutrition Examination Surveys 2009–2010
APPENDIX 10.22. Mean Servings of Regular Soda Per Day, by Diabetes Status and Demographic Characteristics, U.S., 2009–2010
CHARACTERISTICS
MEAN (STANDARD ERROR)
Diagnosed Diabetes*N=435
Undiagnosed Diabetes (Clinical Definition)†
N=149
Undiagnosed Diabetes (Research Definition)‡
N=197Prediabetes‡
N=697Normal Glucose‡
N=835
Total 0.3 (0.03) 0.6 (0.12) 0.5 (0.08) 0.6 (0.08) 0.6 (0.07)
Age (years)20–44 0.51 (0.13) 1.08 (0.33)1 0.74 (0.23)1 0.89 (0.11) 0.74 (0.09)45–64 0.21 (0.04) 0.58 (0.18)1 0.43 (0.11) 0.39 (0.07) 0.42 (0.07)≥65 0.16 (0.05)1 0.27 (0.09)1 0.17 (0.06)1 3 3
SexMen 0.17 (0.05) 0.61 (0.17) 0.57 (0.15) 0.64 (0.09) 0.91 (0.10)Women 0.33 (0.04) 0.68 (0.28)2 0.34 (0.10) 0.57 (0.10) 0.39 (0.06)
Race/ethnicityNon-Hispanic white 0.16 (0.05)1 0.74 (0.19) 0.44 (0.10) 0.57 (0.09) 0.65 (0.08)Non-Hispanic black 0.50 (0.14) 0.31 (0.05) 0.40 (0.06) 0.78 (0.16) 0.66 (0.14)Hispanic 0.38 (0.09) 0.64 (0.11) 0.63 (0.10) 0.67 (0.06) 0.59 (0.10)
Mexican American 0.39 (0.13)1 0.77 (0.15) 0.77 (0.13) 0.71 (0.08) 0.64 (0.14)Other Hispanic 0.37 (0.12)1 0.36 (0.11)1 0.30 (0.11)1 0.60 (0.07) 0.51 (0.09)
Other/Multiracial 3 0.11 (0.04)1 3 0.48 (0.19)1 0.39 (0.17)2
Education<9th grade 0.34 (0.15)2 0.55 (0.25)2 0.66 (0.19) 0.98 (0.21) 0.80 (0.16)Some high school 0.55 (0.23)2 0.95 (0.45)2 0.62 (0.29)2 1.05 (0.22) 1.13 (0.18)High school graduate 0.31 (0.06) 0.99 (0.23) 0.71 (0.12) 0.97 (0.10) 1.05 (0.25)Some college 0.13 (0.03) 0.44 (0.09) 0.31 (0.07) 0.45 (0.07) 0.59 (0.10)College graduate 0.06 (0.03)2 3 3 0.15 (0.04) 0.25 (0.04)
Soda servings are based on dietary screener. Conversions for A1c and glucose values are provided in Diabetes in America Appendix 1 Conversions. A1c, glycosylated hemoglobin.* Diagnosed diabetes is based on self-report.† Undiagnosed diabetes (clinical definition) is defined as A1c ≥6.5% or fasting plasma glucose ≥126 mg/dL.‡ Undiagnosed diabetes (research definition) is defined as A1c ≥6.5% or fasting plasma glucose ≥126 mg/dL or 2-hour plasma glucose ≥200 mg/dL; prediabetes is defined as
A1c 5.7%–<6.5% or fasting plasma glucose 100–<126 mg/dL or 2-hour plasma glucose 140–<200 mg/dL; normal glucose is defined as A1c <5.7% and fasting plasma glucose <100 mg/dL and 2-hour plasma glucose <140 mg/dL.
1 Relative standard error >30%–40%2 Relative standard error >40%–50%3 Estimate is too unreliable to present; ≤1 case or relative standard error >50%.
SOURCE: National Health and Nutrition Examination Surveys 2009–2010

10–34
DIABETES IN AMERICA, 3rd Edition
APPENDIX 10.23. Prevalence of Meeting or Exceeding Current Physical Activity Requirements, by Diabetes Status and Demographic Characteristics, U.S., 2009–2010
CHARACTERISTICS
DIABETES NO DIABETES
N Percent (SE) N Percent (SE)
Age (years)18–44 694 36.9 (2.35) 24,155 50.5 (0.49)45–64 2,284 31.2 (1.29) 15,587 44.0 (0.55)≥65 2,121 24.0 (1.25) 8,040 33.1 (0.66)
SexMen 2,339 34.7 (1.28) 21,072 50.7 (0.51)Women 2,760 23.8 (1.11) 26,710 41.4 (0.47)
Race/ethnicityNon-Hispanic white 2,643 30.8 (1.18) 27,955 48.7 (0.46)Non-Hispanic black 1,146 26.8 (1.89) 7,418 39.6 (0.77)All Hispanic 1,011 24.9 (2.08) 9,064 38.8 (0.72)
Mexican American 603 24.5 (2.62) 5,453 38.9 (0.99)Other Hispanic 408 25.6 (3.23) 3,611 38.7 (1.05)
Non-Hispanic Asian 248 32.8 (3.94) 3,004 41.2 (1.32)
EducationElementary 676 16.2 (2.03) 2,873 23.0 (1.09)Some high school 683 20.2 (1.96) 4,638 33.2 (0.90)High school graduate 1,467 25.4 (1.65) 12,516 37.7 (0.59)Some college 1,403 32.4 (1.62) 14,369 48.5 (0.60)College graduate 836 46.4 (2.21) 13,184 58.3 (0.60)
Meets criteria for vigorous (≥75 minutes per week) or moderate or combination of moderate and vigorous activity (≥150 minutes per week). Diabetes status is based on self-report. SE, standard error.
SOURCE: National Health Interview Surveys 2009–2010
APPENDIX 10.24. Prevalence of Physical Activity Among Adults Age ≥18 Years, by Diabetes Status, U.S., 2009–2010
PHYSICAL ACTIVITY
DIABETES PREDIABETES NORMAL GLUCOSE
N Percent (SE) N Percent (SE) N Percent (SE)
Vigorous* 5,099 17.4 (0.76) 2,137 23.7 (1.14) 45,647 33.9 (0.35)
Moderate† 12.0 (0.62) 15.2 (0.97) 12.3 (0.20)
Insufficient 25.7 (0.90) 29.8 (1.28) 23.7 (0.29)
None/Not active 44.9 (0.92) 31.3 (1.26) 30.1 (0.39)
Mean physical activity, minutes per week [mean, (SE)]‡ 2,656 282.6 (15.31) 1,406 298.5 (15.79) 30,784 333.2 (3.81)
Diabetes status is based on self-report. SE, standard error.* ≥75 minutes per week† ≥150 minutes per week; includes combination of moderate and vigorous activity.‡ Mean physical activity: average minutes among persons who report moderate or vigorous physical activity.
SOURCE: National Health Interview Surveys 2009–2010
APPENDIX 10.25. Prevalence of Physical Activity Among Adults Age ≥20 Years, by Diabetes Status, U.S., 2007–2010
PERCENT (STANDARD ERROR)
Diagnosed Diabetes*N=1,480
Undiagnosed Diabetes (Clinical Definition)†
N=465
Undiagnosed Diabetes (Research Definition)‡
N=634Prediabetes‡
N=1,813
Normal Glucose‡N=1,723
Meet physical activity standards§ 36.0 (1.50) 38.3 (3.85) 38.0 (2.45) 55.9 (1.83) 60.9 (1.57)
Less than recommended amount of physical activity 14.5 (1.21) 16.3 (2.26) 18.9 (2.33) 15.5 (0.89) 17.9 (1.27)
No physical activity 49.5 (1.60) 45.4 (3.91) 43.1 (2.98) 28.6 (1.79) 21.2 (1.16)
Conversions for A1c and glucose values are provided in Diabetes in America Appendix 1 Conversions. A1c, glycosylated hemoglobin.* Diagnosed diabetes is based on self-report.† Undiagnosed diabetes (clinical definition) is defined as A1c ≥6.5% or fasting plasma glucose ≥126 mg/dL.‡ Undiagnosed diabetes (research definition) is defined as A1c ≥6.5% or fasting plasma glucose ≥126 mg/dL or 2-hour plasma glucose ≥200 mg/dL; prediabetes is defined as
A1c 5.7%–<6.5% or fasting plasma glucose 100–<126 mg/dL or 2-hour plasma glucose 140–<200 mg/dL; normal glucose is defined as A1c <5.7% and fasting plasma glucose <100 mg/dL and 2-hour plasma glucose <140 mg/dL.
§ ≥150 minutes of moderate or ≥75 minutes of vigorous leisure or work-related physical activity per week; physical activity is self-reported.
SOURCE: National Health and Nutrition Examination Surveys 2007–2010

Lifestyle Characteristics Among People With Diabetes and Prediabetes
10–35
APPENDIX 10.26. Prevalence of Meeting Physical Activity Standards, by Diabetes Status and Demographic Characteristics, U.S., 2007–2010
CHARACTERISTICS
PERCENT (STANDARD ERROR)
Diagnosed Diabetes*N=1,480
Undiagnosed Diabetes (Clinical Definition)†
N=465
Undiagnosed Diabetes (Research Definition)‡
N=634Prediabetes‡
N=1,813Normal Glucose‡
N=1,723
Age (years)20–44 51.7 (5.16) 57.3 (6.97) 55.1 (8.13) 63.7 (2.15) 64.8 (1.65)45–64 36.7 (2.70) 42.1 (6.66) 39.9 (4.25) 55.0 (3.05) 57.8 (2.93)≥65 30.2 (2.08) 27.1 (3.56) 29.5 (3.83) 44.9 (2.62) 36.5 (3.93)
SexMen 45.4 (2.26) 42.4 (5.11) 43.7 (4.00) 65.4 (2.32) 69.9 (2.24)Women 26.7 (1.79) 31.3 (3.86) 31.9 (3.11) 45.2 (2.44) 54.0 (1.92)
Race/ethnicityNon-Hispanic white 38.7 (2.12) 35.3 (4.95) 37.6 (3.20) 58.0 (2.53) 62.7 (2.06)Non-Hispanic black 25.8 (2.68) 41.5 (6.59) 35.2 (6.11) 57.1 (3.01) 51.9 (3.95)Hispanic 31.3 (3.24) 47.4 (5.42) 42.1 (5.14) 50.6 (2.92) 59.5 (1.96)
Mexican American 34.2 (4.87) 43.7 (7.58) 39.5 (7.01) 53.4 (3.11) 59.3 (2.91)Other Hispanic 26.2 (3.70) 54.1 (7.33) 46.3 (5.87) 45.2 (5.07) 59.6 (3.30)
Education<9th grade 17.8 (3.03) 33.8 (6.36) 26.5 (4.81) 42.9 (5.81) 49.3 (5.67)Some high school 26.0 (3.21) 32.3 (5.22) 28.3 (3.63) 52.6 (3.59) 53.9 (5.19)High school graduate 34.2 (2.39) 35.8 (4.50) 40.9 (3.64) 57.4 (2.85) 61.0 (2.30)Some college 46.9 (3.26) 41.8 (6.95) 37.4 (5.01) 58.9 (3.56) 60.5 (3.24)College graduate 45.1 (5.08) 45.6 (8.28) 50.4 (6.54) 57.2 (3.37) 64.7 (2.60)
Physical activity standards are defined as ≥150 minutes moderate or ≥75 minutes vigorous of leisure or work-related physical activity per week; physical activity is self-reported. Conversions for A1c and glucose values are provided in Diabetes in America Appendix 1 Conversions. A1c, glycosylated hemoglobin.* Diagnosed diabetes is based on self-report. † Undiagnosed diabetes (clinical definition) is defined as A1c ≥6.5% or fasting plasma glucose ≥126 mg/dL.‡ Undiagnosed diabetes (research definition) is defined as A1c ≥6.5% or fasting plasma glucose ≥126 mg/dL or 2-hour plasma glucose ≥200 mg/dL; prediabetes is defined as
A1c 5.7%–<6.5% or fasting plasma glucose 100–<126 mg/dL or 2-hour plasma glucose 140–<200 mg/dL; normal glucose is defined as A1c <5.7% and fasting plasma glucose <100 mg/dL and 2-hour plasma glucose <140 mg/dL.
SOURCE: National Health and Nutrition Examination Surveys 2007–2010
APPENDIX 10.27. Mean Minutes Per Day of Physical Activity Among Adults Age ≥20 Years, by Diabetes Status, U.S., 2003–2006
MEAN (STANDARD ERROR)
Diagnosed Diabetes*N=661
Undiagnosed Diabetes (Clinical Definition)†
N=183Prediabetes†
N=1,015Normal Glucose†
N=2,239
Minutes of moderate-vigorous activity per day 11.9 (0.97) 14.7 (1.92) 20.8 (0.90) 28.2 (0.84)
Minutes of light activity per day 241.5 (3.10) 259.2 (9.15) 250.4 (2.72) 227.0 (2.95)
Minutes of being sedentary per day 524.8 (5.29) 522.1 (16.87) 489.5 (3.89) 475.5 (3.09)
Physical activity (minutes/day) is measured objectively using a physical activity monitor. Conversions for A1c and glucose values are provided in Diabetes in America Appendix 1 Conversions. A1c, glycosylated hemoglobin.* Diagnosed diabetes is based on self-report. † Undiagnosed diabetes (clinical definition) is defined as A1c ≥6.5% or fasting plasma glucose ≥126 mg/dL; prediabetes is defined as A1c 5.7%–<6.5% or fasting plasma glucose
100–<126 mg/dL; normal glucose is defined as A1c <5.7% and fasting plasma glucose <100 mg/dL. 2-hour plasma glucose from an oral glucose tolerance test was not avail-able in all years of physical activity measurement.
SOURCE: National Health and Nutrition Examination Surveys 2003–2006
APPENDIX 10.28. Mean Minutes Per Day of Moderate-Vigorous Physical Activity, by Diabetes Status and Demographic Characteristics, U.S., 2003–2006
CHARACTERISTICS
MEAN (STANDARD ERROR)
Diagnosed Diabetes*N=661
Undiagnosed Diabetes (Clinical Definition)†
N=183Prediabetes†
N=1,015Normal Glucose†
N=2,239
Age (years)20–44 19.4 (2.12) 24.1 (3.33) 27.3 (1.73) 32.7 (1.06)45–64 13.5 (1.23) 16.3 (3.14) 21.6 (1.40) 24.7 (1.24)≥65 6.6 (0.99) 7.5 (1.43) 9.6 (1.06) 10.1 (1.40)
SexMen 14.7 (1.39) 18.0 (2.75) 26.6 (1.25) 37.6 (1.53)Women 9.4 (0.77) 9.3 (1.87) 12.9 (0.81) 20.9 (0.70)
Appendix 10.28 continues on the next page.
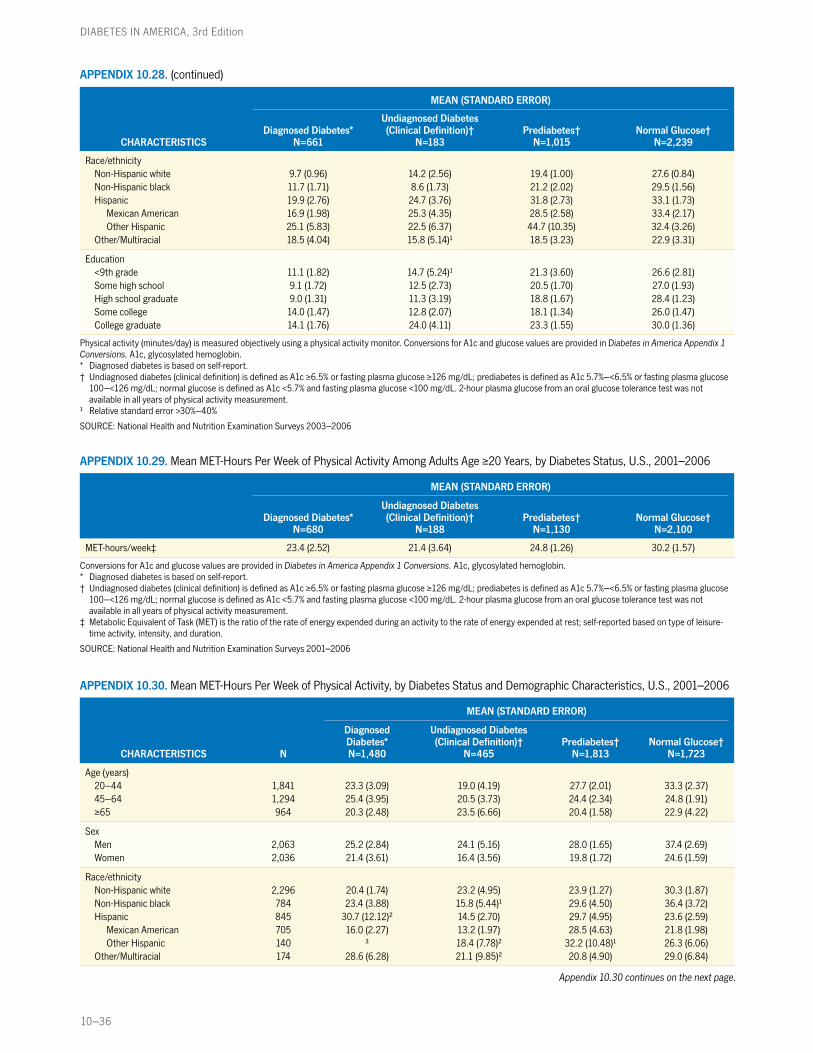
10–36
DIABETES IN AMERICA, 3rd Edition
APPENDIX 10.28. (continued)
CHARACTERISTICS
MEAN (STANDARD ERROR)
Diagnosed Diabetes*N=661
Undiagnosed Diabetes (Clinical Definition)†
N=183Prediabetes†
N=1,015Normal Glucose†
N=2,239
Race/ethnicityNon-Hispanic white 9.7 (0.96) 14.2 (2.56) 19.4 (1.00) 27.6 (0.84)Non-Hispanic black 11.7 (1.71) 8.6 (1.73) 21.2 (2.02) 29.5 (1.56)Hispanic 19.9 (2.76) 24.7 (3.76) 31.8 (2.73) 33.1 (1.73)
Mexican American 16.9 (1.98) 25.3 (4.35) 28.5 (2.58) 33.4 (2.17)Other Hispanic 25.1 (5.83) 22.5 (6.37) 44.7 (10.35) 32.4 (3.26)
Other/Multiracial 18.5 (4.04) 15.8 (5.14)1 18.5 (3.23) 22.9 (3.31)
Education<9th grade 11.1 (1.82) 14.7 (5.24)1 21.3 (3.60) 26.6 (2.81)Some high school 9.1 (1.72) 12.5 (2.73) 20.5 (1.70) 27.0 (1.93)High school graduate 9.0 (1.31) 11.3 (3.19) 18.8 (1.67) 28.4 (1.23)Some college 14.0 (1.47) 12.8 (2.07) 18.1 (1.34) 26.0 (1.47)College graduate 14.1 (1.76) 24.0 (4.11) 23.3 (1.55) 30.0 (1.36)
Physical activity (minutes/day) is measured objectively using a physical activity monitor. Conversions for A1c and glucose values are provided in Diabetes in America Appendix 1 Conversions. A1c, glycosylated hemoglobin.* Diagnosed diabetes is based on self-report. † Undiagnosed diabetes (clinical definition) is defined as A1c ≥6.5% or fasting plasma glucose ≥126 mg/dL; prediabetes is defined as A1c 5.7%–<6.5% or fasting plasma glucose
100–<126 mg/dL; normal glucose is defined as A1c <5.7% and fasting plasma glucose <100 mg/dL. 2-hour plasma glucose from an oral glucose tolerance test was not available in all years of physical activity measurement.
1 Relative standard error >30%–40%
SOURCE: National Health and Nutrition Examination Surveys 2003–2006
APPENDIX 10.29. Mean MET-Hours Per Week of Physical Activity Among Adults Age ≥20 Years, by Diabetes Status, U.S., 2001–2006
MEAN (STANDARD ERROR)
Diagnosed Diabetes*N=680
Undiagnosed Diabetes (Clinical Definition)†
N=188Prediabetes†
N=1,130Normal Glucose†
N=2,100
MET-hours/week‡ 23.4 (2.52) 21.4 (3.64) 24.8 (1.26) 30.2 (1.57)
Conversions for A1c and glucose values are provided in Diabetes in America Appendix 1 Conversions. A1c, glycosylated hemoglobin.* Diagnosed diabetes is based on self-report.† Undiagnosed diabetes (clinical definition) is defined as A1c ≥6.5% or fasting plasma glucose ≥126 mg/dL; prediabetes is defined as A1c 5.7%–<6.5% or fasting plasma glucose
100–<126 mg/dL; normal glucose is defined as A1c <5.7% and fasting plasma glucose <100 mg/dL. 2-hour plasma glucose from an oral glucose tolerance test was not available in all years of physical activity measurement.
‡ Metabolic Equivalent of Task (MET) is the ratio of the rate of energy expended during an activity to the rate of energy expended at rest; self-reported based on type of leisure-time activity, intensity, and duration.
SOURCE: National Health and Nutrition Examination Surveys 2001–2006
APPENDIX 10.30. Mean MET-Hours Per Week of Physical Activity, by Diabetes Status and Demographic Characteristics, U.S., 2001–2006
CHARACTERISTICS N
MEAN (STANDARD ERROR)
Diagnosed Diabetes*N=1,480
Undiagnosed Diabetes (Clinical Definition)†
N=465Prediabetes†
N=1,813Normal Glucose†
N=1,723
Age (years)20–44 1,841 23.3 (3.09) 19.0 (4.19) 27.7 (2.01) 33.3 (2.37)45–64 1,294 25.4 (3.95) 20.5 (3.73) 24.4 (2.34) 24.8 (1.91)≥65 964 20.3 (2.48) 23.5 (6.66) 20.4 (1.58) 22.9 (4.22)
SexMen 2,063 25.2 (2.84) 24.1 (5.16) 28.0 (1.65) 37.4 (2.69)Women 2,036 21.4 (3.61) 16.4 (3.56) 19.8 (1.72) 24.6 (1.59)
Race/ethnicityNon-Hispanic white 2,296 20.4 (1.74) 23.2 (4.95) 23.9 (1.27) 30.3 (1.87)Non-Hispanic black 784 23.4 (3.88) 15.8 (5.44)1 29.6 (4.50) 36.4 (3.72)Hispanic 845 30.7 (12.12)2 14.5 (2.70) 29.7 (4.95) 23.6 (2.59)
Mexican American 705 16.0 (2.27) 13.2 (1.97) 28.5 (4.63) 21.8 (1.98)Other Hispanic 140 3 18.4 (7.78)2 32.2 (10.48)1 26.3 (6.06)
Other/Multiracial 174 28.6 (6.28) 21.1 (9.85)2 20.8 (4.90) 29.0 (6.84)
Appendix 10.30 continues on the next page.
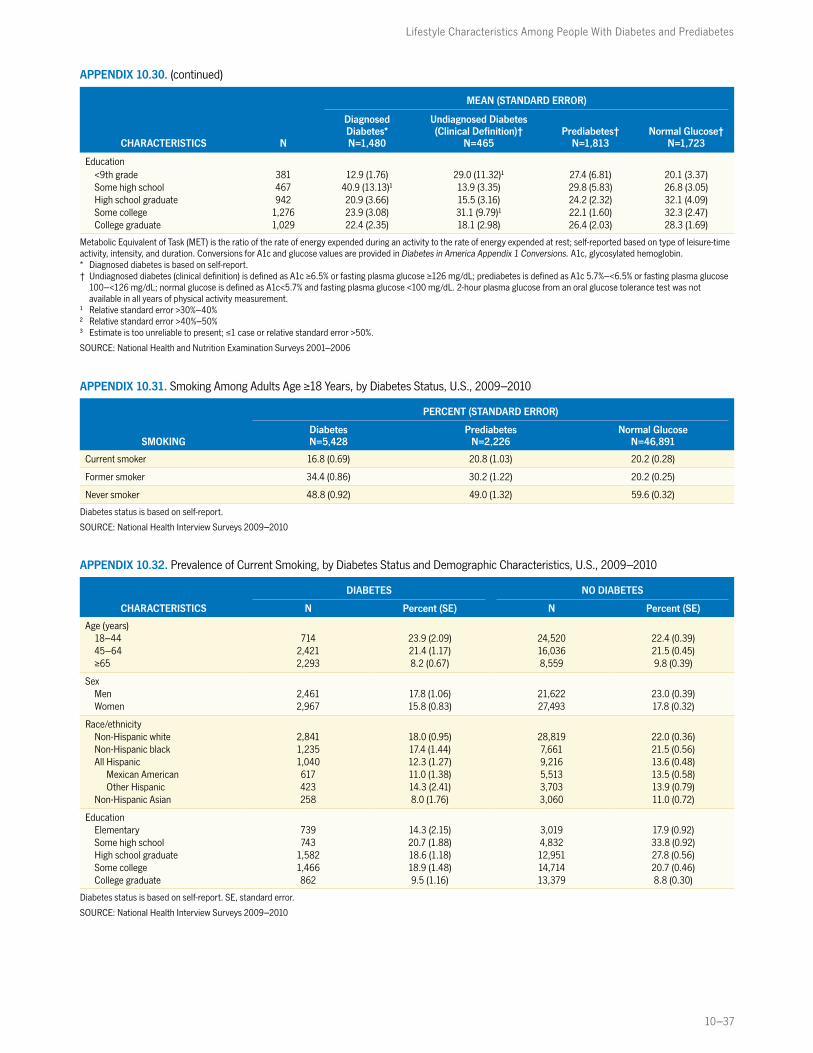
Lifestyle Characteristics Among People With Diabetes and Prediabetes
10–37
APPENDIX 10.30. (continued)
CHARACTERISTICS N
MEAN (STANDARD ERROR)
Diagnosed Diabetes*N=1,480
Undiagnosed Diabetes (Clinical Definition)†
N=465Prediabetes†
N=1,813Normal Glucose†
N=1,723
Education<9th grade 381 12.9 (1.76) 29.0 (11.32)1 27.4 (6.81) 20.1 (3.37)Some high school 467 40.9 (13.13)1 13.9 (3.35) 29.8 (5.83) 26.8 (3.05)High school graduate 942 20.9 (3.66) 15.5 (3.16) 24.2 (2.32) 32.1 (4.09)Some college 1,276 23.9 (3.08) 31.1 (9.79)1 22.1 (1.60) 32.3 (2.47)College graduate 1,029 22.4 (2.35) 18.1 (2.98) 26.4 (2.03) 28.3 (1.69)
Metabolic Equivalent of Task (MET) is the ratio of the rate of energy expended during an activity to the rate of energy expended at rest; self-reported based on type of leisure-time activity, intensity, and duration. Conversions for A1c and glucose values are provided in Diabetes in America Appendix 1 Conversions. A1c, glycosylated hemoglobin.* Diagnosed diabetes is based on self-report. † Undiagnosed diabetes (clinical definition) is defined as A1c ≥6.5% or fasting plasma glucose ≥126 mg/dL; prediabetes is defined as A1c 5.7%–<6.5% or fasting plasma glucose
100–<126 mg/dL; normal glucose is defined as A1c<5.7% and fasting plasma glucose <100 mg/dL. 2-hour plasma glucose from an oral glucose tolerance test was not available in all years of physical activity measurement.
1 Relative standard error >30%–40%2 Relative standard error >40%–50%3 Estimate is too unreliable to present; ≤1 case or relative standard error >50%.
SOURCE: National Health and Nutrition Examination Surveys 2001–2006
APPENDIX 10.31. Smoking Among Adults Age ≥18 Years, by Diabetes Status, U.S., 2009–2010
SMOKING
PERCENT (STANDARD ERROR)
DiabetesN=5,428
PrediabetesN=2,226
Normal GlucoseN=46,891
Current smoker 16.8 (0.69) 20.8 (1.03) 20.2 (0.28)
Former smoker 34.4 (0.86) 30.2 (1.22) 20.2 (0.25)
Never smoker 48.8 (0.92) 49.0 (1.32) 59.6 (0.32)
Diabetes status is based on self-report.
SOURCE: National Health Interview Surveys 2009–2010
APPENDIX 10.32. Prevalence of Current Smoking, by Diabetes Status and Demographic Characteristics, U.S., 2009–2010
CHARACTERISTICS
DIABETES NO DIABETES
N Percent (SE) N Percent (SE)
Age (years)18–44 714 23.9 (2.09) 24,520 22.4 (0.39)45–64 2,421 21.4 (1.17) 16,036 21.5 (0.45)≥65 2,293 8.2 (0.67) 8,559 9.8 (0.39)
SexMen 2,461 17.8 (1.06) 21,622 23.0 (0.39)Women 2,967 15.8 (0.83) 27,493 17.8 (0.32)
Race/ethnicityNon-Hispanic white 2,841 18.0 (0.95) 28,819 22.0 (0.36)Non-Hispanic black 1,235 17.4 (1.44) 7,661 21.5 (0.56)All Hispanic 1,040 12.3 (1.27) 9,216 13.6 (0.48)
Mexican American 617 11.0 (1.38) 5,513 13.5 (0.58)Other Hispanic 423 14.3 (2.41) 3,703 13.9 (0.79)
Non-Hispanic Asian 258 8.0 (1.76) 3,060 11.0 (0.72)
EducationElementary 739 14.3 (2.15) 3,019 17.9 (0.92)Some high school 743 20.7 (1.88) 4,832 33.8 (0.92)High school graduate 1,582 18.6 (1.18) 12,951 27.8 (0.56)Some college 1,466 18.9 (1.48) 14,714 20.7 (0.46)College graduate 862 9.5 (1.16) 13,379 8.8 (0.30)
Diabetes status is based on self-report. SE, standard error.
SOURCE: National Health Interview Surveys 2009–2010
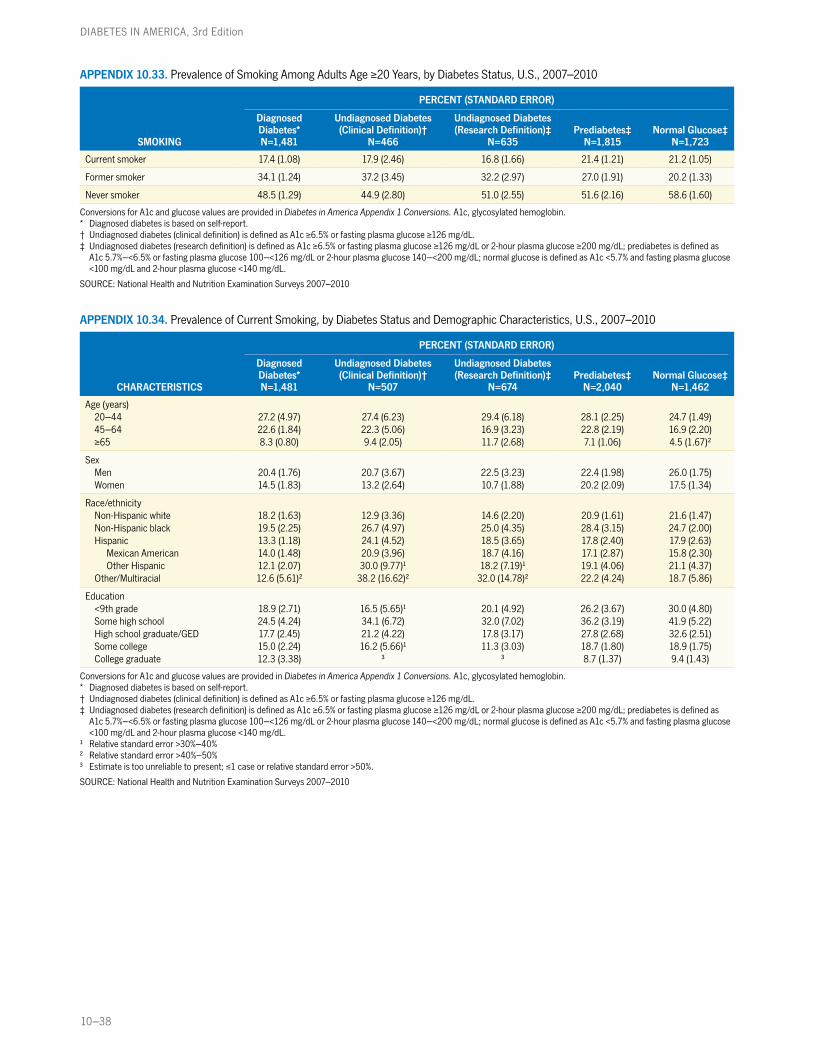
10–38
DIABETES IN AMERICA, 3rd Edition
APPENDIX 10.33. Prevalence of Smoking Among Adults Age ≥20 Years, by Diabetes Status, U.S., 2007–2010
SMOKING
PERCENT (STANDARD ERROR)
Diagnosed Diabetes*N=1,481
Undiagnosed Diabetes (Clinical Definition)†
N=466
Undiagnosed Diabetes (Research Definition)‡
N=635Prediabetes‡
N=1,815Normal Glucose‡
N=1,723
Current smoker 17.4 (1.08) 17.9 (2.46) 16.8 (1.66) 21.4 (1.21) 21.2 (1.05)
Former smoker 34.1 (1.24) 37.2 (3.45) 32.2 (2.97) 27.0 (1.91) 20.2 (1.33)
Never smoker 48.5 (1.29) 44.9 (2.80) 51.0 (2.55) 51.6 (2.16) 58.6 (1.60)
Conversions for A1c and glucose values are provided in Diabetes in America Appendix 1 Conversions. A1c, glycosylated hemoglobin.* Diagnosed diabetes is based on self-report.† Undiagnosed diabetes (clinical definition) is defined as A1c ≥6.5% or fasting plasma glucose ≥126 mg/dL.‡ Undiagnosed diabetes (research definition) is defined as A1c ≥6.5% or fasting plasma glucose ≥126 mg/dL or 2-hour plasma glucose ≥200 mg/dL; prediabetes is defined as
A1c 5.7%–<6.5% or fasting plasma glucose 100–<126 mg/dL or 2-hour plasma glucose 140–<200 mg/dL; normal glucose is defined as A1c <5.7% and fasting plasma glucose <100 mg/dL and 2-hour plasma glucose <140 mg/dL.
SOURCE: National Health and Nutrition Examination Surveys 2007–2010
APPENDIX 10.34. Prevalence of Current Smoking, by Diabetes Status and Demographic Characteristics, U.S., 2007–2010
CHARACTERISTICS
PERCENT (STANDARD ERROR)
Diagnosed Diabetes*N=1,481
Undiagnosed Diabetes (Clinical Definition)†
N=507
Undiagnosed Diabetes (Research Definition)‡
N=674Prediabetes‡
N=2,040Normal Glucose‡
N=1,462
Age (years)20–44 27.2 (4.97) 27.4 (6.23) 29.4 (6.18) 28.1 (2.25) 24.7 (1.49)45–64 22.6 (1.84) 22.3 (5.06) 16.9 (3.23) 22.8 (2.19) 16.9 (2.20)≥65 8.3 (0.80) 9.4 (2.05) 11.7 (2.68) 7.1 (1.06) 4.5 (1.67)2
SexMen 20.4 (1.76) 20.7 (3.67) 22.5 (3.23) 22.4 (1.98) 26.0 (1.75)Women 14.5 (1.83) 13.2 (2.64) 10.7 (1.88) 20.2 (2.09) 17.5 (1.34)
Race/ethnicityNon-Hispanic white 18.2 (1.63) 12.9 (3.36) 14.6 (2.20) 20.9 (1.61) 21.6 (1.47)Non-Hispanic black 19.5 (2.25) 26.7 (4.97) 25.0 (4.35) 28.4 (3.15) 24.7 (2.00)Hispanic 13.3 (1.18) 24.1 (4.52) 18.5 (3.65) 17.8 (2.40) 17.9 (2.63)
Mexican American 14.0 (1.48) 20.9 (3.96) 18.7 (4.16) 17.1 (2.87) 15.8 (2.30)Other Hispanic 12.1 (2.07) 30.0 (9.77)1 18.2 (7.19)1 19.1 (4.06) 21.1 (4.37)
Other/Multiracial 12.6 (5.61)2 38.2 (16.62)2 32.0 (14.78)2 22.2 (4.24) 18.7 (5.86)
Education<9th grade 18.9 (2.71) 16.5 (5.65)1 20.1 (4.92) 26.2 (3.67) 30.0 (4.80)Some high school 24.5 (4.24) 34.1 (6.72) 32.0 (7.02) 36.2 (3.19) 41.9 (5.22)High school graduate/GED 17.7 (2.45) 21.2 (4.22) 17.8 (3.17) 27.8 (2.68) 32.6 (2.51)Some college 15.0 (2.24) 16.2 (5.66)1 11.3 (3.03) 18.7 (1.80) 18.9 (1.75)College graduate 12.3 (3.38) 3 3 8.7 (1.37) 9.4 (1.43)
Conversions for A1c and glucose values are provided in Diabetes in America Appendix 1 Conversions. A1c, glycosylated hemoglobin.* Diagnosed diabetes is based on self-report.† Undiagnosed diabetes (clinical definition) is defined as A1c ≥6.5% or fasting plasma glucose ≥126 mg/dL.‡ Undiagnosed diabetes (research definition) is defined as A1c ≥6.5% or fasting plasma glucose ≥126 mg/dL or 2-hour plasma glucose ≥200 mg/dL; prediabetes is defined as
A1c 5.7%–<6.5% or fasting plasma glucose 100–<126 mg/dL or 2-hour plasma glucose 140–<200 mg/dL; normal glucose is defined as A1c <5.7% and fasting plasma glucose <100 mg/dL and 2-hour plasma glucose <140 mg/dL.
1 Relative standard error >30%–40%2 Relative standard error >40%–50%3 Estimate is too unreliable to present; ≤1 case or relative standard error >50%.
SOURCE: National Health and Nutrition Examination Surveys 2007–2010

Lifestyle Characteristics Among People With Diabetes and Prediabetes
10–39
APPENDIX 10.35. Prevalence of Health Behaviors Among Adults Age ≥20 Years, by Diabetes Status, U.S., 2007–2010
HEALTH BEHAVIORS
PERCENT (STANDARD ERROR)
Diagnosed Diabetes*
N=753
Undiagnosed Diabetes (Clinical Definition)†
N=168
Undiagnosed Diabetes (Research Definition)‡
N=221Prediabetes‡
N=538Normal Glucose‡
N=219
Eating fewer high fat foods§ 88.2 (1.38) 79.6 (3.81) 84.2 (2.79) 83.0 (2.53) 83.4 (2.95)
Increasing activity|| 75.2 (2.44) 80.6 (5.30) 75.5 (5.50) 77.0 (2.84) 81.9 (2.84)
Practicing weight control¶ 86.2 (1.63) 83.2 (3.08) 84.0 (4.28) 84.0 (2.68) 82.7 (3.97)
Had a health care visit in past year# 97.5 (0.43) 85.9 (2.12) 88.6 (1.66) 83.5 (1.13) 81.8 (0.93)
Conversions for A1c and glucose values are provided in Diabetes in America Appendix 1 Conversions. A1c, glycosylated hemoglobin.* Diagnosed diabetes is based on self-report.† Undiagnosed diabetes (clinical definition) is defined as A1c ≥6.5% or fasting plasma glucose ≥126 mg/dL.‡ Undiagnosed diabetes (research definition) is defined as A1c ≥6.5% or fasting plasma glucose ≥126 mg/dL or 2-hour plasma glucose ≥200 mg/dL; prediabetes is defined as
A1c 5.7%–<6.5% or fasting plasma glucose 100–<126 mg/dL or 2-hour plasma glucose 140–<200 mg/dL; normal glucose is defined as A1c <5.7% and fasting plasma glucose <100 mg/dL and 2-hour plasma glucose <140 mg/dL.
§ Question asked among persons told by a doctor to eat less fat and cholesterol in order to lower cholesterol level.|| Question asked among persons told by a doctor to exercise to reduce cholesterol level.¶ Question asked among persons told by a doctor to control weight in order to improve cholesterol level.# At least one health care visit in past year to see a doctor or health care professional at a doctor’s office, clinic, hospital, emergency room, at home, or some other place.
SOURCE: National Health and Nutrition Examination Surveys 2007–2010
APPENDIX 10.36. Prevalence of Eating Fewer High Fat Foods, by Diabetes Status and Demographic Characteristics, U.S., 2007–2010
CHARACTERISTICS
PERCENT (STANDARD ERROR)
Diagnosed Diabetes*
N=753
Undiagnosed Diabetes (Clinical Definition)†
N=168
Undiagnosed Diabetes (Research Definition)‡
N=221Prediabetes‡
N=538Normal Glucose‡
N=219
Total 88.2 (1.38) 79.6 (3.81) 84.2 (2.79) 83.0 (2.53) 83.4 (2.95)
Age (years)20–44 87.1 (3.88) 77.4 (15.09) 48.2 (23.4)1 75.4 (5.87) 82.4 (6.00)45–64 87.1 (1.94) 82.1 (6.27) 89.2 (4.25) 83.1 (3.11) 80.6 (4.03)≥65 89.9 (1.89) 77.2 (6.60) 83.1 (4.38) 87.0 (3.51) 94.0 (3.32)
SexMen 88.5 (1.76) 72.3 (5.39) 73.2 (5.53) 84.7 (2.77) 76.5 (5.88)Women 87.8 (2.31) 91.1 (2.50) 94.4 (1.68) 81.3 (3.38) 88.6 (3.30)
Race/ethnicityNon-Hispanic white 89.4 (1.74) 74.8 (5.30) 81.9 (3.52) 83.7 (2.95) 82.8 (3.68)Non-Hispanic black 87.5 (1.78) 97.3 (2.73) 97.8 (2.21) 85.1 (4.84) 83.0 (6.09)Hispanic 85.6 (2.28) 90.5 (5.14) 91.8 (4.00) 78.7 (4.17) 83.2 (5.38)
Mexican American 87.0 (2.86) 92.2 (4.75) 89.4 (5.17) 72.1 (4.44) 74.8 (6.36)Other Hispanic 83.2 (4.08) 86.3 (12.61) 94.9 (5.41) 89.2 (5.88) 90.6 (5.17)
Other/Multiracial 83.0 (8.92) 83.8 (11.71) 86.5 (8.59) 77.3 (11.41) 100.0
Education<9th grade 87.0 (3.05) 81.1 (16.03) 79.4 (11.37) 83.5 (6.54) 79.1 (11.50)Some high school 93.2 (1.95) 96.4 (2.70) 85.3 (7.64) 82.4 (6.03) 77.9 (11.49)High school graduate 86.7 (4.07) 71.4 (11.52) 84.8 (6.63) 78.0 (5.48) 76.0 (5.87)Some college 86.4 (3.96) 76.5 (12.15) 79.6 (9.79) 89.2 (3.09) 86.2 (4.03)College graduate 89.3 (3.63) 79.8 (10.88) 90.6 (4.92) 81.2 (4.94) 85.8 (5.05)
Question asked among persons told by a doctor to eat less fat and cholesterol in order to lower cholesterol level. Conversions for A1c and glucose values are provided in Diabetes in America Appendix 1 Conversions. A1c, glycosylated hemoglobin.* Diagnosed diabetes is based on self-report. † Undiagnosed diabetes (clinical definition) is defined as A1c ≥6.5% or fasting plasma glucose ≥126 mg/dL.‡ Undiagnosed diabetes (research definition) is defined as A1c ≥6.5% or fasting plasma glucose ≥126 mg/dL or 2-hour plasma glucose ≥200 mg/dL; prediabetes is defined as
A1c 5.7%–<6.5% or fasting plasma glucose 100–<126 mg/dL or 2-hour plasma glucose 140–<200 mg/dL; normal glucose is defined as A1c <5.7% and fasting plasma glucose <100 mg/dL and 2-hour plasma glucose <140 mg/dL.
1 Relative standard error >40%–50%
SOURCE: National Health and Nutrition Examination Surveys 2007–2010
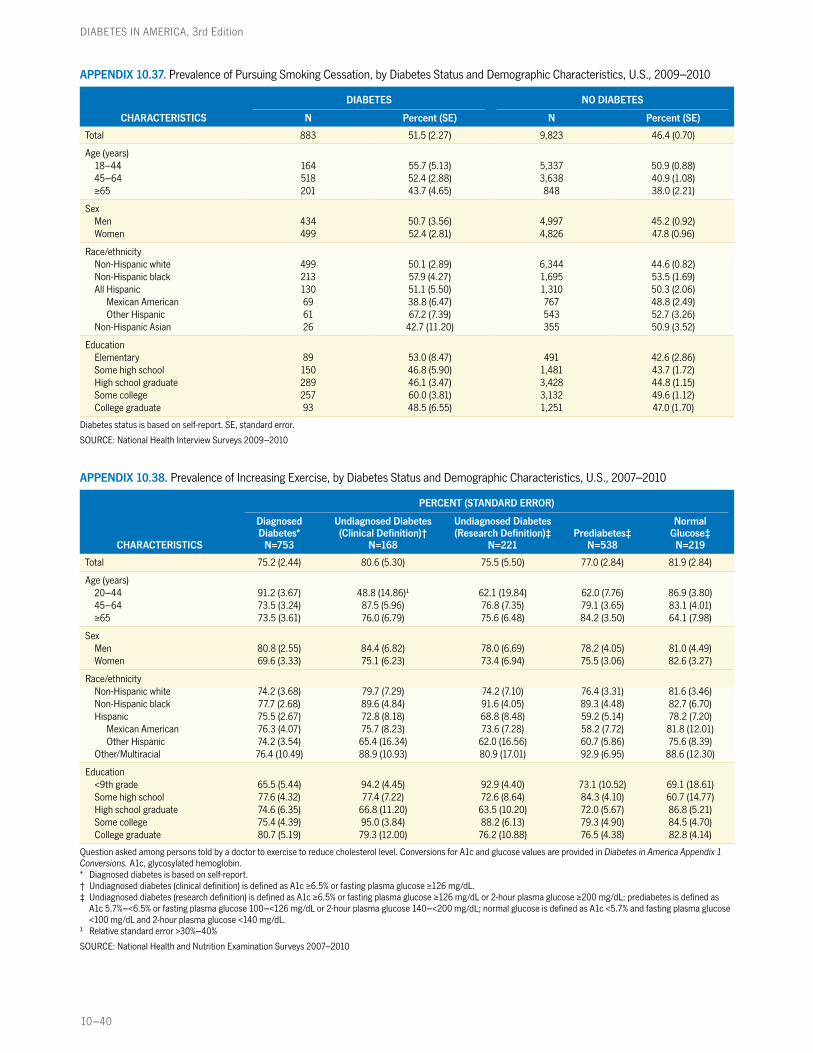
10–40
DIABETES IN AMERICA, 3rd Edition
APPENDIX 10.37. Prevalence of Pursuing Smoking Cessation, by Diabetes Status and Demographic Characteristics, U.S., 2009–2010
CHARACTERISTICS
DIABETES NO DIABETES
N Percent (SE) N Percent (SE)
Total 883 51.5 (2.27) 9,823 46.4 (0.70)
Age (years)18–44 164 55.7 (5.13) 5,337 50.9 (0.88)45–64 518 52.4 (2.88) 3,638 40.9 (1.08)≥65 201 43.7 (4.65) 848 38.0 (2.21)
SexMen 434 50.7 (3.56) 4,997 45.2 (0.92)Women 499 52.4 (2.81) 4,826 47.8 (0.96)
Race/ethnicityNon-Hispanic white 499 50.1 (2.89) 6,344 44.6 (0.82)Non-Hispanic black 213 57.9 (4.27) 1,695 53.5 (1.69)All Hispanic 130 51.1 (5.50) 1,310 50.3 (2.06)
Mexican American 69 38.8 (6.47) 767 48.8 (2.49)Other Hispanic 61 67.2 (7.39) 543 52.7 (3.26)
Non-Hispanic Asian 26 42.7 (11.20) 355 50.9 (3.52)
EducationElementary 89 53.0 (8.47) 491 42.6 (2.86)Some high school 150 46.8 (5.90) 1,481 43.7 (1.72)High school graduate 289 46.1 (3.47) 3,428 44.8 (1.15)Some college 257 60.0 (3.81) 3,132 49.6 (1.12)College graduate 93 48.5 (6.55) 1,251 47.0 (1.70)
Diabetes status is based on self-report. SE, standard error.
SOURCE: National Health Interview Surveys 2009–2010
APPENDIX 10.38. Prevalence of Increasing Exercise, by Diabetes Status and Demographic Characteristics, U.S., 2007–2010
CHARACTERISTICS
PERCENT (STANDARD ERROR)
Diagnosed Diabetes*
N=753
Undiagnosed Diabetes (Clinical Definition)†
N=168
Undiagnosed Diabetes (Research Definition)‡
N=221Prediabetes‡
N=538
Normal Glucose‡N=219
Total 75.2 (2.44) 80.6 (5.30) 75.5 (5.50) 77.0 (2.84) 81.9 (2.84)
Age (years)20–44 91.2 (3.67) 48.8 (14.86)1 62.1 (19.84) 62.0 (7.76) 86.9 (3.80)45–64 73.5 (3.24) 87.5 (5.96) 76.8 (7.35) 79.1 (3.65) 83.1 (4.01)≥65 73.5 (3.61) 76.0 (6.79) 75.6 (6.48) 84.2 (3.50) 64.1 (7.98)
SexMen 80.8 (2.55) 84.4 (6.82) 78.0 (6.69) 78.2 (4.05) 81.0 (4.49)Women 69.6 (3.33) 75.1 (6.23) 73.4 (6.94) 75.5 (3.06) 82.6 (3.27)
Race/ethnicityNon-Hispanic white 74.2 (3.68) 79.7 (7.29) 74.2 (7.10) 76.4 (3.31) 81.6 (3.46)Non-Hispanic black 77.7 (2.68) 89.6 (4.84) 91.6 (4.05) 89.3 (4.48) 82.7 (6.70)Hispanic 75.5 (2.67) 72.8 (8.18) 68.8 (8.48) 59.2 (5.14) 78.2 (7.20)
Mexican American 76.3 (4.07) 75.7 (8.23) 73.6 (7.28) 58.2 (7.72) 81.8 (12.01)Other Hispanic 74.2 (3.54) 65.4 (16.34) 62.0 (16.56) 60.7 (5.86) 75.6 (8.39)
Other/Multiracial 76.4 (10.49) 88.9 (10.93) 80.9 (17.01) 92.9 (6.95) 88.6 (12.30)
Education<9th grade 65.5 (5.44) 94.2 (4.45) 92.9 (4.40) 73.1 (10.52) 69.1 (18.61)Some high school 77.6 (4.32) 77.4 (7.22) 72.6 (8.64) 84.3 (4.10) 60.7 (14.77)High school graduate 74.6 (6.35) 66.8 (11.20) 63.5 (10.20) 72.0 (5.67) 86.8 (5.21)Some college 75.4 (4.39) 95.0 (3.84) 88.2 (6.13) 79.3 (4.90) 84.5 (4.70)College graduate 80.7 (5.19) 79.3 (12.00) 76.2 (10.88) 76.5 (4.38) 82.8 (4.14)
Question asked among persons told by a doctor to exercise to reduce cholesterol level. Conversions for A1c and glucose values are provided in Diabetes in America Appendix 1 Conversions. A1c, glycosylated hemoglobin.* Diagnosed diabetes is based on self-report. † Undiagnosed diabetes (clinical definition) is defined as A1c ≥6.5% or fasting plasma glucose ≥126 mg/dL.‡ Undiagnosed diabetes (research definition) is defined as A1c ≥6.5% or fasting plasma glucose ≥126 mg/dL or 2-hour plasma glucose ≥200 mg/dL; prediabetes is defined as
A1c 5.7%–<6.5% or fasting plasma glucose 100–<126 mg/dL or 2-hour plasma glucose 140–<200 mg/dL; normal glucose is defined as A1c <5.7% and fasting plasma glucose <100 mg/dL and 2-hour plasma glucose <140 mg/dL.
1 Relative standard error >30%–40%
SOURCE: National Health and Nutrition Examination Surveys 2007–2010
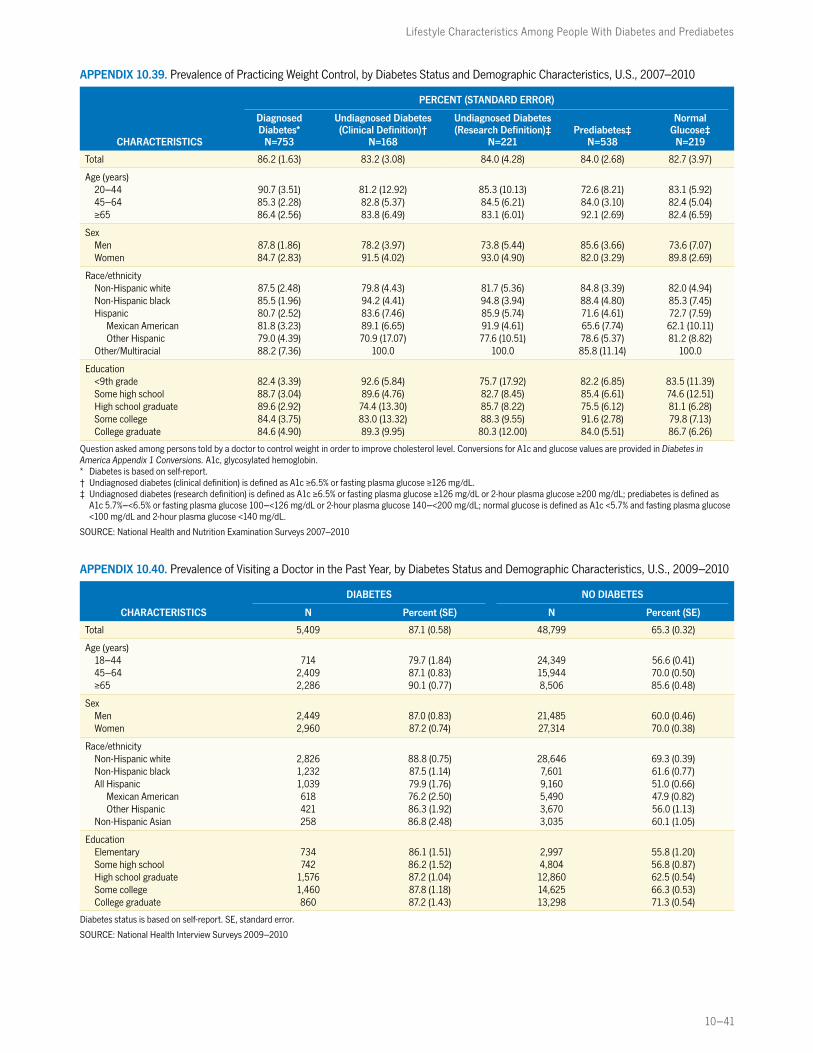
Lifestyle Characteristics Among People With Diabetes and Prediabetes
10–41
APPENDIX 10.39. Prevalence of Practicing Weight Control, by Diabetes Status and Demographic Characteristics, U.S., 2007–2010
CHARACTERISTICS
PERCENT (STANDARD ERROR)
Diagnosed Diabetes*
N=753
Undiagnosed Diabetes (Clinical Definition)†
N=168
Undiagnosed Diabetes (Research Definition)‡
N=221Prediabetes‡
N=538
Normal Glucose‡N=219
Total 86.2 (1.63) 83.2 (3.08) 84.0 (4.28) 84.0 (2.68) 82.7 (3.97)
Age (years)20–44 90.7 (3.51) 81.2 (12.92) 85.3 (10.13) 72.6 (8.21) 83.1 (5.92)45–64 85.3 (2.28) 82.8 (5.37) 84.5 (6.21) 84.0 (3.10) 82.4 (5.04)≥65 86.4 (2.56) 83.8 (6.49) 83.1 (6.01) 92.1 (2.69) 82.4 (6.59)
SexMen 87.8 (1.86) 78.2 (3.97) 73.8 (5.44) 85.6 (3.66) 73.6 (7.07)Women 84.7 (2.83) 91.5 (4.02) 93.0 (4.90) 82.0 (3.29) 89.8 (2.69)
Race/ethnicityNon-Hispanic white 87.5 (2.48) 79.8 (4.43) 81.7 (5.36) 84.8 (3.39) 82.0 (4.94)Non-Hispanic black 85.5 (1.96) 94.2 (4.41) 94.8 (3.94) 88.4 (4.80) 85.3 (7.45)Hispanic 80.7 (2.52) 83.6 (7.46) 85.9 (5.74) 71.6 (4.61) 72.7 (7.59)
Mexican American 81.8 (3.23) 89.1 (6.65) 91.9 (4.61) 65.6 (7.74) 62.1 (10.11)Other Hispanic 79.0 (4.39) 70.9 (17.07) 77.6 (10.51) 78.6 (5.37) 81.2 (8.82)
Other/Multiracial 88.2 (7.36) 100.0 100.0 85.8 (11.14) 100.0
Education<9th grade 82.4 (3.39) 92.6 (5.84) 75.7 (17.92) 82.2 (6.85) 83.5 (11.39)Some high school 88.7 (3.04) 89.6 (4.76) 82.7 (8.45) 85.4 (6.61) 74.6 (12.51)High school graduate 89.6 (2.92) 74.4 (13.30) 85.7 (8.22) 75.5 (6.12) 81.1 (6.28)Some college 84.4 (3.75) 83.0 (13.32) 88.3 (9.55) 91.6 (2.78) 79.8 (7.13)College graduate 84.6 (4.90) 89.3 (9.95) 80.3 (12.00) 84.0 (5.51) 86.7 (6.26)
Question asked among persons told by a doctor to control weight in order to improve cholesterol level. Conversions for A1c and glucose values are provided in Diabetes in America Appendix 1 Conversions. A1c, glycosylated hemoglobin.* Diabetes is based on self-report. † Undiagnosed diabetes (clinical definition) is defined as A1c ≥6.5% or fasting plasma glucose ≥126 mg/dL.‡ Undiagnosed diabetes (research definition) is defined as A1c ≥6.5% or fasting plasma glucose ≥126 mg/dL or 2-hour plasma glucose ≥200 mg/dL; prediabetes is defined as
A1c 5.7%–<6.5% or fasting plasma glucose 100–<126 mg/dL or 2-hour plasma glucose 140–<200 mg/dL; normal glucose is defined as A1c <5.7% and fasting plasma glucose <100 mg/dL and 2-hour plasma glucose <140 mg/dL.
SOURCE: National Health and Nutrition Examination Surveys 2007–2010
APPENDIX 10.40. Prevalence of Visiting a Doctor in the Past Year, by Diabetes Status and Demographic Characteristics, U.S., 2009–2010
CHARACTERISTICS
DIABETES NO DIABETES
N Percent (SE) N Percent (SE)
Total 5,409 87.1 (0.58) 48,799 65.3 (0.32)
Age (years)18–44 714 79.7 (1.84) 24,349 56.6 (0.41)45–64 2,409 87.1 (0.83) 15,944 70.0 (0.50)≥65 2,286 90.1 (0.77) 8,506 85.6 (0.48)
SexMen 2,449 87.0 (0.83) 21,485 60.0 (0.46)Women 2,960 87.2 (0.74) 27,314 70.0 (0.38)
Race/ethnicityNon-Hispanic white 2,826 88.8 (0.75) 28,646 69.3 (0.39)Non-Hispanic black 1,232 87.5 (1.14) 7,601 61.6 (0.77)All Hispanic 1,039 79.9 (1.76) 9,160 51.0 (0.66)
Mexican American 618 76.2 (2.50) 5,490 47.9 (0.82)Other Hispanic 421 86.3 (1.92) 3,670 56.0 (1.13)
Non-Hispanic Asian 258 86.8 (2.48) 3,035 60.1 (1.05)
EducationElementary 734 86.1 (1.51) 2,997 55.8 (1.20)Some high school 742 86.2 (1.52) 4,804 56.8 (0.87)High school graduate 1,576 87.2 (1.04) 12,860 62.5 (0.54)Some college 1,460 87.8 (1.18) 14,625 66.3 (0.53)College graduate 860 87.2 (1.43) 13,298 71.3 (0.54)
Diabetes status is based on self-report. SE, standard error.
SOURCE: National Health Interview Surveys 2009–2010

10–42
DIABETES IN AMERICA, 3rd Edition
APPENDIX 10.41. Prevalence of Having a Health Care Visit in the Past Year, by Diabetes Status and Demographic Characteristics, U.S., 2007–2010
CHARACTERISTICS
PERCENT (STANDARD ERROR)
Diagnosed Diabetes*
N=753
Undiagnosed Diabetes (Clinical Definition)†
N=168
Undiagnosed Diabetes (Research Definition)‡
N=221Prediabetes‡
N=538
Normal Glucose‡N=219
Total 97.5 (0.43) 85.9 (2.12) 88.6 (1.66) 83.5 (1.13) 81.8 (0.93)
Age (years)20–44 93.9 (2.06) 60.1 (6.39) 68.7 (7.10) 75.1 (2.15) 79.4 (1.34)45–64 97.0 (0.79) 84.8 (3.49) 87.8 (2.77) 84.0 (1.58) 85.1 (1.84)≥65 99.3 (0.27) 96.6 (1.50) 97.3 (1.12) 96.4 (0.94) 91.7 (2.43)
SexMen 97.0 (0.69) 82.5 (2.92) 84.5 (2.52) 79.7 (1.18) 73.1 (1.54)Women 98.0 (0.71) 91.7 (1.80) 93.1 (1.43) 87.8 (1.72) 88.5 (1.11)
Race/ethnicityNon-Hispanic white 98.5 (0.59) 91.9 (2.21) 94.3 (1.60) 88.3 (1.52) 84.2 (1.21)Non-Hispanic black 98.0 (0.94) 84.8 (5.56) 81.8 (7.10) 79.5 (1.60) 78.0 (3.77)Hispanic 92.6 (1.29) 68.6 (3.40) 69.4 (3.61) 64.2 (2.70) 71.9 (2.20)
Mexican American 91.8 (1.39) 67.1 (5.23) 64.9 (5.48) 60.5 (3.65) 70.0 (2.96)Other Hispanic 93.9 (2.74) 71.3 (5.12) 76.9 (5.53) 71.2 (4.98) 74.8 (3.21)
Other/Multiracial 97.1 (2.85) 68.2 (15.46) 73.3 (13.37) 77.7 (6.07) 81.6 (4.04)
Education<9th grade 97.1 (0.87) 84.5 (4.56) 85.8 (3.76) 75.1 (2.63) 65.9 (6.19)Some high school 97.9 (0.75) 75.3 (5.30) 82.0 (4.71) 75.7 (3.28) 75.0 (2.61)High school graduate 98.2 (0.56) 88.1 (2.43) 88.6 (2.91) 82.1 (2.38) 81.3 (2.50)Some college 95.9 (1.53) 84.4 (3.76) 88.2 (2.56) 85.0 (1.60) 80.4 (1.87)College graduate 99.1 (0.67) 94.3 (3.75) 97.1 (1.78) 89.8 (1.65) 87.0 (1.85)
At least one health care visit in past year to see a doctor or health care professional at a doctor’s office, clinic, hospital, emergency room, at home, or some other place. Conversions for A1c and glucose values are provided in Diabetes in America Appendix 1 Conversions. A1c, glycosylated hemoglobin.* Diagnosed diabetes is based on self-report. † Undiagnosed diabetes (clinical definition) is defined as A1c ≥6.5% or fasting plasma glucose ≥126 mg/dL. ‡ Undiagnosed diabetes (research definition) is defined as A1c ≥6.5% or fasting plasma glucose ≥126 mg/dL or 2-hour plasma glucose ≥200 mg/dL; prediabetes is defined as
A1c 5.7%–<6.5% or fasting plasma glucose 100–<126 mg/dL or 2-hour plasma glucose 140–<200 mg/dL; normal glucose is defined as A1c <5.7% and fasting plasma glucose <100 mg/dL and 2-hour plasma glucose <140 mg/dL.
SOURCE: National Health and Nutrition Examination Surveys 2007–2010