chapter 10 capital-budgeting techniques and practice
TRANSCRIPT

Chapter 10
Capital-Budgeting Techniques and Practice
Copyright ©2014 Pearson Education, Inc. All rights reserved. 10-2
Learning Objectives
1. Discuss the difficulty encountered in finding profitable projects in competitive markets and the importance of the search.
2. Determine whether a new project should be accepted or rejected using the payback period, net present value, the profitability index, and the internal rate of return.
3. Explain how the capital-budgeting decision process changes when a dollar limit is placed on the capital budget.
4. Discuss the problems encountered when deciding among mutually exclusive projects.

Copyright ©2014 Pearson Education, Inc. All rights reserved. 10-3
FINDING PROFITABLE PROJECTS

Copyright ©2014 Pearson Education, Inc. All rights reserved. 10-4
Capital Budgeting
• Meaning: The process of decision making with respect to investments in fixed assets—that is, should a proposed project be accepted or rejected.
• It is easier to “evaluate” profitable projects than to “find them”
Copyright ©2014 Pearson Education, Inc. All rights reserved. 10-5
Source of Ideas for Projects
• R&D: Typically, a firm has a research & development (R&D) department that searches for ways of improving existing products or finding new projects.
• Other sources: Employees, Competition, Suppliers, Customers.

Copyright ©2014 Pearson Education, Inc. All rights reserved. 10-6
CAPITAL-BUDGETING DECISION CRITERIA

Copyright ©2014 Pearson Education, Inc. All rights reserved. 10-7
Capital-Budgeting Decision Criteria
• The Payback Period• Net Present Value• Profitability Index• Internal Rate of Return
Copyright ©2014 Pearson Education, Inc. All rights reserved. 10-8
The Payback Period
• Meaning: Number of years needed to recover the initial cash outlay related to an investment.
• Decision Rule: Project is considered feasible or desirable if the payback period is less than or equal to the firm’s maximum desired payback period. In general, shorter payback period is preferred while comparing two projects.
Copyright ©2014 Pearson Education, Inc. All rights reserved. 10-9
Payback Period Example
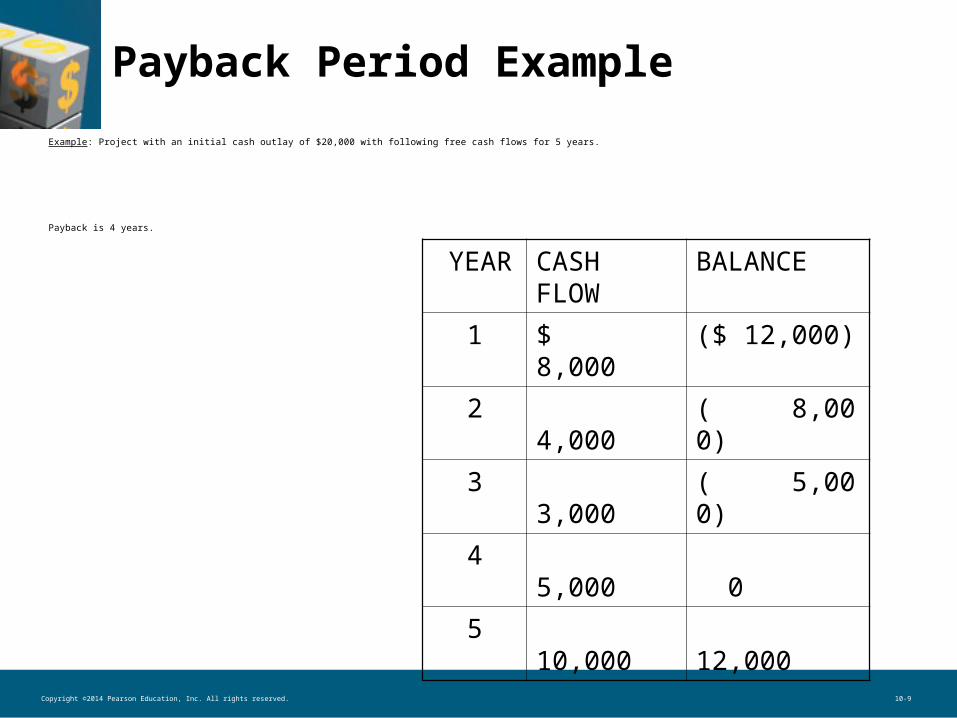
Example: Project with an initial cash outlay of $20,000 with following free cash flows for 5 years.
Payback is 4 years.
YEAR CASH FLOW
BALANCE
1 $ 8,000 ($ 12,000)
2 4,000 ( 8,000)
3 3,000 ( 5,000)
4 5,000 0
5 10,000 12,000

Copyright ©2014 Pearson Education, Inc. All rights reserved. 10-10
Trade-Offs
• Benefits: – Uses cash flows rather than accounting profits– Easy to compute and understand– Useful for firms that have capital constraints
• Drawbacks: – Ignores the time value of money– Does not consider cash flows beyond the
payback period

Copyright ©2014 Pearson Education, Inc. All rights reserved. 10-11
Discounted Payback Period
• The discounted payback period is similar to the traditional payback period except that it uses discounted free cash flows rather than actual undiscounted cash flows.
• The discounted payback period is defined as the number of years needed to recover the initial cash outlay from the discounted free cash flows.

Copyright ©2014 Pearson Education, Inc. All rights reserved. 10-12
Discounted Payback Period
Copyright ©2014 Pearson Education, Inc. All rights reserved. 10-13
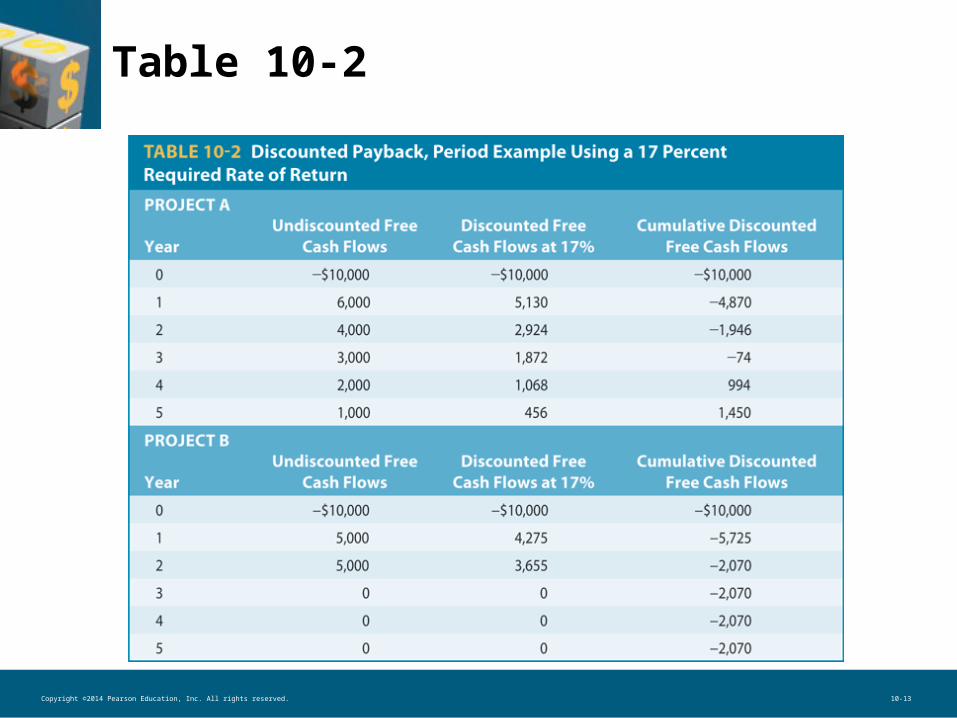
Table 10-2

Copyright ©2014 Pearson Education, Inc. All rights reserved. 10-14
Payback Period Example
• Table 10-2 shows the difference between traditional payback and discounted payback methods.
• With undiscounted free cash flows, the payback period is only 2 years, while with discounted free cash flows (at 17%), the discounted payback period is 3.07 years.
Copyright ©2014 Pearson Education, Inc. All rights reserved. 10-15
Net Present Value (NPV)
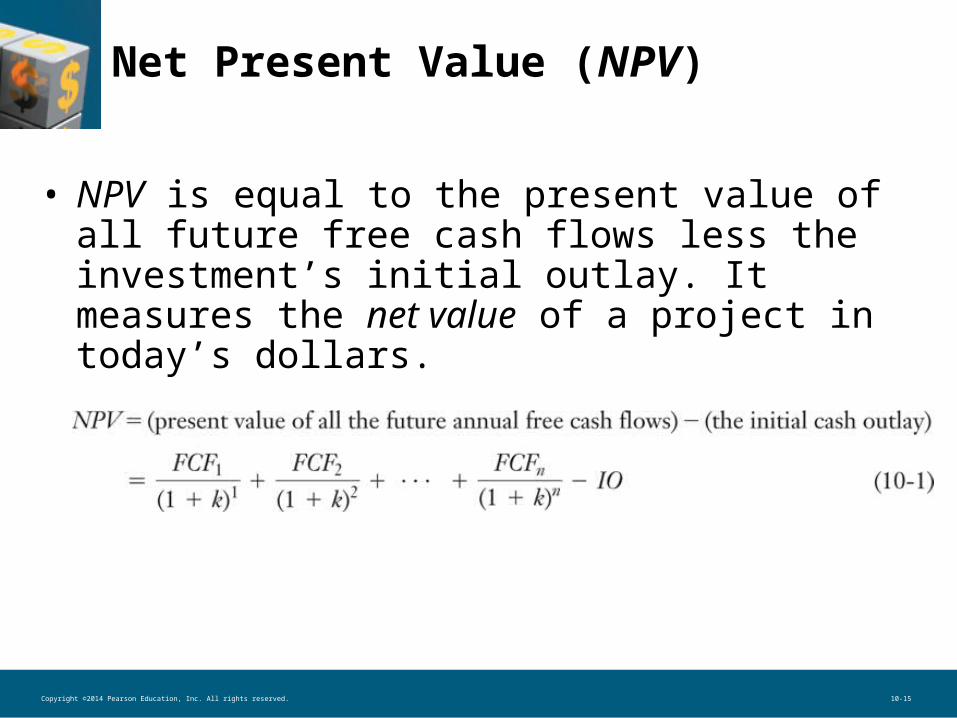
• NPV is equal to the present value of all future free cash flows less the investment’s initial outlay. It measures the net value of a project in today’s dollars.
Copyright ©2014 Pearson Education, Inc. All rights reserved. 10-16
NPV Example
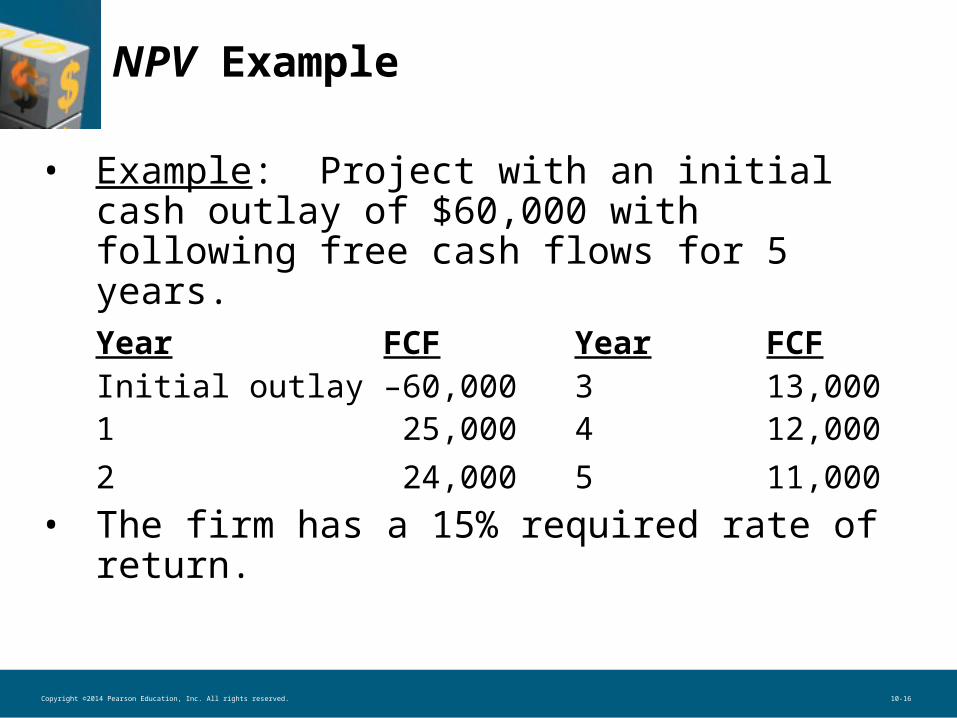
• Example: Project with an initial cash outlay of $60,000 with following free cash flows for 5 years.
Year FCF Year FCFInitial outlay –60,000 3 13,0001 –25,000 4 12,000
2 –24,000 5 11,000 • The firm has a 15% required rate of return.

Copyright ©2014 Pearson Education, Inc. All rights reserved. 10-17
NPV Example
•
• PV of FCF = $60,764• Subtracting the initial cash outlay of
$60,000 leaves an NPV of $764. • Since NPV > 0, project is feasible.

Copyright ©2014 Pearson Education, Inc. All rights reserved. 10-18
NPV in Excel
• Input cash flows for initial outlay and free cash inflows in cells A1 to A6.
• In cell A7 type the following formula:=A1+npv(0.15,A2:A6)
• Excel will give the result NPV = $764.

Copyright ©2014 Pearson Education, Inc. All rights reserved. 10-19
NPV Trade-Offs
• Benefits– Considers all cash flows – Recognizes time value of money
• Drawbacks– Requires detailed long-term forecast of cash
flows
• NPV is generally considered to be the most theoretically correct criterion for evaluating capital budgeting projects.

Copyright ©2014 Pearson Education, Inc. All rights reserved. 10-20
The Profitability Index (PI)(Benefit-Cost Ratio)
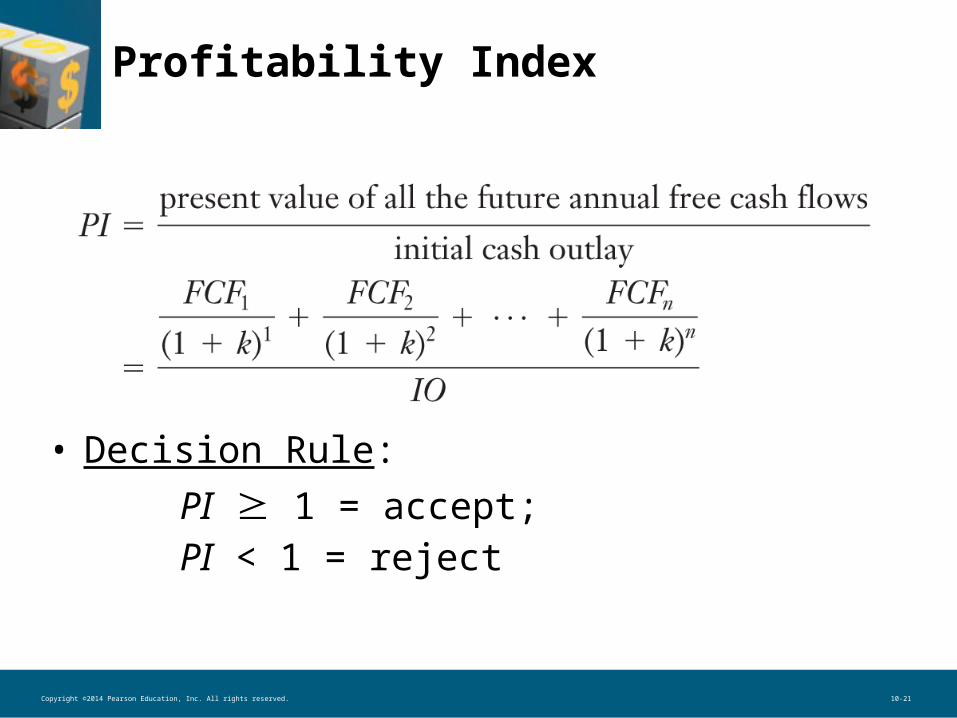
• The profitability index (PI) is the ratio of the present value of the future free cash flows (FCF) to the initial outlay.
• It yields the same accept/reject decision as NPV.
Copyright ©2014 Pearson Education, Inc. All rights reserved. 10-21
Profitability Index
• Decision Rule:
PI 1 = accept; PI < 1 = reject
Copyright ©2014 Pearson Education, Inc. All rights reserved. 10-22
Profitability Index Example
• A firm with a 10% required rate of return is considering investing in a new machine with an expected life of six years. The initial cash outlay is $50,000.
Copyright ©2014 Pearson Education, Inc. All rights reserved. 10-23
Profitability Index Example
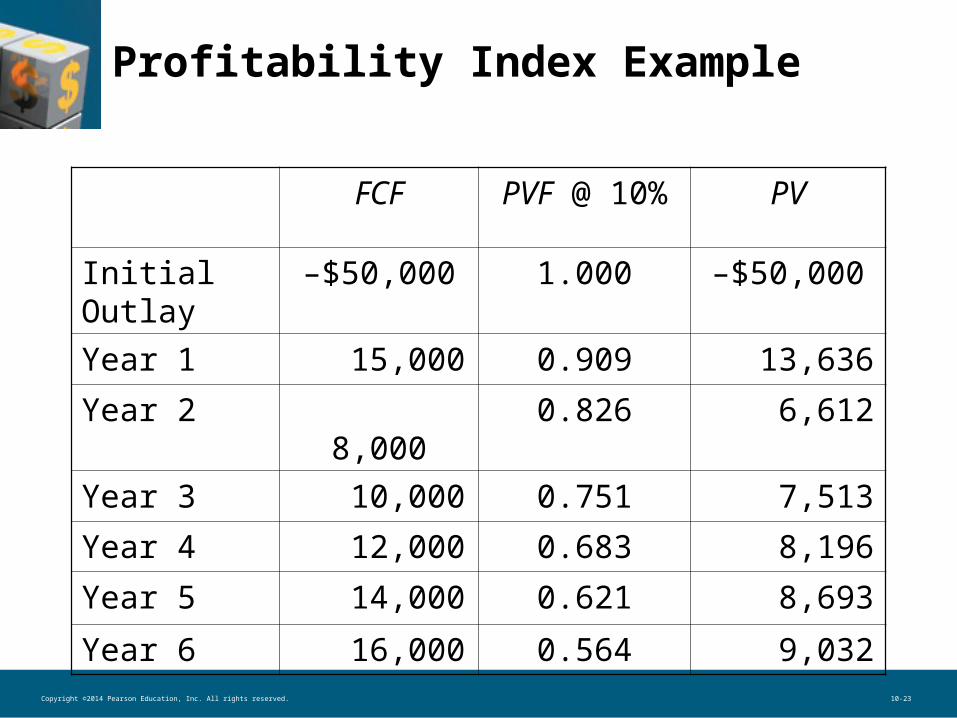
FCF PVF @ 10% PV
Initial Outlay
–$50,000 1.000 –$50,000
Year 1 15,000 0.909 13,636
Year 2 8,000 0.826 6,612
Year 3 10,000 0.751 7,513
Year 4 12,000 0.683 8,196
Year 5 14,000 0.621 8,693
Year 6 16,000 0.564 9,032
Copyright ©2014 Pearson Education, Inc. All rights reserved. 10-24
Profitability Index Example
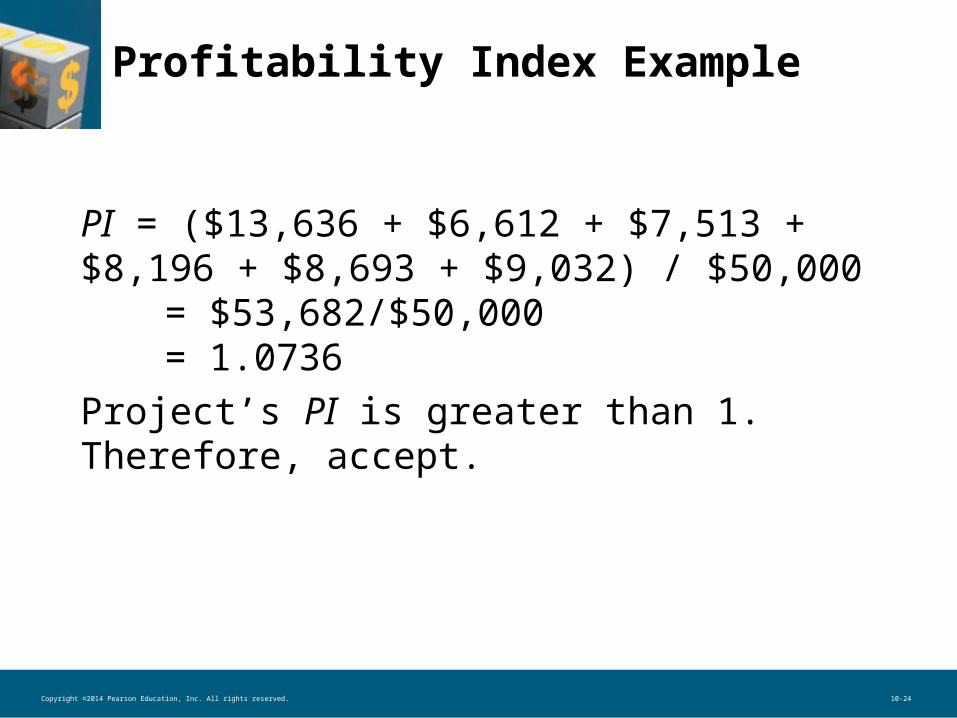
PI = ($13,636 + $6,612 + $7,513 + $8,196 + $8,693 + $9,032) / $50,000
= $53,682/$50,000 = 1.0736Project’s PI is greater than 1. Therefore, accept.
Copyright ©2014 Pearson Education, Inc. All rights reserved. 10-25
NPV and PI
• When the present value of a project’s free cash inflows are greater than the initial cash outlay, the project NPV will be positive. PI will also be greater than 1.
• NPV and PI will always yield the same decision.

Copyright ©2014 Pearson Education, Inc. All rights reserved. 10-26
Internal Rate of Return (IRR)
• IRR is the discount rate that equates the present value of a project’s future net cash flows with the project’s initial cash outlay (IO).
•
Copyright ©2014 Pearson Education, Inc. All rights reserved. 10-27
Internal Rate of Return
• Decision Rule: – If IRR Required Rate of Return, accept– If IRR < Required Rate of Return, reject

Copyright ©2014 Pearson Education, Inc. All rights reserved. 10-28
Figure 10-1
Copyright ©2014 Pearson Education, Inc. All rights reserved. 10-29
IRR and NPV
• If NPV is positive, IRR will be greater than the required rate of return
• If NPV is negative, IRR will be less than required rate of return
• If NPV = 0, IRR is the required rate of return.
Copyright ©2014 Pearson Education, Inc. All rights reserved. 10-30
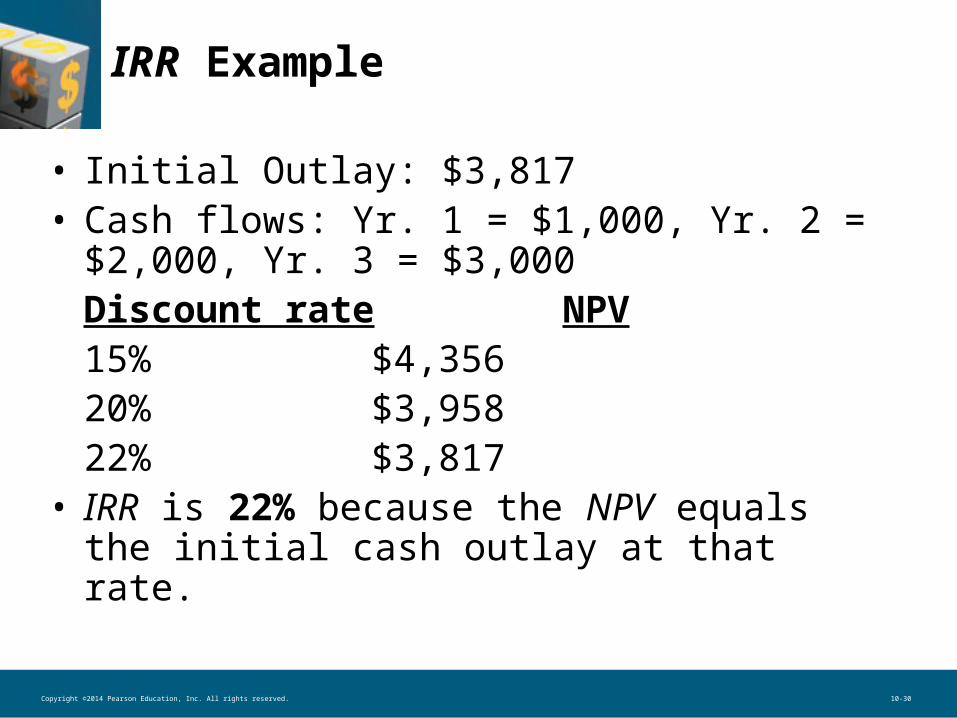
IRR Example
• Initial Outlay: $3,817• Cash flows: Yr. 1 = $1,000, Yr. 2 = $2,000,
Yr. 3 = $3,000 Discount rate NPV15% $4,35620% $3,95822% $3,817
• IRR is 22% because the NPV equals the initial cash outlay at that rate.
Copyright ©2014 Pearson Education, Inc. All rights reserved. 10-31
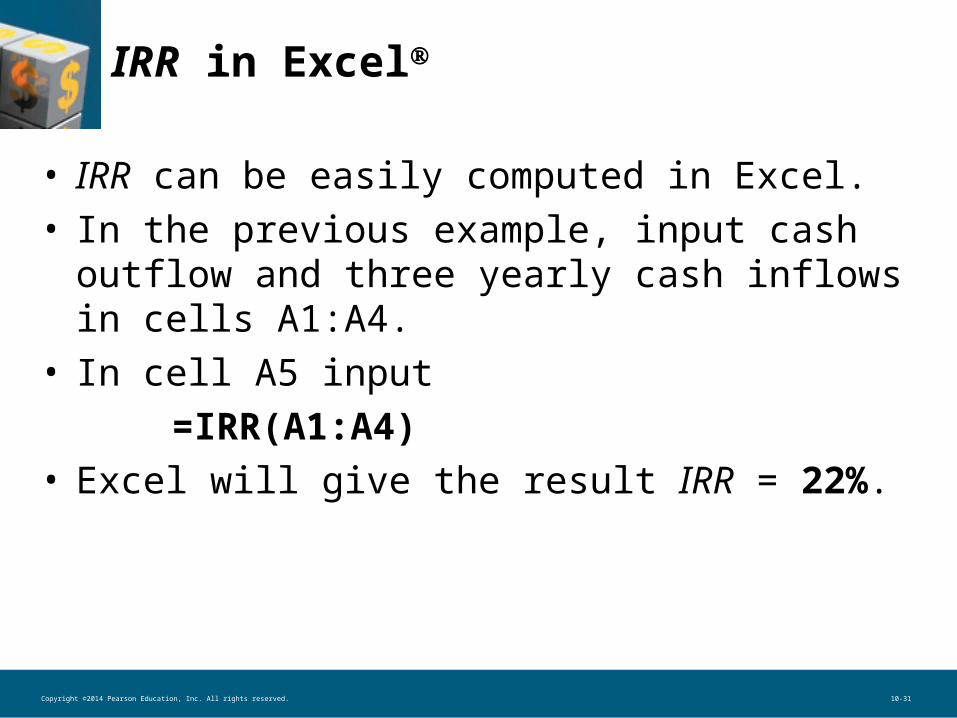
IRR in Excel
• IRR can be easily computed in Excel.• In the previous example, input cash outflow
and three yearly cash inflows in cells A1:A4.• In cell A5 input
=IRR(A1:A4)• Excel will give the result IRR = 22%.
Copyright ©2014 Pearson Education, Inc. All rights reserved. 10-32
Multiple IRRs
• A normal cash flow pattern for project is negative initial outlay followed by positive cash flows (–, +, +, + …)
• However, if the cash flow pattern is not normal (such as –, +, –) there can be more than one IRR.
• Figure 10-2 is based on cash flows of–1,600, +10,000, –10,000 in years 0, 1, 2.

Copyright ©2014 Pearson Education, Inc. All rights reserved. 10-33
Multiple IRRs (Figure 10-2)

Copyright ©2014 Pearson Education, Inc. All rights reserved. 10-34
Modified IRR (MIRR)
• Primary drawback of the IRR relative to the net present value is the reinvestment rate assumption made by the internal rate of return. Modified IRR allows the decision maker to directly specify the appropriate reinvestment rate.
•

Copyright ©2014 Pearson Education, Inc. All rights reserved. 10-35
Modified IRR
• Accept if MIRR required rate of return• Reject if MIRR < required rate of return

Copyright ©2014 Pearson Education, Inc. All rights reserved. 10-36
MIRR Example
• Project having a 3-year life and a required rate of return of 10% with the following free cash flows:
FCFs FCFsInitial Outlay
–$6,000 Year 2 $3,000
Year 1 $2,000
Year 3 $4,000

Copyright ©2014 Pearson Education, Inc. All rights reserved. 10-37
MIRR Example
• Step 1: Determine the PV of the project’s free cash outflows. $6,000 is already at the present.
• Step 2: Determine the terminal value of the project’s free cash inflows. To do this use the project’s required rate of return to calculate the FV of the project’s three cash inflows. They turn out to be $2,420 + $3,300 + $4,000 = $9,720 for the terminal value.

Copyright ©2014 Pearson Education, Inc. All rights reserved. 10-38
MIRR Example
• Step 3: Determine the discount rate that equates the PV of the terminal value and the PV of the project’s cash outflows. MIRR = 17.446%.
• Decision: MIRR is greater than required rate of return, so accept.
Copyright ©2014 Pearson Education, Inc. All rights reserved. 10-39
MIRR in Excel
= MIRR(values,finance rate,reinvestment rate)
where values is the range of cells where the cash flows are stored, and k is entered for both the finance rate and the reinvestment rate.

Copyright ©2014 Pearson Education, Inc. All rights reserved. 10-40
CAPITAL RATIONING
Copyright ©2014 Pearson Education, Inc. All rights reserved. 10-41
Capital Rationing
• Capital rationing refers to situation where there is a limit on the dollar size of the capital budget. This may be due to: a) temporary adverse conditions in the market;b) shortage of qualified personnel to direct new
projects; and/or c) other factors such as not being willing to take
on excess debt to finance new projects.

Copyright ©2014 Pearson Education, Inc. All rights reserved. 10-42
Capital Rationing
• How to select? Select a set of projects with the highest NPV—subject to the capital constraint.
• Note, using NPV may preclude accepting the highest ranked project in terms of PI or IRR.

Copyright ©2014 Pearson Education, Inc. All rights reserved. 10-43
Figure 10-4

Copyright ©2014 Pearson Education, Inc. All rights reserved. 10-44
Table 10-7

Copyright ©2014 Pearson Education, Inc. All rights reserved. 10-45
RANKING MUTUALLY EXCLUSIVE PROJECTS

Copyright ©2014 Pearson Education, Inc. All rights reserved. 10-46
Ranking Mutually Exclusive Projects
• Size Disparity• Time Disparity• Unequal Life

Copyright ©2014 Pearson Education, Inc. All rights reserved. 10-47
Size Disparity
• This occurs when we examine mutually exclusive projects of unequal size.
• Example: Consider the following cash flows for one-year Project A and B, with required rates of return of 10%.– Initial Outlay: A = $200; B = $1,500– Inflow: A = $300; B = $1,900

Copyright ©2014 Pearson Education, Inc. All rights reserved. 10-48
Table 10-8

Copyright ©2014 Pearson Education, Inc. All rights reserved. 10-49
Size-Disparity Ranking Problem
Ranking Conflict: – Using NPV, Project B is better; – Using PI and IRR, Project A is better.
Project A Project B
NPV 72.73 227.28
PI 1.36 1.15
IRR 50% 27%

Copyright ©2014 Pearson Education, Inc. All rights reserved. 10-50
Size-Disparity Ranking Problem
• Which technique to use to select the project?
• Use NPV whenever there is size disparity. If there is no capital rationing, project with the largest NPV will be selected. When capital rationing exists, rank and select set of projects based on NPV.

Copyright ©2014 Pearson Education, Inc. All rights reserved. 10-51
The Time-Disparity Problem
• Time-disparity problem arises because of differing reinvestment assumptions made by the NPV and IRR decision criteria.
• How are cash flows reinvested?– According to NPV: Required rate of return– According to IRR: IRR

Copyright ©2014 Pearson Education, Inc. All rights reserved. 10-52
The Time-Disparity Problem
• Example: Consider two projects, A and B, with initial outlay of $1,000, cost of capital of 10%, and following cash flows in years 1, 2, and 3:
• A: $100 $200 $2,000• B: $650 $650 $650

Copyright ©2014 Pearson Education, Inc. All rights reserved. 10-53
The Time-Disparity Problem

Copyright ©2014 Pearson Education, Inc. All rights reserved. 10-54
The Time-Disparity Problem
• Ranking Conflict:– Using NPV or PI, A is better– Using IRR, B is better
• Which technique to use to select the superior project? – Use NPV
Project A Project B
NPV 758.83 616.45
PI 1.759 1.616
IRR 35% 43%
Copyright ©2014 Pearson Education, Inc. All rights reserved. 10-55
Unequal-Lives Problem
• This occurs when we are comparing two mutually exclusive projects with different life spans.
• To compare projects, we compute the Equivalent Annual Annuity (EAA).

Copyright ©2014 Pearson Education, Inc. All rights reserved. 10-56
Unequal-Lives Problem
• Example: If you have two projects, A and B, with equal investment of $1,000, required rate of return of 10%, and following cash flows in years 1-3 (for project A) and 1-6 (for project B)
• Project A = $500 each in years 1-3• Project B = $300 each in years 1-6

Copyright ©2014 Pearson Education, Inc. All rights reserved. 10-57
Computing EAA
• Calculate the project’s NPV:A = $243.43 and B = $306.58
• Calculate EAA = NPV/annual annuity factorA = $97.89B = $70.39
• Project A is better

Copyright ©2014 Pearson Education, Inc. All rights reserved. 10-58
Figure 10-5

Copyright ©2014 Pearson Education, Inc. All rights reserved. 10-59
Figure 10-6

Copyright ©2014 Pearson Education, Inc. All rights reserved. 10-60
Key Terms
• Capital budgeting• Capital rationing• Discounted payback period• Equivalent annual annuity (EAA)• Internal rate of return (IRR)• Modified internal rate of return (MIRR)• Mutually exclusive projects• Net present value (NPV)• Net present value profile• Payback period• Profitability index (PI) or benefit-cost ratio

Copyright ©2014 Pearson Education, Inc. All rights reserved. 10-61
Table 10-1
Copyright ©2014 Pearson Education, Inc. All rights reserved. 10-62
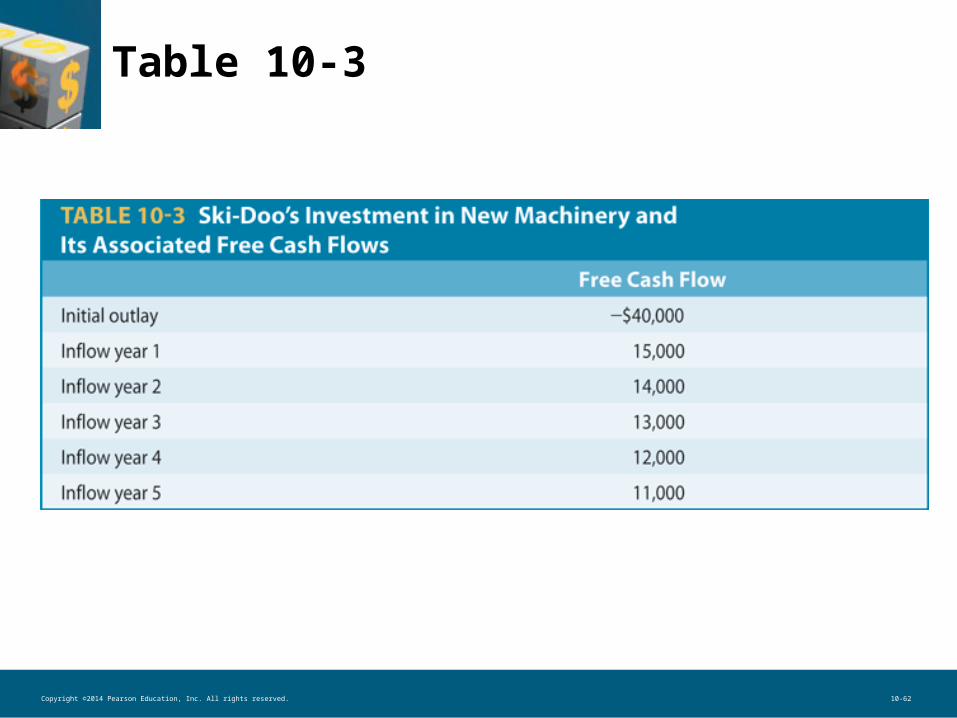
Table 10-3
Copyright ©2014 Pearson Education, Inc. All rights reserved. 10-63
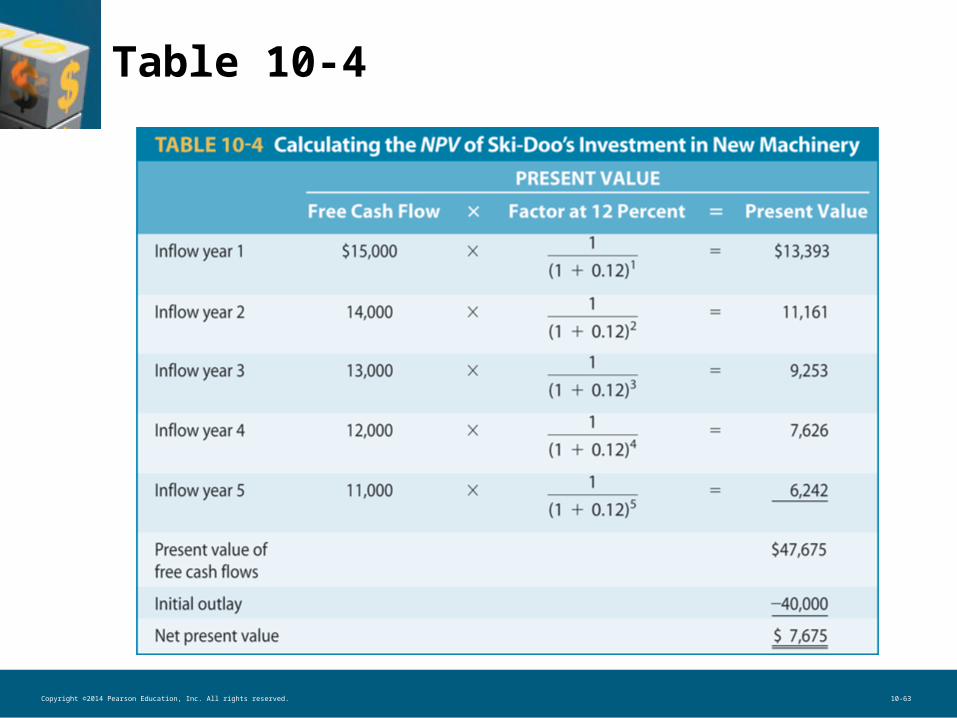
Table 10-4
Copyright ©2014 Pearson Education, Inc. All rights reserved. 10-64
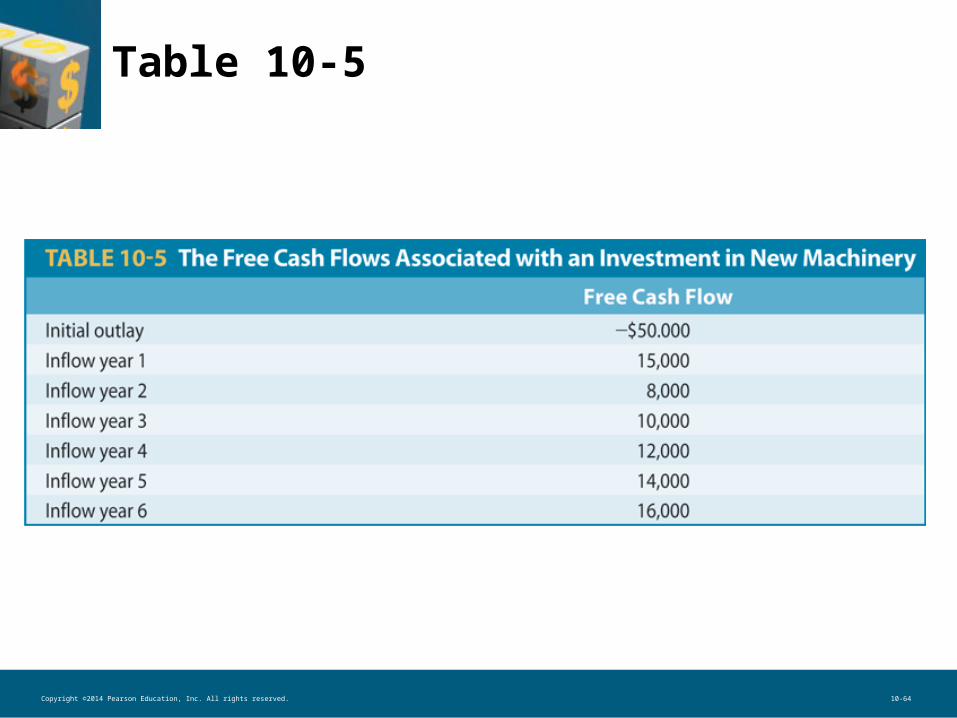
Table 10-5

Copyright ©2014 Pearson Education, Inc. All rights reserved. 10-65
Table 10-6

Copyright ©2014 Pearson Education, Inc. All rights reserved. 10-66
Table 10-10

Copyright ©2014 Pearson Education, Inc. All rights reserved. 10-67
Table 10-10 (cont.)

Copyright ©2014 Pearson Education, Inc. All rights reserved. 10-68
Figure 10-3