chapter 1 storm water mapping using arcgis and … water mapping using arcgis and google earth 2 unh...
TRANSCRIPT

UNH Cooperative Extension 1
CHAPTER 1 Storm Water Mapping using
ArcGIS and Google Earth
In this unit we will use ArcMap, ArcCatalog, and Google Earth to create, edit, analyze, and
display Storm Water Distribution System data for the University of New Hampshire. Storm
Water features, including catch basins, drain manholes, and outfalls, were previously col-
lected via GPS and inventoried for structure attribute information by the UNH Facilities
GIS Department. Throughout this chapter you will use this data to create a subsurface
storm water network utilizing the tools described above.
1. Create Drain Line Shapefile
a) Open ArcCatalog and navigate to
c:/CommunityMapping/StormWater/.
b) Create a New Shapefile: Create a Polyline shapefile named “Drain_Line.” To
do this right click on an open space within the Contents window, select “New”
“Shapefile.”
c) Select “Edit” “Select” “Projected Coordinate Systems”
d) Set the Coordinate System to: State Plane / NAD 1983 (Feet) / New Hamp-
shire
e) Once the Coordinate System is set click “OK” until you have returned to the
Contents window
f) The Drain_Line shapefile should now appear with the rest of the storm water
data

Storm Water Mapping using ArcGIS and Google Earth
2 UNH Cooperative Extension
2. Create A New ArcMap Document
Now that all of the necessary shapefiles have been created and compiled it is time to cre-
ate the UNH Storm Water map document in ArcMap. This document will allow the user to
view, edit, and analyze all storm water data related to this project.
a) Open ArcMap Create “A new empty map.”
b) Add data: Using the “Add Data” button add the following data
from c:/CommunityMapping/StormWater/:
i) Campus_Polyline.shp
ii) UNH_Building.shp
iii) Catch_Basin.shp
iv) Drain_Manhole.shp
v) Outfall.shp
vi) Building _Connection.shp
vii) Drain_Line.shp
c) Organize Data: Arrange the data layers in order as shown by the class instruc-
tor
d) Zoom to Data: Right click on the Catch_Basin shapefile and select “Zoom to
Layer”
e) Create a Bookmark: Once the map document has zoomed in to the desired
area create a bookmark. Creating Bookmarks allow for easier viewing and
navigation during editing and analysis.
f) Left click “View” “Bookmarks” “Create”
g) Enter “College Way” as the name and left click “OK”
h) Save the map: Save the map as “UNH Storm Water” in
c:/CommunityMapping/StormWater/
i) Add Toolbars: make sure the “Editor” toolbar is turned on. To turn on a toolbar
navigate the mouse to an open area adjacent an existing toolbar, right click,
and select the desired toolbar.

UNH Cooperative Extension 3
3. Populate Catch Basin & Drain Manhole Attribute Tables
Through an editing session in ArcMap and using the previously completed field
datasheets populate the Catch_Basin and Drain_Manhole attribute tables accordingly.
a) Open Attribute Table: Right click on the Catch_Basin layer name and left click
“Open Attribute Table.”
b) Add Fields: Add the necessary data fields to the feature attribute table based
on the field datasheets. To do this left click on “Options” “Add Field”
c) For the first field enter the name “Bearing” and select the type as “Double,”
once completed hit “OK.”
d) Repeat Step b for the following:
i) “Dimen_IN” as text, length 15
ii) “Depth_IN” as text, length 15
iii) “Num_In” as Double
iv) “Num_Out” as Double
v) “Cover” as text, length 15

Storm Water Mapping using ArcGIS and Google Earth
4 UNH Cooperative Extension
vi) “Positioned” as text, length 15
vii) “Loc_Desc” as text, length 40
viii) “Notes” as text, length 50.
e) Close the Catch_Basin attribute table and open the Drain_Manhole table
f) Repeat Step b for the following:
i) “Diam_IN” as text; length 15
ii) “Depth_IN” as text, length 15
iii) “Num_In” as text, length 15
iv) “Num_Out” as text; length 15
v) “Positioned” as text, length 15
vi) “Loc_Desc” as text, length 40
vii) “Notes” as text, length 50.
g) Close the Drain_Manhole attribute table
h) Start an Editing Session: In order to update the attribute tables an editing ses-
sion must first be started within ArcMap. To start an editing session left click
“Editor” (located on the Editing toolbar) “Start Editing”
i) Open the Catch_Basin attribute table and, if necessary, sort the UNH_ID field
ascending
TIP: To sort an attribute field right click on the field name and choose the desired sort
method (i.e. ascending, descending, etc.)
j) Starting with the datasheet for CB_001update the Catch_Basin attribute table
accordingly. Repeat this step for all catch basins and drain manholes.
k) Save Edits: periodically save the edits while updating the attribute table. To do
this left click “Editor” “Save Edits.”
l) Once all attribute data has been entered save the edits and stop the editing
session. To end an editing session left click “Editor” “Stop Editing.”
NOTE: Feature attribute information can also be updated from an editing session with-
out opening an attribute table. To do this:
i) Left click the “Edit Tool” located on the Editor Toolbar
ii) Click and drag a box around the desired feature or left click on the fea-
ture to select it.
iii) Once selected right click on the feature and select “Attributes.”

UNH Cooperative Extension 5
iv) An attribute window should appear
v) Populate the fields accordingly.
TIP: When updating attribute information using this method be sure the proper feature
is selected to avoid adding data to the wrong shapefile. To verify the correct selection
was made double check the layer name located in the upper left hand corner of the
attribute window.

Storm Water Mapping using ArcGIS and Google Earth
6 UNH Cooperative Extension
4. Basic Display Functions
Now that the Catch_Basin and Drain_Manhole attribute tables have been populated take
a moment to explore some of the basic display functions within ArcMap.
a) Sort by Category: This feature allows users to break down symbology levels
based on common attributes. For the purpose of this exercise sort the
Catch_Basin layer by cover shape.
b) Right click on the Catch_Basin layer name and select “Properties” “Sym-
bology” “Categories” “Unique values”
c) Set the “Value Field” to “Cover” select “Add All Values.” The attributes
for “Cover” should now appear.
d) Uncheck the box next to “<all other values>”
e) Assign the appropriate symbology to each cover type by left clicking on the
symbol next to the layer name.
f) The symbol menu should now appear. Select the desired symbol, color, and
size from the list.
g) Display the proper rotation of the symbols by selecting “Advanced”
“Rotation”
h) Select “Bearing” from the drop down list
i) Select “Geographic” and click “OK”
j) Double check all settings. If everything is correct left click “OK.” The Catch_
Basin layer should now be split between Round and Square catch basin cov-
ers.

UNH Cooperative Extension 7
k) Assign Symbology: Assign symbology to the remaining layers by left clicking
on the layers’ symbol.
l) Once the symbol menu appears select the appropriate symbol, color, and size.
Repeat as needed for additional layers
m) Rotate: Rotate outfalls to reflect their true bearing. To do this right click on the
layer name and select “Properties” “Symbology”
n) Left click the “Advanced” tab and select “Rotation.”
o) Select “Bearing” from the drop down list
p) Set the Rotation Style to “Geographic” and click “OK”
q) Left click “OK” to return to the map. The proper rotation of the outfalls should
now be displayed
r) Label Features: Label the Catch_Basin, Drain_Manhole, and Outfall layers
based on their UNH_ID number.
s) Select the desired layer name, right click and select “Properties”
“Labels.”
t) Check off the “Label features in this layer” box
u) Select UNH_ID field from the “Label Field” drop down list.
v) Set the font, size, and color as desired; be sure to include a text halo.
TIP: To set a text halo select “Symbol” “Properties” “Mask.” Be sure to
select the “Halo” option under Style and set the size to 1.000. Left click “OK” to return to
the main menu.
w) Repeat as needed for each data layer.
NOTE: If the labels are overlapping the point features the label weight will need to be
adjusted. Adjust the label weight by navigating to “Properties” “Labels”
“Placement Properties” “Conflict Detection.” Select “High” for both the label
weight and feature weight.

Storm Water Mapping using ArcGIS and Google Earth
8 UNH Cooperative Extension
5. Update Drain Line Attribute Fields
Prior to populating the Drain_Line shapefile attribute fields need to be added to the data
layer based on the field datasheets.
a) Refer to Section 3 Steps a-c to update the Drain_Line attribute table. Fields
added should include the following:
i) Bearing as Double
ii) Diam_IN as text, length 15
iii) In_Depth as text, length 15
iv) Out_Depth as text, length 15
v) Material as text, length 25
vi) Notes as text, length 50
vii) Length as Double
viii) Flow_Direc as Double

UNH Cooperative Extension 9
6. Create Drain Lines within an Editing Session
Now that all attribute tables have been updated and display settings have been estab-
lished it is time to create the subsurface storm water network.
a) Start an Editing Session within ArcMap
TIP: For a refresher on how to start an editing session refer to Section 3, Step h of this
chapter.
b) On the Editing toolbar set the “Task” to “Create New Feature” and the “Target”
to “Drain_Line.”
c) Set Snapping Properties: Left click on “Editor” “Snapping”
d) Check off the “Vertex” boxes next to Catch_Basin, Drain_Manhole, and Out-
fall. Once these boxes have been selected close the Snapping dialog.
NOTE: Establishing snapping settings will allow the user to directly connect the start
point and end point of drain lines to the appropriate storm water feature (i.e. catch
basins, manholes, etc.); this will allow for the most accurate data possible.
e) Zoom In: Using the “Zoom In” tool zoom in to the area around CB_001 on
College Way in front of McConnell Hall.
f) Create Drain Lines: Select the “Sketch Tool” from the editing toolbar. When
creating drain lines be sure to draw them going from the inlet to the out-
let as denoted on the datasheets.
g) Using the CB_001 datasheet create the drain line labeled “Pipe 1.”
h) Left click the sketch tool on CB_001; a line should appear connected to the
catch basin.
NOTE: Once the sketch tool moves close to the catch basin the cursor should auto-
matically “snap” to the exact location of the feature. This is the result of the snapping
properties established in Step c.
i) Left click the sketch tool on CB_013 as indicated on the datasheet.
j) Finish Line Segment: Push F2 on the keyboard. The first drain line should now
be created connecting CB_001 and CB_013.
k) Update attribute information: Select the “Edit Tool” from the editing toolbar.
l) If not already selected, left click on the newly created line to select it.
Storm Water Mapping using ArcGIS and Google Earth
10 UNH Cooperative Extension
m) Once the line has been selected right click and choose “Attributes.” An
attribute window should now appear.
n) Enter the attributes for the drain line as indicated on the field datasheet. Do not
worry about entering data for the “Length” or “Flow_Direc” fields at this time.
NOTE: If a pipe is listed as an Inlet on the datasheet than the depth measurement
recorded should be added to the Depth_Out attribute field. If the pipe is listed as an
Outlet on the datasheet than the depth measurement recorded should be added to the
Depth_In attribute field. The reason for this is because although the inlet is coming into
the catch basin the storm water is coming out of the pipe.
o) Repeat Steps f-n for all pipes and datasheets
p) Be sure to save edits periodically
TIP: Refer to Section 3 Step k for a refresher on saving features within an editing ses-
sion.
q) Once all drain lines have been created open the Drain_Line attribute table
and scroll to the “Length” and “Flow_Direc” fields.
r) Starting with the “Length” field right click and select “Field Calculator.”
s) Check off the “Advanced” box.
t) Left click the “Load” button
u) Navigate to c:/CommunityMapping/StormWater/and find the EZ Calculate
scripts
v) Select the “Length.cal” script.
w) Left click “Open” “OK.” The “Length” field should now be populated.
x) Repeat Steps q-w for the “Flow_Direc” field. When selecting the EZ Calculate
script be sure to select “polyline_Get_Azimuth2.cal”
y) If all drain lines have been created and all attributes have been entered, save
the edits and stop the editing session.
z) Save the UNH Storm Water map.

UNH Cooperative Extension 11
7. Basic Display Functions Using Drain Line Features
Using the Drain_Line shapefile and associated attributes it is time to revisit some of the
display functions reviewed in Section 4 of this chapter.
a) Sort by Category: Sort the Drain_Line shapefile by its “Material” Category
based on the steps outlined in Section 4 Steps a-j (excluding steps g-i).
b) Set Symbology: Set the symbology of the drain lines based on the steps out-
lined in Section 4 Steps k-l.
c) Label Features: In Section 4 all point features were labeled based on an exist-
ing attribute field. In this section the user will learn how to build an expression
that incorporates more than one attribute field and additional text.
d) Right click on the Drain_Line shapefile and select “Properties” “Labels”
e) In the “Text String” section next to “Label Field” left click on the “Expression”
button.
f) In the blank space enter the following:
[Diam_IN] & “in. “& vbNewLine & [Material]
g) Left click the “Verify” button. If the expression was entered correctly an exam-
ple of the label should appear. If an error message appears review the expres-
sion to make sure that everything is spaced and spelled correctly.

Storm Water Mapping using ArcGIS and Google Earth
12 UNH Cooperative Extension
h) Once the verification is complete left click “OK”
i) Set the font to Times New Roman, size 6, halo 1.000
TIP: Refer to the Tip in Section 4 of this chapter for a refresher on Halo’s
j) Set Label Placement: Left click the “Placement Properties” button and select
the “Placement” tab.
k) Set the Orientation to “Parallel” and the Position to “Above the line”
l) Left click “OK”
m) Check off the “Label features in this layer” box and click “OK.” The drain
lines should now be labeled to display their pipe diameter and material.
n) Identify Attributes: Using the Identify tool left click on features throughout the
map to view various attributes.
UNH Cooperative Extension 13
8. Exporting Storm Water Data to Google Earth
Google Earth combines the power of Google Search with satellite imagery, maps, terrains,
and 3D buildings to put the world’s geographic information at users fingertips. Through
keyhole markup language (KML) exports and other scripts Google Earth also has the
capability to view spatial data created in other formats (i.e. GIS) as overlays on the base
data. In this section we will export all previously created GIS shapefiles to KML and
explore the basic functionalities of Google Earth.
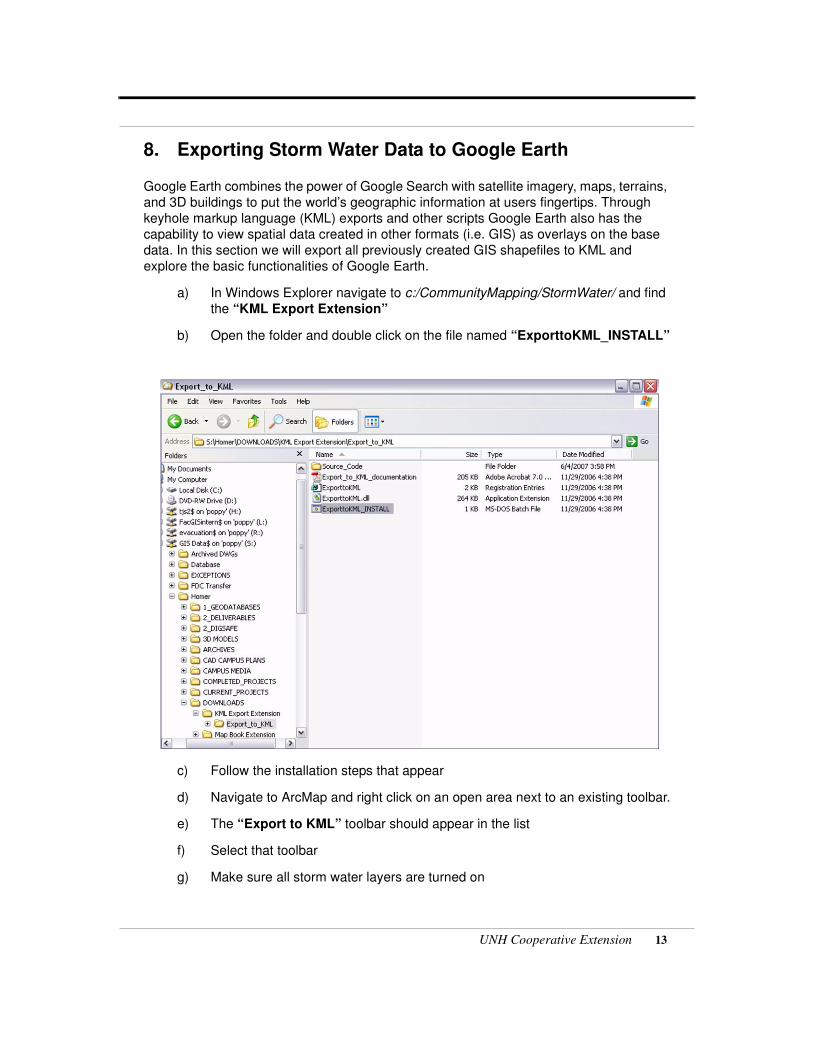
a) In Windows Explorer navigate to c:/CommunityMapping/StormWater/ and find
the “KML Export Extension”
b) Open the folder and double click on the file named “ExporttoKML_INSTALL”
c) Follow the installation steps that appear
d) Navigate to ArcMap and right click on an open area next to an existing toolbar.
e) The “Export to KML” toolbar should appear in the list
f) Select that toolbar
g) Make sure all storm water layers are turned on

Storm Water Mapping using ArcGIS and Google Earth
14 UNH Cooperative Extension
h) Left click the newly installed “Export to KML” button
i) Select the desired layer to export
j) Select “UNH_ID” as the field to label the features by
k) Set the “Export Location” to the c:/CommunityMapping/StormWater/.
l) Once all settings have been established left click “OK”
m) When the “Would you like to add... to Google Earth” dialog appears select
“No”
n) Repeat these steps for all storm water shapefiles
o) Once all shapefiles have been exported open Google Earth
p) Open Windows Explorer and navigate to the location of the KML files
q) Select all KML files
r) Drag these files into Google Earth
s) These files should now appear on the left hand side of the Google Earth win-
dow
t) To view the UNH Storm Water data double click on one of the imported layers;
the map should automatically zoom to that location
u) Take several minutes on your own to explore Google Earth and the various
spatial data functions it offers