chapter 1 introduction 1.1 background of...
TRANSCRIPT
1
CHAPTER 1
INTRODUCTION
1.1 Background of Study
The reduction of CO2 emission is probably one of the most talked about topics of
this 21st century. This is due to its effect on climate change and global warming. From
Previous research and studies by government and NGO’s, the world is dying as a result of
various Greenhouse gases (GHG) emission (IPCC, 2007b; IPCC, 2007a; NAS, 2008;
Theseira, 2010). CO2 is a greenhouse gas (GHG) and its increase, intensify the average
surface temperature of the earth affecting the ecosystems, sea levels, water resources,
agriculture, and global climate (CEC, 2002). In 1999, Malaysia became a signatory to the
Kyoto Protocol and declares the country’s agreement of the Protocol on 2002 under the
UNFCCC (UN, 1998). However, as a developing country, Malaysia had no quantitative
commitments under the Kyoto Protocol (Selamat & Abidin, 2010). Then in 2009 the United
Nations organized a world climate summit, held in Copenhagen. In the summit, a
Malaysian conditional proposal to reduce its CO2 emission to 40% by the year 2020 as
compared to its 2005 level was presented (Gruber, 2011; Mohamad, 2009). Nevertheless, to
reach this predicted CO2 reduction level, extensive action has to be taken in all contributing
sectors. According to a report released by the Malaysian Department of Environment
(MDOE) in 2010, the transport sector is one of the major contributing sectors estimated to
contribute about 45% of CO2 emission to the environment (Gallo, 2011). This could be

2
attributed to the social demographic and behavioral patterns of the human luxurious
lifestyle especially in Transportation; consistently this has resulted in a momentous burning
of fossil fuel (Schipper, et al., 1989; NAS, 2008). Taking into consideration that the modes
of transportation in Malaysia consist of buses; LRT monorail and airport express rail link,
taxis and commuter rail. The emissions are evenly distributed, especially on the road sector,
which dominates the mode of transport (National, 2008).
“Dato” Hajah Rosnani Ibarahim Director General, Department of Environment,
Malaysia as at 2006” said, meeting the 40% target depends on domestic environmental
awareness and individual compliance (Ang, 2010 ; Theseira, 2010). To this end, the
Malaysian Road Transport Department (JPJ) considers CO2 emission a potential threat to
its vision of a sustainable environment by 2020. CNG fondly called NGV (Natural Gas
Vehicles) in Malaysia is seen as a potential alternative fuel to gasoline, and from studies,
Natural gas now powers more than 12 million vehicles globally and about 53,783 vehicles
locally (Hasim, 2005; IANVG, 2011; ANGVA, 2013), Apart from Natural gas being
relatively low cost than gasoline or diesel fuel. Natural gas vehicles show an average
reduction in ozone-forming emissions of 80 percent compared to gasoline vehicles (MMD,
2009; IPCC, 2006). Shell Malaysia chairman Mohd Anuar Taib in one of his awareness
campaign speeches said, emissions from fossil fuels are currently responsible for 60% of
the world’s total GHG emissions (Daud, 2005). To this end, the use of CNG vehicles on the
Malaysian road as an alternative fuel to Gasoline seems to be a step in the correct direction.

3
1.2 Problem Statement
The use of CNG vehicles as a means of transportation in Malaysia, is hoped to
reduce CO2 exhaust emission, however, since its inception only few outcomes (results) on
exhaust emission levels have been achieved.
The International Energy Agency (IEA, 2010c) released data shows that Global CO2
emissions is on the increase and developing countries like Malaysia is seen as a major
culprits of this increasing trend (IEA, 2010a). Malaysia a developing country with about
28.318 million people (MDS, 2010) has one of the highest carbon emission intensity due to
rapid rise and robust expansion in its power, industrial, automotive and other sectors
(Canadel, et al., 2010).
CO2 is a Greenhouse gas and its increasing concentration contributes to global
warming, examples of which Malaysia has experienced some significant increase in
temperature and rainfalls as a side effect. However, Gasoline (Petrol) that contains high
carbon content producing high amount of CO2 emissions to the environment is still the
major fuel used on cars in Malaysia. According to JPJ (2012), the number of vehicles on the
Malaysian road has been on the rise over the past eight years. This is on an average of
approximately 520,000 new cars annually i.e. about 45 - 50% of which 90% are petrol
fueled cars, but the increases in CNG fueled cars is still between 3 to 5% (MAA, 2013).
4
1.3 Objectives of Research
This study is conducted to buttress the fact that CNG fueled cars, produces less CO2
exhaust gas emission as compare to Petrol cars. To this end, The Study focuses on two main
objectives:
1. To study the significant difference in CO2 emission from CNG and Petrol
Vehicles operating on the Malaysian road.
2. To investigate the optimum performance level of CO2 emission from cars
reducible by the year 2020.

5
1.4 Scope and Limitations of Study
The focus of this study is on the amount of CO2 emission reduced using CNG fuel
on vehicles. This research focuses only on Cars (Commercial and passenger cars) excluding
Motorcycles. It is also limited to cars running on petrol and CNG fuel excluding diesel.
This study was conducted experimentally on a Petrol fueled engine in comparison
with a CNG fueled engine. For this purpose, Information’s and results were collected from
books, journals, Internet sources and some relevant Malaysian government bodies like
Department of Statistic, Department of Environment and Department of Road
transportation.
The experiments were conducted at the University Kuala Lumpur Malaysia, France
Institute Automotive/Mechanical Engineering workshop in Bangi area during the spring of
2013. The experiments were carried out on two (2) vehicle engine types, the 4g15-
carburetor engine and the 1.6 CAMPRO IAFM injector engine while a Bosch- BEA 050
exhaust gas analyzer was used to experimentally determine the amount of CO2 emitted from
the exhaust. Both the 4g15-carburetor engine and the 1.6 CAMPRO IAFM injector engine
has been modified to run in the bi-fuel engine.
The study used the significant difference in CO2 emission from CNG and Petrol
Vehicles operating on the Malaysian road to investigate the optimum performance level of
CO2 emission reducible by year 2020.

6
1.5 Significance Of The Study
The Malaysian transportation industry considers CO2 emission a potential threat to
its vision of a sustainable environment by 2020 (JPJ, 2012).As a developing nation, the
rapid level of Modernization, urbanization and industrialization has resulted in the
transportation industry accounting for about 45% percent of all carbon dioxide (CO2)
emissions in Malaysia (Bari, et al., 2011; Wee, et al., 2008; Wei, et al., 2005), CNG vehicles
in Malaysia is seen as an alternative fuel to Gasoline, majorly because CNG costs about
50% less than gasoline, emits up to 80% fewer emissions than gasoline and many more
advantages (Bakar, 2008). However, since its inception, it is yet to achieve its full essence.
Although, findings shows the Malaysian interest in CNG is gradually increasing especially
among the road transportation sector (public transport like Taxis and Busses). United
Nations data shows Malaysia’s carbon emissions in year 2006 stood at 187 million tonnes
or 7.2 tonnes from each Malaysian (Mohamad, 2009) while the numbers of NGV in
Malaysia is still below 100,000 as against 12,139,275 total vehicles in Malaysia (excluding
Motorcycles) with 174 stations as at June 2013 (ANGVA, 2013). Currently, there are
several dedicated AFV options in existence, however, In Malaysia; CNG stands out with
some significant qualities, this makes it a realistic option for large-scale deployment in the
reduction of CO2emission especially in the Transport sector. From a Global perspective,
many countries like the United States, Ireland, China and India aim to reduce it greenhouse
gas (GHG) emissions to a minimum level by year 2020 (G8, 2007). Natural gas stands the
chance of being the initial fuel source to best achieve a sustainable energy future in
Malaysia; due to its huge reserved availability which saw an increased from 315 billion
cubic feet (cu ft) in 1990 to more than 1,260 cu ft as at 2010 (Chin, 2012). The
International Energy Agency reported that the emission from fossil fuels is affecting the

7
world Climatic condition, so managing CO2 emissions especially from fossils fuel is
essential in tackling climate change and should be done from all contributing sector (IEA,
2010b). According to Andrew Chan the executive director of PwC Advisory Services
Malaysia, he points out that the first step in carbon management is to establish a baseline
inventory, that is, to determine the level of carbon emitted to the atmosphere (Bari, et al.,
2011). This will allow the transport industry to strategically identify and manage its carbon
emissions considerably.

8
CHAPTER 2
LITERATURE REVIEW
2.1 Introduction
This chapter talked about previous studies and researches relevant to this topic. It
begins with the Malaysian concern on CO2 emission in proper context with global
initiatives; it explains how CO2 emission relates to transportation as a contributing sector.
Thereafter, CNG as an alternative fuel to petrol was reviewed as studied by other concerned
researchers, government and NGO’s Agencies.
2.2 CO2 Emission Footprint In Malaysia
Malaysia as a developing country has one of the highest carbon emission intensity of GDP
1.4 million metric tons (MT) as at 2008 (MDOE, 2010)with about 28.318 million people its
emissions growth is one of the fastest (MDS, 2010); it grew by 221 per cent from 1990 to
2004 accounting for about 0.6 per cent total share of global carbon emissions While its CO2
emissions per capita (tCO2) was at 7.5 per cent (UN, 2010). This rapid rise is as a result of
the robust expansion in its power, industrial and automotive sectors together with the over
dependence on fossil fuel as its Total Primary Energy Supply (TPES) (Canadel, et al.,
2010). In 2009, the world climate summit, organized by the United Nations in Copenhagen
saw about 200 nations and some other 45,000 participant at the sidelines gathered for two
weeks attempting to forge a legally binding international environmental agreement with the
goal of hammering out a meaningful and fair part to a carbon-free world. Though, not
entirely successful, the end of the meeting saw leaders of the US and the BASIC group of

9
countries (Brazil, South Africa, India and China) battering out a dramatic last-minute deal,
which on the final day of the summit, produced, what became known as, the ‘Copenhagen
Accord’ (UNFCCC, 2010). The Copenhagen Accord is noted as an informal setting, where
each country says what it is prepared to do. Though non-binding and non-formal, it must be
regarded as an important step forward because “Better a declaration than none at all”. The
Malaysian Prime Minister Datuk Seri Najib Tun Razak delivered in the summit a
Malaysian proposal to reduce its CO2 emission to 40% by the year 2020 as compared to its
2005 level, subjected to assistance from developed countries in the form of technology
transfer and adequate financing (Mohamad, 2009; Ang, 2010 ; ACIR, 2010, May 25). CO2
emission; since becoming a subject of global interest has witness a high level commitment
and development, gaining momentum amongst governmental and NGO’s in setting motion
initiative targeted towards a carbon-free world. To this effect, most of the research done by
automotive manufacturers, universities or research organizations has focused on how to
reduce the CO2 emission by improving the gasoline/diesel fuel engines (Bakar, et al.,
2007c). However, its level of pollutant still threatens the main fabric of life in this planet.
From a Global perspective, China and India aim to reduce emissions by up to 45% and 25%
respectively by 2020 (A.D., 2005; UNEP, 2008). Some other countries like Ireland are
imposing carbon taxes others like the United States and some European countries are
intensifying their effort to make greenhouse gas (GHG) emission disclosure mandatory
(G8, 2007) (Wee, et al., 2008). According to Andrew Chan the executive director of PwC
Advisory Services Malaysia (Bari, et al., 2011), the first step in carbon management is to
establish a baseline inventory; to this end, a paper has been written and presented on this
topic ‘the reduction of CO2 emission in Malaysia transport industry: using compressed
natural gas as alternative fuel as shown in Appendix 3.
10
2.3 Carbon Dioxide (CO2) Emission
CO2 is one of the largest suppliers to greenhouse effect and this is due to cellular
respiration and burning of fossil fuels by humans. According to NIOSH standards CO2 is a
naturally occurring atmospheric gas that is considered safe at levels below 0.5% (CCOHS,
2005; NIOSH, 1997. ). This is because as a product, it is a colorless, odorless and a non-
flammable gas with a molecular weight of 44.01g/mol (Shah, 2011). Although, without
CO2 and its greenhouse activity, the earth would be too cold to support life, however, Small
changes in atmospheric CO2 leads to much larger changes in the amount of energy trapped
through greenhouse activity (Nelson, 2000) and external air factors are mostly related to the
fact that CO2 is denser than ambient air so therefore, tends to accumulate near the ground
surface (Farrar et al. 1999). Thus, Control of the emission of CO2 is taken as an important
issue. The International Energy Agency (2010) released data shows that global CO2
emissions is on the increase by 0.4 Gt CO2 between 2007 and 2008, which represented a
growth rate of 1.5%. According to the report, the culprits of this increasing trend are the
developing countries like Malaysia (IEA, 2010a). United Nations shows that at 2006,
Malaysia's annual CO2 emissions stood at 187 million metric tons and it is equivalent to7.2
metric tons per capita per year (MDOE, 2010; Mohamad, 2009). According to the data, it
shows that Malaysia is the third highest emitter in the Southeast Asian region behind
Indonesia with 333 million metric tons and Thailand with 273 million metric tons. On per-
capita basis, Malaysia also placed third in the SEA region with Brunei topped the list at
15.5 metric tons and followed by Singapore at 12.8 metric tons per capita (Netto, 2009).
Over the past 100 years, the number of anthropogenic greenhouse gases emissions in the
atmosphere is increasing yearly particularly carbon dioxide (CO2) (Humlum, 2011).

11
2.4 Main Contributing Sector To Co2 Emissions In Malaysia
The International Energy Agency (IEA, 2010c) released data shows that global
CO2 emission is on the increase by 0.4 Gt CO2 between 2007 and 2008, which represented
a growth rate of 1.5%. And according to the report, the culprits of this increasing trend are
the developing countries, of which Malaysia is not left out (IEA, 2010a). Human activity
through industrialization, agriculture activity, power generation, and transportation are
believed to be the main contributor of CO2 emissions to the atmosphere (IPCC, 2007a).
(Beniston, 2002). In 2011 further energy report shows that the energy sector contributed
the largest anthropogenic carbon dioxide emissions with 41% of the entire world CO2
emissions annually. Transportation sector comes next with 23%, industry and
manufacturing sector with 20%, residential area with 6% and others at 10%(IEA, 2011b;
Wee, et al., 2008). With emphasis on the 23% global CO2 emissions by the transport sector,
a recent OECD study reported that the global CO2 emissions from transport grew by 45%
from 1990 to 2007 and are expected to continue to grow by approximately 40% from 2007
to 2030 – though this is lower than pre-crisis estimates (National, 2008). Others includes
commercial/public services, agriculture/forestry, fishing, energy industries and others too
neumerous to mention (index, 2012). According to the Malaysian Department of
Environment (MDOE), the Malaysia transport sector contributes 40% CO2 emission to the
environment due to consistent burning of Fossil fuel. This sector accounts for
approximately 15% of overall greenhouse gas emissions (MDOE, 2010). In Malaysia,
emissions from motor vehicles were the main source of air pollution, burdening to at least
70–75 percent of the total pollutants during last 5 years. As reported by the Department of
Environment Malaysia, only in 1996, the percentage of the emission loads from different
sources to its air were motor vehicles, 82 percent; power stations, 9 percent; industrial fuel

12
burning, 5 percent; industrial production processes, 3 percent; domestic and commercial
furnaces, 0.2 percent; and open burning at solid waste disposal sites, 0.8 percent (DOE,
2001). Obviously, huge number of passenger cars in use was the main source of
atmospheric pollution in Malaysia.
Figure 1: CO2 emissions in Malaysia by sector, 1990-2008
Source: (Green Tec, 2008)
As distinctively shown in Figure 1, the breakdown of CO2 emission by sector shows that
transportation seconds the list by 45% of increasing from year 1990-2008. In 2005,
Malaysia became a net emitter of greenhouse gases (Al-Mofleh, et al., 2009). The energy
sector is the biggest source of emissions, with fugitive emissions from oil and gas systems
accounting for 10 per cent of total emissions. Transportation generation is the largest
emitting sector, accounting for 43 per cent of total emissions, and it is estimated that,
without mitigation measures, 286 million tons of CO2 will be emitted in 2020.

13
2.5 Environmental And Health Effects Associated With CO2
2.5.1 Global Warming/ Climate Change Effects On Malaysia
Malaysia also has experienced some significant increase in temperature as a
side effect of global warming. This could be as a result of Greenhouse gases (GHG)
emission like CO2, SO2, NOx, CO and HC which aids in insulating the atmosphere
thus depriving reflected gas energy from escaping the surface-troposphere system
back to space resulting in "global warming/climate change” (Shah, 2011). The
Climate Change report by IPCC (2006) stated that, since 1900, the global
temperature has increased by 0.7°6C and It is predicted to continue with an increase
of about 2°C between 1990 and 2100 (O’Sullivian & & Morrall, 1996). According
to the Malaysian Meteorological Department, the mean temperature recorded
between 1998 and 2007 saw an average upsurge of 0.5°C to 1.5°C recorded in
Peninsular Malaysia, and an average upsurge of 0.5°C to 1.0°C in East Malaysia
(BERNAMA, 2013). With this continual increase, the temperature is projected to
increase further with an elevation of about 3.5°C by the end of the 21st century
(MMD, 2009). Consequently, series of Floods were experienced in 2005, 2006 and
2007 hitting a few states that were not prone to flood until recent years, such as
Johor and Sarawak with an estimated losses of about RM4 billion. According to
national news agency BERNAMA (2013), the flood situation in Pahang, Johor and
Terengganu had worsened with more than 9,000 people evacuated to Flood Relief
Centers (FRC) These events could be linked to flared gases such as carbon dioxide
(CO2), methane (CH4), Nitrous oxide (N2O), sulfur hexafluoride (SF4), Hydro
fluorocarbons (HFCs), and Per fluorocarbons as a resultant agent (PFCs) (IPCC,
2006a; IPCC, 2007a). Although, from previous studies, carbon dioxide is not the
14
most potent GHG among the list, but it is one of the largest generated anthropogenic
source, which contribute to the issue of global warming and climate change.
2.5.2 Environmental Air Pollution In Malaysia
In Malaysia, emissions from motor vehicles have been the main source of air
pollution, burdening to at least 70–75 percent of the total pollutants during last 5
years (Afroz, et al., 2003). The Department of Environment Malaysia, in 1996,
Reported a breakdown per sources in percentage, of the total emission exposed to
the atmosphere, of the list was, motor vehicles, 82 percent; power stations, 9
percent; industrial fuel burning, 5 percent; industrial production processes, 3
percent; domestic and commercial furnaces, 0.2 percent; and open burning at solid
waste disposal sites, 0.8 percent (MDOE, 1996). Obviously, from the list, huge
number of motor vehicles in use was the main source of atmospheric pollution.
These vehicles also discharge about 75 percent of the total CO and 76–79 percent of
the oxides of sulfur and nitrogen. This resulted in the establishment of the
Environmental Quality (Control of Emission from Petrol Engines) Regulation 1996
P.U. (A) 543/96 and Environmental Quality (Control of Emission from Diesel
Engines) Regulation P.U. (A) 429/96 (MDOE, 1996). In recent years, the
environmental legislations exerted a notable influence to hold pollutant gas
emissions from vehicles. In January 2000, the European regulation EURO-III came
into force and promulgated severe limits to the allowable exhaust pipe emissions
from vehicles (Afroz, et al., 2003). However, the amount of greenhouse gases
emission by transportation sector has not yet been analyzed. On the other hand, due
to rapid economic growth and infrastructure development, the usage of petrol and
diesel fuels in transportation sector has rather increased tremendously. So in terms

15
of reduction, Malaysia needs to reduce up to at least 38 million metric tons of
carbon annually to achieve the 40% target by the Prime Minister (Ang. 2010).
Figure 2: Malaysian Air Pollutant Emission Load from All Sources, 2007-2008)
(Sources: National, 2008)
The Malaysian government recognizes the extent, to which climate change
would affect its citizen’s wellbeing as well as threatened the sustainability of it
natural resources, to this end, the governments are encouraging the use of
alternative fuels in motor vehicle engines, and compressed natural gas CNG has
proven a viable alternative fuel (Nylund, et al., 2002).
2.5.3 Human Health Effects Associated With CO2 Exposure
In the atmosphere, CO2 is present at 0.035% (350 ppm) and this poses no
threat to human health, however, considerably higher concentrations produce
adverse effects (Aerias, 2005). Preliminary evaluation of CO2 effects in human
populations suggests that acute exposure to CO2 concentrations and prolonged
exposure to concentrations may significantly affect the human health in a general
16
population (Rice S.A., 2004; Nelson, 2000). A value of 40,000 ppm is considered
immediately dangerous to life and health. Based on this fact, a 30-minute exposure
to 50,000 ppm produces intoxication, and concentrations greater than that, produce
unconsciousness, Coma, convulsions and death (NIOSH, 1997; IPCC, 2007).
2.6 Chronological Framework Of CNG Vehicles In Malaysia
2.6.1 Introduction of CNG as Alternative Motor Fuels in Malaysia
CNG also referred to as NGV (Natural Gas Vehicles) in Malaysia; was
initiated during the late-1990s by PETRONAS. In 1984, PETRONAS NGV Sdn
Bhd, a subsidiary of the state-owned Malaysian oil and Gas Company started the
research and development of natural gas, by carrying out a feasibility study
specifically to assess the viability of utilizing natural gas in the transportation sector
(Daud, 2005; Das, et al., 2000). The study identified several benefits amongst which
were its secured supply and environmental friendly characteristics to the country
and consumers (Daud, 2005). Furthermore, between1986-1988; a pilot programme
was formally initiated at the Gas Processing Plant in Kertih, Terengganu to help lay
the structure for a commercial programme. Thereafter, One NGV refueling outlet
was constructed and 21 PETRONAS owned vehicles were converted to bi-fuel
operation (Daud, 2005). The result of the pilot programme proved successful that
Natural Gas Vehicles (NGV) can operate favorably under the Malaysian condition
with several benefits. Due to this great discovery, in 1991 the Government gave an
approval to PETRONAS, encouraging the starting up of a Commercial Programme
in Klang Valley to further improve the efficiency for a wider implementation of
NGV in the country (Daud, 2005). Although as at then, there were little or no

17
awareness, Six (6) stations natural gas refueling station under the Mother-daughter
concept were established in the Klang Valley through the Natural Gas Distribution
System (NGDS), supplied from the Peninsular Gas Utilization (PGU) project. At the
same time, due to the limited gas network distribution in the country, a conventional
station was established in Mire and by mid-1992, there were about seven fully
operational stations and also a total of 930 vehicles were converted to bi-fuel
operation, thereby monopolizing the provision of CNG to road users but as at then,
marketing NGV was a big challenge due to customer’s acceptance of the product.
This was as a result of some sense of comfort with the traditional fuels and
skepticisms on whether NGV is a reliable product as promoted. But later on, with
various awareness campaigns and incentives placed on NGV by the government, the
erroneous perception that NGV was “dangerous” was appropriately corrected.
Although yet to have a total level of acceptability, the use of CNG in the Transport
industry is still generally seen amongst taxicabs predominantly in the Klang Valley,
Johor Bahru and Penang (EIA, 1998).
2.6.2 Development of Natural Gas in Malaysia
Natural gas production in Malaysia has been rising steadily in recent years;
reaching about 1.89 Tcf in 2003.This is due to the fact that it has about 75 trillion
cubic feet Tcf of proven natural gas reserves (Sun, et al., 1998). Also, Natural gas
consumption is on the rise, in 2003 it was estimated at 1.008 Tcf, with LNG exports
of around 0.882 Tcf mostly to Japan, South Korea, and Taiwan (EIA, 2005 )
(Aldrich & Chandler, 1997). One of the most active areas in Malaysia for gas
Exploration and development is the Malaysia-Thailand Joint Development Area
JDA, located in the lower part of the Gulf of Thailand and governed by the

18
Malaysia- Thailand Joint Authority MTJA. The two governments for joint
exploration of the once-disputed JDA established the MTJA. The JDA covers
blocks A-18 and B-17 to C-19. A 50:50 partnership between PETRONAS and
Amerada Hess is developing block A-18, while the Petroleum Authority of
Thailand PTT and PETRONAS also share equal interests in the remaining
blocks.PTT and PETRONAS announced an agreement in November 1999 to
proceed with development of a gas pipeline from the JDA to a processing plant in
Songkla, Thailand, and a pipeline linking the Thai and Malaysian gas grids.
Malaysia and Thailand will eventually take half of the gas produced, though initial
production will go just to Malaysia (Bakar, et al., 2007a). Construction began in
2002, and the delivery of natural gas into Malaysia began in the first quarter of
2005. Malaysia accounted for approximately 14% of total world LNG exports in
2003. In February 2000, PETRONAS signed a contract with a consortium headed
by Kellogg Brown and Root for construction of the Malaysian LNG Tiga facility in
Bintulu, Sarawak. Two LNG liquefaction trains and a total capacity of 7.6 million
metric tons 370 Bcf per year were built and completed in April 2003. The Bintulu
facility as a whole is now one of the largest LNG liquefaction center in the world,
with a total capacity of 23 million metric tons 1.1 Tcf per year. In 2004, Shell
brought two additional fields online, Jintan and Serai both of which feed into the
Bintulu export terminal. Malaysia holds the world NG reserves of about 1.2% and
the largest NG producer in South East Asia region. As such this should serve as an
incentive for further growth of NGV in Malaysia (Bakar, et al., 2007a).
19
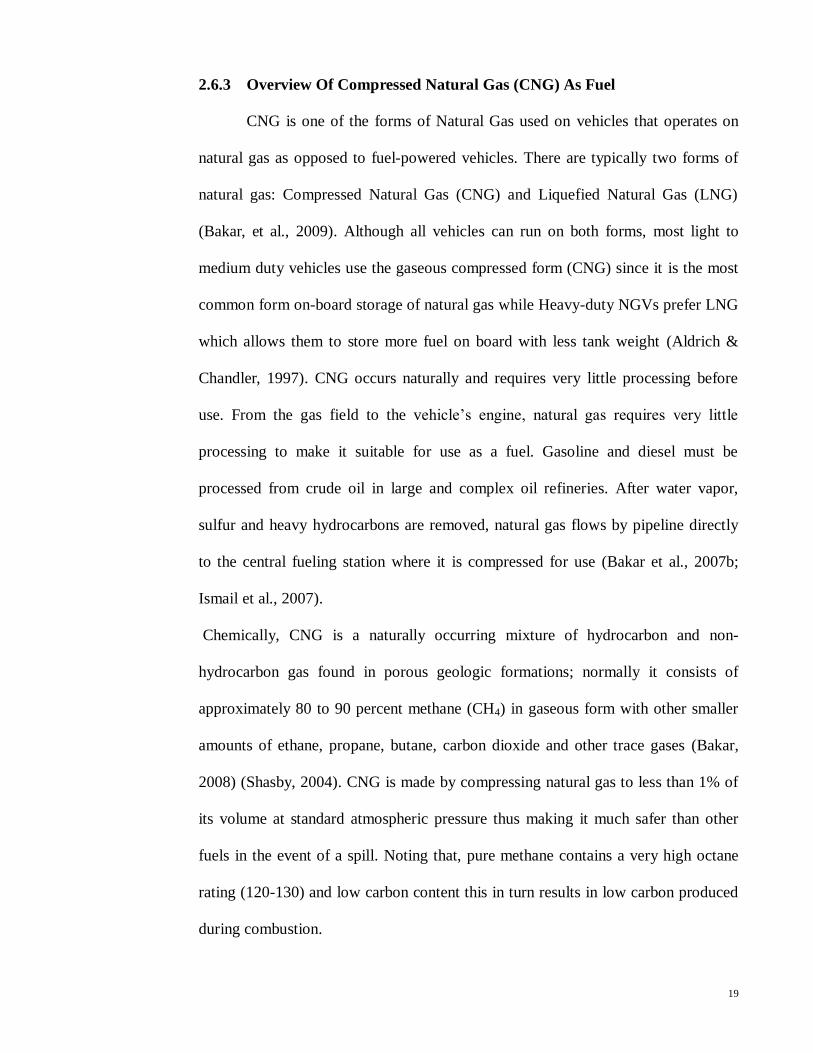
2.6.3 Overview Of Compressed Natural Gas (CNG) As Fuel
CNG is one of the forms of Natural Gas used on vehicles that operates on
natural gas as opposed to fuel-powered vehicles. There are typically two forms of
natural gas: Compressed Natural Gas (CNG) and Liquefied Natural Gas (LNG)
(Bakar, et al., 2009). Although all vehicles can run on both forms, most light to
medium duty vehicles use the gaseous compressed form (CNG) since it is the most
common form on-board storage of natural gas while Heavy-duty NGVs prefer LNG
which allows them to store more fuel on board with less tank weight (Aldrich &
Chandler, 1997). CNG occurs naturally and requires very little processing before
use. From the gas field to the vehicle’s engine, natural gas requires very little
processing to make it suitable for use as a fuel. Gasoline and diesel must be
processed from crude oil in large and complex oil refineries. After water vapor,
sulfur and heavy hydrocarbons are removed, natural gas flows by pipeline directly
to the central fueling station where it is compressed for use (Bakar et al., 2007b;
Ismail et al., 2007).
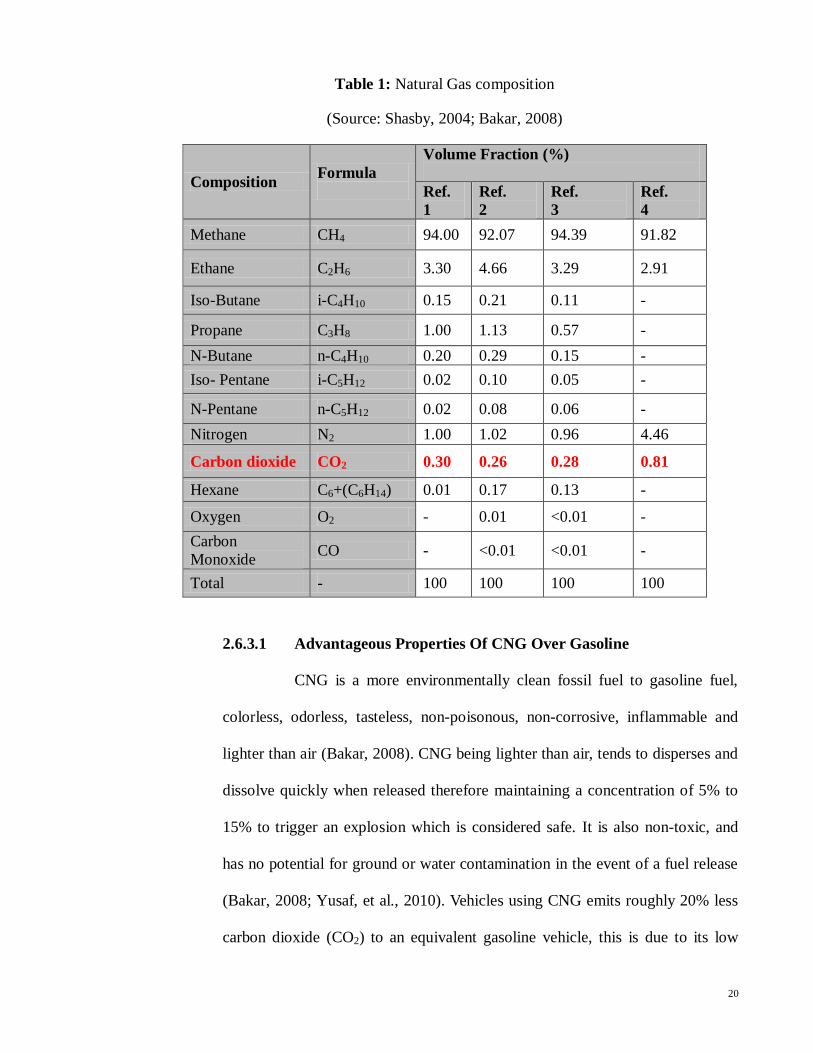
Chemically, CNG is a naturally occurring mixture of hydrocarbon and non-
hydrocarbon gas found in porous geologic formations; normally it consists of
approximately 80 to 90 percent methane (CH4) in gaseous form with other smaller
amounts of ethane, propane, butane, carbon dioxide and other trace gases (Bakar,
2008) (Shasby, 2004). CNG is made by compressing natural gas to less than 1% of
its volume at standard atmospheric pressure thus making it much safer than other
fuels in the event of a spill. Noting that, pure methane contains a very high octane
rating (120-130) and low carbon content this in turn results in low carbon produced
during combustion.
20
Table 1: Natural Gas composition
(Source: Shasby, 2004; Bakar, 2008)
Composition Formula
Volume Fraction (%)
Ref.
1
Ref.
2
Ref.
3
Ref.
4
Methane CH4 94.00 92.07 94.39 91.82
Ethane C2H6 3.30 4.66 3.29 2.91
Iso-Butane i-C4H10 0.15 0.21 0.11 -
Propane C3H8 1.00 1.13 0.57 -
N-Butane n-C4H10 0.20 0.29 0.15 -
Iso- Pentane i-C5H12 0.02 0.10 0.05 -
N-Pentane n-C5H12 0.02 0.08 0.06 -
Nitrogen N2 1.00 1.02 0.96 4.46
Carbon dioxide CO2 0.30 0.26 0.28 0.81
Hexane C6+(C6H14) 0.01 0.17 0.13 -
Oxygen O2 - 0.01 <0.01 -
Carbon
Monoxide CO - <0.01 <0.01 -
Total - 100 100 100 100
2.6.3.1 Advantageous Properties Of CNG Over Gasoline
CNG is a more environmentally clean fossil fuel to gasoline fuel,
colorless, odorless, tasteless, non-poisonous, non-corrosive, inflammable and
lighter than air (Bakar, 2008). CNG being lighter than air, tends to disperses and
dissolve quickly when released therefore maintaining a concentration of 5% to
15% to trigger an explosion which is considered safe. It is also non-toxic, and
has no potential for ground or water contamination in the event of a fuel release
(Bakar, 2008; Yusaf, et al., 2010). Vehicles using CNG emits roughly 20% less
carbon dioxide (CO2) to an equivalent gasoline vehicle, this is due to its low
21
volumetric energy density estimated to be about 25% that of Diesel fuel, CNG is
compressed to a pressure of about 3000 to 4000 psi, or 205 to 275 bar and a
temperature around -160°C to enhance the vehicle on-board storage in a
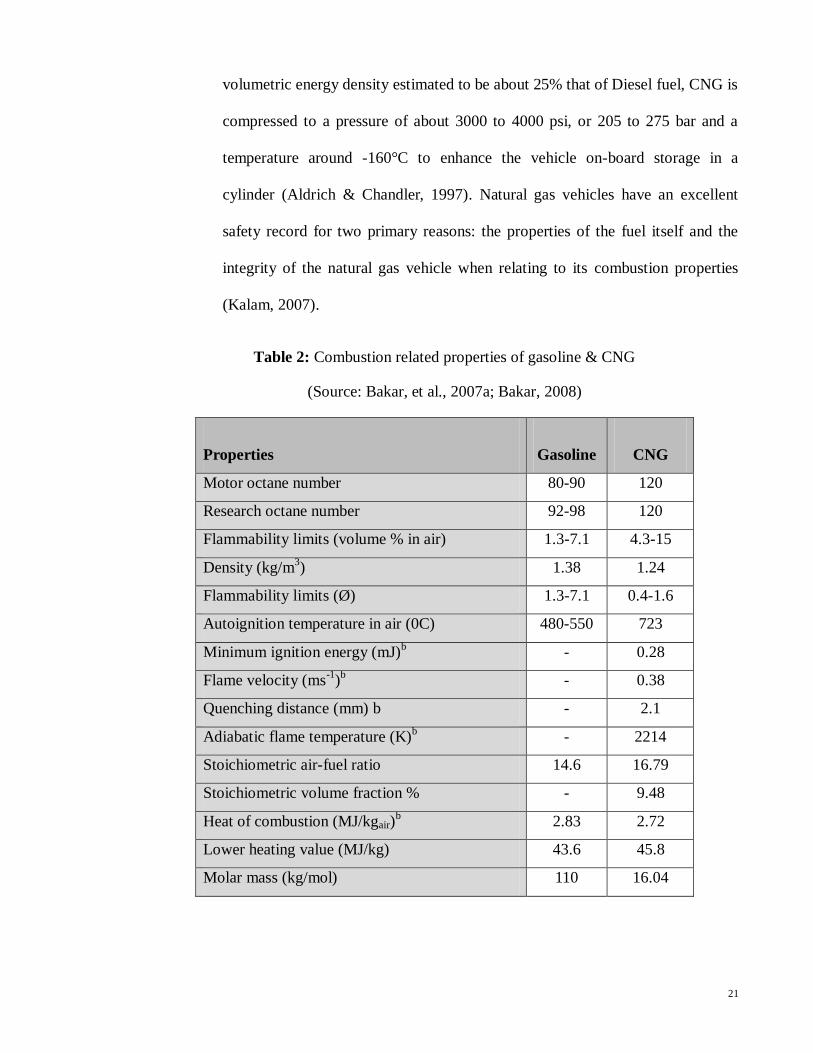
cylinder (Aldrich & Chandler, 1997). Natural gas vehicles have an excellent
safety record for two primary reasons: the properties of the fuel itself and the
integrity of the natural gas vehicle when relating to its combustion properties
(Kalam, 2007).
Table 2: Combustion related properties of gasoline & CNG
(Source: Bakar, et al., 2007a; Bakar, 2008)
Properties
Gasoline
CNG
Motor octane number 80-90 120
Research octane number 92-98 120
Flammability limits (volume % in air) 1.3-7.1 4.3-15
Density (kg/m3) 1.38 1.24
Flammability limits (Ø) 1.3-7.1 0.4-1.6
Autoignition temperature in air (0C) 480-550 723
Minimum ignition energy (mJ)b - 0.28
Flame velocity (ms-1
)b - 0.38
Quenching distance (mm) b - 2.1
Adiabatic flame temperature (K)b - 2214
Stoichiometric air-fuel ratio 14.6 16.79
Stoichiometric volume fraction % - 9.48
Heat of combustion (MJ/kgair)b 2.83 2.72
Lower heating value (MJ/kg) 43.6 45.8
Molar mass (kg/mol) 110 16.04

22
2.6.3.2 Types of CNG in Malaysia
Currently, most of the CNG engine vehicles in Malaysia are
converted from the gasoline engine; though fully made CNG vehicles are
available, there are 3 main type of CNG fuel engine (Kalam, 2007).
1. Bi-fuel CNG engine: This is the most popular type of CNG
engine use by taxis in Malaysia. It is developed from a
conventional gasoline fuel engine and modified with ability to
run on either CNG or gasoline/diesel (Kalam, 2007).
2. Dual fuel CNG engine: This type of engine can run on natural
gas plus pilot oil or on diesel only. It can also switch back to
conventional diesel operation. This is used in heavy-duty vehicle
such as urban buses. However, this also contributes to high
amount of emission due to the stop and start nature of urban
buses (Kalam, 2007).
3. Mono fuel CNG engine/ Dedicated CNG engine: This type is
designed to run solely on CNG. It is designed to optimize the
advantages of using only natural gas as fuel. It has a better
performance and lower emissions than bi-fuel vehicles (Kalam,
2007).
2.6.4 Current Research On CNG Fuelled Engine
A lot of theoretical researches, practical analysis have been carried out in the
quest to further improve and encourage the use of CNG, however, the performance
parameters of a four-cylinder diesel engine still stands out as a disturbing factor for
CNG. Yusaf (2010) studied on the engine performance and emission of CNG and

23
gasoline of a retrofitted car engine. From the results, at 80% throttle position, the
CNG fuel produced 10.86% less brake power when compare to gasoline. Also
discovered was that, the specific fuel consumption (SFC) for CNG fuel was always
lower than that for the gasoline due to the slow burning and higher heating value of
the CNG. The exhaust gas temperature of CNG was 24.21% higher than gasoline at
80% throttle conditions. This is because of the higher heating value and ignition
temperature of the CNG compare to gasoline (Yusaf, et al., 2010), (Jahirul, et al.,
2010). Consequently, from the research, focusing on the performance analysis of a
4-stroke SI engine using CNG, the volumetric efficiency of CNG fuelled engine
was lower about 12.3% than petrol engine (Yusaf, et al., 2010; Shamekhi &
Khatibzadeh, 2008) thereby leading to a reduction in the amount of oxygen in each
cycle, therefore causing a lower engine torque and power compare to gasoline as
fuel. This was due to the higher heating value and leaner combustion of CNG
compared to gasoline but the thermal efficiency when using CNG as fuel shows an
increase value of 32% at 2000rpm. This was caused by the higher CNG calorific
value and lower engine fuel consumptions (Yusaf, et al., 2010). He also studied on
the effect of fuel density on the performance of a CNG fuelled engine. Based on the
result, they found that the CNG fuelled engine produced lower brake power
compared with gasoline fueled engine. The power loss is due to low density of
natural gas where gaseous form of fuel occupies a larger volume per unit energy
than a liquid fuel. Other reasons were the low flame speed, lower cylinder pressure
and high CNG temperature (Yusaf, et al., 2010). But generally the CNG vehicles
now have specific lower fuel consumption and higher thermal efficiency, which
serves as an advantage to diesel and gasoline (Jahirul, et al., 2010). In 1998,
PETRONAS jointly manufactured 1000 monogas vehicle (dedicated CNG vehicle)
24
and Enviro 2000 NGV taxis with the cooperation from MATRA of France (Daud,
2005). The engine and the CNG equipment’s including the composite cylinder were
proven to withstand the hot and humid climate and the traffic condition in Malaysia.
A test was conducted and found that the emissions from the vehicles that have
operated more than 400,000km are still able to meet Euro 2 standard (Ganesan,
2003). It was also explained that the specific fuel consumption varies with the load
and speed. The overall performance of the engine depends on the inter-relationship
between power output, speed and the specific fuel consumption.
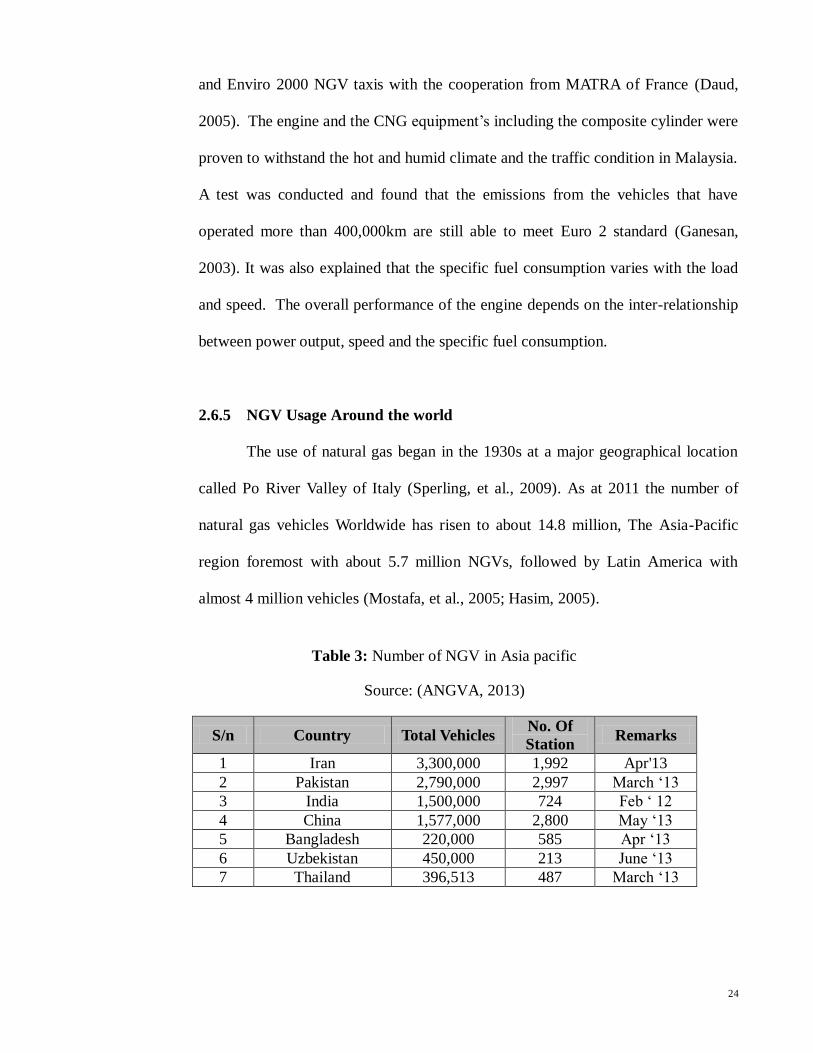
2.6.5 NGV Usage Around the world
The use of natural gas began in the 1930s at a major geographical location
called Po River Valley of Italy (Sperling, et al., 2009). As at 2011 the number of
natural gas vehicles Worldwide has risen to about 14.8 million, The Asia-Pacific
region foremost with about 5.7 million NGVs, followed by Latin America with
almost 4 million vehicles (Mostafa, et al., 2005; Hasim, 2005).
Table 3: Number of NGV in Asia pacific
Source: (ANGVA, 2013)
S/n Country Total Vehicles No. Of
Station Remarks
1 Iran 3,300,000 1,992 Apr'13
2 Pakistan 2,790,000 2,997 March ‘13
3 India 1,500,000 724 Feb ‘ 12
4 China 1,577,000 2,800 May ‘13
5 Bangladesh 220,000 585 Apr ‘13
6 Uzbekistan 450,000 213 June ‘13
7 Thailand 396,513 487 March ‘13

25
Table 3 continued: Number of NGV in Asia pacific
Source: (ANGVA, 2013)
8 Japan 42,590 314 March ‘13
9 Malaysia 53,783 174 June ‘13
10 Korea 35,872 190 Jan ‘12
11 Myanmar 30,005 51 May ’12
12 Tajikistan 10,600 53 Dec ’07
13 Kyrgyzstan 6,000 6 Dec ’07
14 Australia 2,825 47 Jan ’09
15 Indonesia 5,690 9 Dec ‘12
16 Singapore 5,522 4 Dec ‘11
17 United Arab
Emirates 2,801 17 Apr ‘13
18 New Zealand 201 14 Dec ‘10
19 Philippines 71 3 Oct ‘11
20 Vietnam 462 7 July ‘12
21 Kazakhstan 3,200 2 July ‘12
10,433,135 10,689
From the Table 1 above, it can be deduced that half of the world natural gas vehicles
and stations are in Asia Pacific and Top 10 NGV countries worldwide, 5 from Asia
Pacific, with Iran leading the table with about 2.86 million NGVs and 1820
refueling station of about 1999 million. According to (Mostafa, et al., 2005), the
growth in Iran's NGV market is as a result of its government policy to reduce the
effect of sanctions on Iran and make the nation’s domestic market less dependent on
imported gasoline. The government plans to have a number of 4500 CNG refueling
station in Iran by 2020 (Mostafa, et al., 2005). Although Malaysia seems to be in the
list, it is seen that the numbers of NGVs in Malaysia still hasn’t gotten up to
100,000.
26
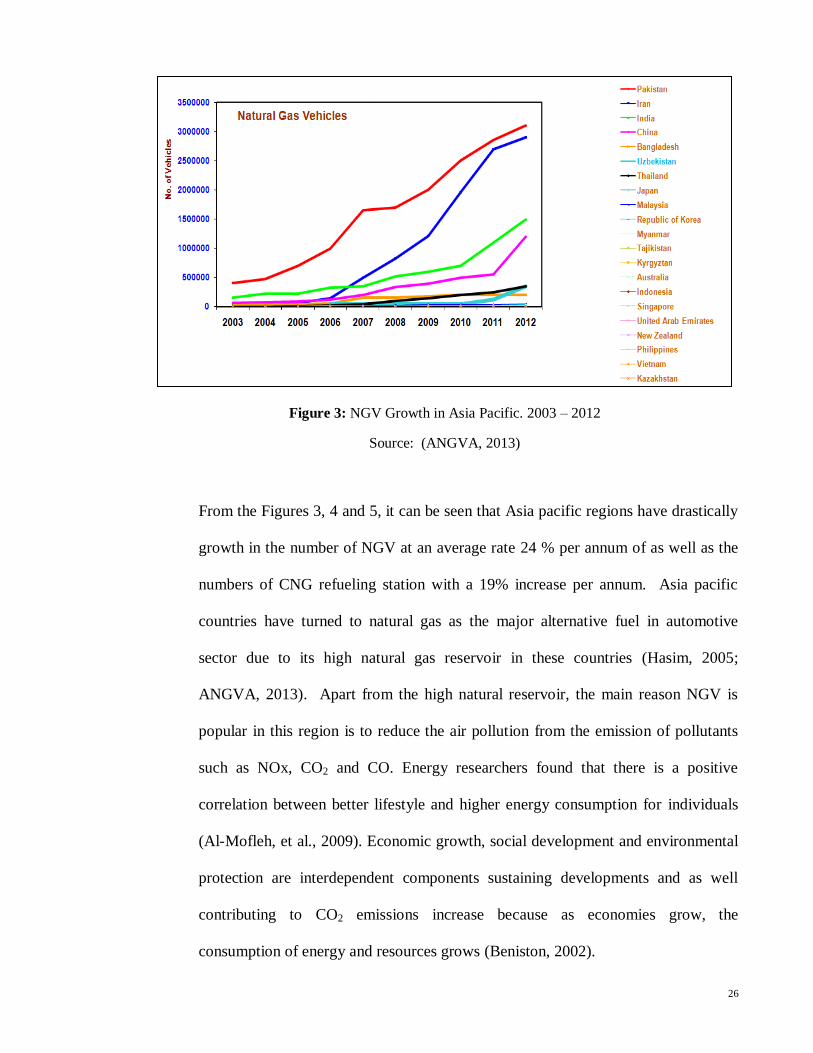
Figure 3: NGV Growth in Asia Pacific. 2003 – 2012
Source: (ANGVA, 2013)
From the Figures 3, 4 and 5, it can be seen that Asia pacific regions have drastically
growth in the number of NGV at an average rate 24 % per annum of as well as the
numbers of CNG refueling station with a 19% increase per annum. Asia pacific
countries have turned to natural gas as the major alternative fuel in automotive
sector due to its high natural gas reservoir in these countries (Hasim, 2005;
ANGVA, 2013). Apart from the high natural reservoir, the main reason NGV is
popular in this region is to reduce the air pollution from the emission of pollutants
such as NOx, CO2 and CO. Energy researchers found that there is a positive
correlation between better lifestyle and higher energy consumption for individuals
(Al-Mofleh, et al., 2009). Economic growth, social development and environmental
protection are interdependent components sustaining developments and as well
contributing to CO2 emissions increase because as economies grow, the
consumption of energy and resources grows (Beniston, 2002).

27
2.7 CNG Vehicle Usage In Malaysia Transport Industry
2.7.1 Number of Total Vehicles on the Malaysia Road
The number of vehicles on the road in Malaysia has been on the rise over
the past eight years as shown in Table 3. On an annual average, there are
approximately 520,000 new cars and 480,000 new motorcycles registered with the
Malaysian Road Transport Department i.e. about 45 - 50% increase in vehicles
(MAA, 2013; JPJ, 2012). In 2010, the then Transport Minister Datuk Seri Kong
Cho Ha said, in total, the number of vehicles in Malaysia increased from 19,016,782
in 2009 to about 21.25 million in 2010 (NGV, 2012). This increase has resulted to a
more demand on fuel usage and air pollution increased (EIA, 1998).
From the ministry of transport Malaysia as stated in Table 4, the total numbers of
automobile as at 31st December 2012 shows that there are about 22.7 million
Table 4: Total Motor Vehicles in Malaysia year 2012
Source: (JPJ, 2012)
(JPJ, 2012)
28
automobiles on Malaysian road i.e. to say, out of the 28.318 million Malaysians
from statistics, there is one vehicle for every 1.2 Malaysians. Due to urbanization,
these vehicles are concentrated in high-density locations such as the Federal
Territories (Wilayah Persekutuan) recording the highest number of registrations of
5,320,562 vehicles in total, followed by Johor (3,094,956) and Selangor
(2,466,115). Although Penang came fourth on the list with a total 2,326,216
vehicles, places like Perak and Sarawak, Sabah and Kedah seems to be increasing at
a fast pace with each registering above 1 million vehicles as at 31st (JPJ, 2012).
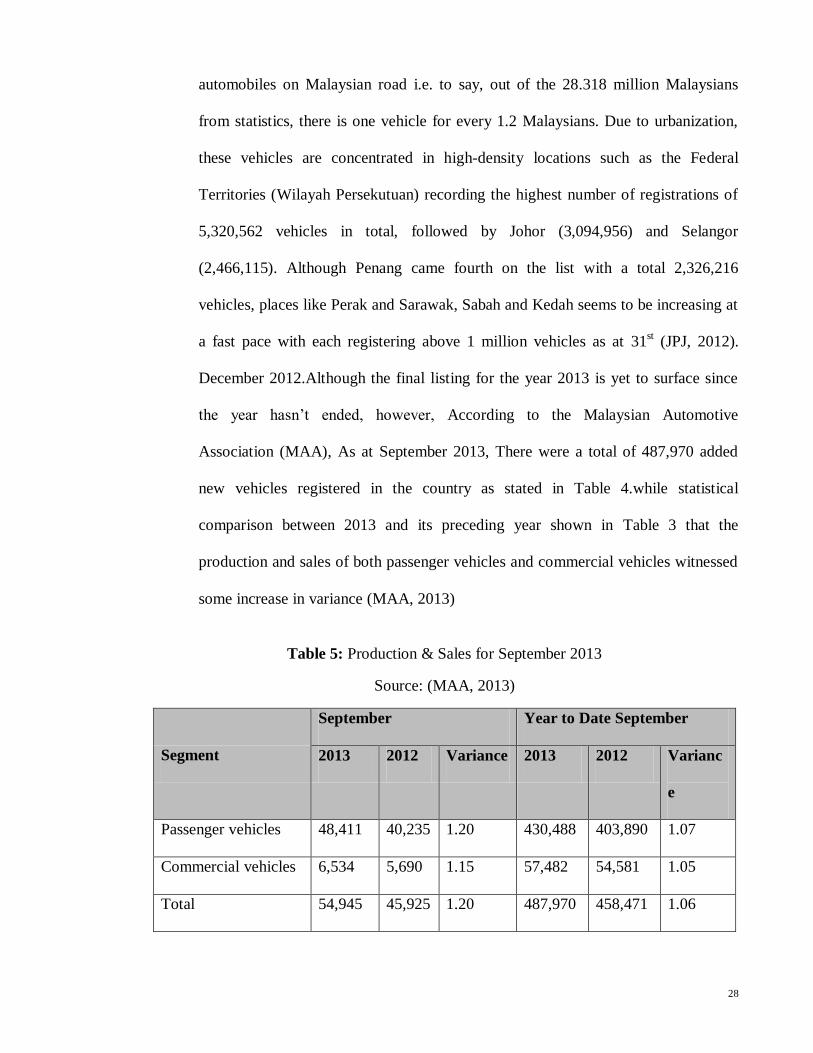
December 2012.Although the final listing for the year 2013 is yet to surface since
the year hasn’t ended, however, According to the Malaysian Automotive
Association (MAA), As at September 2013, There were a total of 487,970 added
new vehicles registered in the country as stated in Table 4.while statistical
comparison between 2013 and its preceding year shown in Table 3 that the
production and sales of both passenger vehicles and commercial vehicles witnessed
some increase in variance (MAA, 2013)
Table 5: Production & Sales for September 2013
Source: (MAA, 2013)
Segment
September Year to Date September
2013 2012 Variance 2013 2012 Varianc
e
Passenger vehicles 48,411 40,235 1.20 430,488 403,890 1.07
Commercial vehicles 6,534 5,690 1.15 57,482 54,581 1.05
Total 54,945 45,925 1.20 487,970 458,471 1.06
29
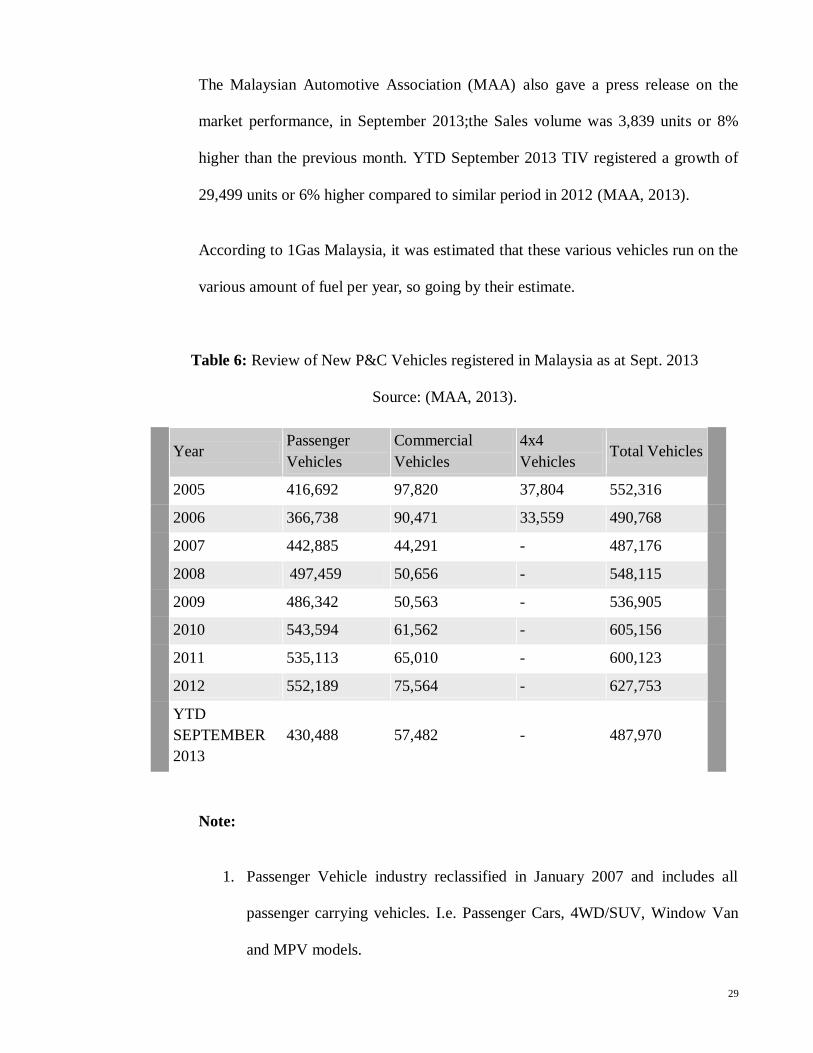
The Malaysian Automotive Association (MAA) also gave a press release on the
market performance, in September 2013;the Sales volume was 3,839 units or 8%
higher than the previous month. YTD September 2013 TIV registered a growth of
29,499 units or 6% higher compared to similar period in 2012 (MAA, 2013).
According to 1Gas Malaysia, it was estimated that these various vehicles run on the
various amount of fuel per year, so going by their estimate.
Table 6: Review of New P&C Vehicles registered in Malaysia as at Sept. 2013
Source: (MAA, 2013).
Note:
1. Passenger Vehicle industry reclassified in January 2007 and includes all
passenger carrying vehicles. I.e. Passenger Cars, 4WD/SUV, Window Van
and MPV models.
Year Passenger
Vehicles
Commercial
Vehicles
4x4
Vehicles Total Vehicles
2005 416,692 97,820 37,804 552,316
2006 366,738 90,471 33,559 490,768
2007 442,885 44,291 - 487,176
2008 497,459
50,656 - 548,115
2009 486,342 50,563 - 536,905
2010 543,594 61,562 - 605,156
2011 535,113 65,010 - 600,123
2012 552,189 75,564 - 627,753
YTD
SEPTEMBER
2013
430,488 57,482 - 487,970
30
2. Commercial Vehicles also reclassified on 1 January 2007 and include
Trucks, Prime Movers, Pick-up, Panel Vans, Bus and Others (MAA, 2013).
From Table 6, Sales of passenger vehicles in September 2013 recorded a
considerable increase number of 430,488 units so also was the Sales of commercial
vehicles of about 57,482 units as compared to the total sales in 2009 Meanwhile, the
Malaysian Automotive Association (MAA) said year-to September 2013, the total
industry volume registered a growth of 29,499 units, or 6% higher compared with
the similar period last year. This increase was due to the launches of new models
vehicles and market conditions returning to normalcy (MAA, 2013). MAA said, the
sales volume was expected to be higher as the year progresses to an end due to year-
end promotions and campaigns.
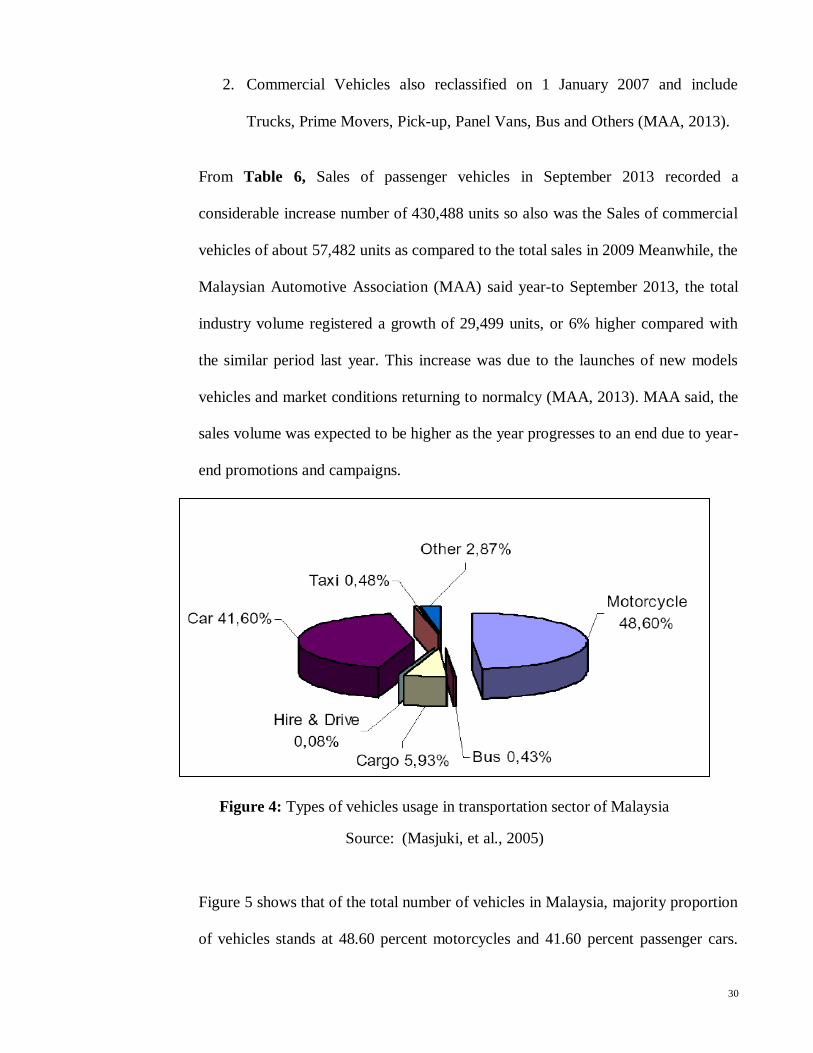
Figure 4: Types of vehicles usage in transportation sector of Malaysia
Source: (Masjuki, et al., 2005)
Figure 5 shows that of the total number of vehicles in Malaysia, majority proportion
of vehicles stands at 48.60 percent motorcycles and 41.60 percent passenger cars.

31
However, fuel consumption of motorcycles is much lower than that of passenger
cars and CNG is not yet been used in motorcycle engine.
Table 7: Average of fuel usage per Vehicle in Malaysia
Source: (ONE gas NVG, 2009)
According to the Annual Average fuel usage per vehicle stated in Table 7, it would
be appropriate to multiply the average amount of fuel used per vehicle yearly to the
numbers of vehicles available in Malaysia because this could help to ascertain and
calculate the level of CNG fuel consumed over the years and also helps to determine
an estimated amount of CO2 emission from gasoline and NGV fuel vehicles till the
vision is meant at 2020.nevertheless, in this study, a vivid experimental resolution
would be achieved to help justify the expected reduction level.
2.7.2 Number of NGV on the Malaysia Road
The number of natural vehicles in Malaysia is gradually but slowly
increasing; this is due to the rising price of gasoline. Late this year, the price of
gasoline was increased from RM 1.95 to RM2.10 (lee yen mun, 2013). The
Malaysian government has also implemented a few components to encourage the
No. Type of Vehicle Average of fuel use per
vehicle per year
1. Cars 25,000 litres/year
2. Buses 43,000 litres/year
3. Dump Truck 27,000 litres/year
4. Long Haul Truck 80,000 litres /year
5. Rim pull Truck 1,500,000 litres/year

32
use of CNG as alternative fuel but the commercialization of CNG vehicles in
Malaysia is far behind compare to other country like Argentina, Brazil and Pakistan.
As fuel subsidies were gradually removed in Malaysia starting June 5, 2008, the
subsequent 41% price hike on petrol and diesel led to a 50% increase in the number
of new CNG tanks installed (Bakar, 2008). National carmaker Proton Snd. Bhd.
considered fitting its Waja, Saga and Persona models with CNG kits from Prins
Auto gas system by the end of 2008 (Durell, 2010). According to Dr Xander
Thong, CEO of Hijau MOG Sdn Bhd, NGV conversion company, he said as at
2008,his office received almost 1,000 calls and the demand for system conversion
showing an increase of about by 500% due to the propose gasoline fuel price rise
(Durell, 2010). Therefore to ascertain the level of growth of NGV’s in Malaysia, it
would be nice considering the total number of NGV’s to the Total number of
vehicles in Malaysia as shown in Table 4.Currently, there are over 50,000 NGV
vehicles (ANGVA, 2013). This shows quite a level of acceptance, although most of
the NGV in Malaysia are mainly being operated on Bi-fuel CNG engine converted
from conventional gasoline engine. The main users are generally taxis and busses.

33
As shown in Figure 6, the estimated numbers of NGV in Malaysia is still below
100,000 though growing at approximately 5% per annum of which 90% are taxis
(NGV, 2012). The Deputy Minister of Domestic Trade, Cooperatives and
Consumerism, Rohani Karim said as at May 2011, there were only 46,000 motor
vehicles using NGV in peninsular Malaysia. In June 2012, PETRONAS NGV Sdn
Bhd organized an NGV PETRONAS Safety Awareness Campaign with the
cooperation of the Domestic Trade, Cooperatives and Consumerism Ministry. there
the CEO of PETRONAS NGV Sdn Bhd, Akhbar Md Thayoob said The use of NGV
in the country increases by five per cent each year and as at 2012,the country has
about 50,000 vehicles running on Natural gas with 90 per cent comprising of taxis
(Star, 2011).
0
10000
20000
30000
40000
50000
60000
1995
1996
1997
1998
1999
2000
2001
2002
2003
2004
2005
2006
2007
2008
2009
2010
2011
2012
2013
Figure 5: The total number of NGV used in Malaysia from 1995 to 2013
Source: (ANGVA, 2013; ONE gas NVG, 2009)

34
2.7.3 Government Incentive & Legislations To Encourage NGV Usage
The government of Malaysia supports NGV with incentives, policies and
legislation to encourage its owners. As a result of energy security and improved
emissions discovered from CNG’Vs, in 1993 and 1995, the government
implemented various incentive programs to make ownership of CNG’Vs more
appealing and less expensive (Bakar, et al., 2009; Afroz, et al., 2003).
1. The price of NGV cannot exceed 50% on the price of premium grade petrol
2. There would be import duty and sales tax exemption on conversion kits in
other to ensure a reasonable price of conversion kits.
3. Execution of 25% reduction of road tax for bi-fuel and dual fuel vehicles
4. Execution and implementation of 50% reduction of NG fuel price to
premium grade petrol for monogas vehicles (Daud, 2005).
In 2005, The Commercial Vehicle Licensing Board also passed a regulation that 25%
of new taxi fleets (with new permits) have to be on NGV and new taxis (replacing
old taxis) are compulsory to be on NGV.A certification program was established for
NGV technician reinforcing the advantage of environmental friendliness (Bakar, et
al., 2009; Daud, 2005).
2.7.4 NGV Price to Gasoline Price Comparison
Malaysians are gradually beginning to realize the impact CNG vehicles
contributes towards Carbon Dioxide (CO2) reduction in Malaysia, but the main
motivating factor and reason Malaysians uses CNG as alternative fuel is its reduced
price as compare to petroleum. As on date the price of petrol in Malaysia is RM
2.10 per liter and the price of NGV Gas is RM 0.68 cent/liter (lee yen mun, 2013).
35
There is a clear difference of 65 % between the two fuels. So, the simplest way to
calculate the amount of money that you can save by converting your vehicle to
NGV is to multiply the amount of money that you spend on petrol by 65 %. For
example, if you spend about RM 500 on petrol every month, then you save RM 325
(500 x 65 %) per month on your fuel bill. For every year you save RM 3900 (325 x
12). (Bakar, et al., 2009).
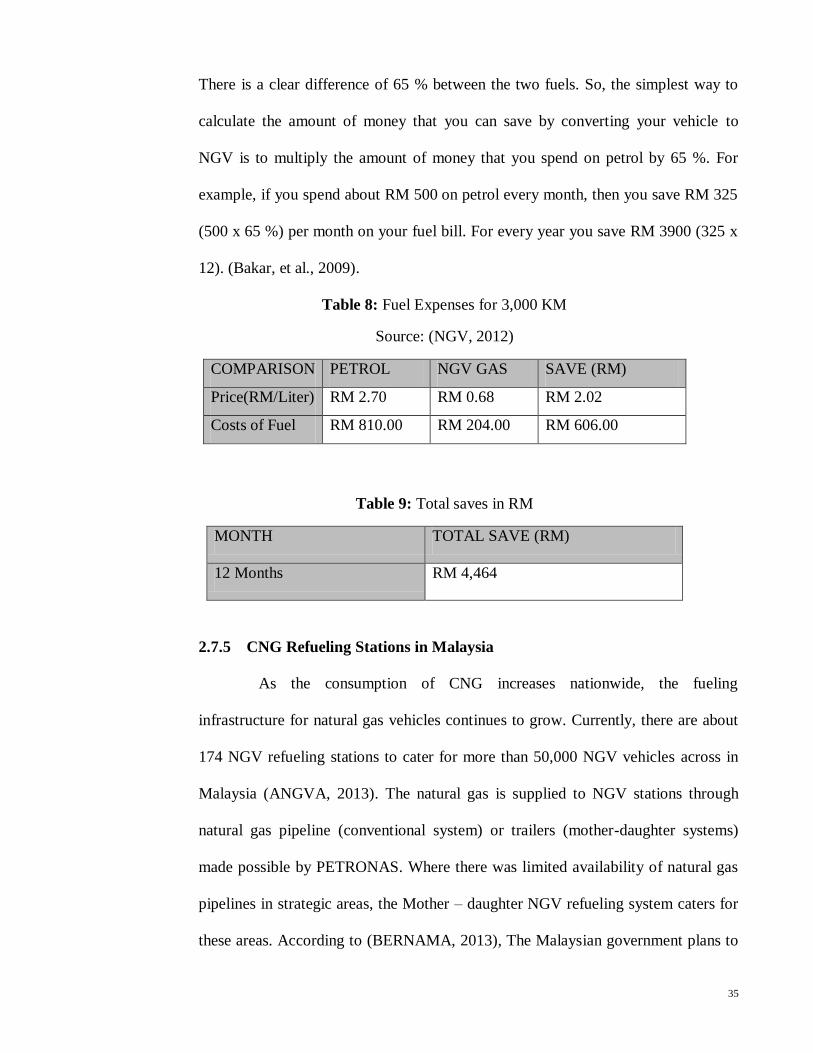
Table 8: Fuel Expenses for 3,000 KM
Source: (NGV, 2012)
COMPARISON PETROL NGV GAS SAVE (RM)
Price(RM/Liter) RM 2.70 RM 0.68 RM 2.02
Costs of Fuel RM 810.00 RM 204.00 RM 606.00
Table 9: Total saves in RM
MONTH TOTAL SAVE (RM)
12 Months RM 4,464
2.7.5 CNG Refueling Stations in Malaysia
As the consumption of CNG increases nationwide, the fueling
infrastructure for natural gas vehicles continues to grow. Currently, there are about
174 NGV refueling stations to cater for more than 50,000 NGV vehicles across in
Malaysia (ANGVA, 2013). The natural gas is supplied to NGV stations through
natural gas pipeline (conventional system) or trailers (mother-daughter systems)
made possible by PETRONAS. Where there was limited availability of natural gas
pipelines in strategic areas, the Mother – daughter NGV refueling system caters for
these areas. According to (BERNAMA, 2013), The Malaysian government plans to
36
have 200 natural gas vehicle filling stations operative throughout the country by
2014 (NNA, 2011a). also reported as at 2012 is that PETRONAS NGV Sdn Bhd, is
to open 10 more natural gas vehicle (NGV) refueling stations, planned for
completion by 2014, this announcement was made by PETRONAS NGV CEO
Akhbar M Thayoob at a PETRONAS NGV Safety Awareness Campaign event co-
hosted by the Ministry of Domestic Trade, Cooperatives and Consumerism Ministry
(Ministry) at an NGV station in Berendam, Melaka on 28 September (NNA, 2011a)
(NGV, 2012). According to Petekma (association for taxi drivers and taxi/limousine
operators) deputy president Mohd Shahrir Abd Aziz,he said as at 2008,because of
the monopoly enjoyed by PETRONAS in selling natural gas there are limited
number of stations supplying gas for cars (Rashvinjeet, 2008). On consideration,
The Malaysian NGV Sdn Bhd with plans to open 200 CNG stations nationwide
with a brand name of "1Gas Tenaga Bersih Untuk Semua" or 1Gas Clean Energy
For All, was given a permit to market and distribute NGV in Malaysia (ONE gas
NVG, 2009), Under this 1Gas station concept, the managing director of 1Gas Stesen
NGV, Rahmat Ahmad said investing is open to the public and Landowners with a
strategic land measuring more than 33,000 sq ft in encouraging them to participate
as entrepreneurs with an estimated monthly income of RM30,000 to RM50,000.
(NNA, 2011a) (BERNAMA, 2013).
2.7.5.1 Home refueling options for CNG
In 2005, the Fuel Maker Corporation of California produced a home refueling
appliance named "Phill". In that year, Waterland, L.R.; Powars made a Safety
Evaluation of the Fuel Maker Home Refueling Concept. It was found safe

37
according to the report, Although not implemented yet in Malaysia, it is Seen as
a mile stone achievement because with device like this, CNG vehicle owners
can refuel their vehicles overnight in their own home, therefore it is getting
popular around the world in places like the united states of America and
Germany who are potential high users of NGV’s. (Waterland, et al., 2005).
2.7.6 CNG Vehicles Conversion
Most of the NGV in Malaysia are converted from conventional gasoline
vehicles to bi-fuel vehicles. To date, 110 service centers for NGVs are in operation
nationwide currently 60% of total taxis in Klang Valley have been converted (Bedi.,
2008-06-08). About 300 conversions are recorded every month and the numbers are
on the rise. It is targeted for all taxis and heavy-duty market in Klang Valley,
Penang and Johor to be converted by Year 2020 (Daud, 2005) (Vinesh, 2008-06-25)
(Perumal, 2008-06-13). Though all gasoline-based or diesel based engine cars can
be fitted with the NGV system, you would need the right components for each
particular vehicle models since no major modification is done on the engine. During
conversion, the main factors to consider before conversion are the costs associated
with the conversion and the expected gains. This usually cost between RM3000 to
RM5000 covering the cost for Components as shown in figure 7.but before that, one
must go through the first and second stage as shown in Figure 6.

38
1. First Stage
2. Second stage
Figure 6: Natural Gas Installation Procedure Flowchart
Source: (Suria NGV, 2012)
Figure 7: Showing components of an NGV vehicle
Source: (Suria NGV, 2012)
39
The six main component parts fitted to the vehicle are:
1. The filler connection, which incorporates a non-return valve.
2. The NGV storage cylinder together with a cylinder valve fusible plug.
3. A first stage regulator reducing the pressure from 20MPa to approximately
0.7MPa.
4. A vacuum fuel lock-off valve, which stops the fuel flow when the engine stops.
5. A second stage regulator, which further reduces the pressure.
6. An air/gas mixer that measures airflow of gas into the engine.
There are three types of conversion kit technology system on vehicles (Suria NGV,
2012; Bakar, et al., 2009).
1. Carburetor kit System – This is an Electronic CNG kit for carburetor cars,
consisting of electronic CNG converter, switches with gas starting automatic
priming and gas level indicator, petrol solenoid valve, manometer, filling valve,
and pipe set (NGV, 2012).
2. Catalyzed Injection kit System - Electronic CNG kit for catalyzed injection cars,
consisting of electronic CNG converter, switch with petrol starting with
selectable acceleration and deceleration change and gas level indicator, gas
control mechanism, manometer, filling valves, and pipe set.
3. Sequential Injection kit System- Sequential injection gas conversion system is
designed to fuel motor vehicles with CNG in gaseous state. It can be used for both
“full group” and “phased” systems. The electric injector control, whether single or
multiple, is automatically determined by the control system during the adjustment

40
phase. This product is the most modern and technologically advanced system
today available on the market (Bedi., 2008-06-08; Star, 2008a).
More importantly, it should be noted that, CNG on vehicles works best in an injector fuel
engine because it has a longer mixing time. CNG is also occasionally mixed with hydrogen
(HCNG) to increase the H/C ratio of the fuel, raising the flame speed eight times higher
than CNG. Though, this alternative needs further technical improvement; the use of natural
gas in internal combustion engine is relatively mature (Bakar, 2008; Star, 2011a).
2.8 Vehicle Engine combustion and Exhaust Emissions
2.8.1 Vehicle Exhaust Emissions
Vehicle exhaust gas emissions are results from fuel engine combustion (Crypton,
2012). There are two types of engine combustion namely:
1. Complete (Good) combustion
2. Incomplete (bad) combustion
Figure 8: Showing vehicle exhaust smoke
Source: (MAI, 2013)
41
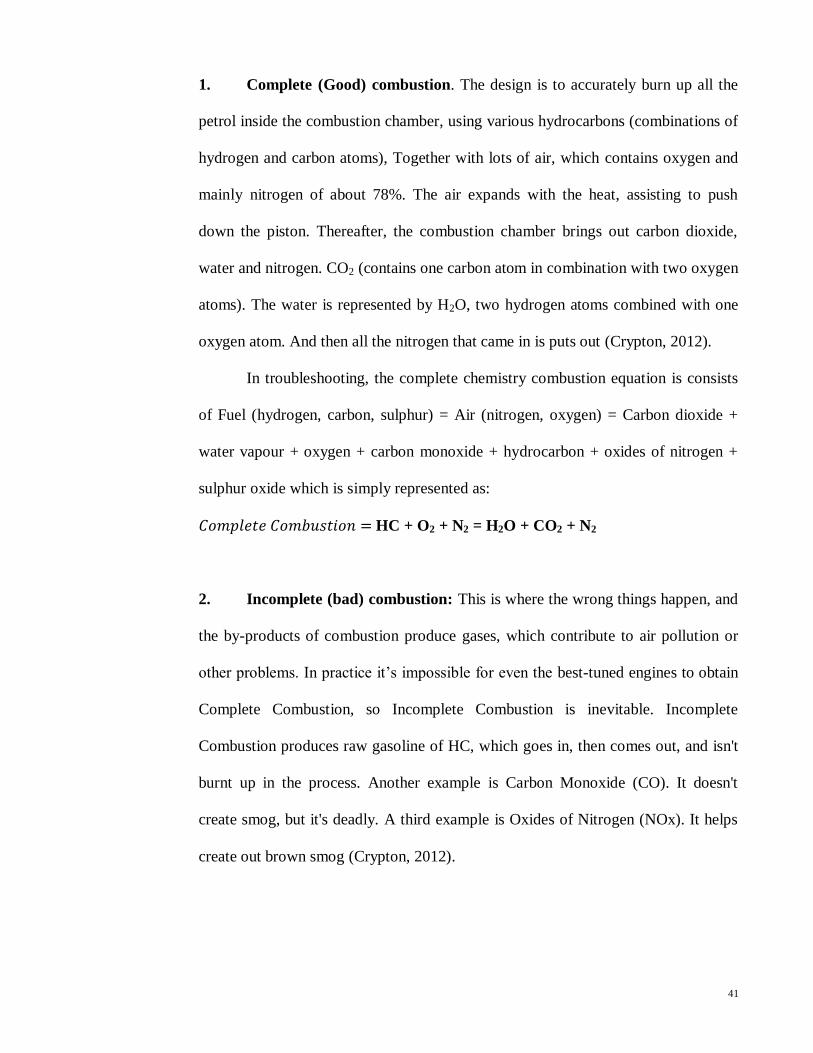
1. Complete (Good) combustion. The design is to accurately burn up all the
petrol inside the combustion chamber, using various hydrocarbons (combinations of
hydrogen and carbon atoms), Together with lots of air, which contains oxygen and
mainly nitrogen of about 78%. The air expands with the heat, assisting to push
down the piston. Thereafter, the combustion chamber brings out carbon dioxide,
water and nitrogen. CO2 (contains one carbon atom in combination with two oxygen
atoms). The water is represented by H2O, two hydrogen atoms combined with one
oxygen atom. And then all the nitrogen that came in is puts out (Crypton, 2012).
In troubleshooting, the complete chemistry combustion equation is consists
of Fuel (hydrogen, carbon, sulphur) = Air (nitrogen, oxygen) = Carbon dioxide +
water vapour + oxygen + carbon monoxide + hydrocarbon + oxides of nitrogen +
sulphur oxide which is simply represented as:
HC + O2 + N2 = H2O + CO2 + N2
2. Incomplete (bad) combustion: This is where the wrong things happen, and
the by-products of combustion produce gases, which contribute to air pollution or
other problems. In practice it’s impossible for even the best-tuned engines to obtain
Complete Combustion, so Incomplete Combustion is inevitable. Incomplete
Combustion produces raw gasoline of HC, which goes in, then comes out, and isn't
burnt up in the process. Another example is Carbon Monoxide (CO). It doesn't
create smog, but it's deadly. A third example is Oxides of Nitrogen (NOx). It helps
create out brown smog (Crypton, 2012).
42
2.8.2 Exhaust Greenhouse Gas Emission
Exhaust greenhouse gases exposed to the atmosphere are carbon dioxide
CO2, sulfur dioxide SO2, nitrogen oxide NOx, carbon monoxide CO and
hydrocarbons HC. The Use of a Gas Exhaust Analyser can help troubleshoot
emissions concerns. The analyser’s measures five exhaust emissions gasses which
are: HC, CO, CO2, O2, and NOx. The estimated amount of CO2, SO2, NOx, CO and
HCs generated from petrol, diesel and natural gas by passenger cars per day have
been calculated by (Jahirul, et al., 2007). Using the exhaust analysis, he looked at
what came out of the car exhaust to figure out what caused those emissions. From
clues and patterns of exhaust readings, the exhaust analyzer could be used to figure
out if there are problems in areas like: Air/Fuel Ratio, Combustion, Ignition and
Emission Control Devices before running a diagnosis and functional tests. Emission
factors of fuel production and combustion on vehicles is collected from earlier
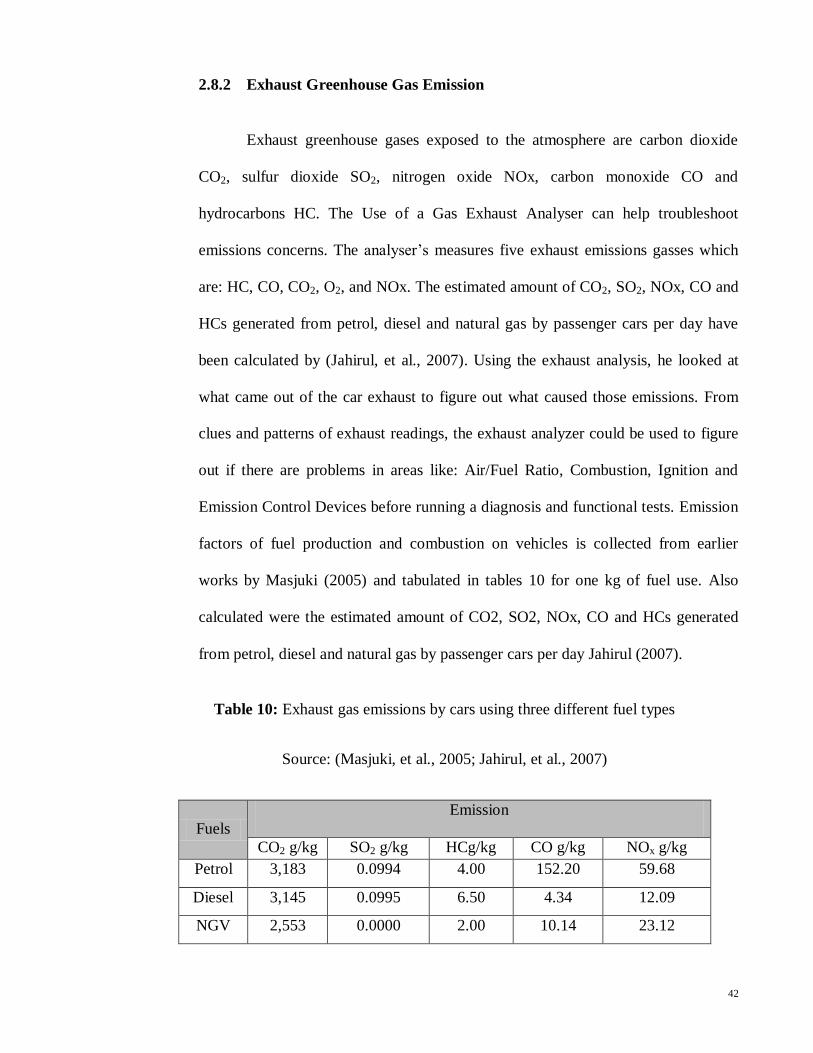
works by Masjuki (2005) and tabulated in tables 10 for one kg of fuel use. Also
calculated were the estimated amount of CO2, SO2, NOx, CO and HCs generated
from petrol, diesel and natural gas by passenger cars per day Jahirul (2007).
Table 10: Exhaust gas emissions by cars using three different fuel types
Source: (Masjuki, et al., 2005; Jahirul, et al., 2007)
Fuels
Emission
CO2 g/kg SO2 g/kg HCg/kg CO g/kg NOx g/kg
Petrol 3,183 0.0994 4.00 152.20 59.68
Diesel 3,145 0.0995 6.50 4.34 12.09
NGV 2,553 0.0000 2.00 10.14 23.12

43
Demand of petrol and diesel fuels was calculated for the predicted number of
passenger cars from period 2006 to 2020.The Fuel use per vehicle kilo-meter and
mean trip length of a vehicle per day in km was assumed constant as 17.2 km per
day According to HNDP study (Masjuki, et al., 2005). From table 10, NG
equivalents to petrol fuel consumption has also been estimated based on lower
heating value of the respective fuels. The lower heating values of petrol and diesel
were considered 44.5 MJ/kg and 42.0 MJ/kg respectively and that of NG was 43.6
MJ/kg. Form finding as shown in table 11, the total estimated emission from petrol,
diesel and NG per day have been calculated separately and then added for year 2010
with an assumption of 60 percent replacement of the petrol and diesel by NG.
Table 11: A sample calculation of Fuel used by three different fuel types
Source: (Jahirul, et al., 2007; Masjuki, et al., 2005)
No of cars
Estimated
Total
Petrol (99.6%)
Diesel (0.4%)
Equivalent NGV
& NG fuel
consumption
7,051,090
7,022,886
28,204
7,051,090
Fuel
consumption
Np x Vkm x Fkm x SP
= 9203569.35 kg
Np x Vkm x Fkm x SP
= 42382.7 kg
Wp x HP + WD x
HD HNG
HNG
= 9434378.66 kg
Fuel used after
60% replacement
3681427.74 kg
16953 kg
5660626.8 kg
Where, Hp, HD and HNG are the lower heating value of petrol, diesel and NG respectively.
Vehicle-km per day (Vkm ) = 17.2 km. Fuel use per vehicle-km (Fkm) = 0.102 liter. [Table. 2] Specific Gravity of petrol (SP) = 0.75. Specific Gravity of petrol (SD) = 0.86
Using emission factors from Tables 3 and 4: CO2 Emission = 28.78 kton; SO2 Emission = 14.84 kg; HC Emission = 84.23 ton; CO Emission = 619.02 ton; NOX Emission = 360.92 ton
44
2.8.3 Gases Measured By The Gas Analyzer
There are six gasses measured by a gas analyzer as discussed below.
1. HC (Hydrocarbons)
Hydrocarbons (HC) are produced as a result of unburned fuel due to
incomplete combustion. The rate of HC release is caused by the molecular weight of
the particular fuel. The molecular weight of diesel 170-200 or petrol 110 is much
higher than NG 16.04 (Heywood, 1988). Being lightweight fuel, NG can form much
better homogeneous air-fuel mixture with high combustion efficiency (Crypton,
2012). An HC emission happens due to gas CH4 losses during production and
distribution process (Lewis, 1997). All HC components, except CH4 reacts with
atmospheric gases and forms photochemical smog but the HC emissions from
NGVs mainly CH4 is not harmful to that is caused by HC emitted from liquid fuels.
2. CO (Carbon Monoxide)
Carbon monoxide is a colorless and odorless poisonous gas produced inside
the engine by Partially Burned fuel, i.e. the fuel combust but not completely. As a
result, an overly rich mixture preparation of an excessive CO content is formed. The
CO should have become CO2 but due to lack of time or insufficient O2 to become
real CO2, it is exhausted as CO instead.) Table 4 also shows that emission factor of
CO for production and distribution of petrol fuel is high 0.2403 g/kg compared to
diesel 0.21 g/kg and NG 0.061 g/kg (Crypton, 2012). Table 5 also shows that
emission factor of CO for combustion of petrol fuel is very high 152.20 g/kg
compared to NG 10.14 g/kg and diesel 4.34 g/kg (Bakar, et al., 2007a).

45
3. CO2 (Carbon Dioxide)
Carbon dioxide is also a colorless and odorless poisonous gas as stated
above but this is produced from Completely Burned fuel. This represents the engine
combustion efficiency of how well the air/fuel mixture is burned. It is commonly 1-
2% higher at 2500 RPM than at idle speed. This is due to improved gas flow
consequential to better combustion efficiency. Maximum is around 16%. Therefore,
as the growing number of motor vehicles using liquid fuels increases, the amount of
CO2 in the atmosphere continues to grow. Related researches done earlier have
shown that NG produces much less amount of CO2 20% compared to the liquid
fuels (Bakar, et al., 2007c). From the concept of chemical equilibrium, it is
confirmed that for higher hydrogen to carbon ratio H/C of a fuel, the amount of CO2
release is lower. CNG fuel has much higher ratio. The estimated amount of CO2
emission per day will be around 41.79 kton. (Jahirul, et al., 2007)
4. O2 (Oxygen)
O2 occurs in the exhaust when there is an excess of air in the mixture. In
combustion, O2 content increases sharply as soon as Lambda rises above 1. Oxygen
content is a clear indicator of the transition from rich to lean mixture range, or leaks
in the manifold or exhaust systems as a result of combustion failures (Crypton,
2012). With rich mixture most of the O2 is burned during combustion except some
very lean O2 which escapes "un-combusted".
5. NOx (Oxides Of Nitrogen)
NOx is a collective term used to describe oxides of nitrogen, namely nitric
oxide NO with a mixture of nitrogen dioxide NO2 and other nitrogen-oxygen
46
combinations. NOx emissions rise and fall in a reverse pattern to HC emissions. As
the mixture becomes leaner more of the HC's are burnt, but at high temperatures and
pressures (under load) in the combustion chamber there will be excess O2 molecules
which combine with the nitrogen to create NOx (Crypton, 2012). This gas is related
to the exhaust gas detoxification and recirculation systems. NO2 is harmful to the
human lungs and other biological tissues (Willard W, 2004). NOx emission
increases with the increasing use of liquid fuels in transportation.
6. A/F Ratio Or Lambda
Air/Fuel Ratio or Lambda value is calculated based on the concentrations of
HC, CO, CO2 and O2. The stoichiometric (ideal) A/F is 14.7 liters air to 1 liter fuel
or 14.7/1. The ideal Lambda value is 1(one) and below that the A/F mixture is rich
and if above, it is lean. For example, lambda=0.6 corresponds to an air/fuel ratio of
(0.6x14.7): 1=8.82:1 (e.g. lambda 0.6 = A/F ratio of 8.82/1 or very rich air fuel
mixture) (Crypton, 2012). An ideal mixture is 14.7 pounds of air to 1 pound of
gasoline for the cleanest burning. 14.7:1 stoichiometric ratio is the air to fuel ratio at
which there is enough air to completely burn certain amount of fuel.
2.8.4 Other Gases Not Measured By The Gas Analyzer
There are a few other exhaust components which impact driveability and/or
emissions diagnoses that are not measured by workshop Gas analyzers. They are:
Water vapour (H2O), Sulphur Dioxide (SO2), Hydrogen (HO), Particulate carbon
soot (C) (Crypton, 2012).

47
2.8.5 General Rules of Emission Analysis
1. If CO increases, O2 decrease, and conversely if O2 increases, CO decreases.
This is because CO readings indicate a rich running engine while O2
readings indicate a lean running engine. So also, if HC goes up as a result of
a lean misfire, O2 goes up
2. Due to an air/fuel imbalance or misfire, CO2 will decrease in any of the
above cases.
3. If CO goes up, this does not necessarily mean HC will increase. However an
Added HC will only be formed at the point where rich misfire begins (3% to
4% CO)
4. High O2, high HC and low CO at the same time show a misfire due to lean
diluted mixture. Then, if O2, HC, CO are all high ,it shows a misfire due to
rich mixture
5. Mechanical engine problem or ignition misfire normally leads to high HC,
slightly low CO and high O2 (Exaust A, 2010).
6. The graph below examines the effects A/F mixture has on exhaust gas
Output level.
48
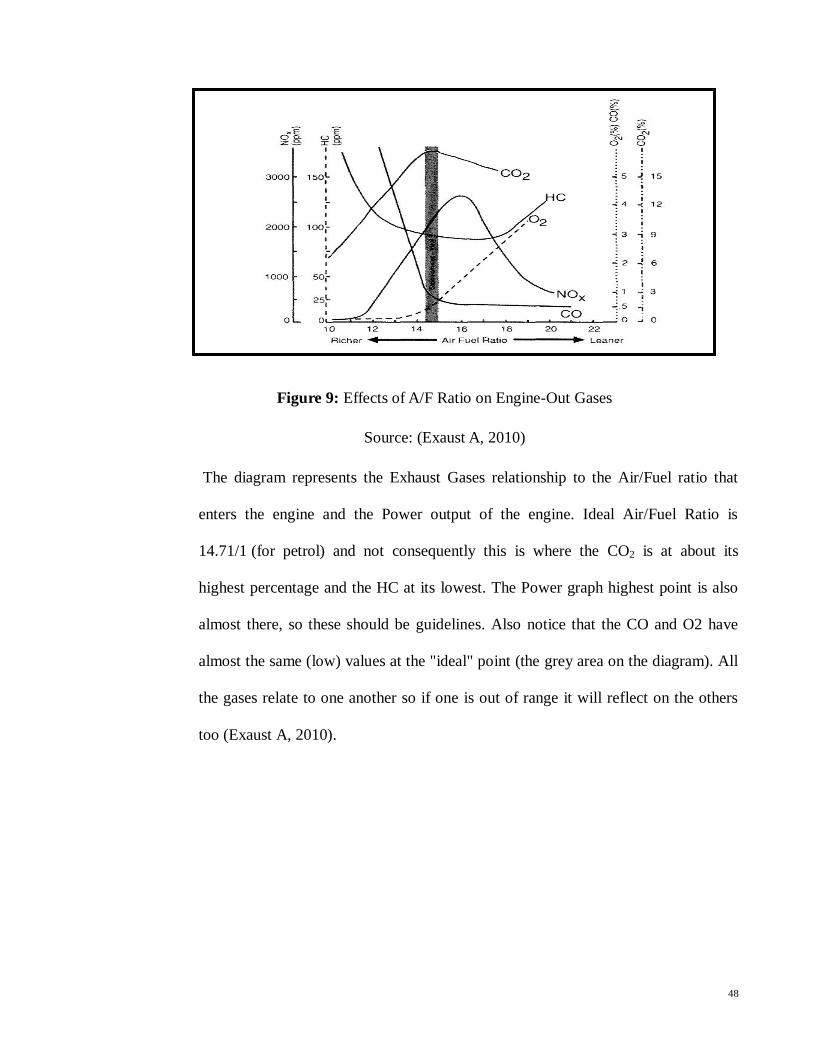
Figure 9: Effects of A/F Ratio on Engine-Out Gases
Source: (Exaust A, 2010)
The diagram represents the Exhaust Gases relationship to the Air/Fuel ratio that
enters the engine and the Power output of the engine. Ideal Air/Fuel Ratio is
14.71/1 (for petrol) and not consequently this is where the CO2 is at about its
highest percentage and the HC at its lowest. The Power graph highest point is also
almost there, so these should be guidelines. Also notice that the CO and O2 have
almost the same (low) values at the "ideal" point (the grey area on the diagram). All
the gases relate to one another so if one is out of range it will reflect on the others
too (Exaust A, 2010).

49
2.9 Safety, Health and Environmental Benefits And Drawbacks Of CNG
2.9.1 Benefits
There are various benefits as well as advantages of using CNG as an
Alternative fuel to petrol, discussed below are some notable points.
1. Lower Emission Quality: Compressed natural gas vehicles (CNGVs) have
good combustion characteristics and dramatically lower exhaust gas emissions due
to lead and sulphur free character, making it a green fuel (Bakar, et al., 2007c).
CNG Low engine exhaust emission as compared to gasoline makes its appropriate
to run in lean burn operation and therefore it burn cleaner than most of the fuel.
Hence, the engine emission gases like NOx, CO2, CO that pollutes the air are
drastically reduced in percentage.
Emissions like:
A. Reduces carbon dioxide (CO2) emissions by 20% to 30%.
B. Reduces carbon monoxide (CO) emissions up to 75%, 78 and 25.8 grams.
C. Reduces nitrogen oxide (NOx) emissions by approximately 50%.
D. Reduces up to 95% of particle matter (PM) emissions.
E. Reduces volatile organic compound (VOCs) emissions by 55% (Aldrich &
Chandler, 1997).
2. Low Flammability: CNG is less likely to auto-ignite on hot surface, it has a
high auto-ignition temperature of about 540 degrees centigrade and narrow range
inflammability of about 5% to15% (Das, et al., 2000). It means that if CNG
concentration in the air is below 5% or above 15%, it will not burn. This high
50
ignition temperature and limited flammability range makes accidental ignition or
combustion very unlikely. CNG is lighter and tend to dissipates in the air, so,
explosion can only occur if the concentration is high. Although CNG is flammable,
it has a narrow flammability range which makes it an inherently safe fuel according
to the U.S. Environmental Protection Agency (Schipper, et al., 1989). CNG
disperses rapidly, minimizing ignition risk when compared to gasoline. Natural gas
is lighter than air and will not pool as a liquid or vapor. Nevertheless, indoor leaks
can form a flammable mixture in the vicinity of an ignition source and can kill if it
is present in large concentrations in which is reduces the amount of oxygen in the
air to sustain life. Gasoline and diesel burn at much lower concentrations and ignite
at lower temperatures. Although it takes very little energy to ignite a flammable
mixture of air and natural gas, gasoline, or diesel, natural gas burns at a somewhat
lower temperature (Nylund, et al., 2002; Aslam, et al., 2006).
3. Less Pollutant to the Environment: CNG fuel systems are sealed, which
prevents any spill or evaporation losses, but In the event of a spill or accidental
release, CNG poses no threat to land or water, as it emits significantly less
pollutants and nontoxic. It is lighter and dissipates quickly (Bakar, et al., 2009).
Being a gaseous fuel, CNG mixes easily and evenly in air to reduce toxicity.
4. More Engine Mechanical Power: CNG has a higher octane number in the
range of 120 to 130 as compare to a range of 93 to 99 octanes for gasoline. This
makes the CNG fuel possible to run at high compression ratio engine without any
knocking phenomena. A high compression ratio is desirable because it allows an
engine to extract more mechanical energy from a given mass of air-fuel mixture due

51
to its higher thermal efficiency (Hasim, 2005). This occurs because internal
combustion engines are heat engines, and higher efficiency is created because
higher compression ratios permit the same combustion temperature to be reached
with less fuel, while giving a longer expansion cycle, creating more mechanical
power output and lowering the exhaust temperature.
5. Availability Of Reserve Of Natural Gas: Despite increase rates in natural
gas consumption, According to the most recent USGS estimates, released in the
World Petroleum Assessment 2000, The mean worldwide-undiscovered natural gas
is estimated at 4,301 trillion cubic feet, which is approximately twice the worldwide
cumulative consumption forecast from 2002 to 2025 (IEO, 2005). Of the total
natural gas resource base, an estimated 3,000 trillion cubic feet is in “stranded”
reserves, usually located too far away from pipeline infrastructure or population
centers. (IEO, 2005). The ratio of proven reserves to production of natural gas was
estimated to be 39 years while gasoline only 11 years (Chin, 2012). Therefore,
natural gas will be the best choice for the fuel in next 30 years. Also, besides being
made from fossil fuel, natural gas can also be made from agricultural waste, human
waste and garbage.
6. Low Operational Cost: As discussed early in this chapter, one of the
advantages of using CNG as an alternative is low cost. The low costs are in
production, storage, maintenances and price of the fuel. Currently, the price of the
fuel in Malaysia is govern by the rules and regulation of government (ONE gas
NVG, 2009), which state the price of CNG cannot exceed 50% of the premium
grade of petrol; therefore cost saving in price of the fuel is justified. The operational

52
cost of vehicles running on CNG is about 68% lower than petrol and 36% lower
than diesel.
7. Easy Maintenances: CNG has lower maintenances cost; this is because
CNG as an engine fuel has a lean burn lower flame speed operation giving it a
higher durability of engine lubricant. E.g. it can be half of gasoline oil changed in
more than every 15-30,000 km drive (NNN, 2011). The lubricating oil used on
CNG vehicles does not contaminate and dilute the crankcase oil (Sun, et al., 1998).
Being non-corrosive and due to the absence of any lead or benzene content in CNG,
spark plugs used for carburetor engine are not easy contaminated creating longevity
of spark plugs (Das, et al., 2000).
2.9.2 Drawbacks
To everything with an advantage, there is most probably a disadvantage to it,
however in this case; there is not so much a sustainable disadvantage but a
drawback due to various reasons.
1. Acceptability: One of the biggest challenges faced in the marketing of NGV
in the early days of its introduction was the sense of comfort with traditional fuel
skepticisms; whether NGV is a reliable product as promoted. To this end,
PETRONAS then focused on taxis as the targeted main customer, using a strategy
that provide financing package to taxis driver with the cooperation of two financial
institutions, and since then, it has remained majorly accepted by taxis drivers but
relatively low acceptability amongst the general public in Malaysia (Daud, 2005).

53
2. Lower Engine Performance: The use of CNG as fuel will cause the lower
engine performance by comparison to the gasoline. This is due the low density of
natural gas where gaseous fuel occupies a larger volume per unit energy than a
liquid fuel said gasoline (Bakar & Mardani, 2001).
3. Fueling Stations Availability: Limited availability of natural gas pipelines
in strategic areas. Consequently, PETRONAS have to use Mother – daughter NGV
refueling at the strategic areas that without pipelines (NGV, 2012a).
4. Large Pressurized Fuel Storage Tank: The high pressure of the storage
tank causes some safety issues. Compressed natural gas vehicles require a greater
amount of space for fuel storage than conventional gasoline powered vehicles
(Durell, 2010). Since it is a compressed gas, rather than a liquid like gasoline, CNG
takes up more space for each gasoline gallon equivalent (GGE). Therefore, the tanks
used to store the CNG usually take up additional space in the trunk of a car or bed
of a pickup truck which runs on CNG. This problem is solved in factory-built CNG
vehicles that install the tanks under the body of the vehicle, leaving the trunk. They
were concern about the loss of boot space with the installation of NGV cylinder, the
increased in weight of vehicle after conversion (Durell, 2010).
5. Cost Of Conversion: This is a barrier for CNG use as fuel and explains why
public transportation vehicles are early adopters, as they can amortize more quickly
the money invested in the new (and usually cheaper) fuel. In spite of these
circumstances the number of vehicles in the Malaysia that use CNG has grown
steadily at a 0.03 percent annual rate (Nylund, et al., 2002). However, the focus is

54
now on the hybrid or electric car, the power to weight ratio of internal combustion
engine (including the tank and fuel) is much more higher than the battery powered
or fuel cell operated vehicles (Das, et al., 2000).
6. Greater Breaking Distance: greater breaking distance due to increased fuel
storage system weight. This is a relatively small concern, however, because the fuel
system is a small fraction of a vehicles’ total weight, CNG vehicles also might
accelerate more slowly than their diesel counterparts (Bakar & Mardani, 2001).
7. High Methane Quantity: CNG is primarily over 90% methane, which is a
greenhouse gas that could contribute to global climate change if leaked. Methane is
slightly soluble in water and under certain anaerobic conditions does not
biodegrade. However, natural gas has a high content of methane (another
greenhouse gas), so this could affect CNG fuel’s advantage somewhat (Bakar,
2008). Therefore, while CNG vehicles are not likely to offer the sole solution to
reducing carbon dioxide emissions and subsequent potential effect on climate
change, they do have significant advantages over traditional gasoline fueled
vehicles.
CNG usage as a vehicle fuel has greatly increased over the last few years. Due to its
advantageous properties as a fuel, various studies are been carried out regularly with the
support of some international organizations like IANGV (International Association for
Natural Gas Vehicles), ANGVA (Asian pacific natural Gas Association) and ENGVA
(European Natural Gas Vehicle Association) (ANGVA, 2013). CNG safety record as
compares to other alternative fuels available today remains favorably high.

55
CHAPTER 3
METHODOLOGY
3.1 Introduction
This chapter studies the amount of CO2 emission that can be reduced using CNG
vehicles, since the transportation department is estimated to produce nearly 45% of CO2
emission (Salahudin, et al., 2013; National, 2008). This experimental carried out to review
a gasoline fueled engine in comparison with a CNG fueled engine. The analysis in this
study is also generally based on experimental evaluation and modeling methodologies,
done to ascertain the amount of gases emitted from cars running on gasoline and CNG fuel
in Malaysia by 2020. For this purpose, Information’s and results has been collected from
books, journals, Internet sources and some relevant Malaysian government bodies like
Department of Statistic and Department of Road transportation. Some of the Information’s
used were readily available but others were calculated with respect to the trend of fuel
usage by passenger cars. Furthermore, this study based its results analysis and presentation
scenario on the constant increase of vehicles using CNG on the Malaysian road, while
using Schwartz scenarios which states that, despite not presenting an accurate picture at the
end-result, projecting views about alternative future environments is most likely to be a
better decision than any other because this can provide a good ground for better decision
making (Schwartz, 1996). The experiments were conducted at the University Kuala
Lumpur Malaysia, France Institute Automotive/Mechanical Engineering workshop in Bangi
area during the spring of 2013.

56
3.2 Experimental Set-up
The experiments were carried out on Two (2) Vehicle engine types, the 4g15-
CARBURETOR engine and the 1.6 CAMPRO IAFM Injector engine while we used a
Bosch- BEA 050 exhaust gas analyzer to experimentally determine the amount of CO2
emitted from the exhaust. Both the 4g15-CARBURETOR engine and the 1.6 CAMPRO
IAFM Injector engine has been modified to run in the bi-fuel engine. A CNG Conversion
kit has also been installed to adjust the engines operating condition so the engines can both
easily run in gasoline and CNG fuel. The kit composes of a gas-air mixer unit, two
electrically operated solenoid valves for gasoline and CNG cut-off, a timing advance
processor to adjust the CNG and gasoline ignition timing and gas pressure regulator.
Figure 10: Showing Diagnostic Tester of an exhaust gas analyzer
Source: (Bosch, 2013)
3.3 Application
The Bosch- BEA 050 exhaust gas analyzer is fitted with a spark-ignition engines
which helps to facilitate operator-friendly performance of exhaust-gas measurements on
vehicles (Bosch, 2013). The test is conducted to include the entire range of the vehicles

57
emission measuring exhaust-gas components like, hydrocarbon (HC), carbon monoxide
(CO), carbon dioxide (CO2), oxygen (O2) and nitrogen oxide (NOx) as well as lamda. The
A/F ratio lambda calculation is based on the measured exhaust-gas values. The non-
dispersive infrared method (NDIR non-dispersive infrared spectroscopy) is used for the
measurement of CO, CO2 and HC percentages. An electro-chemical acting sensor
determines the oxygen content. It has been calibrated to perform and to comply with
statutory regulations that can only be used in combination with Bosch test systems and the
Emission System Analysis program. The Emission System Analysis program consists of: A
computer PCB and spark-ignition exhaust-gas analyzer module (AMM).
Figure 11: BOSH Exhaust Analyzer (BEA 050)

58
Figure 12: Rear view of BEA 050(with AMM)
Source: (Bosch, 2013)
1. Activated carbon filter
2. Gas and condensation output (140 cm PVC transparent hose)
3. Measurement gas exhaust (140 cm PVC transparent hose)
4. O2 sensor (The illustration may differ from the original)
5. Plastic hose for leakage test
6. Exhaust-gas sample probe
7. 30 cm viton hose (black)
8. GF1 filter
9. 8 m hose line
10. GF2 input filter
11. Spark-ignition exhaust-gas analyzer module (AMM)
11
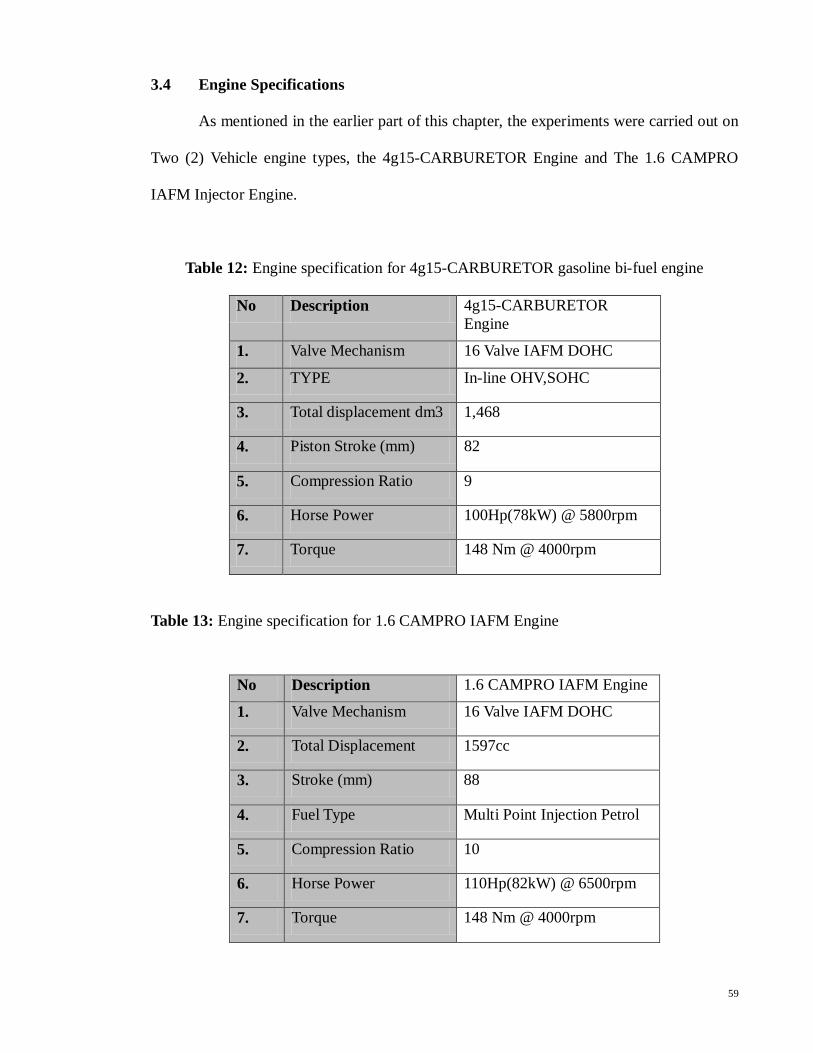
59
3.4 Engine Specifications
As mentioned in the earlier part of this chapter, the experiments were carried out on
Two (2) Vehicle engine types, the 4g15-CARBURETOR Engine and The 1.6 CAMPRO
IAFM Injector Engine.
Table 12: Engine specification for 4g15-CARBURETOR gasoline bi-fuel engine
No Description 4g15-CARBURETOR
Engine
1. Valve Mechanism 16 Valve IAFM DOHC
2. TYPE In-line OHV,SOHC
3. Total displacement dm3 1,468
4. Piston Stroke (mm) 82
5. Compression Ratio 9
6. Horse Power 100Hp(78kW) @ 5800rpm
7. Torque 148 Nm @ 4000rpm
Table 13: Engine specification for 1.6 CAMPRO IAFM Engine
No Description 1.6 CAMPRO IAFM Engine
1. Valve Mechanism 16 Valve IAFM DOHC
2. Total Displacement 1597cc
3. Stroke (mm) 88
4. Fuel Type Multi Point Injection Petrol
5. Compression Ratio 10
6. Horse Power 110Hp(82kW) @ 6500rpm
7. Torque 148 Nm @ 4000rpm

60
3.5 Experimental Procedures
3.5.1 Starting up
The engine was run until it reaches the steady state condition (warm-up), i.e.
run-up before taking readings because if cold, it would give a hard start and that
could affect the engine as well as give wrong readings. The experiments started with
1000 revolution per minute (rpm) engine speed, at this stage, the Bosch - BEA 050
spark-ignition engine exhaust-gas analyzer was connected to the RTM 430 and a
Bosch test system. From the system, the power supply is established by way of the
lighting line (Bosch, 2013). Noting that the BEA 050 is set at ex-factory to 230 V,
50/60 Hz, before starting up care was taken to ensure that the lighting line's voltage
matches the configured voltage of the BEA 050. Also, since the BEA 050 is
operated in the open workshop, a power source that is protected by an FI circuit
breaker was used (Bosch, 2013).
3.5.2 Switching Device On
The BEA 050's power plug was plugged into the plug-socket strip on the
Bosch test system and then switched on at the same time as the test system is
switched on. Reading (results) was collected at interval and test was repeated for
different speeds in the range of 1500 to 3000 rpm. At the end of each experiment,
the results were taking from the Computer screen at the various stipulated speed
limit but the focus was specifically on the amount of CO2 emitted. Were the typical
readings are compared if the values gotten are standard reading or not. The
experiments lasted at about forty-five minutes to one-and-a-half hours. Copies of
the Experimental pictures can be found in the Appendix 2.

61
3.5.3 Switching Device Off
After exiting the exhaust-gas test step and experiments, it was necessary to
wait until the pump stopped running thereafter the test system was switched off. In
order to keep the level of contamination in the BEA 050 as low as possible and safe
for future usage, the exhaust-sample probe was left open while pump was ran to
purge the BEA 050 of residual gas before switching it off.
Figure 13: showing the exhaust gas analyzer probe in the exhaust
3.6 Test Procedures
The test procedures were conducted in accordance with the Fifth schedule
(regulation 11) of the environmental quality act 1974 amendment 1996.stating that;
The engine should be accelerate to a moderate speed with no load, maintain for at least 15
seconds then return the engine to idle speed. Thereafter, while the engine idles, insert the
sampling probe into the exhaust pipe as deeply as possible but in any case for not less than
300mm and then wait for at least 20seconds before the reading are taken from the analyzer
display unit. (IPCC, 2007b; MDOE, 2010).
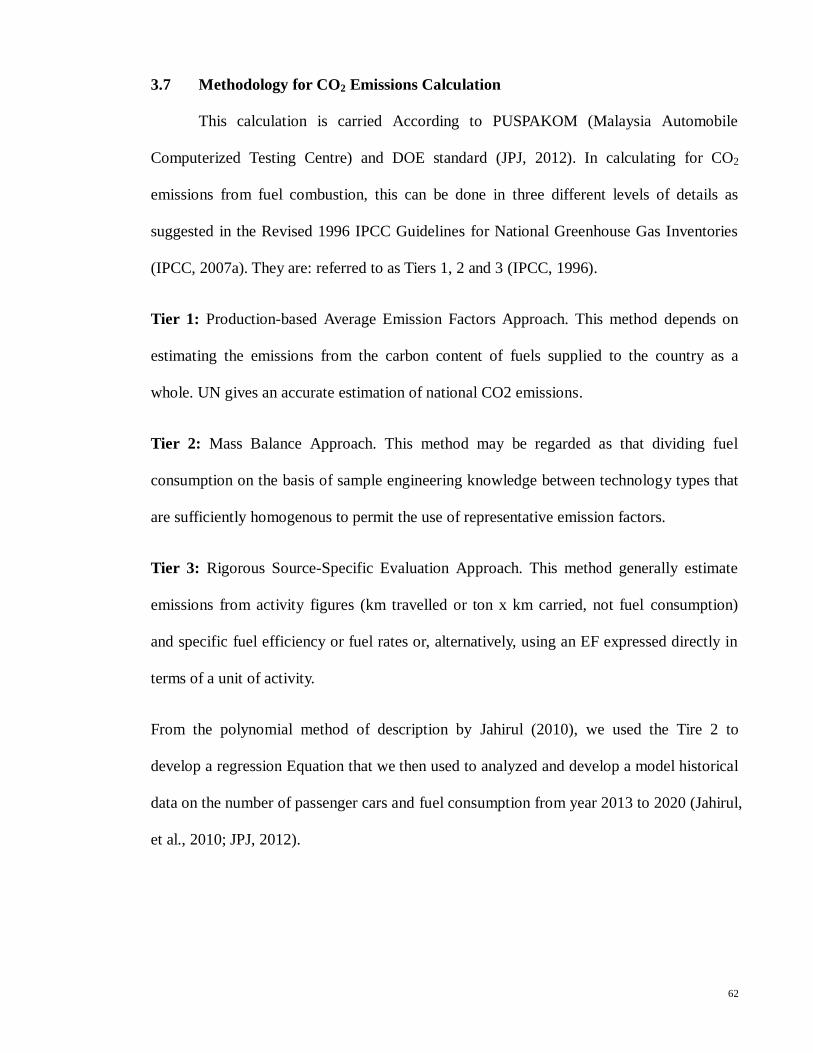
62
3.7 Methodology for CO2 Emissions Calculation
This calculation is carried According to PUSPAKOM (Malaysia Automobile
Computerized Testing Centre) and DOE standard (JPJ, 2012). In calculating for CO2
emissions from fuel combustion, this can be done in three different levels of details as
suggested in the Revised 1996 IPCC Guidelines for National Greenhouse Gas Inventories
(IPCC, 2007a). They are: referred to as Tiers 1, 2 and 3 (IPCC, 1996).
Tier 1: Production-based Average Emission Factors Approach. This method depends on
estimating the emissions from the carbon content of fuels supplied to the country as a
whole. UN gives an accurate estimation of national CO2 emissions.
Tier 2: Mass Balance Approach. This method may be regarded as that dividing fuel
consumption on the basis of sample engineering knowledge between technology types that
are sufficiently homogenous to permit the use of representative emission factors.
Tier 3: Rigorous Source-Specific Evaluation Approach. This method generally estimate
emissions from activity figures (km travelled or ton x km carried, not fuel consumption)
and specific fuel efficiency or fuel rates or, alternatively, using an EF expressed directly in
terms of a unit of activity.
From the polynomial method of description by Jahirul (2010), we used the Tire 2 to
develop a regression Equation that we then used to analyzed and develop a model historical
data on the number of passenger cars and fuel consumption from year 2013 to 2020 (Jahirul,
et al., 2010; JPJ, 2012).

63
CHAPTER 4
RESULTS AND ANALYSIS
4.1. Introduction
This chapter presents the results obtained from the various text actions carried out.
The data’s of the measured exhaust constituent were interpreted by simple computer display
system, specifying the gases in their various units. Not forgetting, the main aim of this
research is to facilitate the implementation of CNG in the Transport industry. Besides that,
the purpose of this study is to verify the significant difference in CO2 emission from two
different Vehicles engines operating on CNG and Petrol. Results collected from this study
were implemented to reduce further emission from CO2 exhaust gas.
4.2. Specified range of Exhaust Constituents
As discussed in chapter 2, the ideal expected range of the various exhaust
constituent as measured by a Gas analyzer, are displays in the tables below (Crypton, 2012).
Table 14: An Ideal Exhaust constituent of a Carburetor and Injector Petrol Engine
Source: (Exaust A, 2010)
Carburetor Petrol Engine Injector Petrol Engine
CO 1 ~ 3% *high mix rich, low mix lean 0.5 ~ 1.5 %
CO2 >13% *higher is O.K >14%
HC <400 ppm *lower is O.K <200 ppm
O2 <2% *lower is O.K <1%
With input parameters like: CNG quantity and quality, engine oil level, throttle position,
throttle vale, rate of variation, pressure stability, operating timing being monitored.

64
4.3. Test Results
For the first objective of this research, it is important to know the amount of the
various exhaust gas emitted. Focusing on the two-test subject (The Injector Engine and
Carburetor Engine), the presentations of these data’s are displayed in tabular forms that will
be explained later.
Figure 14: Result Screen display of the Bosh gas Analyzer
4.4. Test Results Presentation
4.4.1 Test Procedures on Vehicle Injector System
This test procedure comprises of the two main fuel categories:
Category A: Petrol Fueled Injector engine
Category B: CNG Fueled Injector engine
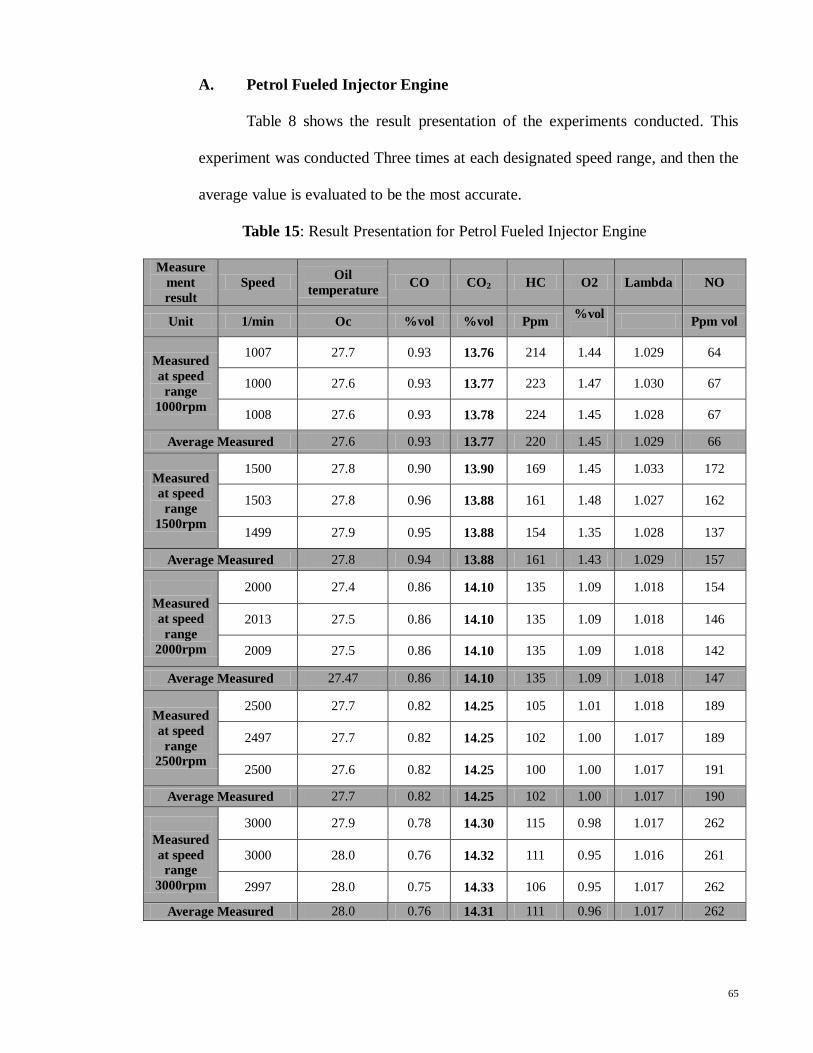
65
A. Petrol Fueled Injector Engine
Table 8 shows the result presentation of the experiments conducted. This
experiment was conducted Three times at each designated speed range, and then the
average value is evaluated to be the most accurate.
Table 15: Result Presentation for Petrol Fueled Injector Engine
Measure
ment
result
Speed Oil
temperature CO CO2 HC O2 Lambda NO
Unit 1/min Oc %vol %vol Ppm %vol
Ppm vol
Measured
at speed
range
1000rpm
1007 27.7 0.93 13.76 214 1.44 1.029 64
1000 27.6 0.93 13.77 223 1.47 1.030 67
1008 27.6 0.93 13.78 224 1.45 1.028 67
Average Measured 27.6 0.93 13.77 220 1.45 1.029 66
Measured
at speed
range
1500rpm
1500 27.8 0.90 13.90 169 1.45 1.033 172
1503 27.8 0.96 13.88 161 1.48 1.027 162
1499 27.9 0.95 13.88 154 1.35 1.028 137
Average Measured 27.8 0.94 13.88 161 1.43 1.029 157
Measured
at speed
range
2000rpm
2000 27.4 0.86 14.10 135 1.09 1.018 154
2013 27.5 0.86 14.10 135 1.09 1.018 146
2009 27.5 0.86 14.10 135 1.09 1.018 142
Average Measured 27.47 0.86 14.10 135 1.09 1.018 147
Measured
at speed
range
2500rpm
2500 27.7 0.82 14.25 105 1.01 1.018 189
2497 27.7 0.82 14.25 102 1.00 1.017 189
2500 27.6 0.82 14.25 100 1.00 1.017 191
Average Measured 27.7 0.82 14.25 102 1.00 1.017 190
Measured
at speed
range
3000rpm
3000 27.9 0.78 14.30 115 0.98 1.017 262
3000 28.0 0.76 14.32 111 0.95 1.016 261
2997 28.0 0.75 14.33 106 0.95 1.017 262
Average Measured 28.0 0.76 14.31 111 0.96 1.017 262

66
B. CNG Fueled Injector Engine
As demonstrated in Table 9, this experiment was also conducted Three times
at each different designated speed range, and then the average value was evaluated
to be the most accurate.
Table 16: Result Presentation for CNG Fueled Injector Engine
Measuremen
t result Speed
Oil
temperature CO CO2 HC O2 Lambda NO
Unit 1/min Oc %vol %vol Ppm %vol
Ppm vol
Measured at
speed range
1000rpm
1000 27.6 0.63 10.83 272 1.70 1.060 48
1000 27.6 0.62 10.86 266 1.65 1.058 44
1000 27.7 0.64 10.85 228 1.62 1.058 39
Average Measured 27.6 0.63 10.84 255 1.66 1.059 44
Measured at
speed range
1500rpm
1500 27.7 0.60 11.08 136 1.25 1.043 73
1496 27.7 0.60 11.09 131 1.24 1.042 64
1500 27.6 0.61 11.08 124 1.27 1.044 57
Average Measured 27.7 0.60 11.08 130 1.25 1.043 65
Measured at
speed range
2000rpm
2000 27.5 0.54 11.25 94 1.04 1.035 92
2000 27.5 0.53 11.25 94 1.04 1.036 95
2000 27.4 0.54 11.24 97 1.07 1.037 89
Average Measured 27.5 0.54 11.25 95 1.05 1.036 92
Measured at
speed range
2500rpm
2530 27.3 0.57 11.28 68 0.95 1.030 124
2500 27.3 0.57 11.27 71 0.98 1.032 135
2498 27.4 0.58 11.25 74 1.00 1.033 136
Average Measured 27.3 0.57 11.26 71 0.98 1.032 132
Measured at
speed range
3000rpm
3009 28.1 0.55 11.31 79 0.92 1.029 158
3010 28.0 0.55 11.31 76 0.92 1.029 155
3000 28.0 0.55 11.32 75 0.91 1.028 174
Average Measured 28.0 0.55 11.31 77 0.92 1.029 162
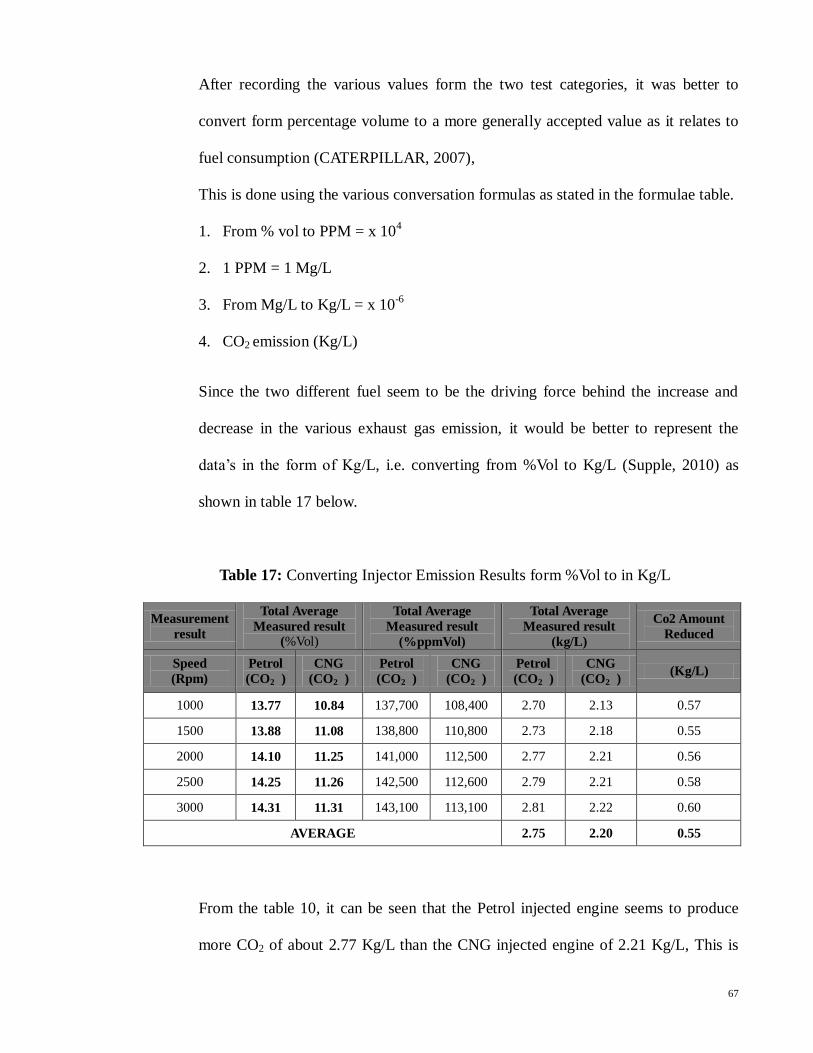
67
After recording the various values form the two test categories, it was better to
convert form percentage volume to a more generally accepted value as it relates to
fuel consumption (CATERPILLAR, 2007),
This is done using the various conversation formulas as stated in the formulae table.
1. From % vol to PPM = x 104
2. 1 PPM = 1 Mg/L
3. From Mg/L to Kg/L = x 10-6
4. CO2 emission (Kg/L)
Since the two different fuel seem to be the driving force behind the increase and
decrease in the various exhaust gas emission, it would be better to represent the
data’s in the form of Kg/L, i.e. converting from %Vol to Kg/L (Supple, 2010) as
shown in table 17 below.
Table 17: Converting Injector Emission Results form %Vol to in Kg/L
Measurement
result
Total Average
Measured result
(%Vol)
Total Average
Measured result
(%ppmVol)
Total Average
Measured result
(kg/L)
Co2 Amount
Reduced
Speed
(Rpm)
Petrol
(CO2 )
CNG
(CO2 )
Petrol
(CO2 )
CNG
(CO2 )
Petrol
(CO2 )
CNG
(CO2 ) (Kg/L)
1000 13.77 10.84 137,700 108,400 2.70 2.13 0.57
1500 13.88 11.08 138,800 110,800 2.73 2.18 0.55
2000 14.10 11.25 141,000 112,500 2.77 2.21 0.56
2500 14.25 11.26 142,500 112,600 2.79 2.21 0.58
3000 14.31 11.31 143,100 113,100 2.81 2.22 0.60
AVERAGE 2.75 2.20 0.55
From the table 10, it can be seen that the Petrol injected engine seems to produce
more CO2 of about 2.77 Kg/L than the CNG injected engine of 2.21 Kg/L, This is

68
further subtracted to displayed the amount of CO2 reduced. As a form of further
clarity, a graph is drawn showing the significant reduction between this two fuel
conditions.
4.4.2 Test Procedures on Vehicle Carburetor System
This test procedure also comprises of the two main fuel categories that we
classified as:
Category C: Petrol Fueled Carburetor engine
Category D: CNG Fueled Carburetor engine
C. Petrol Fueled Carburetor Engine
Table 8 shows the results presentation of the experiments conducted Three
times at each designated speed range, and then the average value was evaluated to
be the most accurate.
Table 18: Result Presentation for Petrol Fueled Carburetor Engine
Measuremen
t result Speed
Oil
temperature CO CO2 HC O2 Lambda NO
Unit 1/min Oc %vol %vol Ppm %vol
Ppm vol
Measured at
speed range
1000rpm
1007 32.0 1.47 13.27 476 1.16 1.043 87
1000 32.3 1.49 13.30 455 1.22 1.042 84
1008 32.2 1.49 13.26 449 1.17 1.044 89
Average Measured 32.2 1.48 13.28 460 1.18 1.043 87
Measured at
speed range
1500rpm
1500 32.5 1.42 13.39 345 1.33 1.043 103
1503 32.4 1.42 13.38 334 1.29 1.042 111
1499 32.5 1.39 13.38 334 1.35 1.044 156
Average Measured 32.47 1.41 13.38 338 1.32 1.043 123

69
Table 18 continued : Result Presentation for Petrol Fueled Carburetor Engine.
Measured at
speed range
2000rpm
2000 32.6 1.40 13.53 226 1.41 1.043 121
2013 32.6 1.40 13.49 245 1.40 1.042 127
2009 32.7 1.39 13.50 239 1.43 1.044 129
Average Measured 32.63 1.40 13.51 237 1.41 1.043 126
Measured at
speed range
2500rpm
2500 32.6 1.41 13.76 215 1.64 1.029 164
2497 32.4 1.40 13.74 214 1.67 1.030 167
2500 32.7 1.39 13.74 224 1.75 1.028 167
Average Measured 32.6 1.40 13.75 218 1.69 1.029 166
Measured at
speed range
3000rpm
3000 32.7 1.37 13.80 212 1.85 0.920 172
3000 32.6 1.35 13.82 205 1.98 1.001 162
2997 32.5 1.38 13.83 209 1.95 0.989 137
Average Measured 32.6 1.37 13.82 209 1.93 0.970 157
D. CNG Fueled Carburetor Engine
Just like that of category B, this experiment is conducted on a CNG
converted carburetor Vehicle engine. As demonstrated in Table 9, the experiments
were conducted Three times at each different designated speed range; thereafter the
average value was evaluated to be the most accurate.
Table 19: Result Presentation for CNG Fueled Carburetor Engine
Measuremen
t result Speed
Oil
temperature CO CO2 HC O2 Lambda NO
Unit 1/min Oc %vol %vol Ppm %vol
Ppm vol
Measured at
speed range
1000rpm
910 32.5 1.29 9.58 525 1.66 1.497 60
1150 32.7 1.25 9.07 484 1.35 1.493 63
1160 32.5 1.29 9.01 484 1.12 1.521 64
Average Measured 32.6 1.28 9.89 498 1.38 1.504 62

70
Table 19 continued: Result Presentation for CNG Fueled Carburetor Engine
Measured at
speed range
1500rpm
1500 32.5 1.24 9.33 392 1.28 1.362 89
1480 32.4 1.24 9.30 390 1.29 1.357 86
1530 32.6 1.23 9.31 453 1.27 1.364 87
Average Measured 32.5 1.24 9.31 412 1.28 1.361 87
Measured at
speed range
2000rpm
2000 32.5 1.20 10.02 304 1.24 1.262 94
1980 32.5 1.18 10.01 271 1.17 1.257 94
2030 32.5 1.19 10.03 275 1.25 1.264 94
Average Measured 32.5 1.19 10.02 283 1.22 1.261 94
Measured at
speed range
2500rpm
2500 32.6 1.15 10.95 230 1.02 1.139 108
2510 32.4 1.15 10.96 229 1.07 1.147 116
2420 32.4 1.12 10.96 236 1.25 1.151 120
Average Measured 32.5 1.14 10.96 232 1.11 1.146 115
Measured at
speed range
3000rpm
3020 32.5 1.07 11.29 216 0.96 1.097 122
2980 32.3 1.06 11.31 205 0.98 1.093 129
3010 32.5 1.09 11.30 201 1.02 1.021 125
Average Measured 32.4 1.07 11.30 207 0.99 1.070 125
We also converted form %Vol to Kg/L. see formulae table for further conversion.
Table 20: Converting Results in Kg/L form %Vol Carburetor Engines
Measurement
result
Total Average
Measured result
(%Vol)
Total Average
Measured result
(%ppmVol)
Total Average
Measured result
(kg/L)
Co2 Amount
Reduced
Speed
(Rpm)
Petrol
(CO2 )
CNG
(CO2 )
Petrol
(CO2 )
CNG
(CO2 )
Petrol
(CO2 )
CNG
(CO2 ) (Kg/L)
1000 13.28 9.89 132,800 78,900 2.61 1.76 0.85
1500 13.38 9.31 133,800 83,100 2.63 1.77 0.86
2000 13.51 10.02 135,100 90,200 2.65 1.78 0.87
2500 13.75 10.96 137,500 99,600 2.69 1.81 0.88
3000 13.82 11.30 138,200 103,000 2.71 1.82 0.89
AVERAGE 2.65 1.78 0.9

71
From the Test results in the four categories (Category A to D), it could be seen that
the Values are quite in close range, however, we consider the Using the Average
values from Table 12.which is then displayed in table 13.
Table 21: Amount of CO2 emission produced by both vehicle Engine types
UNIT
Production Of CO2 Emission In Kg/Liter
Petrol
(carburetor)
Petrol
(Injector) CNG
TOTAL CO2
REDUCTION
Kg/Liter 2.65 kg/litre 1.78 kg/litre 0.87 kg/litre
2.77 kg/litre 2.21 kg/litre 0.56 kg/litre
Table 11 shows that by converting from petrol (carburetor) system to NGV system,
CO2 emission from vehicles could reduce up to 0.9 kilograms for one Liter of NGV
usage. Meanwhile, conversion from Petrol (injector) system to NGV system, up to
0.6 kilograms CO2 reduction per one liter could be achieved. This shows that before
conversion, the Petrol (injector) engine with Euro4 standard of emission already
produced more CO2 compared to petrol (carburetor) system. Therefore, the focus
would be on the carbureted engine vehicle because the more fuel they burn the more
polluted our environment would be, resulting to the various effects as discussed
earlier in Chapter 2.see table 22 for a clearer view.
Table 22: Amount of CO2 emission produced and reduced by Petrol and CNG vehicle
PRODUCTION OF CO2
PETROL CNG TOTAL CO2 REDUCTION
2.6 Kg/L 1.7 Kg/L 0.9 Kg/L
72
4.5 CALCULATIONS AND ANALYSIS
4.5.1 Statistical Considerable facts
1. Currently, in Malaysia there are approximately 23,000,000 vehicles on the
road (JPJ, 2012).
2. As at June 2013, an estimated 53,783 vehicles in Malaysia were running on
natural gas (i.e. 1 of 200 vehicles using CNG) (ANGVA, 2013).
3. The Expected progressive increase in the Number of new cars added to the
Malaysian road as well as the Number of new NGV following a similar
projected increase of 5.7%, 6.0%, 6.5% & 7.0%, 7.5%, 8.0%, 8.5% & 9.0%
(MAA, 2013).
4. The Road Transport Department records that about 99.6 percent of the total
passenger cars in Malaysia use petrol fuel while the others use diesel and
CNG (Masjuki et al, 2005; MMA). Based on this observation, an estimated
increasing pattern of passenger cars has been generated for the period of
year 2013 to year 2020 as in Table 24.
5. The statistical percentage of total number of vehicles in Malaysia, shows
that motorcycles are foremost with 48.60 percent while passenger cars
stands at and 41.60 percent see figure 5 (Masjuki, et al., 2005), However,
fuel consumption of motorcycles is much lower than that of passenger cars
and motorcycle engine does not move on CNG yet, so this study emphasized
on passenger cars only.
6. Standard Value show that each vehicle on the road consumes more than
5Litres per day on a 10-kilometer journey per day (FCE, 2010).
73
4.5.2 Estimated Projections
1. This study estimates a 15% increase by NGV users in comparison with the
total numbers of vehicles in Malaysia from 2013-2020. Hence, giving a high
impact on CO2 emission reduction in Malaysia’s atmosphere.
2. This calculation is done on the value estimated by Highway Network
Development Plan (HNDP) that about 80 % of 25.8 million person-trips per
day would be on passenger cars by year 2020 (Masjuki et al, 2005).
3. According to the annual average fuel usage per vehicle stated in Table 5 by
1Gas Stesen NGV, it would be appropriate to multiply the average amount
of fuel used per vehicle yearly to the numbers of vehicles available in
Malaysia because this could help to ascertain and calculate the level of CNG
fuel consumed over the years and also helps to determine an estimated
amount of CO2 emission from gasoline and NGV fuel vehicles till the vision
is meant at 2020 (ONE gas NVG, 2009).however, a vivid experimental
resolution would be achieved to help justify the expected reduction level.
4. We also used data’s from MAA to analyzed the number of passenger cars
and fuel consumption from year 2013 to 2020 (MAA, 2013)
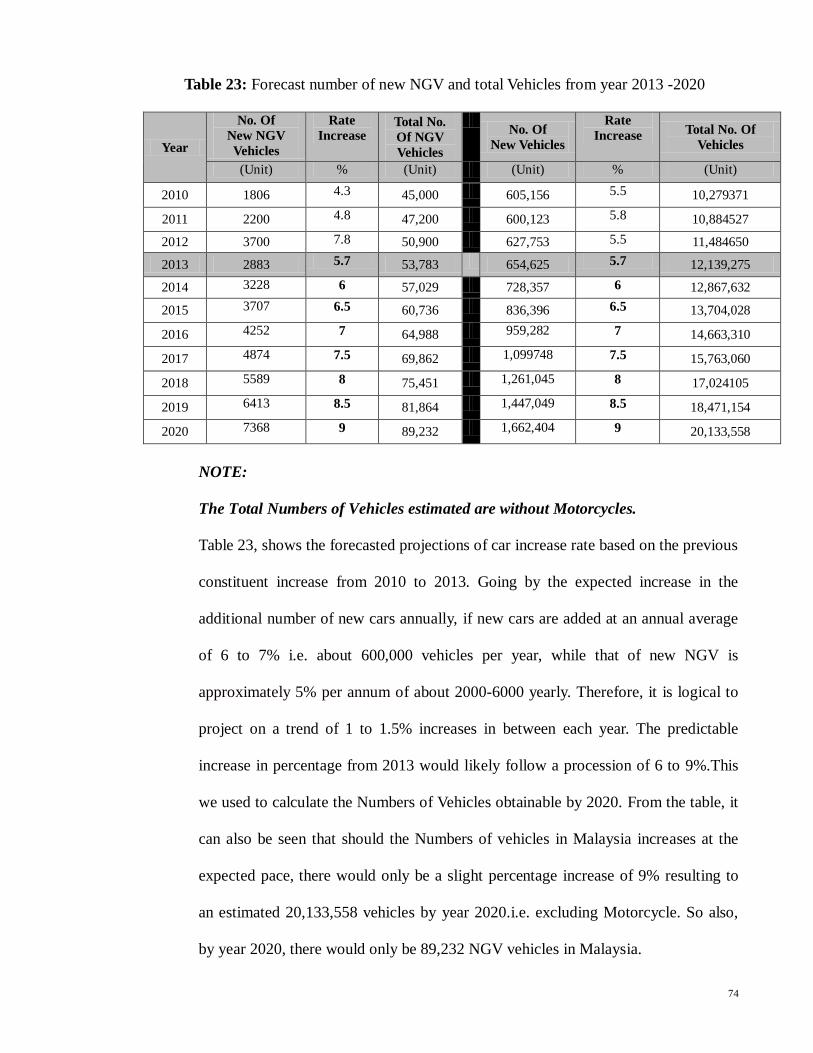
74
Table 23: Forecast number of new NGV and total Vehicles from year 2013 -2020
Year
No. Of
New NGV
Vehicles
Rate
Increase Total No.
Of NGV
Vehicles
No. Of
New Vehicles
Rate
Increase Total No. Of
Vehicles
(Unit) % (Unit) (Unit) % (Unit)
2010 1806 4.3 45,000 605,156 5.5 10,279371
2011 2200 4.8 47,200 600,123 5.8 10,884527
2012 3700 7.8 50,900 627,753 5.5 11,484650
2013 2883 5.7 53,783 654,625 5.7 12,139,275
2014 3228 6 57,029 728,357 6 12,867,632
2015 3707 6.5 60,736 836,396 6.5 13,704,028
2016 4252 7 64,988 959,282 7 14,663,310
2017 4874 7.5 69,862 1,099748 7.5 15,763,060
2018 5589 8 75,451 1,261,045 8 17,024105
2019 6413 8.5 81,864 1,447,049 8.5 18,471,154
2020 7368 9 89,232 1,662,404 9 20,133,558
NOTE:
The Total Numbers of Vehicles estimated are without Motorcycles.
Table 23, shows the forecasted projections of car increase rate based on the previous
constituent increase from 2010 to 2013. Going by the expected increase in the
additional number of new cars annually, if new cars are added at an annual average
of 6 to 7% i.e. about 600,000 vehicles per year, while that of new NGV is
approximately 5% per annum of about 2000-6000 yearly. Therefore, it is logical to
project on a trend of 1 to 1.5% increases in between each year. The predictable
increase in percentage from 2013 would likely follow a procession of 6 to 9%.This
we used to calculate the Numbers of Vehicles obtainable by 2020. From the table, it
can also be seen that should the Numbers of vehicles in Malaysia increases at the
expected pace, there would only be a slight percentage increase of 9% resulting to
an estimated 20,133,558 vehicles by year 2020.i.e. excluding Motorcycle. So also,
by year 2020, there would only be 89,232 NGV vehicles in Malaysia.

75
4.6 CO2 Emission Calculations
Based on the predicted percentage increase, two areas of calculations are being
considered.
1. Calculation On CO2 Emissions from petrol fuel cars by year 2020
2. Calculation On CO2 Emissions Reduction using CNG fuel cars by year 2020
4.6.1 Calculation On CO2 Emissions Produced From Petrol Fuel Cars By
year 2020
To calculate how much CO2 emission that would be contributed from petrol
cars by year 2020, we would treat it from two angles.
1. We subtracted the estimated Total number of NGV from The Total number
of Vehicles obtainable at year 2020 as shown in table 14.
Solution:
Total Vehicle by year 2020 - Total NGV vehicle by year
(20,133,558) - 2020 (89,232) = 20,044326
Therefore, as at year 2020 there would be about 20,044326 cars still running on
gasoline (fuel)
2. We now determine the Amount of CO2 emission that would be generated by
the Remaining Cars not running on NGV by 2020.Assuming that the 20,044326
cars where running on gasoline.
Solution:
If 1 car producing 2.6 kg/liter is estimated to travels on an average of 5 liters per day,
1 day journey = 2.6 x 5 = 13 kg/L daily
1 year journey = 13 x 365 = 4745 kg/L Annually

76
So, by year 2020, If 20,044326 cars are still running on gasoline (fuel),
1 car journey per year produces 4745 kg/L CO2.
Then the Amount of CO2 emitted by vehicle as at year 2020, would be.
20,044326 x 4745 = 9.5 x 10¹⁰ kg
/L CO2 or 95,110,327 Tones CO2
This then leads to the next phase of our projection.
From the calculation above, the increase in rate of new cars seems to affect the
amount of CO2 produced, because, the more the petrol fuel cars the more the CO2
emissions.
4.6.2. Calculation On CO2 Emissions Reduced Using CNG Fuel Cars By 2020
Currently, in Malaysia there are approximately 23,000,000 Total vehicles
and an estimated 53,783 NGV. (JPJ, 2012) i.e. about 0.03% meaning only 1 of 200
vehicles uses CNG, but in other countries like Iran and Pakistan their percentages
are quite high of about 12 and 15%. Taking notice of this, we estimated that an
increase by 15% of the present numbers of cars in Malaysia would have a great
impact in the effort to reduce CO2 by year 2020.This would also see Malaysia reach
the same number of NGVs like Iran and Pakistan as of now. To this end, Table 15
shows the probability of an increase rate in NGV usage that would lead to a 15%
increase of the present number of vehicles in Malaysia.

77
Table 24: Forecast rate of new NGV vehicles from year 2013 –2020
Year % Of
New NGV Vehicles No. Of New NGV Vehicles
Total No. Of NGV
Vehicles
2013 1.6 53,783 53,783
2014 1.5 182,089 235,872
2015 2.0 242,786 478,658
2016 3.25 394,526 873,184
2017 3.75 455,223 1,328,407
2018 4.25 515,919 1,844,326
2019 4.75 576,616 2,420,942
2020 5.55 637,312 3,058,254
Total 3,058,254
NOTE:
The Total Numbers of Vehicles estimated are without MOTOCYCLES.
Therefore as shown in table 14, 15 % of the proposed Total Number of Vehicles in
Malaysia would then be:
15 x 20,133,558 = 3,020,034 Vehicles
100
Looking at table 24, it shows that the total achievable number of new NGV by 2020
following a procession of 1.5, 2.0, 3.25, 3.754.25, 4.75, 5.55, would be 3,058,254 which is
a little bit higher than the proposed 15% increase of about 3,020,034 vehicle by 2020.So
therefore, from the estimated projection in 15% increase Of New NGV Vehicles, to
calculate for the reduction of CO2 emission by year 2020, we would use a generated
equation from Tier 2 (IPCC, 1996).
CO2 𝐸 𝑅 𝑑 𝑐 ∑NVx × LSa × ERb × VRc
Where,
NV x = Nos. of New Vehicles or New NGV Vehicles
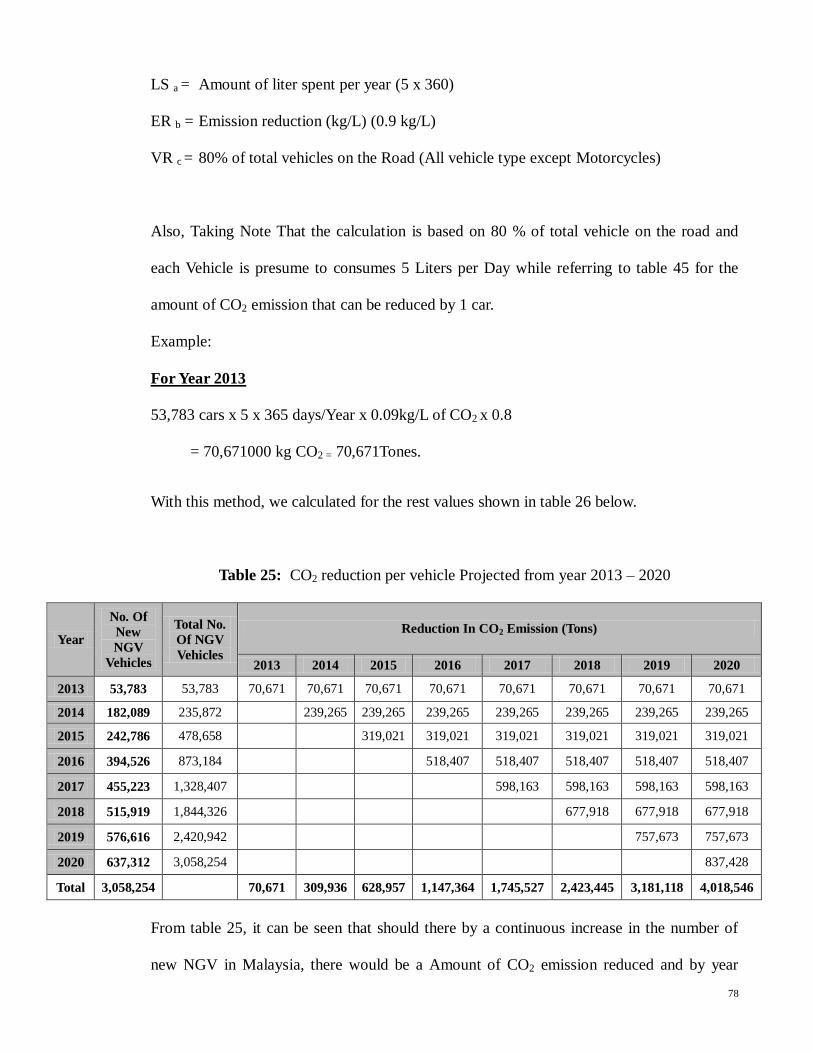
78
LS a = Amount of liter spent per year (5 x 360)
ER b = Emission reduction (kg/L) (0.9 kg/L)
VR c = 80% of total vehicles on the Road (All vehicle type except Motorcycles)
Also, Taking Note That the calculation is based on 80 % of total vehicle on the road and
each Vehicle is presume to consumes 5 Liters per Day while referring to table 45 for the
amount of CO2 emission that can be reduced by 1 car.
Example:
For Year 2013
53,783 cars x 5 x 365 days/Year x 0.09kg/L of CO2 x 0.8
= 70,671000 kg CO2 = 70,671Tones.
With this method, we calculated for the rest values shown in table 26 below.
Table 25: CO2 reduction per vehicle Projected from year 2013 – 2020
Year
No. Of
New
NGV
Vehicles
Total No.
Of NGV
Vehicles
Reduction In CO2 Emission (Tons)
2013 2014 2015 2016 2017 2018 2019 2020
2013 53,783 53,783 70,671 70,671 70,671 70,671 70,671 70,671 70,671 70,671
2014 182,089 235,872 239,265 239,265 239,265 239,265 239,265 239,265 239,265
2015 242,786 478,658 319,021 319,021 319,021 319,021 319,021 319,021
2016 394,526 873,184 518,407 518,407 518,407 518,407 518,407
2017 455,223 1,328,407 598,163 598,163 598,163 598,163
2018 515,919 1,844,326 677,918 677,918 677,918
2019 576,616 2,420,942 757,673 757,673
2020 637,312 3,058,254 837,428
Total 3,058,254 70,671 309,936 628,957 1,147,364 1,745,527 2,423,445 3,181,118 4,018,546
From table 25, it can be seen that should there by a continuous increase in the number of
new NGV in Malaysia, there would be a Amount of CO2 emission reduced and by year

79
2020, there would have been a reduction of about 4,018,546 Tons CO2 emission. The table
projection is based on a target of 15% reduction of CO2 emission as against the present
number of cars in Malaysia.
Figure 15: Graph showing the Reduction in CO2 of 15% Increase in CNG cars
From table 25, the graph is drawn representing the reduction in CO2 Emission of 15%
Increase in CNG cars. If the increase rate take the path as predicted, it would definitely
mean a significant land mile in the quest to reduce the amount of CO2 emission by
2020.from the graph, the increase CNG cars is climbing high on a gradual pace showing
that, other consideration could be given along the way to the 15% goal, however with
continuous improvements on CNG, It would be an achievable target.
0
500,000
1,000,000
1,500,000
2,000,000
2,500,000
3,000,000
3,500,000
4,000,000
4,500,000
2013 2014 2015 2016 2017 2018 2019 2020
CO
2 R
edu
ctio
n
Years
Reduction In CO2 Emission(Tones)
CO2 Emission
80
CHAPTER 5
DISCUSSION
5.1 Introduction
This chapter discusses the results and findings of this study. The chapter begins with
the discussion of CO2 emission results gotten from the performance test; stressing the
significant difference in CO2 emission from Vehicles operating on CNG and Petrol. Besides
this, the highest point was to identify and described the amount of CO2 emission reducible
by year 2020. Furthermore, contributing to this subject matter, the discussion is based on
the estimated increase in cars and the considerable amount of CO2 produce by 2020.
Highlighted were the calculated values achieved from the forecast increase in percentage
rate of the new NVG added each year from 2013 to 2020. This chapter ends up with a
certain level of job satisfaction providing a guide for further studies of CNG as a viable
AFV to gasoline fuel among cars in Malaysia.
5.2 Discussion on CO2 emission Performance test results
From the Performance tests, it was found that the amount of CO2 emission slightly
increased along the different speed range. i.e. the faster the car the more CO2 it emits. It
was also recognized that the two different fuel types plays part of this increase and decrease
in the various exhaust gas emission. From the result of the Performance tests, the petrol
fueled injector engine produced more CO2 emission, having its highest value at 14.31%
Vol. Though this is consider ok for an injector engine it is due to a complete combustion
process, as Shown in table 17.
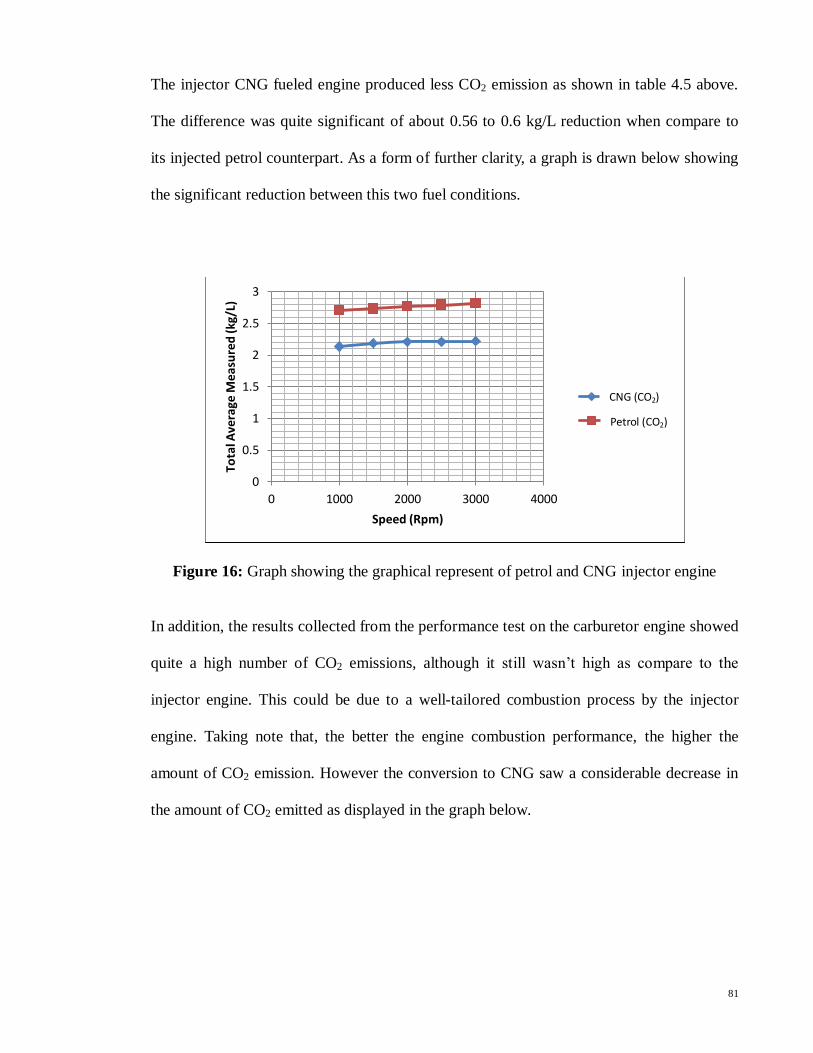
81
The injector CNG fueled engine produced less CO2 emission as shown in table 4.5 above.
The difference was quite significant of about 0.56 to 0.6 kg/L reduction when compare to
its injected petrol counterpart. As a form of further clarity, a graph is drawn below showing
the significant reduction between this two fuel conditions.
Figure 16: Graph showing the graphical represent of petrol and CNG injector engine
In addition, the results collected from the performance test on the carburetor engine showed
quite a high number of CO2 emissions, although it still wasn’t high as compare to the
injector engine. This could be due to a well-tailored combustion process by the injector
engine. Taking note that, the better the engine combustion performance, the higher the
amount of CO2 emission. However the conversion to CNG saw a considerable decrease in
the amount of CO2 emitted as displayed in the graph below.
0
0.5
1
1.5
2
2.5
3
0 1000 2000 3000 4000
To
tal A
vera
ge M
ea
sure
d (k
g/L)
Speed (Rpm)
CNG (C02)
Petrol (C02)
CNG (CO2)
Petrol (CO2)

82
Figure 17: Graph showing the graphical represent of petrol and CNG
The Graph shows that in the two categories, from the start of the engine, as you accelerate
further, the conversion takes effect and as the speed increases the difference in the reduction
of CO2 emission begins to manifest.
5.3 Comparing the Petrol Fueled Engine to the CNG fueled engine
In comparing the both test subject and their different categories, the carburetor
engine seems to produce the more amount of CO2 emission reduction than the injected
engine. This is due to the adaptation of the Carburetor engine to CNG conversion and
probably some other numerous qualities. This produced a specific increase of 0.9 kg/L as
compare to the injector of 0.6 kg/L. With this finding, our further consideration and
calculation was based on the fact that the best quality of reduction could be attended to in
other to encourage the phasing out of petrol usage in the transport industry. In addition, it
was found from the performance test of both test engines, that, the use of CNG generally
brings about a reduction of CO2 (Jahirul, et al., 2010).
0
0.5
1
1.5
2
2.5
3
0 1000 2000 3000 4000
Tota
l Ave
rage
Mea
sure
d (
kg/L
)
Speed (Rpm)
Petrol (Co2 )
CNG (Co2 )CNG (CO2)
Petrol (CO2)

83
5.4 Discussion on Co2 emission reduction analysis
In this section, the data’s gotten from the performance test is consider and analyzed
with the help of various estimation and projections models. From the calculations,
projecting from year 2013 to year 2020 (IPCC, 1996; MAA, 2013), the possible significant
amount of CO2 emission that could be produced using petrol fuel on cars, was found to be
quite high according to the various statistical facts stated in number 4.5.1.The consideration
was based on all the facts but most especially was the approximate amount of vehicles on
the Malaysia road, also considered was the estimated 53,783 numbers of NGV in Malaysia
(ANGVA, 2013).From all the assumption and calculations done in this study, the most
important fact was the exclusion of Motorcycles from the list of vehicles in Malaysia.
Although Motorcycles occupies about 48.6 % of the Malaysia vehicle, motorcycles do not
run on CNG, so it wasn’t necessary considering it in our study (Masjuki, et al., 2005). As at
2012, the numbers of vehicles excluding motorcycles in Malaysia was about 12, 139, 275,
considering that the increase rate is about 0.5 to 1.5 % amongst the numbers of new
numbers NGV cars and total numbers of Cars in Malaysia (MAA, 2013). Then, with these
estimations, table 14 was drawn forecasting and projecting an expected increase in the
numbers of cars on the Malaysian road, which is from year 2013 following the same
procession of percentage increase through to year 2020.form the calculated projection, it
was found that if all goes by the expected increase in the additional numbers of new cars
annually, table 24 reflects that there would be a slight percentage increase projection to 9%
increase rate of about 20,133,588 vehicles by year 2020.so it was also for the number of
total NGV following the same expected percentage increase, this would by year 2020
amount to about 89,223 numbers of Vehicles in Malaysia.

84
Considering this forecast, the two expected outcomes showed that by year 2020 the
numbers of NGVs would still be below 100,000 units i.e. in ranges of 0.05 to 1 % of the
total Number of Vehicles in Malaysia by year 2020.Although; this would be about 1-2% of
the present day total number of cars in Malaysia. With these understanding established, we
then calculated for Two Conditions.
1. Calculation On CO2 emissions from petrol fuel cars by year 2020
2. Calculation On CO2 emissions Reduction using CNG fuel cars by year 2020
5.4.1 Discussion On CO2 Emissions Produce Using Petrol Cars
Under the first Condition, we subtracted the estimated total Number of NGV
from the Total Number of Vehicles and in doing this, it was discovered that by year
2020, the number of cars still running on petrol would be about 20,044,326 units.
Thereafter, with this number, we were able to calculate the Amount of CO2 emission
that would be generated in year 2020.stating that:
If 1 car producing 2.6 kg/liter is estimated to travels on an average of 5 liters per day,
1 day journey = 2.6 x 5 = 13 kg/L daily
1 year journey = 13 x 365 = 4745 kg/L Annually
So, by year 2020, If 20,044326 cars are still running on gasoline (fuel),
1 car journey per year produces 4745 kg/L CO2.
Then the Amount of CO2 emitted by vehicle as at year 2020, would be 95,110,327
Tones CO2
85
5.4.2 Discussion On CO2 Emissions Reduction Using CNG Cars
The second Consideration was that, as at present the number of NGV is
about 0.03 % of the total car in Malaysia. Taking note of this, we estimated that a 15%
increase of NVG by year 2020 would have a great impact in the effort to reduce
CO2 emission in Malaysia. This would also see Malaysia grow to almost reach the
same numbers of NGVs like Iran and Pakistan as of now. Table 26 showed the
calculation with a total number of new NGV at 3,058,254 vehicles by year
2020.However, table 25 shows that, in other to achieve this total number of new
NGV by 2020,the increase rate has to follow a procession of about 1.5, 2.0, 3.25,
3.754.25, 4.75, 5.55, which would produce about 3,058,254 units of vehicle. Then
comparing to the proposed 15% increase of about 3,020,034 vehicles by 2020, this
seems a little bit higher and ok. So therefore, from the estimated projection of 15%
increase in new NGV Vehicles, we then calculated for the amount of CO2 reduced
by the year 2020.We found out that if the trend of new numbers of NGV in
Malaysia starting from 2013 should increase in the procession as estimated, there
would be a total of about 4,018,546 tones CO2 emission reduced by 2020.also
shown was the amount of CO2 emission reduced each year. This is used further to
derive the amount of reduction per day as shown in Table 26.

86
Table 26: Vehicle Unit and CO2 Emission reduced from year 2014 – 2020
Year No of
Vehicles
Petrol
CO2
CNG
CO2
Reduction
Emission
CO2/Litre
Reduction
Emission
CO2/Day
Reduction
Emission CO2 /
Year.
Unit Kg/litre Kg/litre Kg/litre Tonnes Tonnes
2014 182,089 2.6 1.7 0.9 656
239,265
2015 242,786 2.6 1.7 0.9 874
319,021
2016 394,526 2.6 1.7 0.9 1,420
518,407
2017 455,223 2.6 1.7 0.9 1,639
598,163
2018 515,919 2.6 1.7 0.9 1,857
677,918
2019 576,616 2.6 1.7 0.9 2,076
757,673
2020 637,312 2.6 1.7 0.9 2,294
837,428
From the table 26, the estimated CO2 emission reduced per day will be around
2,294tonCO2 for using NGV fuels or about 3,058,254 units. This would be good a step for a
fast developing country like Malaysia. Table 25 and Table 26, evidently shows that this
amount of CO2 can gradually be reduced with the increasing use of CNG fuel instead of
petrol. I.e. if About 15 percent of The Present total Number of cars in Malaysia is running
on CNG fuel. Based on this study, we were able to:
1. Verify its objectives of establishing the already estimated fact that the use of CNG
vehicles reduces car exhaust CO2 emission of about 0.9 kg/L when compared to
petrol.
2. Substantiate the possible significant amount of CO2 emission that can be reduced by
year 2020 with a projected increase in CNG fuel usage.
87
CHAPTER 6
CONCLUSIONS AND RECOMMENDATIONS
6.1 Introduction
This chapter wraps up this study regarding CNG usage and CO2 emission in the
Malaysia Transport industry. The study achieving its main objective could help meet the
Malaysian target of CO2 emission reduction to 40% by year 2020 as compared to its 2005
level (Mohamad, 2009). In addition this study suggested some recommendation for future
research to reducing the amount of CO2 emission by year 2020.
6.2 Conclusion
On a whole, while this report generally documented the use of CNG on vehicles as
an alternative to petrol, the main focus is that it would reduce the amount of CO2 emission
in the transport sector which could in turn lead to a sustainable and carbon free Malaysia by
year 2020. The 45% of CO2 emission from the transport sector can be effectively tackled
with the use of more CNG vehicles on the Malaysian road instead of Petrol. From the
performance tests conducted on the carburetor and injector car engine, using both petrol
and CNG fuel discretely, a proposed CNG takeover of the total vehicles on the Malaysian
road by 2020 is worth the consideration, taking note that using CNG as an alternative fuel
to petrol reduces about 0.9kg/L of CO2 exhaust gas emission. This means that the amount
of CO2 emission in the Malaysia road transport sector can gradually be reduced with the
increasing use of CNG fuel instead of Gasoline (petrol). Also, from the analysis, the

88
possible amount of CO2 emission that can be reduced with the increasing use of CNG
vehicle by year 2020 would be about 4,018,546 tones as against an estimated 3,058,254
cars. With this level of increase Malaysia could meet up with other higher NGV users
around the world, taking Iran and Pakistan as a point of reference (Mostafa, et al., 2005).
also, while taking every other estimation into consideration, there are other car powered
sources that produces’ less CO2 emissions in use e.g. Electric, Hybrid, Bio-fuel and others,
but in all, considerations should be given to the normal expected increase in general car
numbers, which would be about 20,133,558 units by year 2020. Finally, from the study, it is
presume that CNG fuelled engines has a great prospect as compare to gasoline since it has a
clearly defined advantage in the reduction of CO2 emissions.
6.3 Recommendations
This report has generally acknowledged the use of CNG on vehicles as an
alternative to petrol, however, it is important to carry out continuous research on this and
other energy saving technologies in other to simultaneously reduce the amount of CO2
emission in other producing sectors such as industrial, commercial and residential using
CNG.in contrast, the various estimation and accuracy of the result was based on the
availability and accessibility of the CO2 emission result. So, as a part of research
fundamentals, results should be made available and be periodically updated so that
researchers could look at these data and extract meaningful information from them.
Additionally, the Malaysian government has to play some few more roles in its efforts to
meeting the 40% CO2 reduction target by 2020 (Mohamad, 2009). Either by the effecting
more policies to further cut down gasoline usage in the transport sector or Make CNG a
must use fuel. This write-up serves as a preliminary report toward integrating CNG and its
CO2 emission reduction benefits to transportation, thus, a holistic analysis and clear
89
understanding of how the CNG engine performance relates to CO2 emission reduction in
the transport sector as a whole is required. Researches could also be done on the other GHG
emitted from the car exhaust. More emphases on the importance and safety in using CNG
should be highlighted to the public, in other to fulfill the vision of a 40% CO2 reduction by
2020 (Mohamad, 2009).In addition, This same procedure could be followed to predict the
emission for non-conversion, full conversion and partial replacement of petrol fuels driven
cars by NGVs. Finally, although there are many strategies in general that can reduce CO2
emissions in the Transport sector, the Author suggests CNG as a viable alternative to
Gasoline fossil fuel for the case of Malaysia.
.
90
REFERENCES
Afroz, R., Nasir, M. & Akma, N., 2003. Review of air pollution and health impacts in
Malaysia. Environmental Research, Volume 92, p. 71–77.
Air Quality Science IAQ Resource Center (Aerias) 2012. Environmental Research on
Carbon Dioxide: A Common Indoor Air Pollutant in Malaysia.
Aldrich, B. & Chandler, C., 1997. The ABCs of AFVs – A Guide to Alternative Fuel
Vehicles. The California Energy Commission.United Sates.
Al-Mofleh, A., Taib, S., Mujeebu, M. A. & Salah, W., 2009. Analysis of sectoral energy
conservation in Malaysia.Energy. 6(34), pp. 733-739.
Asia Pacific Natural Gas Vehicles Association (ANGVA). 2013. Status of NGV in Asia
Pacific (Dec ’12). http://www.angva.org/?page_id=256.
Aslam, M.U., Masjuki, H.H., Maleque, M.A., Kalam,M.A., Mahlia, T.M.I., Zainon, Z.,
2003. Introduction of natural gas fueled automotive in Malaysia. Proc. TECHPOS’03; 160.
University of Malaya, Malaysia.
Aslam, M.U., Masjuki, H.H., Kalam, M.A., Abdesselam, H., Mahlia, T.M.I., and Amalina.
M.A. 2006. An experimental investigation of CNG as an alternative fuel for a retrofitte
gasoline vehicle. Fuel, Volume 85, pp. 717-724.
Bakar, R. A. & Mardani, A. S., 2001. The Realization Of Optimum CNG Engine:It’s
Implication On Engine Design”, Advances in Malaysian Energy Research,. UKM, 29
October 2001.
Bakar, R. A. S., 2008. A Technical Review of Compressed Natural Gas as an Alternative
Fuel for Internal Combustion Engines. American Journal of Engineering and Applied
Sciences, 4(1 ISSN 1941-7020), pp. 302-311.
Bakar, R., Idris, A. & Semin., 2009. An Overview of Compressed Natural Gas as an
Alternative Fuel and Malaysian Scenario. European Journal of Scientific Research, 34(1),
pp. 6-15.
Bakar, R., Semin. & Ismail, A., 2007a. The Internal Combustion Engine Diversification
Technology And Fuel Research for the Future. A Review, Proceeding of AEESEAP
Symposium, Kuala Lumpur, Malaysia, p. 57 – 62.

91
Bakar, R., Semin., Ismail, A. & Ali, I., 2007b. Computational Modeling of Compressed
Natural Gas as an Alternative Fuel for Diesel Engines, Proceeding of 2nd ANGVA
Conference. Bangkok, Thailand.
Bari, M.A., R.A. Begum, A.H. Jaafar, R.D.Z.R.Z. Abidin and J.J. Pereira, 2011. Future
Scenario of Residential Energy Consumption and CO2 Emissions in Malaysia. Universiti
Kebangsaan Malaysia, Bangi.
Beniston, M., 2002. Climatic change: possible impacts on human health. Swiss medical
weekly, Volume 132, pp. 332 -337.
Biello, D., 2010, July 22. The new normal: Average global temperatures continue to rise.
Scientific American.
Bosch,2013.MTS 1100 Gas analyser. Retrieved 24 September 2013 from:
http://www.boschdiagnostics.com/parts/diagnostics/MTS1100/Pages/MTS1100.aspx.
Burniaux, J. & Chateau, J., 2011. Mitigating potential of removing fossil fuel subsidies: A
general equilibrium assessment (OECD Economics Department Working Paper No. 853).
Cable, J., 2004. NIOSH report details dangers of carbon dioxide in confined spaces.
Occupational Hazards.
Canadel, J. et al., 2010. Interactions of the carbon cycle, human activity, and the climate
system: a research portfolio. Current opinion in environmental sustainability, 2(4), pp.
301-311.
CATERPILLAR, 2007. Application and installation guide:Gas ENGINE EMISSION. pp.
7-11.
Ching, G., 2005. China NGVs as a solution to energy security concerns in China and
beyond, in Proceedings of ANGVA 2005, July 26-28. Kuala Lumpur,Malaysia..
Chowdhury, A.D. (2005), CNG programme for commercial vehicles in India, in
Proceedings of ANGVA 2005, July 26-28, Kuala Lumpur, Malaysia.
Chyi, S.C. (2010).Review on Malaysia's national energy developments: Key policies,
agencies, programmers and international involvements; Renewable and Sustainable
Energy Reviews, Volume14.Issue9 pp, 2916-2925.
Crypton, 2012. Understanding EXHAUST EMISSIONS. Retrieved 3 December 2013 from:
http://www.crypton.co.za/Tto%20know/Emissions/exhaust%20emissions.html.
Das, M. L., Gulati, R. & Gupta, K. P., 2000. A comparative evaluation of the performance
characteristics of a spark ignition engine using hydrogen and compressed natural gas as
alternative fuels. International Journal of Hydrogen Energy, Volume 25, (2000), 783-793.

92
Daud, M., 2005. Experience and challenges in the implementation of NGV/CNG as a clean
fuel of choice for malaysian Transportation Sector in Proceedings of ANGVA, 26-28 July,
p. Paper 1, Kuala Lumpur, Malaysia.
Department of Environment, Malaysia. (2001). Clean Air Regional Workshop Fighting
Urban Air Pollution: From Plan to Action,Department of the Environment, Malaysia,
KL,Malaysia. http://www.doe.gov.my/portal/
Department of Environment, Malaysian. MDOE (2010). Retrieved 16 Novenmber 2013,
from Department of Environment Malaysia .http://www.doe.gov.my/portal/
Department of Statistics. (2010a). Population and housing census of Malaysia 2010
Population distribution and basic demographic characteristics. Putrajaya, Malaysia.
Department of Statistics. (2010b). Population, household & living quarters, Malaysia.
Retrieved 13 September 2011, from Department of Statistics Malaysia
http://www.statistics.gov.my/portal/download_Population/files/BPD/population_quarters_2
010.pdf
Durell, Elizabeth, Allen, Jeff., Law, Donald.,Heath, John., 2000. Installation and
Development of a Direct Injection System for a Bi-Fuel Gasoline and Compressed Natural
Gas Engine, Proceeding ANGVA 2000 Conference,. Yokohama, Japan.
Energy Information Administration (EIA). 2005. Malaysian Country Analysis Brief.
Washington, DC., Office of Energy Markets and Use.
Exaust A, 2010. Exhaust Analysis Using 4 and 5 Gas Analyzers EMISSIONS #2 .
Retrieved 23 November 2013 from: .autoshop101.com fo ms h .pdf .
G8, 2007. Chai ’s Summa y. Heiligendamm: G8 Summit 2007 Heiligendamm.
http://www.g-8.de/Webs/G8/EN/G8Summit/SummitDocuments/summit documents.html
Gallo, M., 2011. A fuel surcharge policy for reducing road traffic greenhouse gas
emissions. Transport Policy, 38(18(2)), pp. 413-424.
Ganesan, V., 2003. Internal combustion engines. In: s.l.:Tata McGraw Hill, pp. ISBN 0-07-
0494576.
Green Tech Malaysia (2008). CO2 emissions by sector from Global Perspective. Retrived 4
June 2013 from: http://www.greentechmalaysia.my/.
Gruber, G., 2011. Combating climate change. Available at: www.thestar.com.my
[Accessed 17 November 2013].

93
Hasim, A. R., 2005. Natural gas for vehicle – the fuel of choice for Asia pacific - status,
challenges and the way forward, in Proceedings of ANGVA 2005, July 26-28,. Kuala
Lumpur, Malaysia.
Hubacek, K., Guan, D. & Barua, A., 2007. Changing lifestyles and consumption patterns in
developing countries: a scenario analysis for China and India.. Futures, 39(9), pp. 1084 -
1094.
International Energy Agency (IEA), 2010. International Energy Agency:Working together
to ensure reliable, affordable and clean energy. http://www.prb.org/pdf11/2011population-
data-sheet_eng.pdf
International Energy Agency (IEA), 2011. CO2 emissions from fuel combustion 2011 high
lights.index,Malaysia-CO2emissions.http://www.indexmundi.com/facts/malaysia/co2-
emissions
Intergovernmental Panel on Climate Change (IPCC). 1996. IPCC Good Practice Guidance
and Uncertainty Management in National Greenhouse Gas Inventory.. Montreal.
Intergovernmental Panel on Climate Change (IPCC). 2001. Climate Change 2001: The
Scientific Basis. Geneva: Intergovernmental Panel on Climate Change.
Intergovernmental Panel on Climate Change (IPCC).2004.16 Years of Scientific Assessment
In Support of the Climate Convention: Intergovernmental Panel on Climate Change..
Geneva.
Intergovernmental Panel on Climate Change (IPCC).2006.Intergovernmental Panel on
Climate Change. 2006 IPCC guidelines for national greenhouse gas inventories.: National
Greenhouse Gas Inventories Programme.. Kanagawa, JAPAN.
Intergovernmental Panel on Climate Change (IPCC).2007a. IPCC Special Report on
Carbon Dioxide Capture and Storage Climate Change.Working Group III of the
Intergovernmental Panel on Climate Change. Geneva.
Intergovernmental Panel on Climate Change (IPCC).2007b.Climate Change:Impacts,
Adaptation and Vulnerability. Contribution of Working Group II to the Fourth Assessment
Report of the Intergovernmental Panel on Climate Change.. Geneva.
Jahirul, M.I.; Saidur, R.; Hasanuzzaman, M.; Masjuki, H.H.; Kalam, M.A. (2007). A
comparison of the air pollution of gasoline and CNG driven car for Malaysia. International
Journal of Mechanical and Materials Engineering, 2 (2). pp. 130-138. ISSN 18230334.
Jahirul M. I., Masjuki H. H., Saidur R., Kalam M. A., Jayed M. H., & Wazed M. A.
(2010).Comparative engine performance and emission analysis of CNG and gasoline in a
retrofitted car engine. Applied Thermal Engineering, 30(14-15), 2219-2226.
94
Kalam M., 2007. Performance and simulation study of a new Direct Injection (DI)
comp essed natu al gas (CNG) engine.(Unpublished PhD’s thesis). University of Malaya,
Kuala Lumpur.
lee yen mun, 2013. RON95 petrol, diesel up 20 sen from midnight (Update).
Available at: http://www.thestar.com.my/News/Nation/2013/09/02/ron95-up-20-sen.aspx
Malaysia Automotive Association (MAA) 2013.: Summary of Sales & Production Data.
Available at: http://www.maa.org.my/info_summary.htm [Accessed 10 May 2013].
Malaysia Environmental Quality Report, (MDOE) (1996).Malaysia Ministry of Science,
Technology and Environment.
Malaysian Meteorological Department. (MMD) (2009). Climate change scenarios for
Malaysia. Petaling Jaya, Selangor, Malaysia: Malaysian Meteorological Department., pp.
2001 -2099.
Malaysian Road Transport Departmen JPJ, R., 2012. Vehicle and driver statistics:Road
Transport Department Malaysia.June 2013.
Masjuki H., Rehan M. & Mahlia T., 2005. Energy use in the transportation sector of
Malaysia. A danida-funded project on renewable energy and energy efficiency..
Consultancy unit university of Malaya.
Mohamad M., 2009. Malaysian Prime Minister at COP15. Retrived 5 June 2013 from:
http://www.demotix.com/news/malaysian-prime-minister-cop15#media-207416.
Mohan M., 2008. Addressing the sustainable development and climate change
challenges together: Applying the sustainomics framework. Procedia social and behavioral
science 41 (2010); 6634-6640.
Mostafa S., Ghoresihi S. & Maryam H., 2005. I an’s NGV oad-map; Technology, policy
and marketing, in Proceedings of ANGVA. Kuala Lumpur, Malaysia.
National, E. B., 2008. Energy statistics from Energy Commission Retrived 8 June 2013
from:http://www.st.gov.my/index.php?option=com_content&view=article&id=5437%3Ae
nergy-statistics&catid=837&Itemid=1749&lang=en .
National Institute for Occupational Safety and Health (NIOSH).(1976). Criteria for a
Recommended Standard, Occupational Exposure to Carbon Dioxide.
National Institute for Occupational Safety and Health. NIOSH, 1997. NIOSH Pocket Guide
to Chemical Hazards. DHHS (NIOSH) publication no. 97-140. US Government Printing
Office, Washington, DC . Available at: http://www.cdc.gov/niosh/npg/npg.html

95
National News Agency of Malaysia BERNAMA, 2011. Malaysia on Target for 200 NGV
filling Stations Nationwide. http://www.namnewsnetwork.org/v3/read.php?id=MTYwNTcz
National News Agency of Malaysia BERNAMA, 2013. Flood Situation Worsen In
Pahang, Johor And Terengganu. Retrieved 3 May 2013 from: http://www.bernama.
com/bernama/v7/newsindex.php?id=998168
Nam News Network (NNN), 2012. Petronas To Have 184 NGV Stations Nationwide By
2014Source: Nnn-Bernama. http://www.namnewsnetwork.org/v3/read.php?id=MjA3NjM0
Nelson L., 2000. Summary of physiological effects and toxicology of CO2 on humans.
Carbon Dioxide Poisoning. Emerg. Medicine, 32(5), pp. 36-38.
Netto A., 2009. Copenhagen talks create hardlya ripple in malaysia, Inter Press Service.
Retrived 4 October 2013 from: http://ipsnews.net/news.asp?idnews=49744.
NGV Global Ne s, 2012 Malaysia’s Pet onas to Add 10 Mo e NGV Refueling Stations by
2014. Retrived 14 may 2013 from: http://www.ngvglobal.com.
Nylund N., Laurikko J. & Ikonen M., 2002. Pathways for natural gas into advanced
vehicles. IANGV International Association for Natural Gas Vehicle, Edited Draft Report
2002; Version 30.8.2002.
O’Sullivian S. & & Morrall J., 1996. Walking distances to and from Light-Rail Transit
stations. Transportation Research Record , Volume 1538, pp. 19 -26.
ONE gas NGV,2009. Retrived 6 May May from:http://www. malaysiangv.com/station.html
Perumal E., 2008-06-13. Rush to fit natural gas gadget". The Star Online. Available at:
http://www.thestar.com.my/story.aspx?file=%2f2008%2f6%2f13%2fcentral%2f21532553
&sec=central [Accessed 7 September 2013].
Rahnama A., 2007. The Great Progress in CNG, A Giant Leap in Iran, 2nd ANGVA
Conference,. Bangkok, Thailand, R BAIRWA.
Ramhee E. & Reddy, K. V. K. (2011). Performance analysis of a 4-stroke SI engine using
CNG as an alternative fuel. Indian Journal of Science and Technology, 4(7), 801-804.
Rice S.A., 2004. Human health risk assessment of CO2: survivors of acute high-level
exposu e and populations’ sensitive to p olonged lo level exposu e. Poste 11-01
presented at 3rd Annual conference on carbon sequestration, Alexandria.
Safaai S., Noor Z.Z., Hashim H., Ujang Z., & Talib J. (2010). Projection of CO2 emissions
in Malaysia. Environmental Progress & Sustainable Energy.

96
Saidur R. , Jahirul, M., Moutushi T., Imtiaz H., Masjuki H. (2007). Effect of partial
substitution of diesel fuel by natural gas on performance parameters of a four cylinder
diesel engine.. Proceedings of the Institution of Mechanical Engineers, Part A: Journal of
Power and Energy, 221(1), pp. 1-10.
Salahudin, S. N., Abdullah, M. M. & Newaz., N. A., 7 July 2013.. Emissions: Sources,
Policies And Development In Malaysia,. Volume 1.
Sanquist, T. F., Orr, H., Shui, B. & Bittner, A. C., 200. Lifestyle factors in U.S. residential
electricity consumption. Energy Policy, 42(2012), pp. 354-364.
Schipper, L., Bartlett, S., Hawk, D. & Vine, E., 1989. Linking life-styles and energy use: A
matter of time?. Annual Review of Energy, 14(1), pp. 273-320 .
Schipper, L., Saenger, C. & Sudardshan, A., 2011. Transport and carbon emissions in the
United States: The long view.. Energies,, 4(4), pp. 563 -581.
Schwartz, S. H. (1996). Value priorities and behavior: Applying of theory of integrated
value systems. In C. Seligman, J. M. Olson, & M. P. Zanna (Eds.), The Psychology of
Values: The Ontario Symposium, Vol. 8 (pp. 1–24). Hillsdale, NJ: Erlbaum.
Selamat & Abidin, 2010. Renewable Energy and Kyoto Protocol: Adoption in Malaysia.
Available at: http://publicweb.unimap.edu.my/ppkas/home/index.php/news/articles/29.
Shah, A., 2011. Climate change and global warming introduction. Global Issues website:.
http://www.globalissues.org/article/233/climate-change-and-global-warming-introduction.
Shamekhi, A. H. & Khatibzadeh, N., 2008. A Comprehensive Comparative Investigation of
Compressed Natural Gas as an Alternative Fuel in a Bi-Fuel Spark Ignition Engine..
Iranian Journal of Chemistry & Chemical Engineering, 27(1), pp. 73-83.
Shasby, B., 2004. Alternative Fuels: Incompletely Addressing the Problems of the
Automobile, MSc Thesis, USA. Virginia Polytechnic Institute and State University, 19
May, pp. 5-13.
Sperling, Daniel & Gordon, D., 2009. Two billion cars driving toward sustainability. New
York: Oxford University Press, ISBN 978-0-19-537664-7., p. 93–94.
Sun, Xiaobo., Lutz, Alwin., Vermiglio, Ezio., Arold, Mark., 1998. Wiedmann, Tom, The
development of the General Motors 2.2L CNG bifuel passenger cars, s.l.: SAE Technical
Paper (982445).
Suria NGV, 2012.Save Fuel Cost up to 80%.Retrived 6 July 2013 from:
http://suprongv.com/v1/index.php?option=com_content&task=blogsection&id=8&Itemid=
28
97
Tangang, F., 2007. Climate change and global warming: Malaysia perspective: Malaysia
perspective and challenges. Lecture note., Universiti Kebangsaan Malaysia.: School of
Environmental and Natural Resource Sciences, Faculty of Science & Technology.
Theseira Gary W., T., 2010. How can the 40% carbon (intensity) reductions can be
achieved?. ENSEARCH, Issue Waste Management 2010 Conference.
UN, 1998. Kyoto Protocol to the United Nations Framework Convention on Climate
Change (UNFCCC) 1998. New York, United Nations.
UN, 2008. Kyoto Protocol to the United Nations Framework Convention on Climate
Change., New York: United Nations.
UNFCCOCC, 1997. United Nations Framework Convention on Climate Change: Kyoto
Protocol to the United Nations Framework Convention on Climate Change.
United States Department of Transportation,National Highway Traffic Safety
Administration (2010),Factors and Considerations for Establishing a Fuel Efficiency
FCE,2010.
United States National Academy of Sciences (NAS) 2008. "Most scientists agree that the
warming in recent decades has been caused primarily by human activities that have
increased the amount of greenhouse gases in the atmosphere.
Waterland, L., Powars, C. & Stickles, P., 2005. Safety Evaluation of the Fuel Maker Home
Refueling Concept”, Final Repo t, NREL SR-540-36780NREL, Colorado, USA.
Wee, K., Matsumoto, H., Chin, S. & Yu, F., 2008. Energy consumption and carbon dioxide
emission considerations in the urban planning process in Malaysia. Planning Malaysia 6,
pp. 99-128.
Wei, Y., Liu, L., Fan, Y. & Wu, G., 2005. The impact of lifestyle on energy use and CO2
emission: An empirical analysis of China's residents.. Energy Policy, 35(1), pp. 247-257.
Yusaf, T. F., Buttsworth, D. R., Saleh, K. H. & Yousif, B. F., 2010. CNG-diesel engine
performance and exhaust emission analysis with the aid of artificial neural network.
Applied Energy, 8(5), pp. 1661-1669.

98
APENDIX 1
BOSH Gas Exhaust Analyzer Operating Principle
1. Warm-up period
The device's warm-up period amounts to approximately 1 minute. At this period it is not
possible to perform a measurement.
2. Null balance at start of measurement
After switching on the pump, for period 30 seconds the zero point of the analysis system is
automatically compensated for with ambient air (zero gas).
3. Null balance during measurement
After a measurement has been started, the BEA 050 performs an automatic system check
using ambient air .The BEA 050 then switches a solenoid valve to ambient air for the
system check. Zero gas is then purged for a period of 30 seconds. The ambient air intake is
then cleaned of hydrocarbons by an activated-carbon filter.
Check (inspect) the system before any experiment.
1. Exhaust Sample System Tightness: It is essential that the exhaust sample system does not
have any leakages if it is to measure exhaust gas accurately. So before the experiment,
make sure a tightness test (leakage test) is performed.
2. Exhaust Sample Probe: Make a Visual inspection of the exhaust-gas sample probe
keeping the opening at the tip of the probe clean. Check for any signs of HC residue and

99
condensation, if found, disconnect the exhaust sample probe from the hose and blow it out
in the opposite direction to the intake flow using compressed air.
3. Exhaust Sample Hose: Check whether both PVC hoses are connected to the gas exhausts,
check for signs of damage. If there are any signs of HC residue and condensation
disconnect the exhaust sample probe from the hose and blow it out in the opposite direction
to the intake flow using compressed air.
4. Filter: Check the downstream measuring chambers if damaged by corrosion residue (e.g.
rust particulates through metal-filter inserts). Also check if the measuring gas is cleansed of
particulates (e.g. dust and soot) and aerosols by a cascade of filters. In order to prevent any
damage occurring to the exhaust-gas analyzer, it is necessary to ensure that the correct type
of filter is used and that it is replaced according to the schedule.
5. Checking Display Stability: Disconnect the exhaust sample hose from the measurement
input on the BEA 050. In the Emission System Analysis program in your Bosch test system
call up the Diagnosis / Gas values menu. After the system balance (null balance and HC
residue test) the device will display the current measured values. Observe the display for
approx. 2 minutes checking limits and stability.
Error limits for fluctuations (noise):
Display Value Fluctuation
CO 0 %Vol + 0,005 %Vol
CO2 0%Vol + 0,02 %Vol
HC 0 ppm Vol + 0,12 %Vol
O2 20,9 % Vol + 0,4 %Vol
The HC display stabilize at a value < 12 ppm vol after approx. 2 minutes.

100
APENDIX 2
Experimental Pictures
CAMPRO IAFM Engine
A change over switch and the exhaust probe in the exhaust

101
The RPM clip, for taking the readings
The BOSH 050, gas analyzer during experiment

102
APENDIX 3
Conference Paper

103
Odeta P., Edilan M.M., Hossain A., Bakar M.A. (2013). Reduction of CO2 Emission in
Malaysia Transport Industry: Using Compressed Natural Gas (CNG) as Alternative Fuel.
Science & Engineering Technology National Conference 2013, Bangi, Malaysia, 3rd – 4th
July 2013.
Reduction of CO2 Emission in Malaysia Transport Industry: Using
Compressed Natural Gas (CNG) as Alternative Fuel
Odeta, P., Edilan, M.M., Hossain, A., Bakar, M.A.
Faculty of Engineering, University of Malaya, 50603 Kuala Lumpur, Malaysia
Automotive Engineering Section, Universiti Kuala Lumpur Malaysia France Institute,
Bandar Baru Bangi, Selangor Darul Ehsan, Malaysia,
Abstract
Compressed Natural Gas (CNG) fuel has long been used in the Malaysia transport industry due to its
numerous advantageous properties. CNG fuel engine considered a low carbon dioxide (CO2) emission
producer presents itself a viable alternative to gasoline/ diesel fuel engines. From the literature, it is found
that the transport industry contributes 45% of CO2 emission to the environment. Therefore, this study presents
the investigation of CO2 emission in the Malaysia transport industry by using CNG as an alternative fuel.
Data has been collected from the previous research, experimental resolution and field survey which has been
used for verifying and validating the possible outcomes of CNG engine performance on CO2 reduction as well as the impact of constant increase of vehicles using CNG. In this study an elevated performance
implementation has been achieved in other gases but the target was on CO2 emissions at its minimal stage,
noting the risk involve as well as encouraging the total acceptability of the CNG fuel in the Malaysia society.
It is therefore proposed that any adjustment or improvement result in CO2 emissions reduction will save the
world environmental climate change.
Keywords: Compressed Natural Gas; CO2 emission; Environment; Transport industry.