chapter-1 introduction 1.0 general - … and farmyard manures, spent mushroom compost, ... paddy...
TRANSCRIPT
1
CHAPTER-1
INTRODUCTION
1.0 GENERAL
Waste is directly linked to human development, both technological and social. The
compositions of different wastes have varied over time and location, with industrial
development and innovation being directly linked to waste materials. Examples of this
include plastics and nuclear technology. Some waste components have economic value and
can be recycled once correctly recovered. Waste is sometimes a subjective concept, because
items that some people discard may have value to others. It is widely recognized that waste
materials can be a valuable resource, whilst there is debate as to how this value is best
realized.
Waste includes all items that people no longer have any use for, which they either
intend to get rid of or have already discarded. Additionally, wastes are such items which
people are require discarding. Many items can be considered as waste e.g., household
rubbish, sewage sludge, wastes from manufacturing activities, packaging items, discarded
cars, old televisions, garden waste, old paint containers etc. Thus all our daily activities can
give rise to a large variety of different wastes arising from different source.
Civilization also produces waste products. Disposal issue of the waste products is a
challenge. Some of these materials are not biodegradable and often leads to waste disposal
crisis and environmental pollution. The present project seeks the possibilities of whether
some of these waste products can be utilized as highway construction materials.
Traditionally soil, stone aggregates, sand, bitumen, cement etc. are used for road
construction. Natural materials being exhaustible in nature, its quantity is declining gradually.
Also, cost of extracting good quality of natural material is increasing. Concerned about this,
the scientists are looking for alternative materials for highway construction, and industrial
waste product is one such category. If these materials can be suitably utilized in highway
construction, the pollution and disposal problems may be partly reduced.

2
1.1 TYPES OF WASTES
Waste is directly linked to human development, both technological and social. The
compositions of different wastes have varied over time and location, with industrial
development and innovation being directly linked to waste materials. Examples of this
include plastics and nuclear technology. Some waste components have economic value and
can be recycled once correctly recovered.
Throughout the region, the principal sources of solid waste are residential
households and the agricultural, commercial, construction, industrial and institutional sectors.
For the purposes of this review these sources are defined as giving rise to some major
categories of waste:
� Municipal waste
� Agricultural waste
� Hazardous waste
� Commercial waste
� Sewage sludge
� Industrial waste
� Mines and quarries.
� Construction and demolition waste
1.1.1 MUNICIPAL WASTE
Municipal waste is generated from households, offices, hotels, shops, schools and
other institutions. The major components are food waste, paper, plastic, rags, metal and glass,
although demolition and construction debris is often included in collected waste, as are small
quantities of hazardous waste, such as electric light bulbs, batteries, automotive parts and
discarded medicines and chemicals.
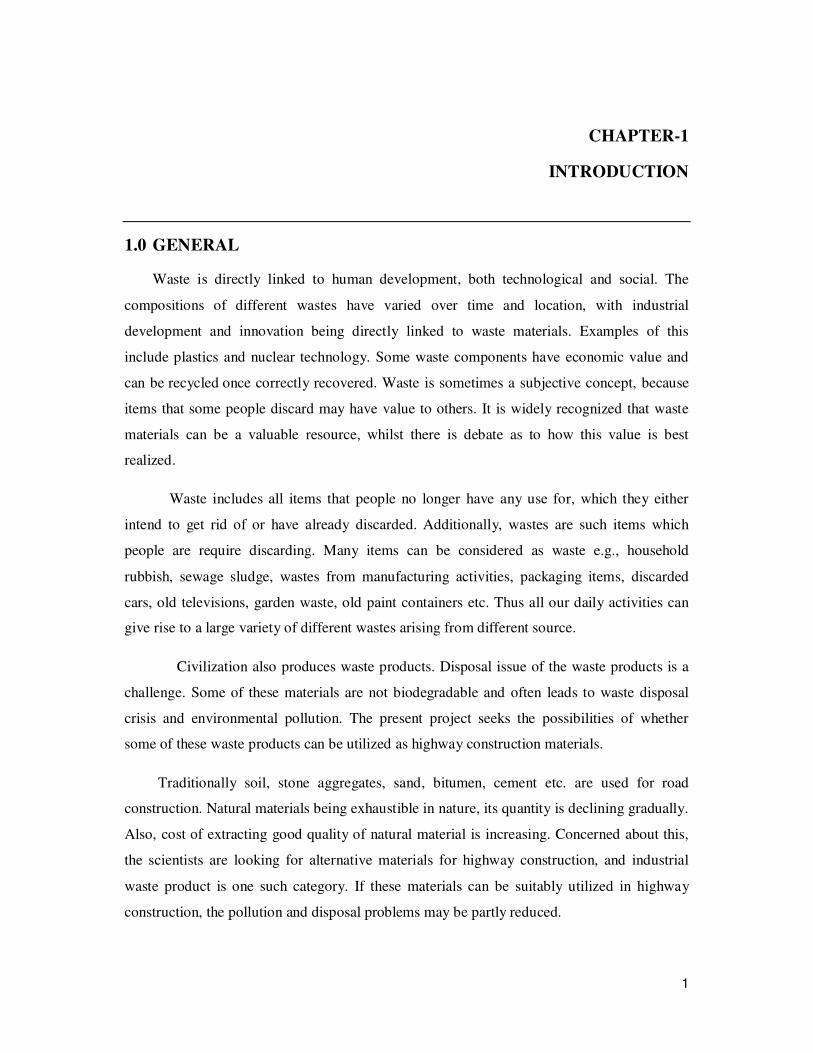
The municipal waste is heterogeneous mixture of various kinds of wastes-which are
not transported with water as sewage, and may include bio-degradable food wastes called
GARBAGE, and the non-putresible waste like paper, glass, rags etc., called RUBBISH.
3
The municipal waste is heterogeneous mixture of various kinds of wastes-which are
not transported with water as sewage, and may include bio-degradable food wastes called
GARBAGE, and the non-putresible waste like paper, glass, rags etc., called RUBBISH.
FIG 1. 1 - MUNICIPAL WASTE COMPOSITION.
1.1.2 AGRICULTURAL WASTE
Agricultural production leaves considerable amounts of agricultural waste. Some of it
is recycled into the agricultural production as fertilizer, while large amounts remain unused –
and in many instances pose a disposal problem. Uncontrolled burning in the fields is not only
a hazardous disposal solution - it is also wasting useful energy. With efficient collection
systems, waste from agricultural production can be utilized as fuel for power and heat
production.
Agricultural waste is composed of organic wastes (animal excreta in the form of
slurries and farmyard manures, spent mushroom compost, soiled water and silage effluent)
and waste such as plastic, scrap machinery, fencing, pesticides, waste oils and veterinary
medicines.
Agricultural solid waste is mainly caused due to over grazing, poor pesticide
application, irrigation water, fertilizers. Agricultural waste also comprises of animal waste,
paddy husk, straw, coir fiber and coir dust, biogases, as well as the waste from the timber
industry, which comprises sawdust, off-cuts and charcoal.
4
COMMON AGRICULTURAL WASTES INCLUDES:
� Packaging;
� Silage plastic;
� Oils;
� Net wrap;
� Batteries;
� Old fencing;
� Building waste;
� Scrap metal;
Special wastes in agricultural waste are that type of waste which has hazardous properties
and is subjected to additional controls to protect environment and human health; examples of
special wastes includes:
� Asbestos roofing materials;
� Chemical fertilizers;
� Waste oils from farm machinery;
� Infectious waste from animals;
� Electrical equipment containing cathode ray tubes;
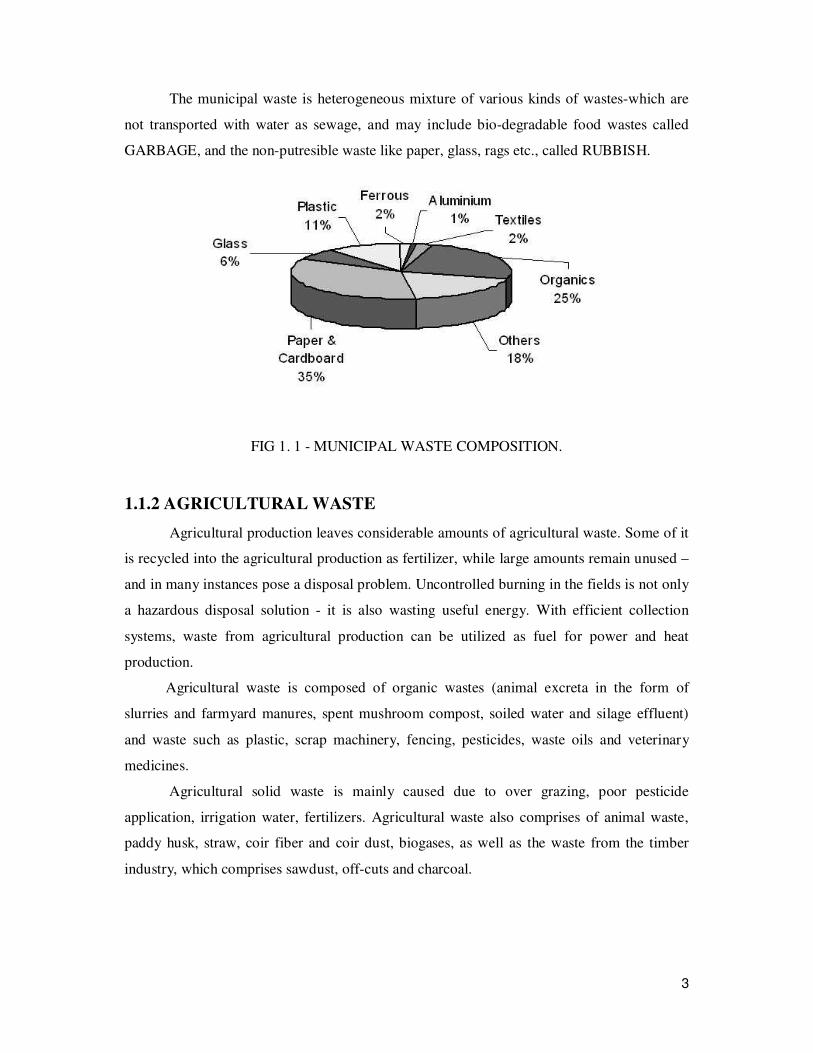
FIG 1.2-AGRICULTURAL WASTE
1.1.3 HAZARDOUS WASTE
A Hazardous waste is waste that poses substantial or potential threats to public health
or the environment. With rapid development in agriculture, industry, commerce, hospital and

5
health-care facilities, the Asian and Pacific Region is consuming significant quantities of
toxic chemicals and producing a large amount of hazardous waste. Currently, there are about
110 000 types of toxic chemicals commercially available.
These wastes may be found in different physical states such as gaseous, liquids, or
solids. A hazardous waste is a special type of waste because it cannot be disposed of by
common means like other by-products of our everyday lives. Depending on the physical state
of the waste, treatment and solidification processes might be required.
1.1.4 COMMERCIAL WASTE
Commercial waste is generated from commercial places like markets, restaurants,
shops, etc. The commercial wastes have characteristics similar to that of domestic waste
.more solid wastes are generally produced from the commercial places.
Some examples are:
� Deconstruction sites produce debris of broken buildings materials-bricks, cements,
stone, rock fragments, waste iron or other metals etc. These are generally called as
rubble other building construction materials are asbestos, plastics pipes, broken
electrical goods, insulating materials, etc.
� Market place produces food waste or garbage, rubbish and thrashes materials etc.
Broken fridges, coolers, air conditioners are generally found in market places.
FIG 1.3-COMMERCIAL WASTE

6
1.1.5 SEWAGE SLUDGE
The waste products of a society including the human excreta had been collected, carried
and deposited of manually to safe point of disposal, by the sweepers, since time immemorial.
This primitive method of collecting and disposing of the society’s wastes has now been
modernized and replaced by a system, in which these wastes are mixed with sufficient
quantity of water and carried through closed conduits under the conditions of gravity flow.
This mixture of water and waste products, popularly called as sewage.
� Domestic sewage consists of liquid waste coming from urinals, latrines, bath-rooms,
kitchens, wash basins, etc., of the residential, commercial or institutional buildings.
This sewage is generally extremely foul, because of the presence of human excreta in
it.
� Industrial sewage consists of liquid waste originating from industries, such as
dyeing, paper making, Brewing etc., the quality of sewage depends up on the type of
industry and the quantity of chemicals they are using.
FIG 1.4-SLUDGE WASTE
1.1.6 INDUSTRIAL WASTE
Industrialization has been become an important factor to the development of a
country’s economy, through the establishment of plants and industries. However, the waste or
by-products discharged from them are severely disastrous to the environment consists various
kind of contaminant which contaminate the surface water, ground water and soil. There are a

7
number of reasons the waste are not safely treated. One of the reasons is mainly due to the
lacking of highly efficient and economic treatment technology.
Environmental pollution is the major problem associated with rapid industrialization,
urbanization and rise in living standards of people. For developing countries,
industrialization was must and still this activity very much demands to build self reliant and
in uplifting nation’s economy. However, industrialization on the other hand has also caused
serious problems relating to environmental pollution. Therefore, wastes seem to be a by-
product of growth. The country like India cans ill afford to lose them as sheer waste.
On the other hand, with increasing demand for raw materials for industrial production, the
non-renewable resources are dwindling day-by-day. Therefore, efforts are to be made for
controlling pollution arising out of the disposal of wastes by conversion of these unwanted
wastes into utilizable raw materials for various beneficial uses.
FIG 1.5-INDUSTRIAL WASTE PROPORTIONS
1.1.7 MINES AND QUARRIES
Waste from extractive operations (i.e. waste from extraction and processing of
mineral resources) is one of the largest waste streams. It involves materials that must be
removed to gain access to the mineral resource, such as topsoil, overburden and waste rock,
as well as tailings remaining after minerals have been largely extracted from the ore.
Some of these wastes are inert and hence not likely to represent a significant pollutant
threat to the environment save for smothering of river beds and possible collapse if stored in
large quantities. However, other fractions, in particular those generated by the non-

8
Ferrous metal mining industry may contain large quantities of dangerous substances, such as
heavy metals.
These impacts can have lasting environmental and socio-economic consequences and
be extremely difficult and costly to address through remedial measures. Wastes from the
extractive industries have therefore to be properly managed in order to ensure in particular
the long-term stability of disposal facilities and to prevent or minimize any water and soil
pollution arising from acid or alkaline drainage and leaching of heavy metals.
FIG 1.6-MINES AND QUARRIES WASTE
1.1.8 CONSTRUCTION & DEMOLITION
Construction and demolition waste is generated whenever any
construction/demolition activity takes place, such as, building roads, bridges; fly over,
subway, remodeling etc. It consists mostly of inert and non-bio degradable material such as
concrete, plaster, metal, wood, plastics etc. A part of this waste comes to the municipal
stream.
It is estimated that the construction industry in India generates about 10-12 million
tons of waste annually. Projections for building material requirement of the housing sector
indicate a shortage of aggregates to the extent of about 55, 000 million cu.m. An additional
750 million cu.m. Aggregates would be required for achieving the targets of the road sector.
Recycling of aggregate material from construction and demolition waste may reduce the
demand-supply gap in both these sectors.
9
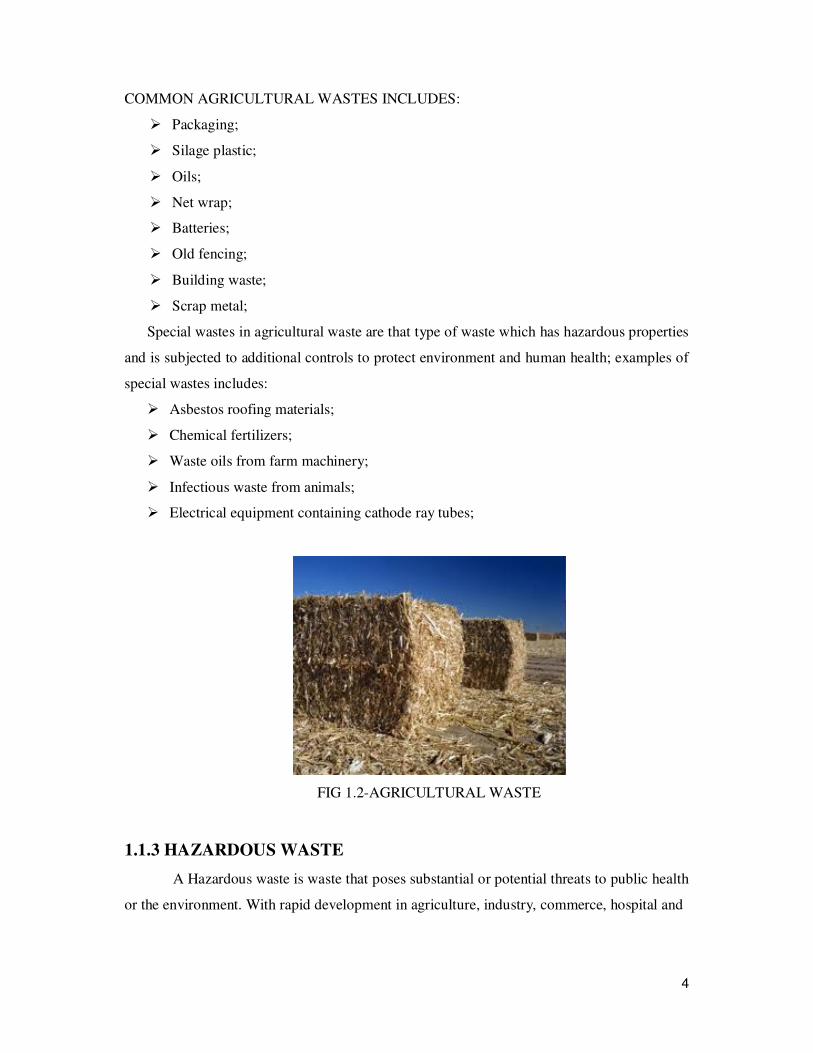
FIG 1.7 CONSTRUCTION AND DEMOLITION WASTE.
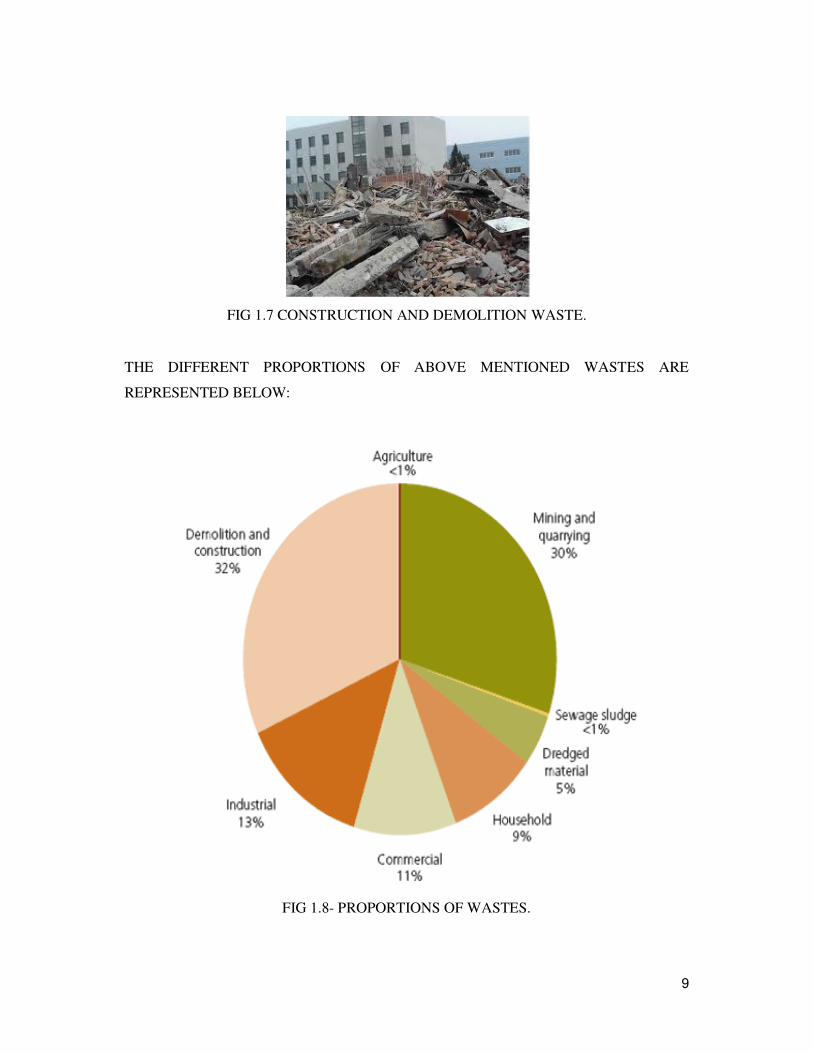
THE DIFFERENT PROPORTIONS OF ABOVE MENTIONED WASTES ARE
REPRESENTED BELOW:
FIG 1.8- PROPORTIONS OF WASTES.

10
CHAPTER-2
INDUSTRIAL WASTE
------------------------------------------------------------------------------------------------
2.0 WHAT IS INDUSTRIAL WASTE?
Waste which is produced from industries is known as industrial wastes. These wastes
are highly toxic and have great effect and environment. Some of the largest waste generating
industrial sectors in includes the production of basic metals, food, beverage and tobacco
products, wood and wood products and paper and paper products.
2.1 TYPES OF INDUSTRIAL WASTE
There are three main types of industrial waste. They are as follows:
� Solid waste
� Liquid waste
� Gaseous waste
2.2 INDUSTRIAL LIQUID WASTE
In the developing countries, many industrial units of different types are being
installed. These units generate liquid waste containing many containing many contaminants
which cannot be treated by conventional unit operations and processes.
Industrial liquid waste is as varied in quantity and polluting strength as the products and
processes and the manufacturing plants generating them. However, all the liquid waste cannot
be effectively managed by land disposal. Some of the wastes for which land disposal is
favourable are from food processing industries such as cannery, dairy, sugar mill, breweries
and distilleries and beverage units.
Some of the industrial liquid wastes are as follows:
� Citric acid;
� Ethyl acetate;
� Nitric acid;
� Slurry acid;

11
2.3 INDUSTRIAL GASEOUS WASTE
Industrial gaseous wastes are the waste gases which are released from many
industries during manufacturing processes. These gases have great impact on the environment
and are very harmful to living organisms. Some gases can be recycled and the effect of that
particular gas on environment can be reduced to some extent.
Some of the gases comply released from industries are as follows:
� Carbon dioxide;
� Methane;
� Nitrous oxide;
� Sulphur dioxide;
� Carbon monoxide;
2.4 INDUSTRIAL SOLID WASTE
The major generators of industrial solid wastes are the thermal power plants
producing coal ash, the integrated Iron and Steel mills producing blast furnace slag and steel
melting slag, non-ferrous industries like aluminum, zinc and copper producing red mud and
Tailings, sugar industries generating press mud, pulp and paper industries producing lime
and fertilizer and allied industries producing gypsum.
TABLE 2.1- SOURCE AND QUANTITY OF GENERATION OF SOME INDUSTRIAL
SOLID WASTE.
S.NO
NAME
QUANTITY(millions
Tones per annum)
SOURCE
1 Steel and blast
furnance
35 Conversion of pig iron to
steel and manufacture of iron
2 Brine mud 0.02 Caustic soda industry
3 Copper slag 0.0164 By-product from smelting of
copper
4 fly ash 70 Coal based thermal power
plants
5 Kiln dust 1.6 Cement plants
6 lime sludge 3 Sugar, paper, fertilizer
tanneries, soda ash, calcium
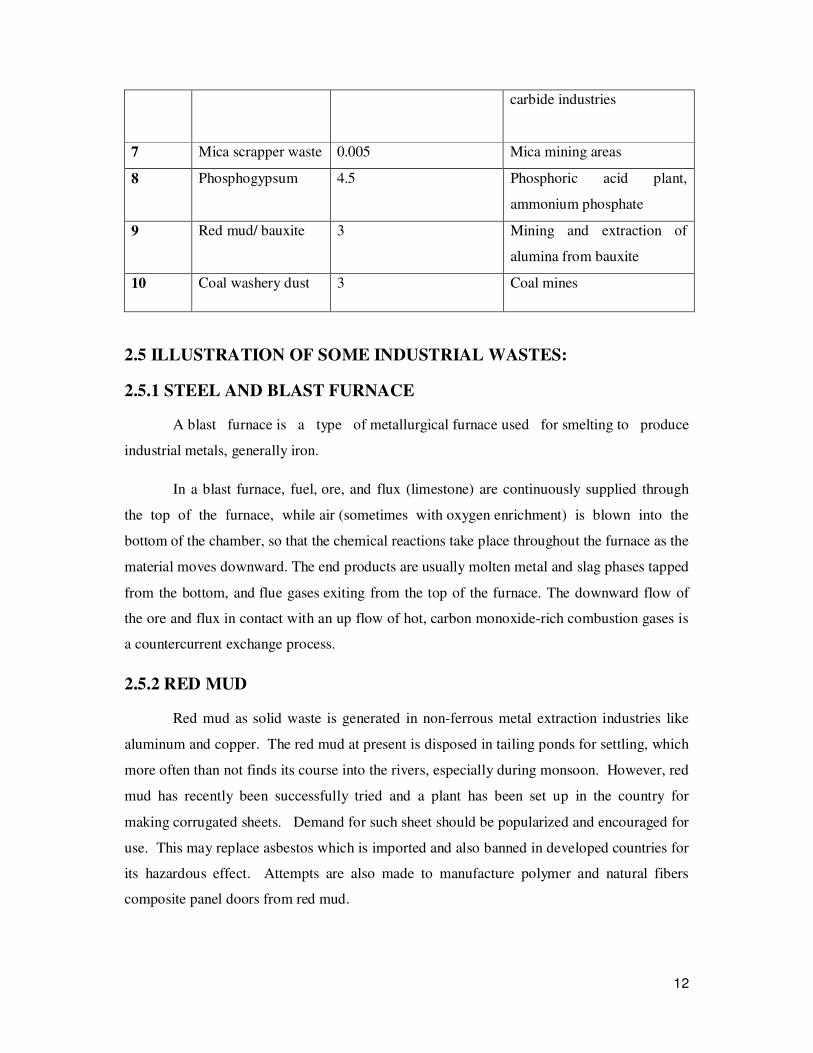
12
carbide industries
7 Mica scrapper waste 0.005 Mica mining areas
8 Phosphogypsum 4.5 Phosphoric acid plant,
ammonium phosphate
9 Red mud/ bauxite 3 Mining and extraction of
alumina from bauxite
10 Coal washery dust 3
Coal mines
2.5 ILLUSTRATION OF SOME INDUSTRIAL WASTES:
2.5.1 STEEL AND BLAST FURNACE
A blast furnace is a type of metallurgical furnace used for smelting to produce
industrial metals, generally iron.
In a blast furnace, fuel, ore, and flux (limestone) are continuously supplied through
the top of the furnace, while air (sometimes with oxygen enrichment) is blown into the
bottom of the chamber, so that the chemical reactions take place throughout the furnace as the
material moves downward. The end products are usually molten metal and slag phases tapped
from the bottom, and flue gases exiting from the top of the furnace. The downward flow of
the ore and flux in contact with an up flow of hot, carbon monoxide-rich combustion gases is
a countercurrent exchange process.
2.5.2 RED MUD
Red mud as solid waste is generated in non-ferrous metal extraction industries like
aluminum and copper. The red mud at present is disposed in tailing ponds for settling, which
more often than not finds its course into the rivers, especially during monsoon. However, red
mud has recently been successfully tried and a plant has been set up in the country for
making corrugated sheets. Demand for such sheet should be popularized and encouraged for
use. This may replace asbestos which is imported and also banned in developed countries for
its hazardous effect. Attempts are also made to manufacture polymer and natural fibers
composite panel doors from red mud.
13
2.5.3 PHOSPHOGYPSUM
Phosphogypsum is the waste generated from the phosphoric acid, ammonium
phosphate and hydrofluoric acid plants. This is very useful as a building material. At present
very little attention has been paid to its utilization in making cement, gypsum board, partition
panel, ceiling tiles, artificial marble, fiber boards etc.
2.5.4 COAL ASH
In general, a 1,000 MW station using coal of 3,500 kilo calories per kg and ash
content in the range of 40-50 per cent would need about 500 hectares for disposal of fly ash
for about 30 years’ operation. It is, therefore, necessary that fly ash should be utilized
wherever possible to minimize environmental degradation. The thermal power plant should
take into account the capital and operation/maintenance cost of fly ash disposal system as
well as the associated environmental protection cost, vis-a-vis dry system of collection and its
utilization by the thermal power plant or other industry, in evaluating the feasibility of such
system.
The research and development carried out in India for utilization of fly ash for
making building materials has proved that fly ash can be successfully utilized for production
of bricks, cement and other building materials. Indigenous technology for construction of
building materials utilizing fly ash is available and is being practiced in a few industries.
However, large scale utilization is yet to take off.
Even if the full potential of fly ash utilization through manufacture of fly ash bricks
74 and blocks is explored, the quantity of fly ash produced by the thermal power plants are
so huge that major portion of it will still remain unutilized. Hence, there is a need to evolve
strategies and plans for safe and environmentally sound method of disposal.
2.5.5 LIME MUD
Lime sludge, also known as lime mud, is generated in pulp & paper mills which are
not recovered for reclamation of calcium oxide for use except in the large mills. The lime
mud disposal by dumping into low-lying areas or into water courses directly or as run-off
during monsoon is not only creating serious pollution problem but also wasting the valuable
14
non- renewable resources. The reasons for not reclaiming the calcium oxide in the sludge
after recalcination is that it contains high 75 amount of silica. Although a few technologies
have been developed to desilicate black liquor before burning, none of the mills in the
country are adoption desilication technology.
2.6 APPLICATIONS OF INDUSTRIAL WASTE
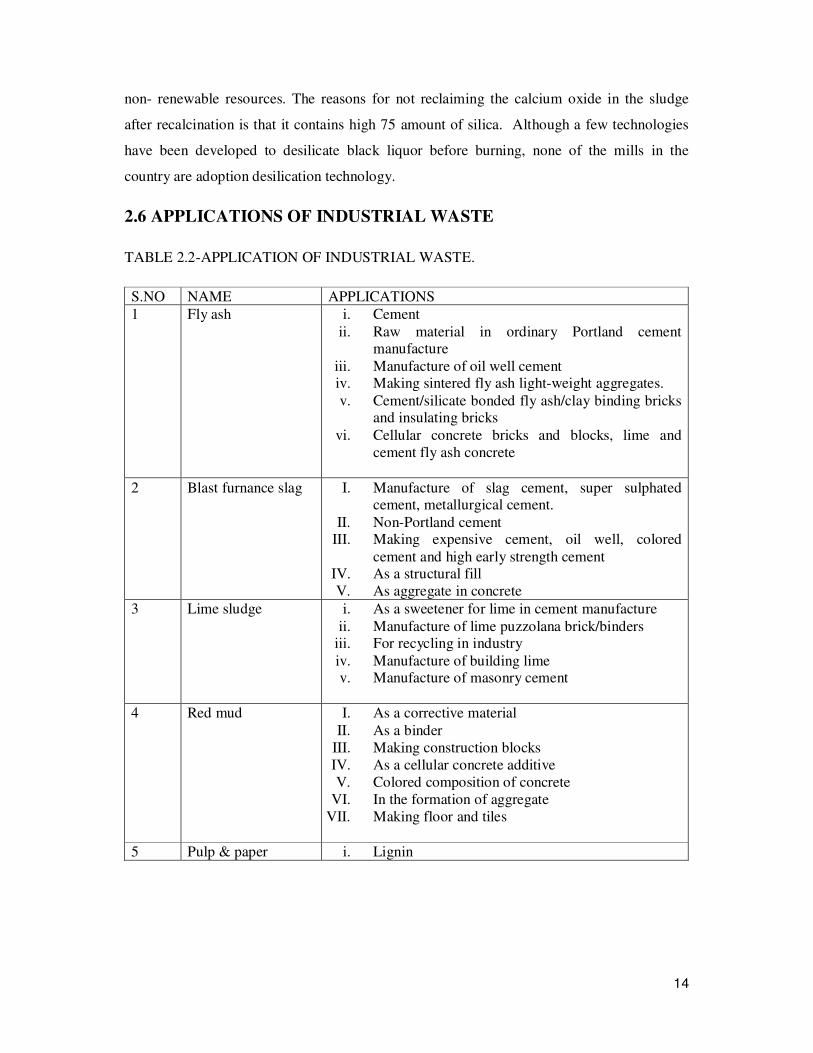
TABLE 2.2-APPLICATION OF INDUSTRIAL WASTE.
S.NO NAME APPLICATIONS
1 Fly ash i. Cement
ii. Raw material in ordinary Portland cement manufacture
iii. Manufacture of oil well cement iv. Making sintered fly ash light-weight aggregates.
v. Cement/silicate bonded fly ash/clay binding bricks and insulating bricks
vi. Cellular concrete bricks and blocks, lime and
cement fly ash concrete
2
Blast furnance slag I. Manufacture of slag cement, super sulphated cement, metallurgical cement.
II. Non-Portland cement III. Making expensive cement, oil well, colored
cement and high early strength cement IV. As a structural fill
V. As aggregate in concrete
3 Lime sludge i. As a sweetener for lime in cement manufacture
ii. Manufacture of lime puzzolana brick/binders iii. For recycling in industry
iv. Manufacture of building lime v. Manufacture of masonry cement
4 Red mud I. As a corrective material
II. As a binder
III. Making construction blocks
IV. As a cellular concrete additive
V. Colored composition of concrete
VI. In the formation of aggregate
VII. Making floor and tiles
5 Pulp & paper i. Lignin

15
2.7 HEALTH CONSEQUENCES DUE TO SOME INDUSTRIAL SOLID
WASTE
The solid waste generated from industrial sources contains a large number of
chemicals, some of which are toxic. The waste is considered toxic, if the concentration of the
ingredients exceeds a specified value. Although the levels of some ingredients may
occasionally exceed the permissible level, the waste as such is considered to be toxic only if
the average value of ingredients exceeds the toxicity level. Various criteria and tests have
been devised by different agencies to determine the toxicity of a given substance. It is
necessary to know the properties of the waste so as to assess whether its uncontrolled release
to the environment would lead to toxic effects on humans or other living organism in
ecosystem.
This evaluation is carried out using criteria such as toxicity, phytotoxicity, genetic
activity and bio-concentration. The potential toxic effects also depend on quantity of the
toxic constituents. Substances are classified as hazardous or otherwise depending on the
dose, exposure, and duration of exposure. For a chemical to affect human health it must
come in contact with or enter the human body. There are several ways in which this can
happen.
2.7.1 SKIN CONTACT
Chemicals that cause dermatitis usually do so through direct contact with skin. Some
chemicals like corrosive acids can damage the skin by a single contact while others, like
organic solvent, may cause damage by repeated exposure.
2.7.2 INHALATION
Inhalation is the most common source of workplace exposure to chemicals and the
most difficult to control. Air pollutants can directly damage respiratory tract or gets absorbed
through lung and cause system/systemic effects. An adult male will breathe about 10 cubic
meters of air during a normal working day.

16
2.7.3 INGESTION
Ground water and sub soil water contamination from leachates from refuse dumps and
poorly managed landfill sites can result in ingestion of toxic chemicals by population groups
who live far away from the factory sites and decades after the garbage has been dumped.
A waste from slaughter house is potentially infectious. All precautions to ensure that
potential pathogens to not gain a foot hold in the workers in the slaughter house and in the
general population, have to be taken during collection, storage and disposal of the slaughter
house waste.
Wastes from non hazardous industries can at times produce health problems, not only
among the workers and handlers of waste, but also among general population. One example
of this category is the cotton dust. Cotton waste are generally non hazardous; however they
may, in susceptible individuals provoke respiratory allergic reactions; allergy may be due to
inhalation of dust containing cotton wastes or fungus or other contaminants in the waste dust.
17
CHAPTER-3
COPPER SLAG
------------------------------------------------------------------------------------------------
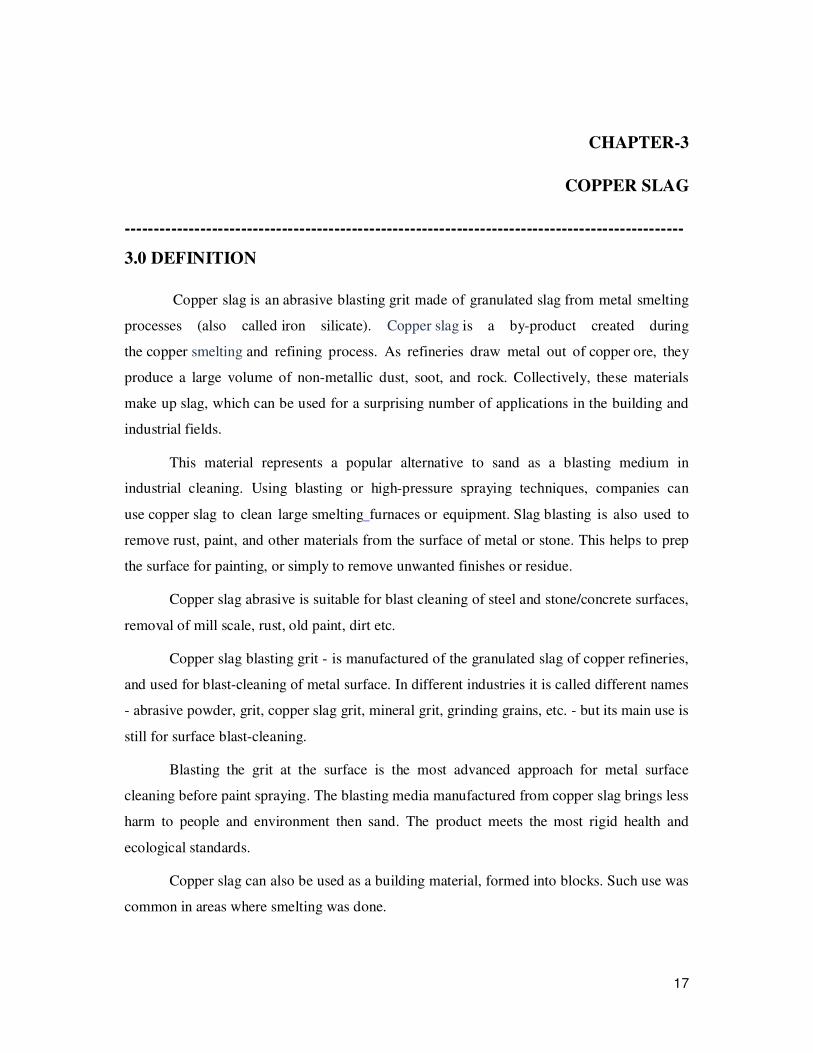
3.0 DEFINITION
Copper slag is an abrasive blasting grit made of granulated slag from metal smelting
processes (also called iron silicate). Copper slag is a by-product created during
the copper smelting and refining process. As refineries draw metal out of copper ore, they
produce a large volume of non-metallic dust, soot, and rock. Collectively, these materials
make up slag, which can be used for a surprising number of applications in the building and
industrial fields.
This material represents a popular alternative to sand as a blasting medium in
industrial cleaning. Using blasting or high-pressure spraying techniques, companies can
use copper slag to clean large smelting furnaces or equipment. Slag blasting is also used to
remove rust, paint, and other materials from the surface of metal or stone. This helps to prep
the surface for painting, or simply to remove unwanted finishes or residue.
Copper slag abrasive is suitable for blast cleaning of steel and stone/concrete surfaces,
removal of mill scale, rust, old paint, dirt etc.
Copper slag blasting grit - is manufactured of the granulated slag of copper refineries,
and used for blast-cleaning of metal surface. In different industries it is called different names
- abrasive powder, grit, copper slag grit, mineral grit, grinding grains, etc. - but its main use is
still for surface blast-cleaning.
Blasting the grit at the surface is the most advanced approach for metal surface
cleaning before paint spraying. The blasting media manufactured from copper slag brings less
harm to people and environment then sand. The product meets the most rigid health and
ecological standards.
Copper slag can also be used as a building material, formed into blocks. Such use was
common in areas where smelting was done.

18
Due to its high strength/ weight ratio copper slag is used as filling materials in
construction works. Copper slag can be used as a best alternative to sand.
Copper slag has also gained popularity in the building industry for use as a fill
material. Unlike many other fill materials, copper slag poses relatively little threat to the
environment. This means it can be used to build up the earth to support roads, buildings, or
other surfaces.
Contractors may also use copper slag in place of sand during concrete construction.
The slag serves as a fine, or binding agent, which helps hold the larger gravel particles within
the concrete together. When used in this manner, the slag helps to improve the properties of
the concrete, and also serves as a form of recycling.
One of the primary advantages to copper slag is the low risk it poses to health and the
environment. Silica sand, which represents the most popular blasting medium and concrete
fine currently in use, poses serious health risks when inhaled. It may also contribute to
pollution and other environmental concerns.
Copper slag also has a high strength-to-weight ratio, making it an effective option in
concrete, or as a fill material under the roadway. When added to concrete, it makes the paved
surface less porous, which minimizes problems with moisture and freezing. It also makes
concrete more fire resistant, and helps to slow the spread of heat and flames.
This material also has several limitations that users should be aware of before
using copper slag. Some versions may contain heavy metal traces, which can contribute to air
and water pollution. It's commonly classified as hazardous waste due to this risk. Another
issue to consider is the Shear volume of slag produced during copper refining. Typically,
refineries end up with two units of slag for every one unit of copper produced during
smelting.
19
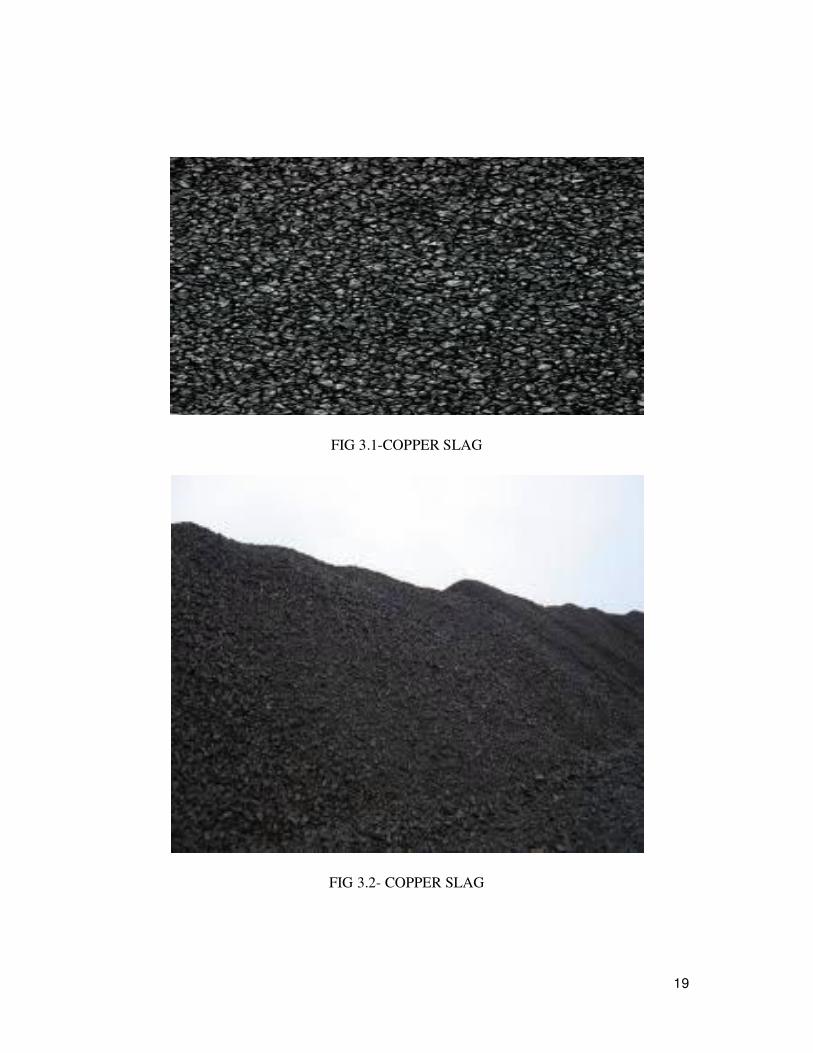
FIG 3.1-COPPER SLAG
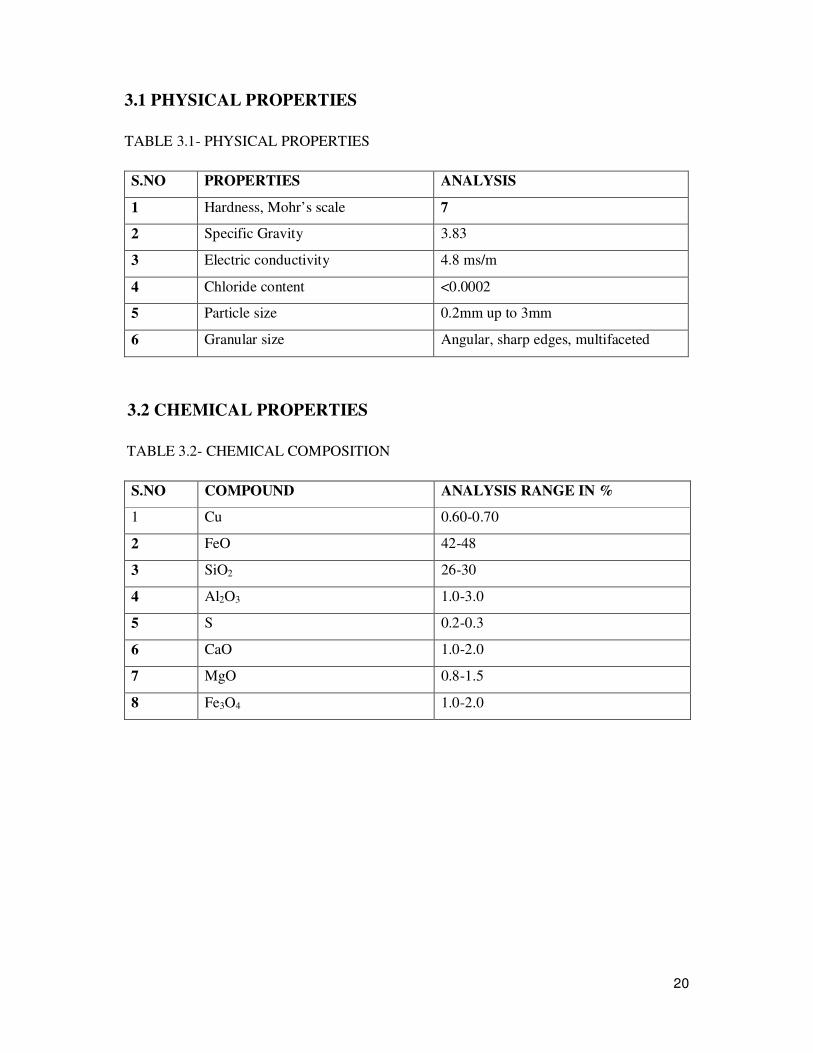
FIG 3.2- COPPER SLAG
20
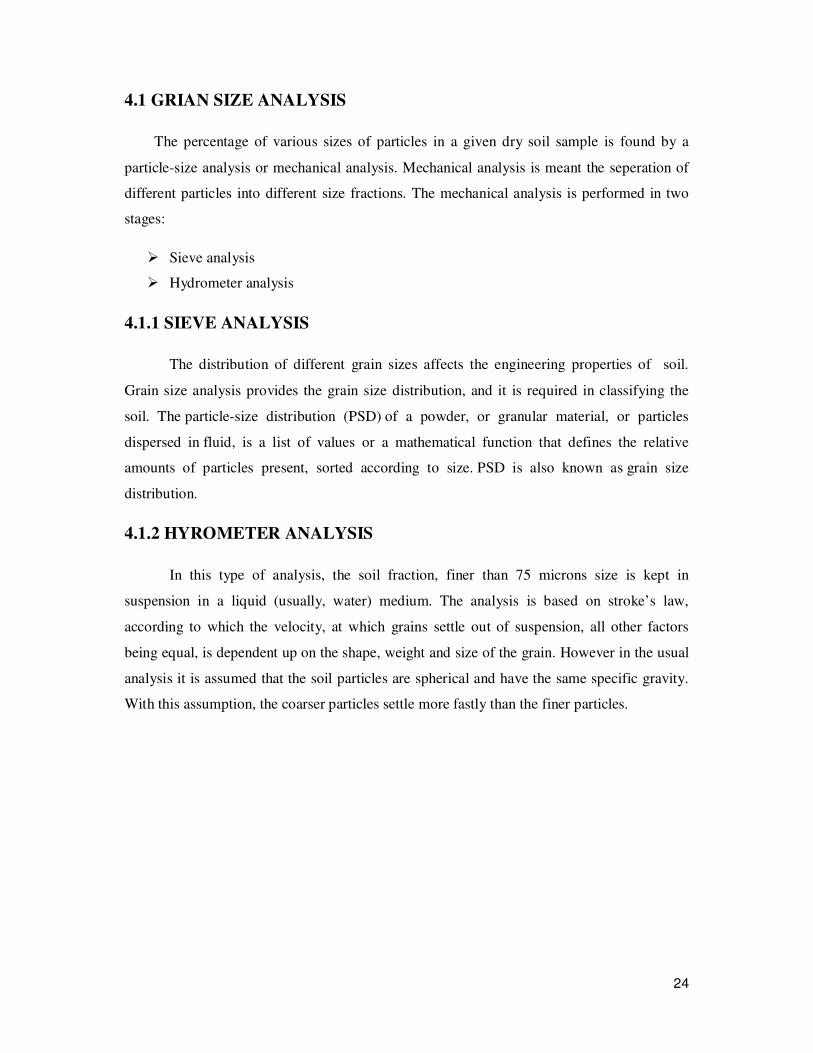
3.1 PHYSICAL PROPERTIES
TABLE 3.1- PHYSICAL PROPERTIES
S.NO PROPERTIES ANALYSIS
1 Hardness, Mohr’s scale 7
2 Specific Gravity 3.83
3 Electric conductivity 4.8 ms/m
4 Chloride content <0.0002
5 Particle size 0.2mm up to 3mm
6 Granular size Angular, sharp edges, multifaceted
3.2 CHEMICAL PROPERTIES
TABLE 3.2- CHEMICAL COMPOSITION
S.NO COMPOUND ANALYSIS RANGE IN %
1 Cu 0.60-0.70
2 FeO 42-48
3 SiO2 26-30
4 Al2O3 1.0-3.0
5 S 0.2-0.3
6 CaO 1.0-2.0
7 MgO 0.8-1.5
8 Fe3O4 1.0-2.0

21
3.3 UTILIZATION OF COPPER SLAG
3.3.1 AS FINE AGGREGATE IN CEMENT CONCRETE
Copper slag is produced as a byproduct of metallurgical operations in reverberatory
furnaces. It is totally inert material and its physical properties are similar to natural sand. A
laboratory study was carried out in the Institute to investigate the potential of using copper
slag as a partial replacement of sand in cement concrete. Slag was used in Pavement Quality
Concrete (PQC) as well as in Dry Lean Concrete (DLC) mixes and its influence on
workability, compressive strength, and flexural strength was determined. The study
conducted shows that use of copper slag in concrete have no adverse effect on its strength
(Fig.) and a blend of copper slag and fine sand with slag up to 40 percent can be used as fine
aggregate in pavement quality concrete as well as in dry lean concrete.
3.3.2 APPLICATION OF COPPER SLAG AS A SAND COMPACTION
PILE
Sand compaction pile method is a soil improvement method that a sand charge is
introduced into the pipe, and the pipe is withdrawn part away while the sand pile is
compacted and its diameter is enlarged. This aims at increasing density, horizontal resistance
and preventing the liquefaction in the sandy soils.
It is used to increase shear strength and bearing capacity, and control the side
displacement and the consolidation settlement by forming composite grounds consisted of
original soils and compaction piles. The sand used in this method should be of good quality
to be adequate for the construction criteria.
Although, in Korea, crushed stones and washed sea sands are used in sand
compaction pile method, but the use of these materials is restricted because of deficiencies of
supply and environmental problems. About 0.7 million ton of copper slag is annually
produced in the copper smelting process in Korea. Due to its suitable grain size that is ranged
from 0.15mm to 5mm, copper slag can be substituted for sand of SCP, and especially its
higher specific gravity is a notable feature. Copper slag is hyaline and so environmentally
stable that in foreign country, such as Japan, Germany and etc., it is widely used in harbor,
revetment and offshore structure construction works [Smelting Technology Research, 2000;

22
3.3.3 USED IN LOW COST BITUMOUS RAODS
Solid waste management has become a major environmental issue in India, which
seeks to minimize the health, environmental and aesthetic impacts of solid waste. Disposal of
many million tons of non-decaying plastics waste and copper slag (CS) is responsible for
health hazards and degradation of environment. The use of waste plastics and copper slag, in
hot bituminous mixes to enhance the pavement performance, to protect the environment and
to provide low cost roads is the need of hour. The physical properties of waste plastic
modified bitumen (WPMB) were tested and found within specified limits as per IS: 15462-
2004. Using 60/70 and 80/100 bitumen, waste plastic modified bitumen was prepared in
laboratory and Delhi quartzite aggregate, stone dust, lime and copper slag (10, 15 and 20 %)
were mixed to prepare Marshall Specimens. The Marshall specimens were tested for density,
stability, flow, retained stability and indirect tensile strength. 15 % copper slag showed the
best in three variables.
3.3.4 LIST OF APPLICATIONS
Copper slag historically has been utilized in a variety of ways. Though most copper
processing facilities currently recycle or dispose of their slag, there are numerous
opportunities for utilization. The application that could potentially use the largest quantities
of copper slag is use as a highway construction aggregate. Copper slag has also been utilized
for construction purposes in the past, but all facilities currently generating dispose of them.
Potential uses include:
� Copper slag has been used experimentally in bituminous wearing surfaces and as a
seal coat aggregate in highway construction.
� Portland cement replacement material.
� Road cindering
� High way embankment material
� Granules for roof shingles.
� Railroad ballast.
� Mineral wool insulation.
� Abrasive blasting grits for paint removal

23
CHAPTER-4
GEO-TECHNICAL PROPERTIES
------------------------------------------------------------------------------------------------
4.0 INTRODUCTION
Geotechnical engineering is the branch of civil engineering concerned with the
engineering behavior of earth materials. Geotechnical engineering is important in civil
engineering, but is also used by military, mining, petroleum, or any other engineering
concerned with construction on or in the ground. Geotechnical engineering uses principles
of soil mechanics and rock mechanics to investigate subsurface conditions and materials;
determine the relevant physical/mechanical and chemical properties of these materials;
evaluate stability of natural slopes and man-made soil deposits; assess risks posed by site
conditions; design earthworks and structure foundations; and monitor site conditions,
earthwork and foundation construction.
List of geo-technical properties:
� Grain size analysis
� Permeability
� Compressive strength
� M.D.D & O.M.C
� Swelling index
� Shrinkage
� Plastic limit
� Liquid limit
� Cohesion and internal friction
24
4.1 GRIAN SIZE ANALYSIS
The percentage of various sizes of particles in a given dry soil sample is found by a
particle-size analysis or mechanical analysis. Mechanical analysis is meant the seperation of
different particles into different size fractions. The mechanical analysis is performed in two
stages:
� Sieve analysis
� Hydrometer analysis
4.1.1 SIEVE ANALYSIS
The distribution of different grain sizes affects the engineering properties of soil.
Grain size analysis provides the grain size distribution, and it is required in classifying the
soil. The particle-size distribution (PSD) of a powder, or granular material, or particles
dispersed in fluid, is a list of values or a mathematical function that defines the relative
amounts of particles present, sorted according to size. PSD is also known as grain size
distribution.
4.1.2 HYROMETER ANALYSIS
In this type of analysis, the soil fraction, finer than 75 microns size is kept in
suspension in a liquid (usually, water) medium. The analysis is based on stroke’s law,
according to which the velocity, at which grains settle out of suspension, all other factors
being equal, is dependent up on the shape, weight and size of the grain. However in the usual
analysis it is assumed that the soil particles are spherical and have the same specific gravity.
With this assumption, the coarser particles settle more fastly than the finer particles.

25
FIG 4.1-PROCEDURE OF SIEVE ANALYSIS.

26
FIG 4.2- HYDROMETER ANALYSIS.
27
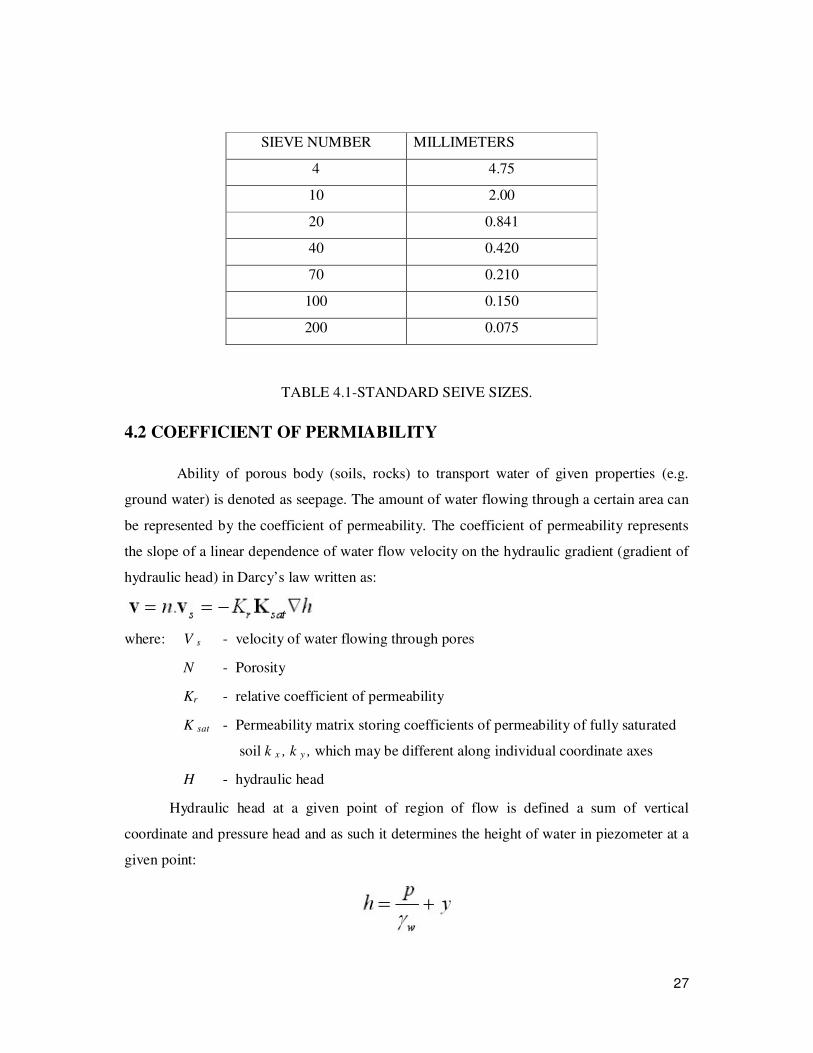
SIEVE NUMBER MILLIMETERS
4 4.75
10 2.00
20 0.841
40 0.420
70 0.210
100 0.150
200 0.075
TABLE 4.1-STANDARD SEIVE SIZES.
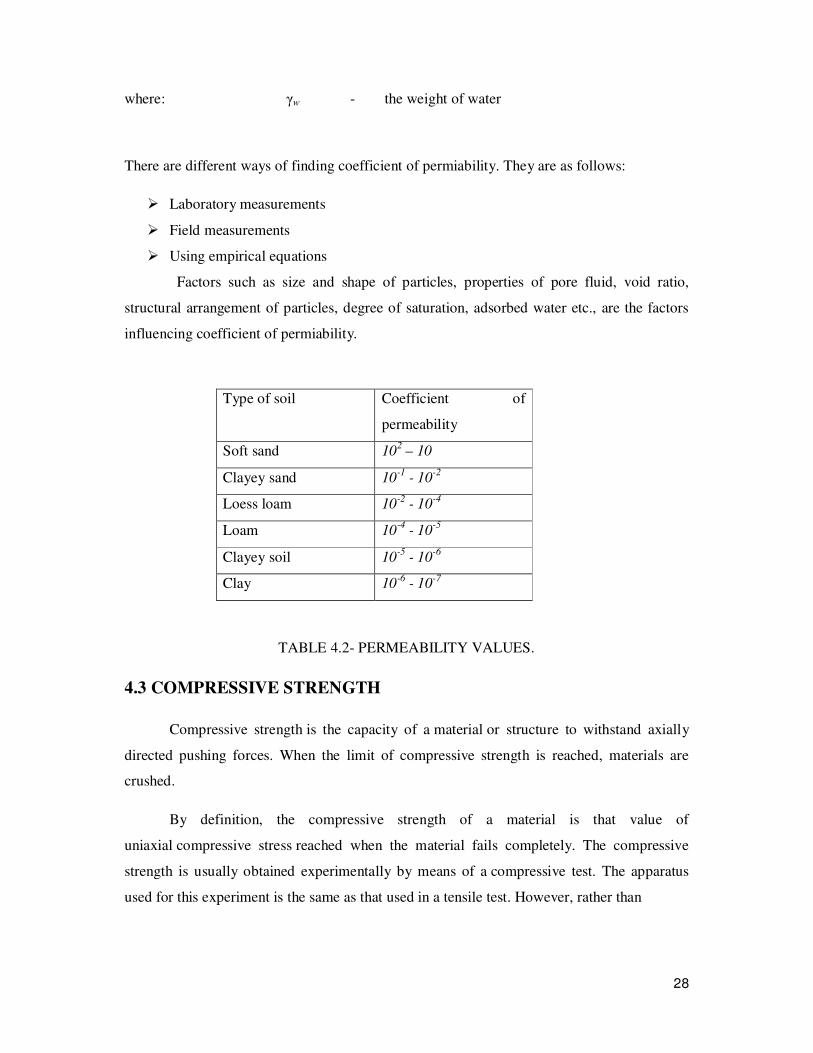
4.2 COEFFICIENT OF PERMIABILITY
Ability of porous body (soils, rocks) to transport water of given properties (e.g.
ground water) is denoted as seepage. The amount of water flowing through a certain area can
be represented by the coefficient of permeability. The coefficient of permeability represents
the slope of a linear dependence of water flow velocity on the hydraulic gradient (gradient of
hydraulic head) in Darcy’s law written as:
where: V s - velocity of water flowing through pores
N - Porosity
Kr - relative coefficient of permeability
K sat - Permeability matrix storing coefficients of permeability of fully saturated
soil k x , k y , which may be different along individual coordinate axes
H - hydraulic head
Hydraulic head at a given point of region of flow is defined a sum of vertical
coordinate and pressure head and as such it determines the height of water in piezometer at a
given point:
28
where: γw - the weight of water
There are different ways of finding coefficient of permiability. They are as follows:
� Laboratory measurements
� Field measurements
� Using empirical equations
Factors such as size and shape of particles, properties of pore fluid, void ratio,
structural arrangement of particles, degree of saturation, adsorbed water etc., are the factors
influencing coefficient of permiability.
Type of soil Coefficient of
permeability
Soft sand 102 – 10
Clayey sand 10-1
- 10-2
Loess loam 10-2
- 10-4
Loam 10-4
- 10-5
Clayey soil 10-5
- 10-6
Clay 10-6
- 10-7
TABLE 4.2- PERMEABILITY VALUES.
4.3 COMPRESSIVE STRENGTH
Compressive strength is the capacity of a material or structure to withstand axially
directed pushing forces. When the limit of compressive strength is reached, materials are
crushed.
By definition, the compressive strength of a material is that value of
uniaxial compressive stress reached when the material fails completely. The compressive
strength is usually obtained experimentally by means of a compressive test. The apparatus
used for this experiment is the same as that used in a tensile test. However, rather than
29
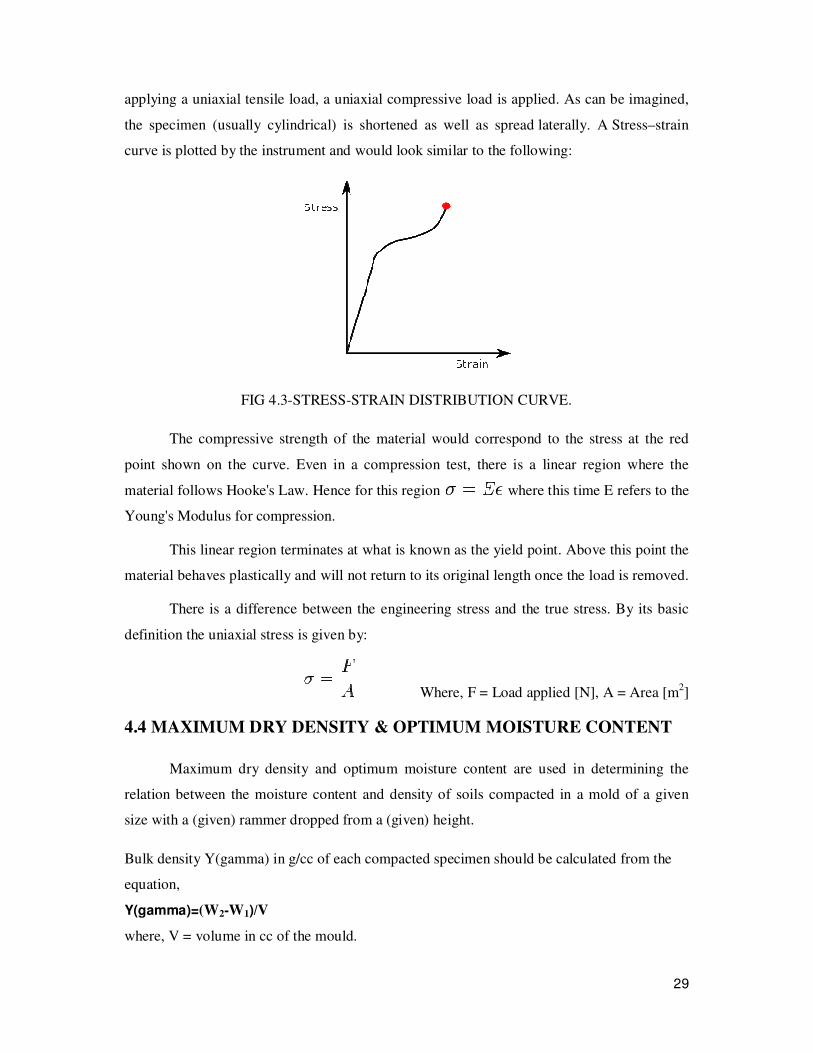
applying a uniaxial tensile load, a uniaxial compressive load is applied. As can be imagined,
the specimen (usually cylindrical) is shortened as well as spread laterally. A Stress–strain
curve is plotted by the instrument and would look similar to the following:
FIG 4.3-STRESS-STRAIN DISTRIBUTION CURVE.
The compressive strength of the material would correspond to the stress at the red
point shown on the curve. Even in a compression test, there is a linear region where the
material follows Hooke's Law. Hence for this region where this time E refers to the
Young's Modulus for compression.
This linear region terminates at what is known as the yield point. Above this point the
material behaves plastically and will not return to its original length once the load is removed.
There is a difference between the engineering stress and the true stress. By its basic
definition the uniaxial stress is given by:
Where, F = Load applied [N], A = Area [m2]
4.4 MAXIMUM DRY DENSITY & OPTIMUM MOISTURE CONTENT
Maximum dry density and optimum moisture content are used in determining the
relation between the moisture content and density of soils compacted in a mold of a given
size with a (given) rammer dropped from a (given) height.
Bulk density Y(gamma) in g/cc of each compacted specimen should be calculated from the
equation,
Y(gamma)=(W2-W1)/V
where, V = volume in cc of the mould.
30
W2=weight of compacted material with would
W1= weight of empty mould
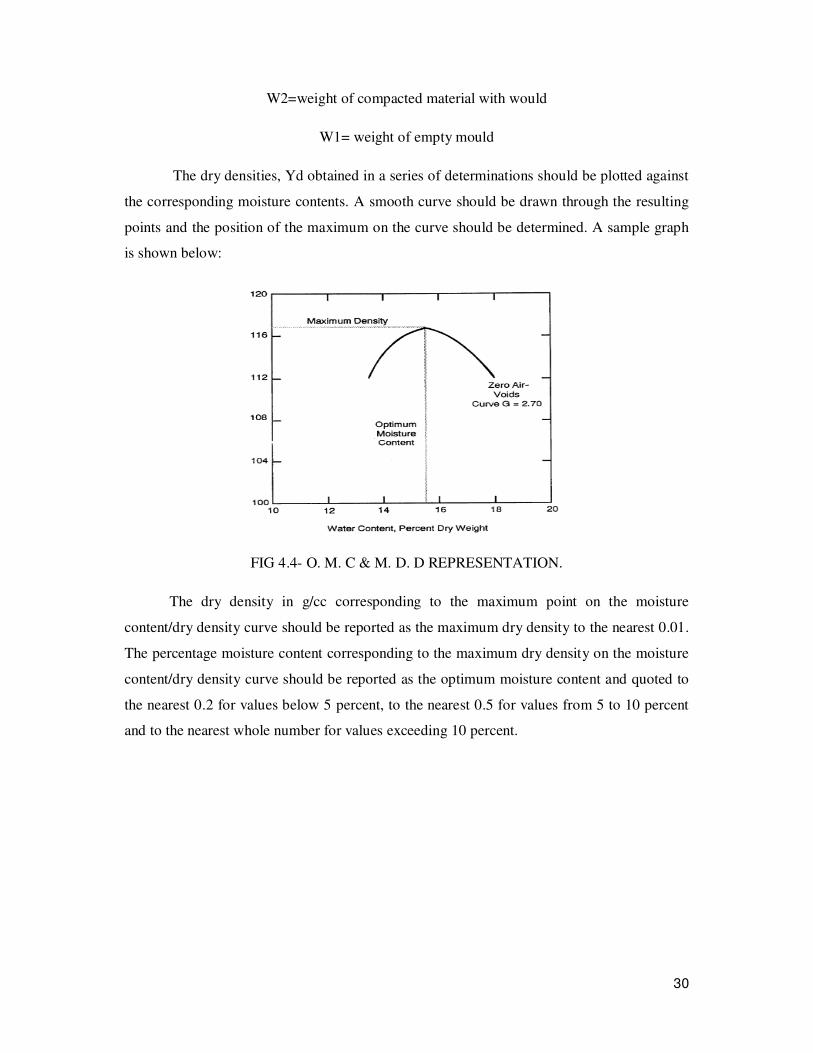
The dry densities, Yd obtained in a series of determinations should be plotted against
the corresponding moisture contents. A smooth curve should be drawn through the resulting
points and the position of the maximum on the curve should be determined. A sample graph
is shown below:
FIG 4.4- O. M. C & M. D. D REPRESENTATION.
The dry density in g/cc corresponding to the maximum point on the moisture
content/dry density curve should be reported as the maximum dry density to the nearest 0.01.
The percentage moisture content corresponding to the maximum dry density on the moisture
content/dry density curve should be reported as the optimum moisture content and quoted to
the nearest 0.2 for values below 5 percent, to the nearest 0.5 for values from 5 to 10 percent
and to the nearest whole number for values exceeding 10 percent.

31
4.5 SWELLING INDEX
Free Swell Index is the increase in volume of a soil, without any external constraints,
on submergence in water.
FIG 4.5- SWELLING INDEX.
Free Swell Index, (%) = ((Vd-Vk)/Vk) x 100
Vd = Volume of the soil specimen read from the graduated cylinder containing distilled
water.
Vk = Volume of the soil specimen read from the graduated cylinder containing kerosene.
4.6 PLASTIC LIMIT
The Atterberg limits are a basic measure of the nature of a fine-grained soil.
Depending on the water content of the soil, it may appear in four states: solid, semi-solid,
plastic and liquid. In each state the consistency and behavior of a soil is different and thus so
are its engineering properties. Thus, the boundary between each state can be defined based on
a change in the soil's behavior.
The plastic limit is determined by rolling out a thread of the fine portion of a soil on a
flat, non-porous surface. The procedure is defined in ASTM Standard D 4318.
If the soil is plastic, this thread will retain its shape down to a very narrow diameter. The
sample can then be remoulded and the test repeated.
As the moisture content falls due to evaporation, the thread will begin to break apart
at larger diameters. The plastic limit is defined as the moisture content where the thread
breaks apart at a diameter of 3 mm (about 1/8"). A soil is considered non-plastic if a thread
cannot be rolled out down to 3mm at any moisture.

32
FIG 4.6-PLASTIC LIMIT.
4.7 LIQUID LIMIT
The liquid limit (LL) is the water content at which a soil changes from plastic to
liquid behavior. The original liquid limit test of Atterberg involved mixing a part of clay in a
round-bottomed porcelain bowl of 10-12cm diameter. A groove was cut through the pat of
clay with a spatula, and the bowl was then struck many times against the palm of one hand.
The importance of the liquid limit test is to classify soils. Different soils have varying
liquid limits. Also to find the plasticity index of a soil you need to know the liquid limit and
the plastic limit.
The values of these limits are used in a number of ways. There is also a close
relationship between the limits and properties of a soil such as compressibility, permeability,
and strength. This is thought to be very useful because as limit determination is relatively
simple, it is more difficult to determine these other properties. Thus the Atterberg limits are
not only used to identify the soil’s classification, but it allows for the use of empirical
correlations for some other engineering properties.

33
4.8 SHRINKAGE RATIO
Shrinkage ratio is defined as the ratio of the volume change expressed as per cent of
the dry volume to the corresponding change in moisture content from the initial value.
4.8.1 VOLUMERIC SHRINKAGE
Volumetric shrinkage is defined as the decrease in the volume of a soil mass,
expressed as a percentage of the dry volume of the soil mass, when the water content is
reduced from an initial value to the shrinkage limit:
4.8.2 DEGREE OF SHRINKAGE
Degree of shrinkage is expressed as the ratio of the difference between initial volume
and final volume of the soil sample to its initial volume.
Schedig classified the soil qualitatively based on its degree of shrinkage as following:
Good Soil Sr<5%
Medium Soil Sr-5 to 10 %
Poor Soil Sr-10 to 15%
Very Poor Soil Sr>15%
TABLE 4.3-SHRINKAGE VALUES
4.9 COHESION
The cohesion is a term used in describing the shear strength soils. Its definition is
mainly derived from the Mohr-Coulomb failure criterion and it is used to describe the non-
frictional part of the shear resistance which is independent of the normal stress. In the stress
plane of Shear stress-effective normal stress, the soil cohesion is the intercept on the shear
axis of the Mohr-Coulomb shear resistance line.
34
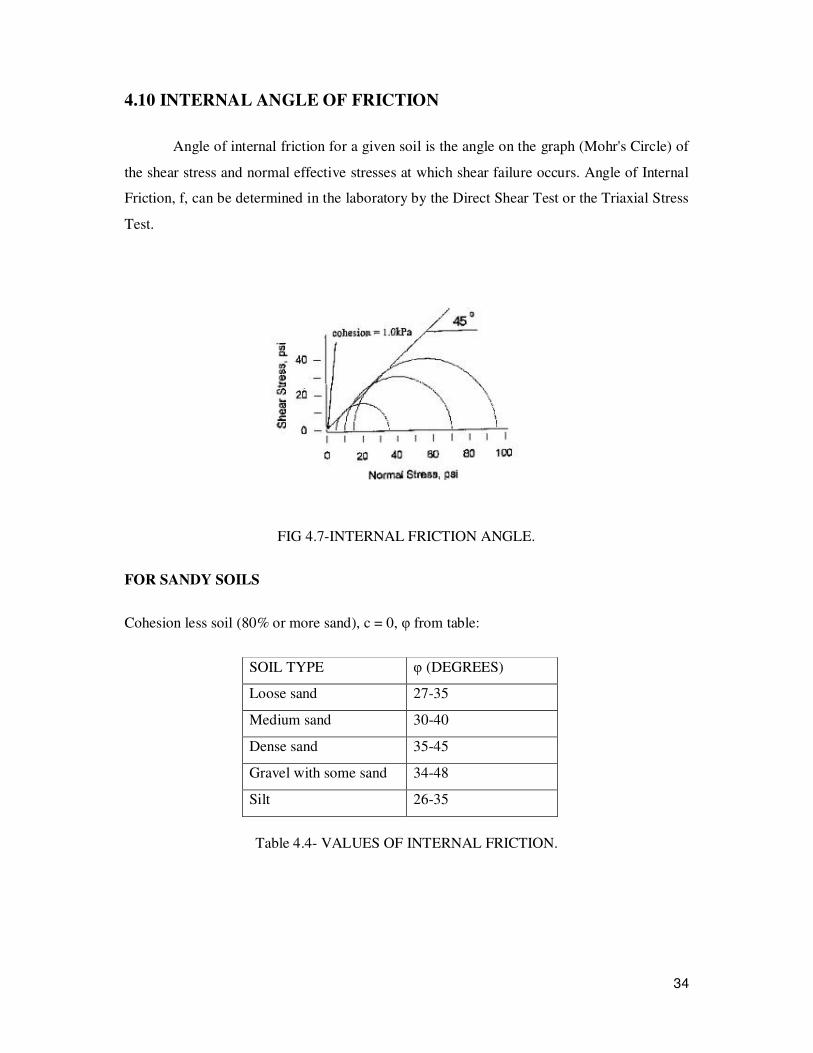
4.10 INTERNAL ANGLE OF FRICTION
Angle of internal friction for a given soil is the angle on the graph (Mohr's Circle) of
the shear stress and normal effective stresses at which shear failure occurs. Angle of Internal
Friction, f, can be determined in the laboratory by the Direct Shear Test or the Triaxial Stress
Test.
FIG 4.7-INTERNAL FRICTION ANGLE.
FOR SANDY SOILS
Cohesion less soil (80% or more sand), c = 0, φ from table:
SOIL TYPE φ (DEGREES)
Loose sand 27-35
Medium sand 30-40
Dense sand 35-45
Gravel with some sand 34-48
Silt 26-35
Table 4.4- VALUES OF INTERNAL FRICTION.
35
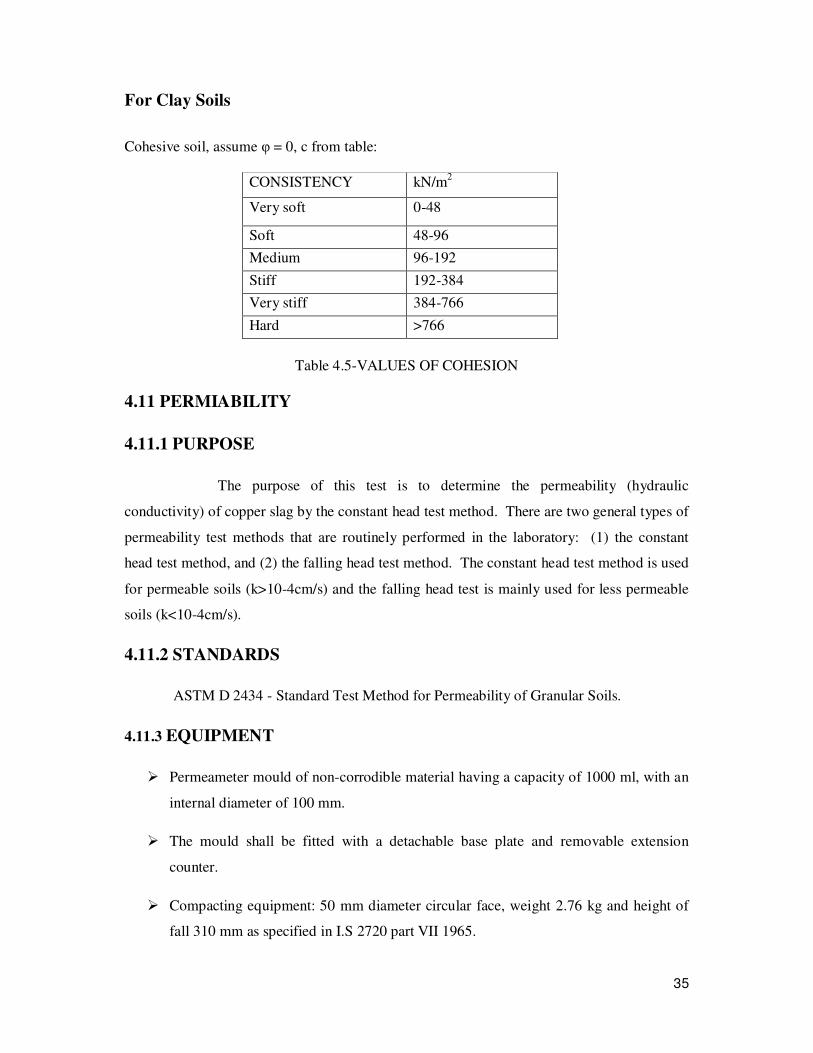
For Clay Soils
Cohesive soil, assume φ = 0, c from table:
CONSISTENCY kN/m2
Very soft 0-48
Soft 48-96
Medium 96-192
Stiff 192-384
Very stiff 384-766
Hard >766
Table 4.5-VALUES OF COHESION
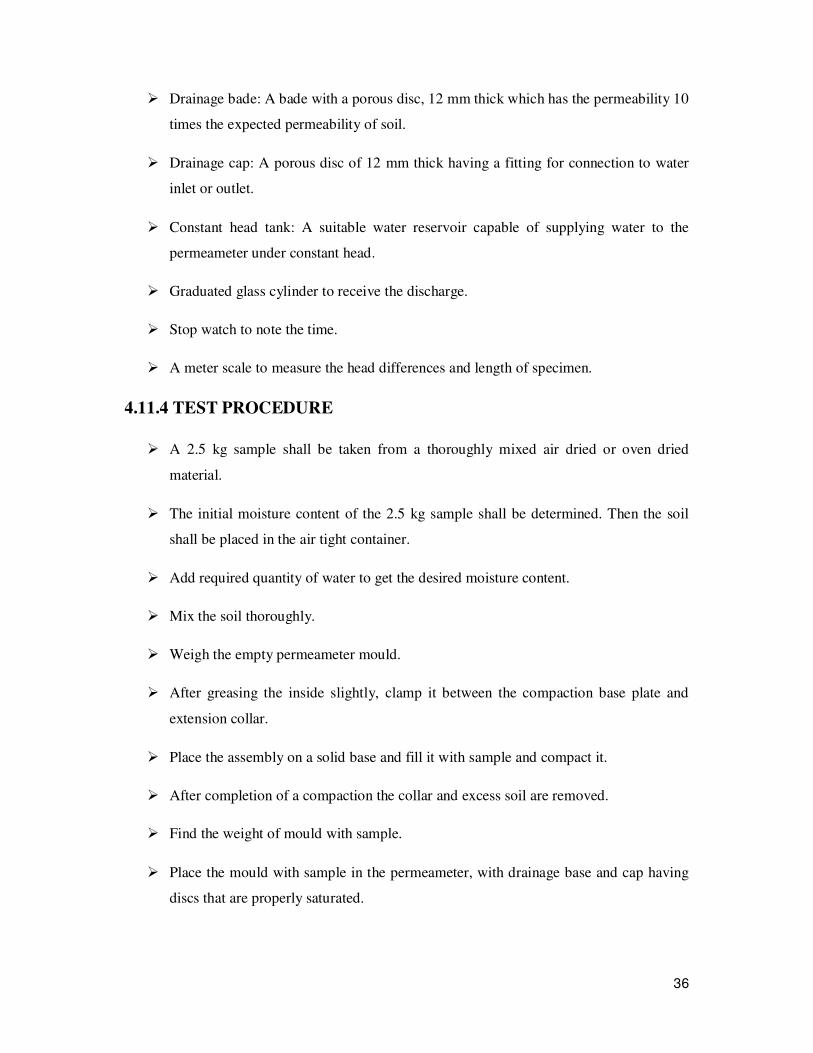
4.11 PERMIABILITY
4.11.1 PURPOSE
The purpose of this test is to determine the permeability (hydraulic
conductivity) of copper slag by the constant head test method. There are two general types of
permeability test methods that are routinely performed in the laboratory: (1) the constant
head test method, and (2) the falling head test method. The constant head test method is used
for permeable soils (k>10-4cm/s) and the falling head test is mainly used for less permeable
soils (k<10-4cm/s).
4.11.2 STANDARDS
ASTM D 2434 - Standard Test Method for Permeability of Granular Soils.
4.11.3 EQUIPMENT
� Permeameter mould of non-corrodible material having a capacity of 1000 ml, with an
internal diameter of 100 mm.
� The mould shall be fitted with a detachable base plate and removable extension
counter.
� Compacting equipment: 50 mm diameter circular face, weight 2.76 kg and height of
fall 310 mm as specified in I.S 2720 part VII 1965.
36
� Drainage bade: A bade with a porous disc, 12 mm thick which has the permeability 10
times the expected permeability of soil.
� Drainage cap: A porous disc of 12 mm thick having a fitting for connection to water
inlet or outlet.
� Constant head tank: A suitable water reservoir capable of supplying water to the
permeameter under constant head.
� Graduated glass cylinder to receive the discharge.
� Stop watch to note the time.
� A meter scale to measure the head differences and length of specimen.
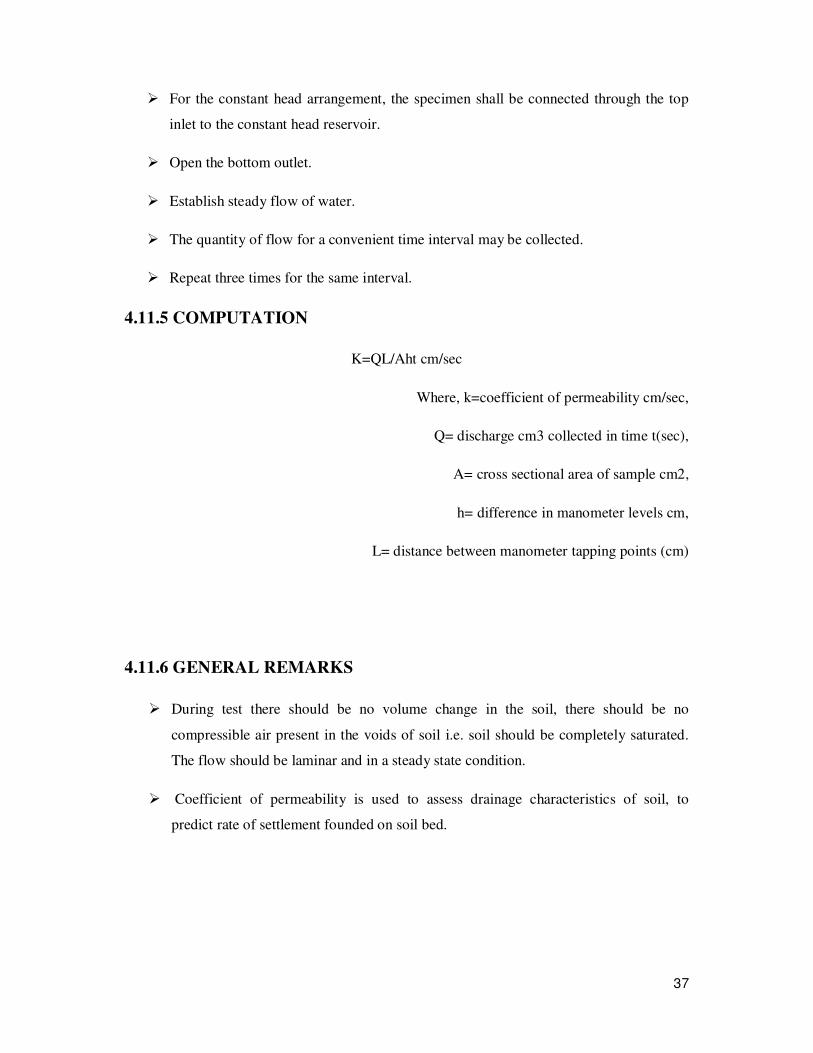
4.11.4 TEST PROCEDURE
� A 2.5 kg sample shall be taken from a thoroughly mixed air dried or oven dried
material.
� The initial moisture content of the 2.5 kg sample shall be determined. Then the soil
shall be placed in the air tight container.
� Add required quantity of water to get the desired moisture content.
� Mix the soil thoroughly.
� Weigh the empty permeameter mould.
� After greasing the inside slightly, clamp it between the compaction base plate and
extension collar.
� Place the assembly on a solid base and fill it with sample and compact it.
� After completion of a compaction the collar and excess soil are removed.
� Find the weight of mould with sample.
� Place the mould with sample in the permeameter, with drainage base and cap having
discs that are properly saturated.
37
� For the constant head arrangement, the specimen shall be connected through the top
inlet to the constant head reservoir.
� Open the bottom outlet.
� Establish steady flow of water.
� The quantity of flow for a convenient time interval may be collected.
� Repeat three times for the same interval.
4.11.5 COMPUTATION
K=QL/Aht cm/sec
Where, k=coefficient of permeability cm/sec,
Q= discharge cm3 collected in time t(sec),
A= cross sectional area of sample cm2,
h= difference in manometer levels cm,
L= distance between manometer tapping points (cm)
4.11.6 GENERAL REMARKS
� During test there should be no volume change in the soil, there should be no
compressible air present in the voids of soil i.e. soil should be completely saturated.
The flow should be laminar and in a steady state condition.
� Coefficient of permeability is used to assess drainage characteristics of soil, to
predict rate of settlement founded on soil bed.

38
4.12 CALIFORNIA BEARING RATIO
4.12.1 DEFINITION
It is the ratio of force per unit area required to penetrate a soil mass with standard
circular piston at the rate of 1.25 mm/min. to that required for the corresponding
penetration of a standard material.
The California Bearing Ratio Test (CBR Test) is a penetration test developed
by California State Highway Department (U.S.A.) for evaluating the bearing capacity of sub
grade soil for design of flexible pavement.
4.12.2 NEED AND SCOPE
The California bearing ratio test is penetration test meant for the evaluation of sub
grade strength of roads and pavements. The results obtained by these tests are used with the
empirical curves to determine the thickness of pavement and its component layers. This is the
most widely used method for the design of flexible pavement.
4.12.3 APPARATUS NEEDED
� Cylindrical mould with inside diameter 150 mm and height 175 mm, provided with a
detachable extension collar 50 mm height and a detachable perforated base plate 10
mm thick.
� Spacer disc 148 mm in diameter and 47.7 mm in height along with handle.
� Metal rammers. Weight 2.6 kg with a drop of 310 mm (or) weight 4.89 kg a drop 450
mm.
� Weights. One annular metal weight and several slotted weights weighing 2.5 kg each,
147 mm in diameter, with a central hole 53 mm in diameter.
� Loading machine. With a capacity of at least 5000 kg and equipped with a movable
head or base that travels at an uniform rate of 1.25 mm/min. Complete with load
indicating device.
� Metal penetration piston 50 mm diameter and minimum of 100 mm in length.
� Two dial gauges reading to 0.01 mm.
39
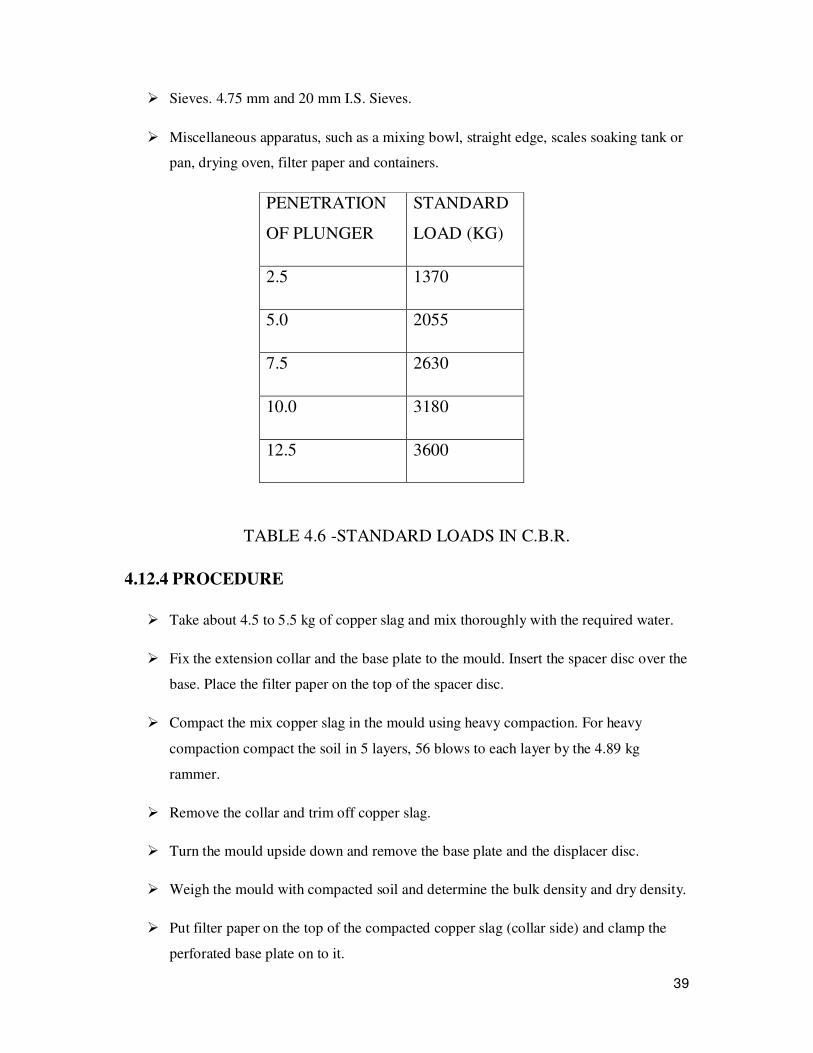
� Sieves. 4.75 mm and 20 mm I.S. Sieves.
� Miscellaneous apparatus, such as a mixing bowl, straight edge, scales soaking tank or
pan, drying oven, filter paper and containers.
PENETRATION
OF PLUNGER
STANDARD
LOAD (KG)
2.5 1370
5.0 2055
7.5 2630
10.0 3180
12.5 3600
TABLE 4.6 -STANDARD LOADS IN C.B.R.
4.12.4 PROCEDURE
� Take about 4.5 to 5.5 kg of copper slag and mix thoroughly with the required water.
� Fix the extension collar and the base plate to the mould. Insert the spacer disc over the
base. Place the filter paper on the top of the spacer disc.
� Compact the mix copper slag in the mould using heavy compaction. For heavy
compaction compact the soil in 5 layers, 56 blows to each layer by the 4.89 kg
rammer.
� Remove the collar and trim off copper slag.
� Turn the mould upside down and remove the base plate and the displacer disc.
� Weigh the mould with compacted soil and determine the bulk density and dry density.
� Put filter paper on the top of the compacted copper slag (collar side) and clamp the
perforated base plate on to it.
40
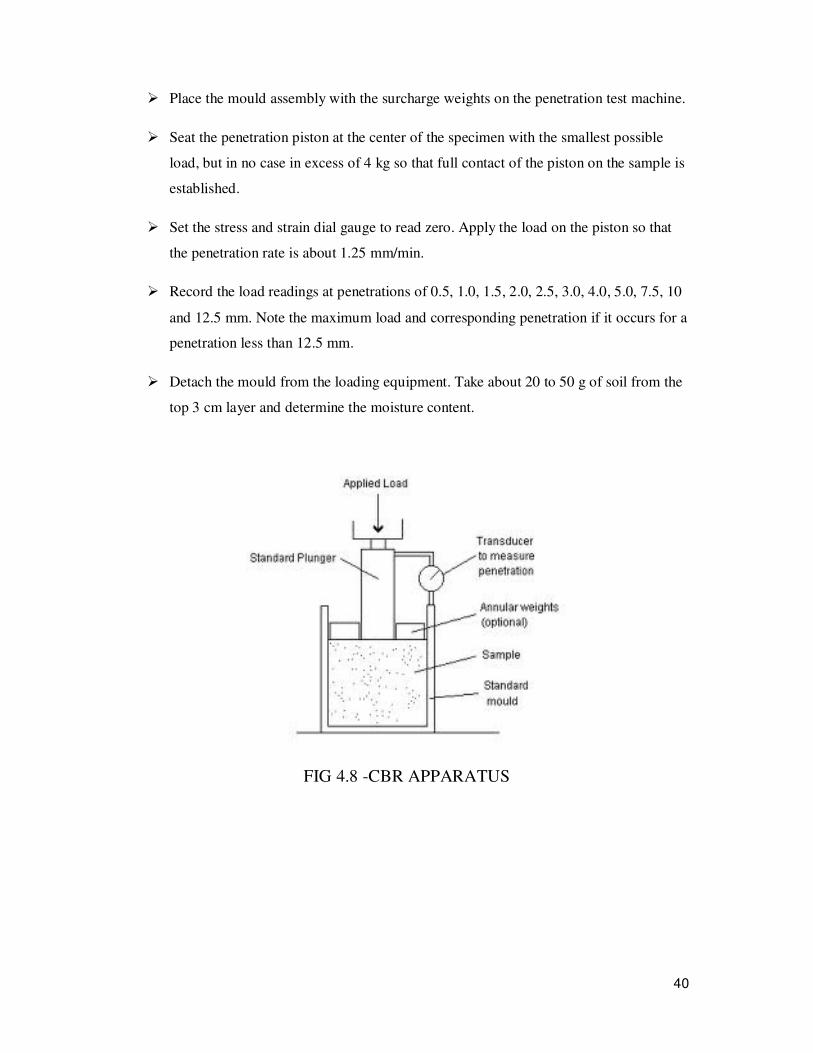
� Place the mould assembly with the surcharge weights on the penetration test machine.
� Seat the penetration piston at the center of the specimen with the smallest possible
load, but in no case in excess of 4 kg so that full contact of the piston on the sample is
established.
� Set the stress and strain dial gauge to read zero. Apply the load on the piston so that
the penetration rate is about 1.25 mm/min.
� Record the load readings at penetrations of 0.5, 1.0, 1.5, 2.0, 2.5, 3.0, 4.0, 5.0, 7.5, 10
and 12.5 mm. Note the maximum load and corresponding penetration if it occurs for a
penetration less than 12.5 mm.
� Detach the mould from the loading equipment. Take about 20 to 50 g of soil from the
top 3 cm layer and determine the moisture content.
FIG 4.8 -CBR APPARATUS

41
FIG 5.8-CBR EQUIPMENT.

42
4.12.5 USES OF C.B.R
� The CBR test is one of the most commonly used methods to evaluate the strength of a
sub grade soil, sub base, and base course material for design of thickness for
highways and airfield pavement.
� The California bearing ratio test is penetration test meant for the evaluation of sub
grade strength of roads and pavements. The results obtained by these tests are used
with the empirical curves to determine the thickness of pavement and its component
layers. This is the most widely used method for the design of flexible pavement.
4.13 DIRECT SHEAR
4.13.1 PURPOSE
This test is performed to determine the consolidated-drained shear strength
of a sandy to silty soil. The shear strength is one of the most important engineering
properties of a soil, because it is required whenever a structure is dependent on the soil’s
shearing resistance. The shear strength is needed for engineering situations such as
determining the stability of slopes or cuts, finding the bearing capacity for foundations, and
calculating the pressure exerted by a soil on a retaining wall.
4.13.2 STANDARD REFERENCE
ASTM D 3080 - Standard Test Method for Direct Shear Test of Soils Under
Consolidated Drained Conditions.
4.13.3 SIGNIFICANCE
The direct shear test is one of the oldest strength tests for soils. In this
laboratory, a direct shear device will be used to determine the shear strength of cohesion less
soil (i.e. angle of internal friction (f)). From the plot of the shear stress versus the horizontal
displacement, the maximum shear stress is obtained for a specific vertical confining stress.
After the experiment is run several times for various vertical-confining stresses, a plot of the
Maximum shear stresses versus the vertical (normal) confining stresses for each of the tests
are produced. From the plot, a straight-line approximation of the Mohr-Coulomb failure

43
envelope curve can be drawn, f may be determined, and, for cohesion less soils (c = 0), the
shear strength can be computed from the following equation:
s = s tan f
4.13.4 PROCEDURE
� Assemble the shear box.
� Now mix copper slag with optimum moisture content of water.
� Carefully transfer the sample into shear box.
� Place the loading plate on top of the upper porous plate. After recording the weight of
the loading carrier place it is on the loading cap.
� Position all dial gauges and set the readings to zero. Remove the alignment screws
which hold two halves of the shear box together.
� Tighten the remaining, two diagonally opposite screws, until there is a small gap
between upper and lower boxes to reduce the frictional force.
� Apply the desired normal load. If there is any vertical displacement, wait till the dial
gauges indicate a constant reading and then reset the dial gauge to zero.
� Check that screws have been removed and then start the motor to produce the desired
constant rate of shearing.
� Take readings of,
a) Shear load from the proving ring.
b) Shear displacement (i.e. Horizontal displacement).
c) Vertical displacement at every 10 division increment in horizontal dial gauge.
� Stop the test when the shear load starts to reduce or remains constant for at least three
Readings.
� Remove copper slag and repeat the procedure with different normal loads at least for
another two samples.
44
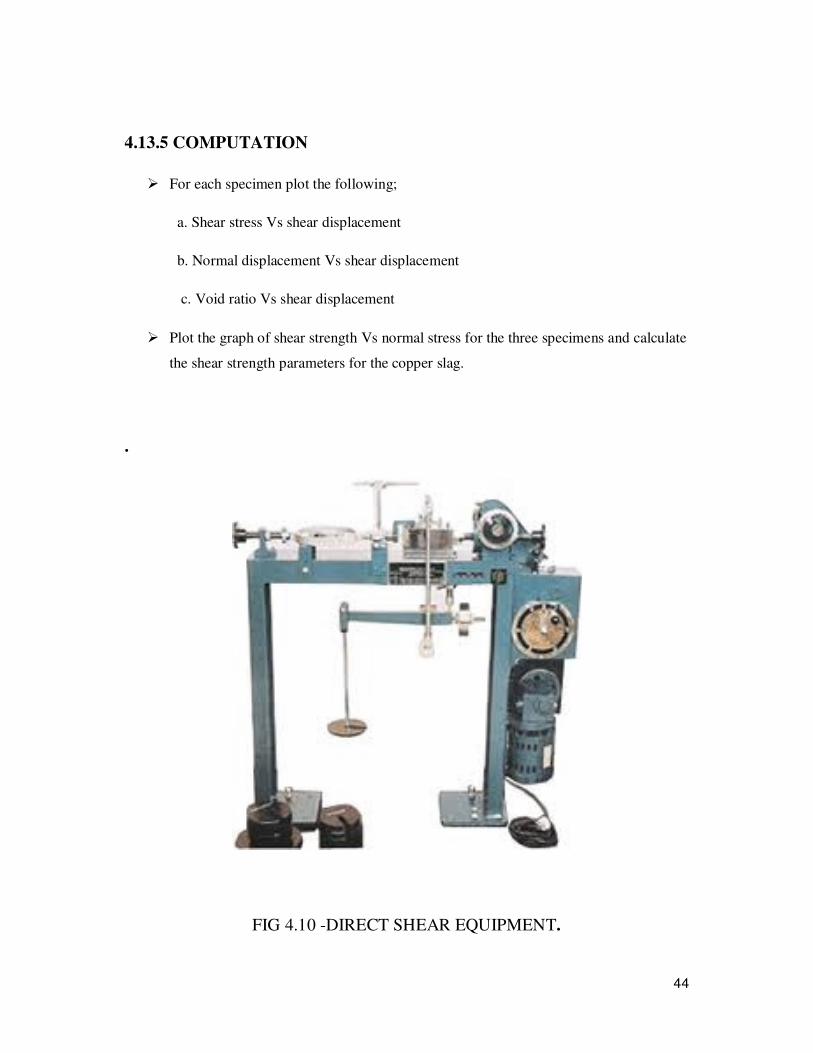
4.13.5 COMPUTATION
� For each specimen plot the following;
a. Shear stress Vs shear displacement
b. Normal displacement Vs shear displacement
c. Void ratio Vs shear displacement
� Plot the graph of shear strength Vs normal stress for the three specimens and calculate
the shear strength parameters for the copper slag.
.
FIG 4.10 -DIRECT SHEAR EQUIPMENT.

45
CHAPTER-5
EXPERIMENTAL WORK
In the present project work Standard compaction and Modified compaction tests are
done by adding 2%, 4%, 6%, 8% and 10% cement to the Copper Slag respectively.
List of experiments conducted
� Standard Compaction
� Modified compaction
5.1-STANDARD COMPACTION
Compaction is the process by which the bulk density of an aggregate of matter is
increased by driving out air. For any soil, for a given amount of compactive effort, the
density obtained depends on the moisture content. At very high moisture contents, the
maximum dry density is achieved when the soil is compacted to nearly saturation, where
(almost) all the air is driven out. At low moisture contents, the soil particles interfere with
each other; addition of some moisture will allow greater bulk densities, with a peak density
where this effect begins to be counteracted by the saturation of the soil.
These laboratory tests generally consist of compacting soil at known moisture content
into a cylindrical mould of standard dimensions using a compactive effort of controlled
magnitude. The soil is usually compacted into the mould to a certain amount of equal layers,
each receiving a number blows from a standard weighted hammer at a specified height. This
process is then repeated for various moisture contents and the dry densities are determined for
each. The graphical relationship of the dry density to moisture content is then plotted to
establish the compaction curve. The maximum dry density is finally obtained from the peak
point of the compaction curve and its corresponding moisture content, also known as the
optimal moisture content.
46
5.1.1-PURPOSE
This laboratory test is performed to determine the relationship between the moisture
content and the dry density of a soil for a specified compactive effort. The compactive effort
is the amount of mechanical energy that is applied to the soil mass. Several different
methods are used to compact soil in the field, and some examples include tamping, kneading,
vibration, and static load compaction. This laboratory will employ the tamping or impact
compaction method using the type of equipment and methodology developed by R. R.
Proctor in 1933, therefore, the test is also known as the Proctor test.
5.1.2-SIGNIFICANCE
Mechanical compaction is one of the most common and cost effective means of
stabilizing soils. An extremely important task of geotechnical engineers is the performance
and analysis of field control tests to assure that compacted fills are meeting the prescribed
design specifications. Design specifications usually state the required density (as a
percentage of the “maximum” density measured in a standard laboratory test), and the water
content. In general, most engineering properties, such as the strength, stiffness, resistance to
shrinkage, and imperviousness of the soil, will improve by increasing the soil density.
The optimum water content is the water content that results in the greatest density for
a specified compactive effort. Compacting at water contents higher than (wet of ) the
optimum water content results in a relatively dispersed soil structure (parallel particle
orientations) that is weaker, more ductile, less pervious, softer, more susceptible to shrinking,
and less susceptible to swelling than soil compacted dry of optimum to the same density. The
soil compacted lower than (dry of) the optimum water content typically results in a
flocculated soil structure (random particle orientations) that has the opposite characteristics of
the soil compacted wet of the optimum water content to the same density.
5.1.3 EQUIPMENTS
Moulds, Manual rammer, Extruder, Balance, Drying oven, Mixing pan, Trowel, #4
sieve, Moisture cans, Graduated cylinder, Straight Edge.

47
5.1.4 TEST PROCEDURE
� Sieve about 2.5kg of copper slag on a tray.
� Determine the weight of the compaction mould with its base (without the collar) by
using the balance and record the weights.
� Compute the amount of initial water to add by the following method:
(a) Assume water content for the first test to be 2 percent.
(b) Compute water to add from the following equation:
Water to add (in ml) ={( copper slag mass in grams)2}/100
Where “water to add” and the “copper slag” are in grams. Remember that a gram of
water is equal to approximately one milliliter of water.
� Now take 50grams (2%) ordinary Portland cement of M43 grade, and add it to the
copper slag. Cement is added to copper slag before mixing copper slag with water. By
adding cement binding property is achieved.
� Measure out the water, add it to the copper slag, and then mix it thoroughly into the
copper slag using the trowel until the copper slag gets a uniform color.
� Now divide entire copper slag mix into three equal proportions.
� Assemble the compaction mould to the base plate, place one portion of copper slag in
the mould and compact it with hammer of 2.5kg by making it to fall freely.
� Each layer should be compacted with 25 blows.
� Copper slag should completely fill the cylinder and the last compacted layer must
extend slightly above the collar joint. If copper slag is below the collar joint at the
completion of the drops, the test point must be repeated. (Note: For the last layer,
watch carefully, and add more soil after about 10 drops if it appears that copper slag
will be compacted below the collar joint.)
� Carefully remove the collar and trim off the compacted copper slag so that it is
completely even with the top of the mold using the trowel.
� Weigh the compacted copper slag while it’s in the mold and to the base, and record
the mass. Determine the wet mass of copper slag by subtracting the weight of the
mold and base.
48
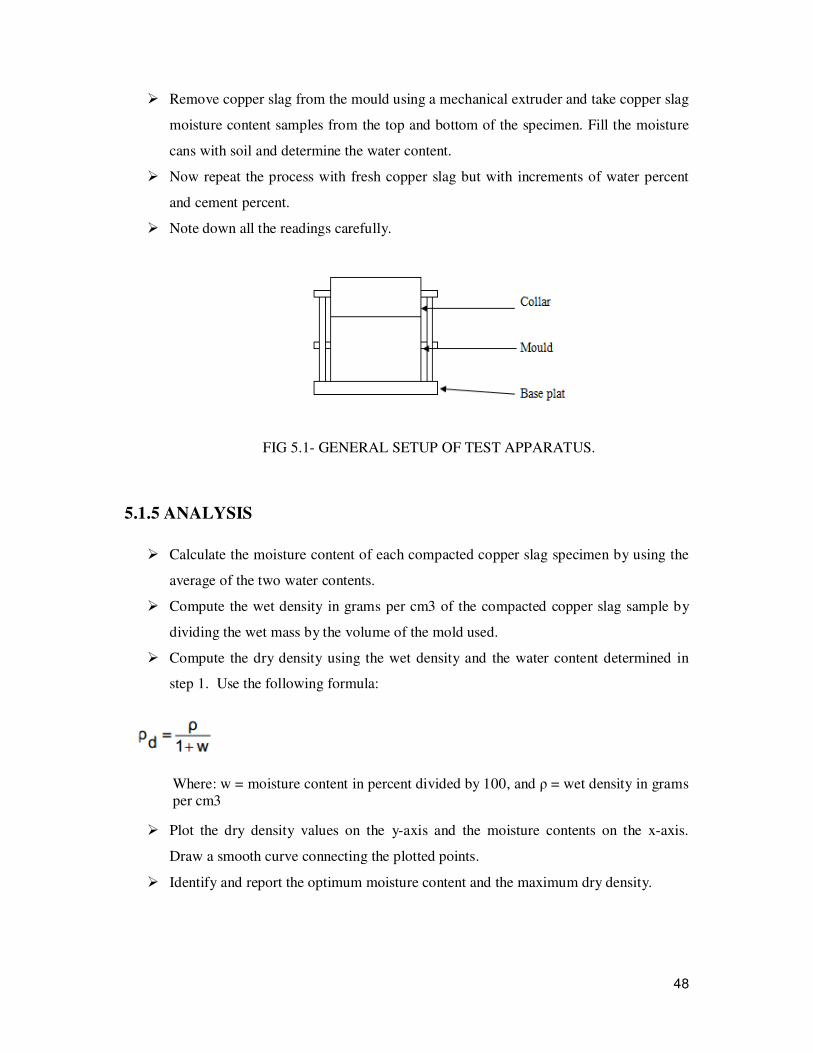
� Remove copper slag from the mould using a mechanical extruder and take copper slag
moisture content samples from the top and bottom of the specimen. Fill the moisture
cans with soil and determine the water content.
� Now repeat the process with fresh copper slag but with increments of water percent
and cement percent.
� Note down all the readings carefully.
FIG 5.1- GENERAL SETUP OF TEST APPARATUS.
5.1.5 ANALYSIS
� Calculate the moisture content of each compacted copper slag specimen by using the
average of the two water contents.
� Compute the wet density in grams per cm3 of the compacted copper slag sample by
dividing the wet mass by the volume of the mold used.
� Compute the dry density using the wet density and the water content determined in
step 1. Use the following formula:
Where: w = moisture content in percent divided by 100, and ρ = wet density in grams per cm3
� Plot the dry density values on the y-axis and the moisture contents on the x-axis.
Draw a smooth curve connecting the plotted points.
� Identify and report the optimum moisture content and the maximum dry density.
49
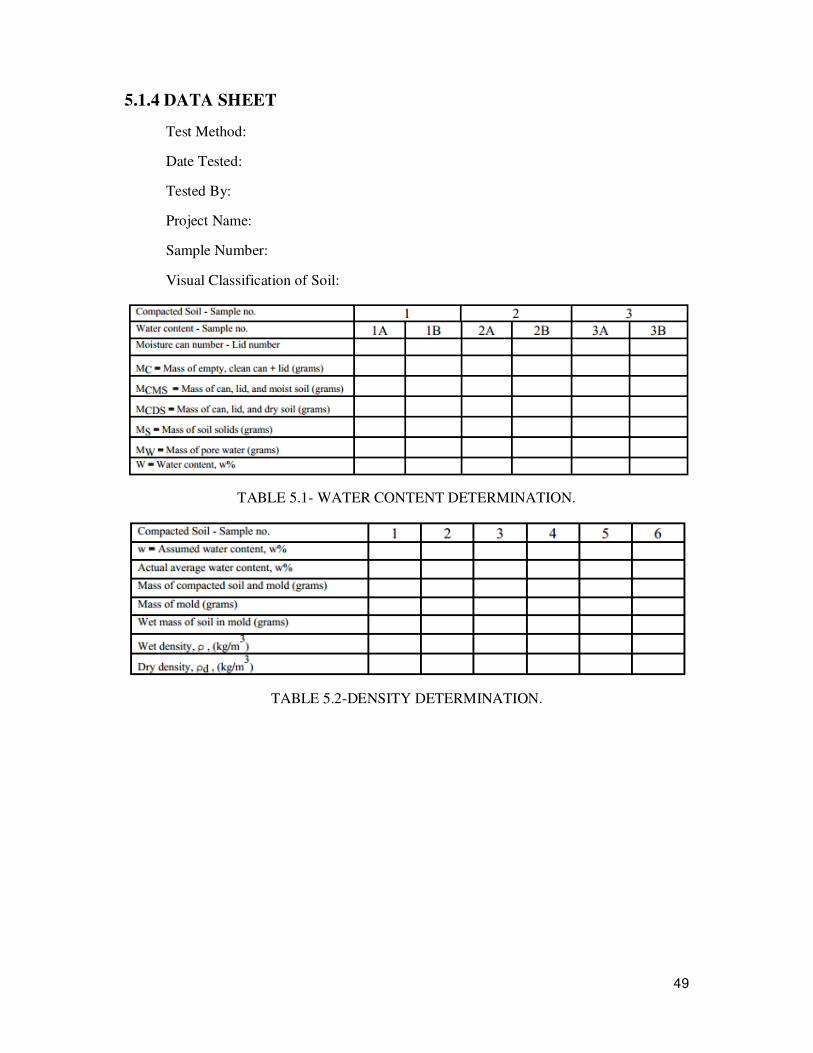
5.1.4 DATA SHEET
Test Method:
Date Tested:
Tested By:
Project Name:
Sample Number:
Visual Classification of Soil:
TABLE 5.1- WATER CONTENT DETERMINATION.
TABLE 5.2-DENSITY DETERMINATION.

50
FIG 5.2-SAMPLE GRAPH.
5.1.6 RESULTS
Optimum Moisture Content = _________________ %
Maximum Dry Density = ___________________ g/cm3
51
5.2 MODIFIED PROCTOR TEST
5.2.1 PROCEDURE
� Sieve about 2.5kg of copper slag on a tray.
� Determine the weight of the compaction mould with its base (without the collar) by
using the balance and record the weights.
� Compute the amount of initial water to add by the following method:
� (a) Assume water content for the first test to be 2 percent.
� (b) Compute water to add from the following equation:
Water to add (in ml) ={( copper slag mass in grams)2}/100
Where “water to add” and the “copper slag” are in grams. Remember that gram
water is equal to approximately one milliliter of water.
� Now take 50grams (2%) ordinary Portland cement of M43 grade, and add it to the
copper slag. Cement is added to copper slag before mixing copper slag with water. By
adding cement binding property is achieved.
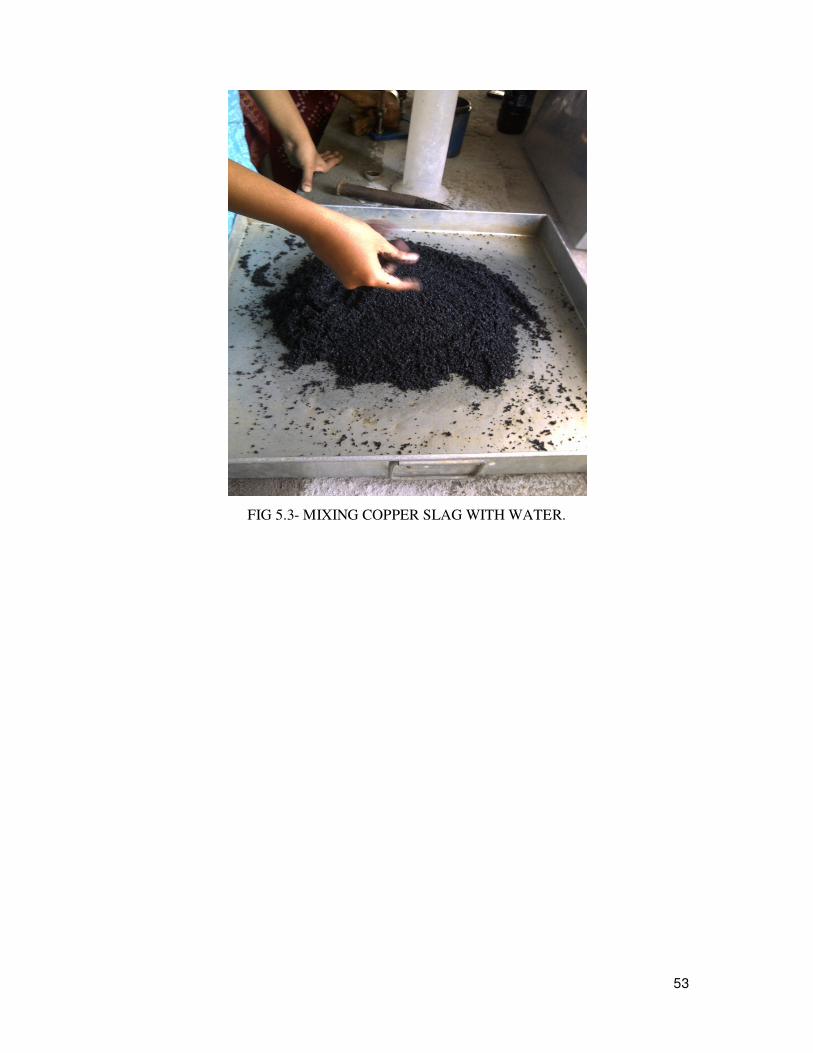
� Measure out the water, add it to the copper slag, and then mix it thoroughly into the
copper slag using the trowel until the copper slag gets a uniform color.
� Now divide entire copper slag mix into five equal proportions.
� Assemble the compaction mould to the base plate, place one portion of copper slag in
the mould and compact it with hammer of 4.5kg by making it to fall freely.
� Each layer should be compacted with 25 blows.
� Copper slag should completely fill the cylinder and the last compacted layer must
extend slightly above the collar joint. If copper slag is below the collar joint at the
completion of the drops, the test point must be repeated. (Note: For the last layer,
watch carefully, and add more soil after about 10 drops if it appears that copper slag
will be compacted below the collar joint.)
� Carefully remove the collar and trim off the compacted copper slag so that it is
completely even with the top of the mold using the trowel.
� Weigh the compacted copper slag while it’s in the mold and to the base, and record
the mass. Determine the wet mass of copper slag by subtracting the weight of the
mold and base.

52
� Remove copper slag from the mould using a mechanical extruder and take copper slag
moisture content samples from the top and bottom of the specimen. Fill the moisture
cans with soil and determine the water content.
� Now repeat the process with fresh copper slag but with increments of water percent
and cement percent.
� Note down all the readings carefully.
5.2.2 ANALYSIS
� Calculate the moisture content of each compacted copper slag specimen by using the
average of the two water contents.
� Compute the wet density in grams per cm3 of the compacted copper slag sample by
dividing the wet mass by the volume of the mold used.
� Compute the dry density using the wet density and the water content determined in
step 1. Use the following formula:
Where: w = moisture content in percent divided by 100, and ρ = wet density in grams
per cm3
� Plot the dry density values on the y-axis and the moisture contents on the x-axis.
Draw a smooth curve connecting the plotted points.
� Identify and report the optimum moisture content and the maximum dry density.
5.2.3 RESULTS
Optimum Moisture Content = _________________ %
Maximum Dry Density = ___________________ g/cm.
53
FIG 5.3- MIXING COPPER SLAG WITH WATER.

54
FIG 5.4- COMPACTION PROCEDURE

55
FIG 5.5- TAMPERING PROCESS.

56
CHAPTER-6
RESULTS
------------------------------------------------------------------------------------------------
6.0 COMPACTION
Graphs are plotted by taking dry density on y-axis and moisture content on x-axis.
The maximum dry density and optimum moisture content are determined from these graphs.
6.1 STANDARD COMPACTION WITH OUT CEMENT
FIG 6.1- GRAPH FOR COPPER SLAG IN STANDARD COMPACTION
2.1
2.15
2.2
2.25
2.3
2.35
2.4
0 5 10 15
dry
de
nsi
ty (
g/c
c)
water content (%)

57
6.2 STANDARD COMPACTION WITH 2% CEMENT
FIG 6.2- GRAPH FOR STANDARD COMPACTION WITH 2% CEMENT.
MAXIMUM DRY DENSITY= 2.26 gm/cc.
OPTIMUM MOISTURE CONENT= 2.90 %
1.900
2.000
2.100
2.200
2.300
2.400
2.500
0.000 5.000 10.000
dry
de
nsi
ty (
g/c
c)
water content (%)

58
6.3 STANDARD COMPACTION WITH 4% CEMENT
FIG 6.3-STANDARD COMPACTION GRAPH WITH 4% CEMENT.
MAXIMUM DRY DENSITY= 2.36 gm/cc
OPTIMUM MOISTURE CONTENT= 8.60 %
2.2
2.3
2.4
2.5
2.6
2.7
0 5 10 15
dry
de
nsi
ty (
g/c
c)
water content (%)

59
6.4 STANDARD COMPACTION WITH 6% CEMENT
FIG 6.4-STANDARD COMPACTION GRAPH WITH 6% CEMENT.
MAXIMUM DRY DENSITY= 2.45 gm/cc
OPTIMUM MOISTURE CONTENT= 6.50 %
2.2
2.25
2.3
2.35
0 5 10 15 20
dry
de
nsi
ty (
g/c
c)
water content (%)

60
6.5 STANDARD COMPACTION WITH 8% CEMENT
FIG 6.5-STANDARD COMPACTION GRAPH WITH 8% CEMENT
MAXIMUM DRY DENSITY= 2.47 gm/cc
OPTIMUM MOISTURE CONTENT= 9.60 %
2.2
2.3
2.4
2.5
2.6
2.7
0 5 10 15
dry
de
nsi
ty (
g/c
c)
water content (%)

61
6.6 STANDARD COMPACTION WITH 10% CEMENT
FIG 6.6- STANDARD COMPACTION WITH 10% CEMENT.
MAXIMUM DRY DENSITY= 2.48 gm/cc
OPTIMUM MOISTURE CONTENT= 5.30 %
2.2
2.3
2.4
2.5
2.6
0 5 10 15
dry
de
nsi
ty (
g/c
c)
water content (%)

62
6.7 MODIFIED WITH OUT CEMENT
FIG 6.7- MODIFIED GRAPH WITHOUT CEMENT.
MAXIMUM DRY DENSITY= 2.60 gm/cc
OPTIMUM MOISTURE CONTENT= 4.5 %
2.4
2.45
2.5
2.55
2.6
0 1 2 3 4 5 6 7
dry
de
nsi
ty (
g/c
c)
water content (%)

63
62
6.7 MODIFIED COMPACTION WITH 2% CEMENT
FIG 6.8- MODIFIED COMPACTION GRAPH WITH 2% CEMENT.
MAXIMUM DRY DENSITY= 2.27 gm/cc
OPTIMUM MOISTURE CONTENT= 7.5%
2.2
2.21
2.22
2.23
2.24
2.25
2.26
2.27
2.28
0 2 4 6 8 10
dry
de
nsi
ty (
g/c
c)
water content (%)

64
6.9 MODIFIED COMPACTION WITH 4% CEMENT
FIG 6.9- MODIFIED COMPACTION WITH 4% CEMENT.
MAXIMUM DRY DENSITY=2.31 gm/cc
OPTIMUM MOISTURE CONTENT=7.10%
2.16
2.18
2.2
2.22
2.24
2.26
2.28
2.3
2.32
2.34
0 2 4 6 8 10 12 14 16 18 20
dry
de
nsi
ty (
g/c
c)
water content (%)
65
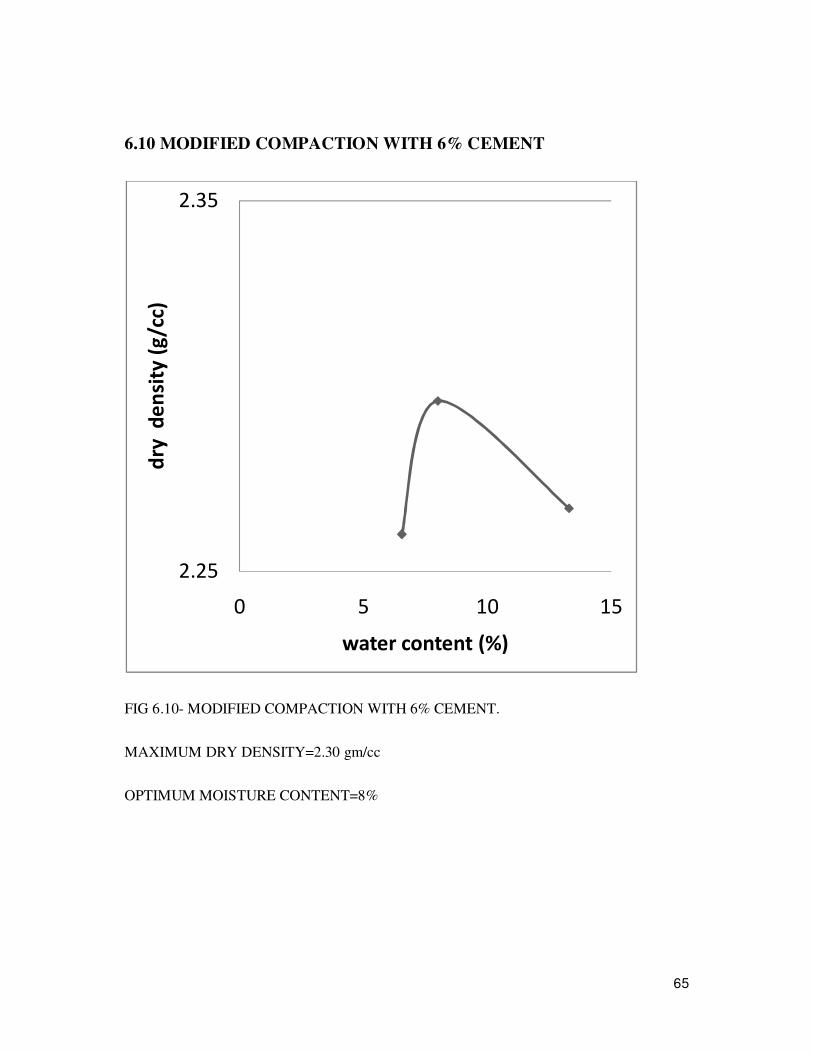
6.10 MODIFIED COMPACTION WITH 6% CEMENT
FIG 6.10- MODIFIED COMPACTION WITH 6% CEMENT.
MAXIMUM DRY DENSITY=2.30 gm/cc
OPTIMUM MOISTURE CONTENT=8%
2.25
2.35
0 5 10 15
dry
de
nsi
ty (
g/c
c)
water content (%)
66
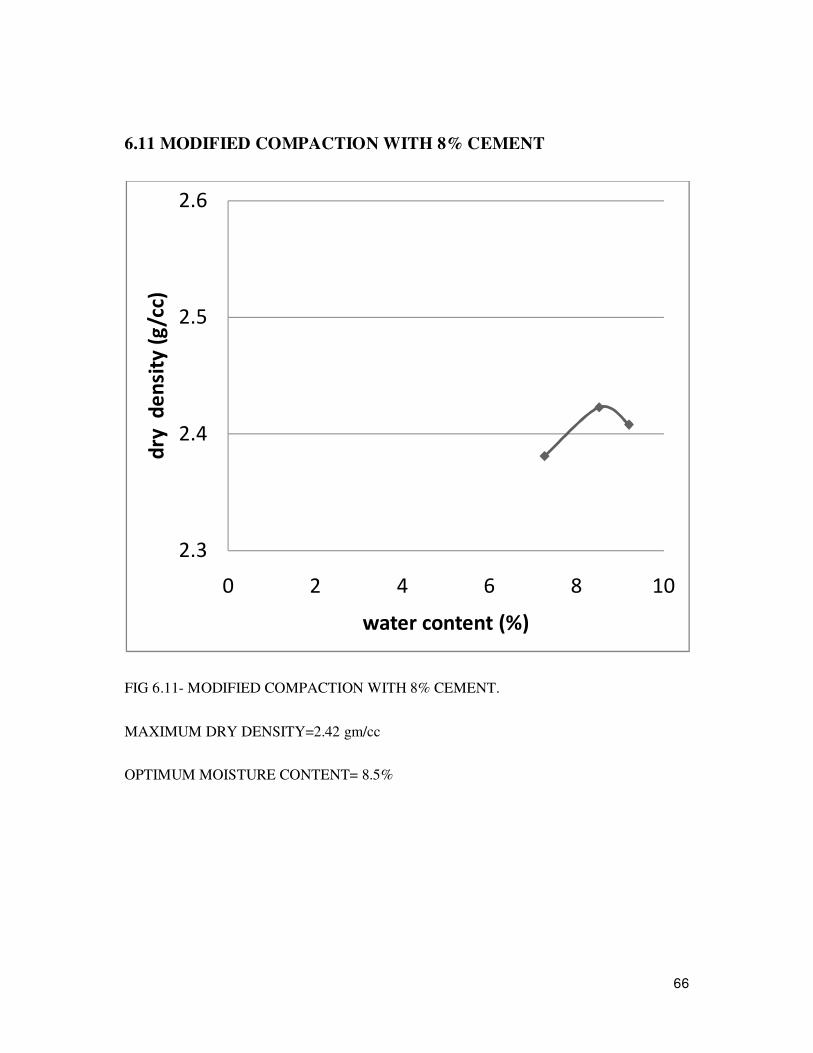
6.11 MODIFIED COMPACTION WITH 8% CEMENT
FIG 6.11- MODIFIED COMPACTION WITH 8% CEMENT.
MAXIMUM DRY DENSITY=2.42 gm/cc
OPTIMUM MOISTURE CONTENT= 8.5%
2.3
2.4
2.5
2.6
0 2 4 6 8 10
dry
de
nsi
ty (
g/c
c)
water content (%)
67
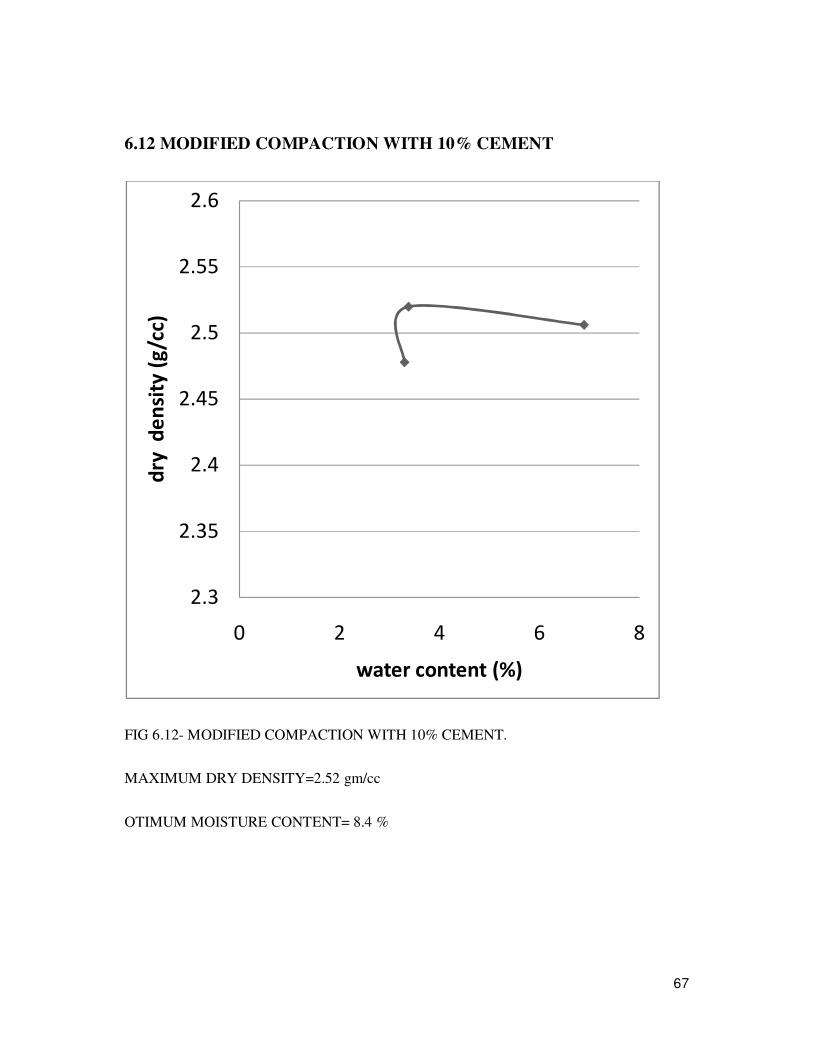
6.12 MODIFIED COMPACTION WITH 10% CEMENT
FIG 6.12- MODIFIED COMPACTION WITH 10% CEMENT.
MAXIMUM DRY DENSITY=2.52 gm/cc
OTIMUM MOISTURE CONTENT= 8.4 %
2.3
2.35
2.4
2.45
2.5
2.55
2.6
0 2 4 6 8
dry
de
nsi
ty (
g/c
c)
water content (%)
68
CHAPTER-7
CONCLUSIONS
------------------------------------------------------------------------------------------------
SOIL stabilization has gained a lot of importance in the construction industry, at the
sites where soft or expansive sub grades soils are predominantly present. In the present day,
many by products are being in use as soil stabilization agents. Many research outputs are
available on fly ash towards soil stabilization. Recently researchers have started conducting
studies using copper slag which is being readily available in the copper industry as a waste by
product.
In the present study, the influence of cement on compaction charate4ristics of copper slag
was studied and the results are summarized below.
� Irrespective of compaction effort, the variation in MDD observed is minimal. And
almost the MDD is varying from 2.26g/cc to 2.52g/cc.
� Up to about 8% of moisture content addition to the CS is not causing liquid condition.
Beyond 8% of moisture content for any small increase in moisture content, water is
easily coming out of the compacted CS.
� From the compaction characteristics of cement/lime mixed CS, it is noticed that
cement has not imparting any cementations effects on the CS and hence the behavior
of the cement mixed CS observed is similar to the granular material.
� As the % of cement increases from 2% to 10% the MDD values are slightly
increasing where as the OMC values are observed to be increasing and decreasing.
From these results it can be noticed that as the % of cement increases, there is no
definite trend in the OMC irrespective of the compactive effort.

69
From the results, it is understand that addition of cement to the Copper slag is not
going to benefit in terms of behavior of material. But same cement when mixed with Copper
slag along with soils may result in beneficial effects in terms of stabilization of clayey
deposits. Hence, as a future study, the combination of CS and Cement along the soil can be
mixed and relevant geotechnical testing can be carried out to bring out the efficacy of CS
along with the cement in the soil stabilization process.

70
REFERENCES
------------------------------------------------------------------------------------------------
1. Introduction to geotechnical engineering, an (2nd edition) by r.d.holtz, William d.
kovacs and Thomas c.sheahan.
2. Geotechnical engineering: principles & practices (2nd edition) by Donald p. coduto
and a. kitch.
3. Fundamental of geotechnical engineering by Braja m. das.
4. Principles of geotechnical engineering by braja m. das.
5. Soil mechanics and foundations by dr. b. c. Punmia, ashok kumar Jain, B.C. punmia,
arun kr. Jain.
6. Characteristics and utilization of copper slag—a review by Bipra Gorai, R.K. Jana,
Premchand.
7. Copper slag waste as a supplementary cementing material to concrete.
Washington Almeida Moura, Jardel Pereira Gonçalves and Mônica Batista Leite
Lima.
8. http://www.squ.edu.om/Portals/155/press/AUGUST%201,%202009.pdf.

71