chapter 1 extent and physical condition of the u.s ... · 1-1 chapter 1 extent and physical...
TRANSCRIPT

1-1
CHAPTER 1
Extent and Physical Condition of the U.S. Transportation System
Highlights• TheNation’stransportationassetswere
valuedatabout$7.7trillionin2016,a20.6percentincreaseover2010estimates.Publiclyownedinfrastructureandequipmentcontinuedtoaccountforoverone-halfoftransportationcapitalstock.
• Highwaytravelasmeasuredbyperson-milestraveled(PMT)andvehicle-milestraveled(VMT)increasedby5.4and4.3percent,respectively,from2010to2015.
• TheconditionoftheU.S.transportationinfrastructureisimproving,butadditionalworkisneeded.Thepercentageofstructurallydeficientbridgesdeclinedfrom12.0percentin2010to9.1percentin2016.
• Oneimpactofbridgedeteriorationisreducedloadlimits.In2016,11.3percentofallbridgeshadreducedloadlimits,whichcancausecommercialvehicleoperatorstocarrysmallerloadsortakecircuitousroutes,increasingcosts.
• Theaverageageofthehighwaylight-dutyvehiclefleetincreasedby29percentoverthe2000to2015periodandstoodatabout11.5yearsin2015.Theaverageageof
commercialtruckswas14.8yearsin2015,upfrom12.5yearsin2007.
• Busesaccountedforabouthalfofthe136,000U.S.transitvehiclesin2015andamongtransitvehicleshadthelowestaverageage(7.4years).
• Theaverageageofinlandwaterwaynavigationlocks,adjustedforthedateofthemostrecentrehabilitation,ismorethan50years.
• Mostairportrunways(commercialservice,reliever,andselectgeneralaviation)areingoodcondition;only2percentareconsideredpoor.
• ClassIfreightrailroadcapitalexpenditurestotaled$17.4billionin2015,almosttriplethespendingin2000.Railtrackdefectshavebeentrendingdownwardsince2013.
• Thereisagenerallackofdataontheconditionofvehicleandtrafficcontrolsystems,regardlessofmode;parkinginfrastructure;thephysicalconditionofmosttypesofvehiclesandprivatelyownedinfrastructure(e.g.,railroadtrack);andmostaspectsofintermodalconnections.

1-2
Chapter 1: Extent and Physical Condition of the U.S. Transportation System
In2016theU.S.transportationsystemservedmorethan323millionAmericans—includingthosewhomaynotownavehicleorrarelytravel.Transportationallowsustocommutetowork,obtaingoodsandservices,callonfamilyandfriends,andvisitdistantplaces.Italsodrivesoureconomy,connecting7.6millionbusinesseswithcustomers,suppliers,andworkers[USDOCCENSUSQF2017].Thetransportationsystemallowsover75millionforeignvisitorstotraveltoourcountry(seechaptertwoofthispublication),resultinginasizablecontributiontotheU.S.economy.
Thischapterexaminesboththeextentandconditionoftheprincipaltransportationmodes,includingassociatedinfrastructure,vehiclesandcontrolsystems,andtheestimatedcostofkeepingorbringingthesystemintoastateofgoodrepair.Interconnectionsthatlinkonemodewithoneormoreothermodesarealsoimportantsystemelements,butalackofpublicdataontheseconnectionspreventsmeaningfulanalysisoftheircondition.
Capital Stock and Investments Transportationcapitalstockisthevalueoftransportationinfrastructure(e.g.,roadways,bridges,andstations)andequipment(e.g.,automobiles,aircraft,andships)inexistenceasofaspecificdate.ThenetvalueofU.S.transportationcapitalstockwasestimatedat$7.7trillionin2016(figure1-1).
Transportationcapitalstockisownedbyboththepublicandprivatesectors.Freightrailroadfacilitiesandequipmentarealmostentirelyownedbytheprivatesector,whilestateandlocalgovernmentsownhighwaysandbridges,airports,seaports,andtransitstructures.
In2016thepublicsectorowned$4.2trillion(54.7percentoftransportationcapitalstock),whiletheprivatesectorowned$3.5trillion(45.3percent)(figure1-1).Publichighwaysandstreetsaccountedforthelargestshareofpubliclyownedtransportationcapitalstock($3.5trillionof$4.2trillion),whileotherpubliclyownedtransportation,suchasairports,seaports,andtransitstructures,accountedfortheremainingshare($737billion).
In2016personalmotorvehiclesandpartsownedbyhouseholds,someofwhichareusedforbusinesspurposes,accountedforthelargestamountofprivatelyownedtransportationcapitalstock($1.6trillionof$3.5trillion)(figure1-1).In-housetransportationaccountedforthesecondlargestamount($1.1trillion)ofprivatetransportationcapitalstock,mostofwhichwashighwayrelated,suchastruckfleetsownedbygrocerychains.For-hirerailownedthenextlargestamount,accountingfor$397billionoftransportationcapitalstock,followedbyfor-hireairat$218billion.
In2016privateandpublicspendingontransportationconstructiontotaled$133.2billion.Thepublicsectoristhemajorfundingsourcefortransportationinfrastructureconstruction,especiallyforstreetsandhighways.In2016thevalueofgovernment-funded(public)constructionaccountedfor90.8percent($120.9billion)oftotalspendingontransportationconstruction,whileprivatetransportationconstructionaccountedfor9.2percent($12.2billion).Approximatelythree-quartersofgovernment-fundedinvestmentwasforhighways($90.5billion);theremaindersupportedtheconstructionofair,land,andwatertransportationfacilities($30.4billion).

1-3
Transportation Statistics Annual Report
Chapter5detailspublicandprivatetransportationconstruction,transportationinfrastructurespending,andtherevenuesgeneratedbyeachtransportationmode.
Roads, Bridges, Vehicles, Parking, and Traffic Control Systems
Roads
Thetotalmileageofpublicroadsandlane-milesincreasedby2.2and1.8percent,respectively,from2010to2015butdecreased
by0.5and0.3percent,respectively,between2014and2015.Vehicle-milestraveled(VMT)increasedbymorethan4percentoverthatperiod(table1-1).Localroadsarebyfarthemostextensive,amountingto2.9millionmiles(69.2percentoftotalsystem-miles).However,interstatehighways,whichaccountedfor48,000miles(1.2percentoftotalsystem-miles),handledthehighestvolumesoftrafficasmeasuredbyVMT—25.1percentin2015[USDOTFHWA2016].ExpansiveWesternandMidwesternstates,suchasTexas,California,Illinois,Kansas,andMinnesota,
FIGURE 1-1 Net Value of Transportation Capital Stock: 2016 (billions of dollars)
$3,483$737
$1,556$1,055
$397$218
$112$85
$40$29$3$1
Highways and streetsOther infrastruture
HouseholdsIn-house transportation
RailAir
TruckOther for-hire
WaterTransit and ground passenger
PipelineWarehousing
Publicly owned
Privately owned (by owner)
For-hire transportation
NOTES: Data include only privately owned capital stock except for those otherwise noted. Capital stock data are reported after deducting deprecia-tion. Other publicly owned transportation includes publicly owned airway, waterway, and transit structures but does not include associated equipment. Locks and dams may be included under Other publicly owned transportation. Household includes personal vehicles, which are considered consumer durable goods. In-house transportation is capital stock owned by non-transportation companies. For example, grocery companies often use their own truck fleets to move goods from their warehouses to their retail outlets. In-house transportation and for-hire transportation figures cover the current cost net capital stock for fixed assets (transportation-related equipment including light trucks; other trucks, buses and truck trailers; autos; aircraft; ships and boats; and railroad equipment as well as transportation-related structures including air, rail, transit, and other transportation structures and track replacement) owned by a firm. Other privately owned transportation includes sightseeing, couriers and messengers, and transportation support activities, such as freight transportation brokers. Details may not add to totals due to rounding. Data may differ from those published in the 2016 TSAR due to revisions in the source data. Please see cited source for additional information.
SOURCE: U.S. Department of Commerce, Bureau of Economic Analysis, Fixed Asset Tables, tables 3.1ESI, 7.1B, 8.1; and Nonresidential Detailed Estimates, net stocks, current cost table. Available at http://www.bea.gov/ as of March 2017.

1-4
Chapter 1: Extent and Physical Condition of the U.S. Transportation System
havethemostpublicroadmileage.1TheDistrictofColumbia,followedbyHawaii,RhodeIsland,Delaware,andVermont,hadthelowestpublicroadandstreetmileage[USDOTFHWA2016].Figure1-2showstheNationalHighwaySystem,whichincludesinterstatehighwaysaswellasotherroadsimportanttotheNation’seconomy,defense,andmobility.
TheU.S.DepartmentofTransportation’s(USDOT’s)FederalHighwayAdministration(FHWA)reportstheInternationalRoughnessIndex(IRI),whichmeasuresthesmoothnessofpavementandisakeyindicatoroftheconditionofhighwaysandbridges.2
1Alaska,thelargeststatebylandarea,hasrelativelyfewmilesofroads,whichreflectsthelightlypopulatedandrelativelyundevelopedcharacterofthelargelandmassthatliesoutsideoftheAnchoragetoFairbankscorridor.2Ahighwaythathasaroughnessratinggreaterthan170inchespermileisconsideredinpoorcondition.
Table1-2providessummarydataonthepercentageofroughsurfacemileagefordifferentfunctionalclassesofhighways.Thephysicaldeteriorationofroadsandbridgestypicallydoesnotproduceabruptfailures;rather,continuedroughridingproducesrepetitiveandgradualincreasesinvehiclemaintenanceandotherhighwayusercosts.Forbothurbanandruralroadsasthefunctionalclassdecreases,frominterstatesdowntocollectors,thepercentageofroughroadsincreases,andthisistrueforbothyearsshown.Thisislikelytheresultofroadmaintenanceandrehabilitationprogramsandbudgetsthatfavorthehigherthroughputclassesofroadway.
Bridges
Atotalof614,386highwaybridgeswereinusein2016,ranginginsizefromruralone-lanebridgescrossingcreekstourbanmultilaneandmultilevelinterstatebridgesandmajor
TABLE 1-1 Public Roads and Streets, Lane-Miles, and VMT: 2000, 2010, 2014, and 2015
2000 2010 2014 2015
TOTAL, Public Road and Street Mileage by Functional Type mileage (miles) 3,936,222 4,067,077 4,177,073 4,154,727
Interstate 46,427 46,900 47,662 48,053
Other freeways and expressways 9,140 14,619 17,250 17,986
Other principal arterial 152,233 157,194 157,034 156,473
Minor arterial 227,364 242,815 244,961 246,608
Collectors 793,124 799,226 808,363 811,231
Local 2,707,934 2,806,322 2,901,804 2,874,376
TOTAL lane-miles 8,224,245 8,582,261 8,766,049 8,736,587
TOTAL vehicle-miles of travel (VMT) 2,746,925 2,967,266 3,025,656 3,095,373
NOTE: Lane-miles are the centerline length in miles multipled by the number of lanes.
SOURCE: U.S. Department of Transportation (USDOT), Federal Highway Administration (FHWA), Highway Statistics (multiple years), as cited in the USDOT. Bureau of Transportation Statistics (BTS). National Transportation Statistics (NTS). Tables 1-5, 1-6, 1-28. Available at http://www.bts.gov/ as of March 2017.

1-5
Transportation Statistics Annual Report
FIGURE 1-2 National Highway System: 2016
SOURCE: U.S. Department of Transportation, Federal Highway Administration, National Highway System (September 2016).
TABLE 1-2 Condition of U.S. Highways: 2014 and 2015 National Highway System
Highway surface condition 2014 2015Percent of mileage with International Roughness Indexa over 170 (poor condition)
Rural routes Interstates 2.2 1.8 Other principal arterials 3.8 4.4 Minor arterials 7.2 7.9 Collectors 20.3 21.5
Urban routes Interstates 5.4 5.0 Other freeways and expressways 8.5 8.2 Other principal arterials 26.3 27.7 Minor arterials 36.1 38.3 Collectors 49.8 52.2a International Roughness Index (IRI) values are based on objective measurements of pavement roughness. A low IRI represents a smooth riding roadway.KEY: IRI = International Roughness IndexSOURCE: U.S. Department of Transportation (USDOT), Federal Highway Administration, as reported in USDOT, Bureau of Transportation Statistics, National Transportation Statistics, table 1-27 (Highway surface condition). Available at www.bts.gov as of March 2017.

1-6
Chapter 1: Extent and Physical Condition of the U.S. Transportation System
rivercrossings.Ruralbridges,includingruralinterstate,accountedforaboutthree-quartersofthetotalbridgenetworkin2016.Butwhenthenumberofruralandurbaninterstatebridgesareextractedfromthetotal,theyrepresentabout9.1percentofallbridgeswhilecarryingthehighestvolumesofmotorvehicletraffic.Texashadthemostbridges,accountingfor8.7percentoftheentireU.S.bridgenetwork,followedbyOhio(4.6percent)andIllinois(4.3percent)[USDOTFHWA2017].
Therehasbeenslowbutsteadyimprovementintheconditionofhighwaybridges,asshownintable1-3.Bridgedeficiencyischaracterizedaseitherstructurallydeficientorfunctionallyobsolete.
Structurallydeficientbridgeshavereducedloadbearingcapacityduetothedeteriorationofoneormorebridgeelements.Suchbridgesarenotnecessarilyunsafe,buttheydorequiremaintenanceandrepairtoremaininservice
andwilleventuallyrequirerehabilitationorreplacement.Functionallyobsoletebridges,whilestructurallysound,oftencarrytrafficvolumesthatexceedtheirdesignlimitsandmayneedtobewidenedorreplaced.
In2016almostone-quarteroftheNation’sbridgeswerestructurallydeficientorfunctionallyobsolete.Thepercentagesofbothstructurallydeficientandfunctionallyobsoletebridgesdeclinedfrom2000to2016,withthelargestdeclinesrecordedforruralbridges(table1-3).Despitetheoverallimprovement,23.1percentofurbanbridgeswerefunctionallyobsoletein2016,versus10.0percentofruralbridges.Bycomparison,5.9percentofurbanbridgeswerestructurallydeficient.
Agealoneisnotanautomaticindicatorofstructuralintegrity.Forexample,the134-year-oldBrooklynBridge,duetoconsistentmaintenanceandseveralmajorrehabilitations,isstilldeemedsafefordailyuse,whiletheI-95
TABLE 1-3 Condition of U.S. Highway Bridges 2000, 2010, and 2014–2016
2000 2010 2014 2015 2016
TOTAL number of bridges 587,135 604,460 610,749 611,845 614,386
Urban 131,778 157,571 166,292 168,753 170,776
Rural 455,357 446,889 444,457 443,092 443,610
All structurally deficient bridges (percent) 15.2 12.0 10.0 9.6 9.1
Urban structurally deficient (percent) 10.2 8.3 6.7 6.3 5.9
Rural structurally deficient (percent) 16.7 13.3 11.3 10.9 10.3
All functionally obsolete (percent) 15.5 14.2 13.8 13.7 13.6
Urban functionally obsolete (percent) 25.2 24.2 23.6 23.4 23.1
Rural functionally obsolete (percent) 12.7 10.7 10.2 10.1 10.0
SOURCES: 2000–2014: U.S. Department of Transportation, Federal Highway Administration, as reported in U.S. Department of Transportation, Bureau of Transportation Statistics, National Transportation Statistics, table 1-28 (Bridges). Available at www.bts.gov as of May 2016. 2015–2016: U.S. Department of Transportation, Federal Highway Administration, National Bridge Inventory. Available at https://www.fhwa.dot.gov/bridge/nbi.cfm as of March 2017.

1-7
Transportation Statistics Annual Report
FIGURE 1-3 Percent of Bridges by Deficiency and Age: 2016
10.2% 17.0%32.1%
43.7%
66.5%
89.8% 83.0%67.9%
56.3%
33.5%
0%
10%
20%
30%
40%
50%
60%
70%
80%
90%
100%
0-25 26-50 51-75 76-100 >100
Bridge age
De�cient bridge
Structually sound bridge
NOTES: U.S. totals include the 50 states, the District of Columbia, and Puerto Rico. Table includes: Rural–Interstate, principal arterial, minor arterial, major collector, minor collector and local roads; Urban–Interstate, other freeways or expressways, other principal arterial, minor arterial, collector, and local roads.
SOURCE: U.S. Department of Transportation, Federal Highway Administration, National Bridge Inventory. Available at https://www.fhwa.dot.gov/bridge/nbi.cfm as of April 2017.
MianusRiverBridgeinConnecticutcollapsedin1983afteronly25yearsofservice.Thetrend,however,isclear—thelikelihoodthatabridgewillbefounddeficientincreaseswiththeageofthebridge(figure1-3).About62percentofdeficientbridgesaremorethan50yearsold,andnearly30percentofbridgesolderthan75yearsareratedasdeficient.
Aprevalentnegativeimpactofbridgedeteriorationistheimpositionofreducedloadlimits.In2016,69,207outofthe614,386totalbridgesintheNationalBridgeInventoryhadsometypeofloadrestriction,comprising11.3percentofallbridgeslisted[USDOTFHWA2017].Theseloadrestrictionscancausecommercialvehicleoperatorstoeitherusetruckswithsmallerpayloadsortakecircuitousroutes,bothofwhichcanincreasedeliverycosts.
Vehicles
Government,businesses,privateindividuals,andnongovernmentalorganizationsownedandoperatedabout264millionmotorvehiclesin2015,upby5.4percentsince2010,anincreasethatoccurredasthecountryslowlyrecoveredfromtherecessionthatbeganinDecember2007(table1-4)[NBER2012].
Motorvehicleregistrationshavegrownatafasterratethanlicenseddriversandthepopulationsince1985(figure1-4).Thisgrowthproducedanincreaseintheaveragenumberofmotorvehiclesownedbyhouseholds.However,comparedtorapidlyindustrializingcountries,U.S.vehicleregistrationshavechangedrelativelylittlesince2005.Forexample,vehicleregistrationsinChinagrewfrom13.4milliontonearly

1-8
Chapter 1: Extent and Physical Condition of the U.S. Transportation System
TABLE 1-4 Motor Vehicles and Travel: 2000, 2010, 2014, and 2015Motor Vehicle Registrations by Type
2000 2010 2014 2015
TOTAL, registered vehicles 225,821,241 250,070,048 260,350,938 263,610,219
Light-duty vehicle, short wheelbase U 190,202,782 187,554,928 189,619,308
Passenger Car 133,621,420 U U U
Motorcycle 4,346,068 8,009,503 8,417,718 8,600,936
Light-duty vehicle, long wheelbase U 40,241,658 52,600,309 53,298,884
Other 2-axle 4-tire vehicles 79,084,979 U U U
Truck, single-unit 2-axle 6-tire or more 5,926,030 8,217,189 8,328,759 8,456,302
Truck, combination 2,096,619 2,552,865 2,577,197 2,746,882
Bus 746,125 846,051 872,027 888,907
TOTAL, average age of all light-duty vehicles (years) 8.9 10.6 11.4 11.5
Passenger cars 9.1 10.8 11.4 11.5
Light trucks 8.4 10.5 11.4 11.5
TOTAL, highway person-miles traveled (PMT) (millions) 4,550,574 4,244,833 4,371,706 4,473,336
Light-duty vehicle, short wheelbase U 2,814,540 2,878,905 2,984,178
Passenger cars 3,107,729 U U U
Motorcycle 15,463 19,941 21,510 21,118
Light-duty vehicle, long wheelbase U 831,912 852,983 844,123
Other 2-axle 4-tire vehicles 851,762 U U U
Truck, single-unit 2-axle 6-tire or more 100,486 110,738 109,301 109,597
Truck, combination 161,238 175,789 169,830 170,246
Bus 313,897 291,914 339,177 344,073
TOTAL, highway vehicle-miles traveled (VMT) (millions) 2,746,925 2,967,266 3,025,656 3,095,373
Light-duty vehicle, short wheelbase U 2,025,745 2,072,021 2,147,840
Passenger cars 1,600,287 U U U
Motorcycle 10,469 18,513 19,970 19,606
Light-duty vehicle, long wheelbase U 622,712 638,484 631,852
Other 2-axle 4-tire vehicles 923,059 U U U
Truck, single-unit 2-axle 6-tire or more 70,500 110,738 109,301 109,597
Truck, combination 135,020 175,789 169,830 170,246
Bus 7,590 13,770 15,999 16,230
KEY: U = Data are unavailable.
NOTE: PMT and VMT for 2000 are not comparable to data for later years. Motor bus and demand response figures are also included in the bus figure for highway.
SOURCES: Vehicle registrations, age, PMT, VMT: U.S. Department of Transportation (USDOT), Federal Highway Administration, Highway Statistics (multiple years), as cited in the USDOT, Bureau of Transportation Statistics, National Transportation Statistics. Tables 1-11, 1-26, 1-35, 1-40. Available at http://www.bts.gov/ as of March 2017.

1-9
Transportation Statistics Annual Report
FIGURE 1-4 Trends of Population, Drivers, Vehicles, and VMT: Indexed 1985–2015
0.8
0.9
1.0
1.1
1.2
1.3
1.4
1.5
1.6
1.7
1.8
1985 1989 1993 1997 2001 2005 2009 2013
Inde
x 19
85=1
Population
Drivers
Vehicles
VMT
KEY: VMT = vehicle-miles of travel
SOURCE: Vehicles and Drivers: U.S. Department of Transportation, Federal Highway Administration, Highway Statistics 2015. Tables DL-1C and MV-1. Available at http://www.fhwa.dot.gov/ as of April 2017. Population: U.S. Census Bureau, Quickfacts, available online at www.census.gov/quickfacts/ as of April 2017. VMT: USDOT, Bureau of Transportation Statistics, National Transportation Statistics, Table 1-35, available at bts.gov as of November 2017.
143millionoverthe2000to2014periodandaccountedforabout11.8percentoftheworldtotal,upfrom1.8percentin2000[USDOEORNL2016].Onaper-capitabasis,theUnitedStateshasabout800vehiclesper1,000people,versusabout100vehiclesper1,000peopleinChina.Increasesinvehicleregistrationsfrom2010to2015variedwidelybyvehicletype(table1-4).Forexample,whileoverallregistrationsgrew5.4percent,registrationsforlight-dutyshort-wheelbasevehicles3remainedvirtuallyunchanged,whilethoseforlargecars,vans,pickuptrucks,andSUVs4increasedby32percent.Motorcycleregistrationsrose7
3Light-dutyshort-wheelbasevehiclesincludespassen-gercars,lighttrucks,vans,andsportutilityvehicleswithawheelbaseequaltoorlessthan121inches(e.g.,FordExplorer).4Light-dutylong-wheelbasevehiclesincludeslargepassengercars,vans,pickuptrucks,andsport/utilityvehicleswithwheelbaseslargerthan121inches(e.g.,DodgeRampickup).
percent,continuingalong-termupwardtrend.Thenumbersofsingle-unitandcombinationtruckregistrationsincreased2.9and7.6percent,respectively.Busregistrationsgrewby5.1percentfrom2010to2015.Busesownedbyschools,churches,andothergroupsaccountedfor71percentofbusregistrationsin2015[USDOTFHWA2016].Lastly,VMThasincreasedatapacethatexceededgrowthintheresidentpopulation,numberofdrivers,andvehicleregistrations(asshowinfigure1-4).
From2010to2015,person-milestraveled(PMT)increasedby5.4percent,thesamerateasvehicleregistrations,andVMTincreasedby4.3percentoverthatperiod.Althoughcommercialvehicles(trucksandbuses)comprisedabout4.6percentofregisteredvehicles,theyaccountedforabout10percentofVMT.BothPMTandVMTarediscussedinmoredetailinchapter2.

1-10
Chapter 1: Extent and Physical Condition of the U.S. Transportation System
ThereisnoorganizeddatabaseontheoperatingconditionofvehiclestravelingontheNation’shighways.Table1-4showsthattheaverageageofthelight-dutyvehiclefleetincreasedby29percentoverthe2000to2015periodandstoodatabout11.5yearsin2015.Thecommercialtruckfleetisevenolder.Theaverageageofacommercialtruckwas14.8yearsin2015,upfrom12.5yearsin2007[IHS2015].5However,ageisnotnecessarilyanindicatorofvehiclecondition.
Parking
TheparkinginfrastructureintheUnitedStatesisbothvastandlargelyunmeasuredatthenationallevel.Parkingspacesrangefromasingledrivewayorcurbsidespotadjacenttoaprivateresidenceuptothousandsofspacesinlargeparkingstructuresathigh-densitydevelopments,suchasurbancenters,airports,anduniversities.WhilethereisnoofficialestimateofthenumberofparkingspacesintheUnitedStates,arecentresearchpaperemploysseveralscenariostoreachamid-rangeestimateontheorderof800to850millionspaces[CHESTER2010].
Onereasonthatnationalestimatesarelackingisthatparkingisinherentlyalocal,mostlyprivate-sectorenterprisethatiswithinthepurviewoflanddevelopers,businesses,andindividualdrivers.Thereare,however,somenationalorstateleveltransportationissuesthatrequiredataonparkingsupply.Forexample,adequatetruckparkingalongmajorfreightcorridorstohelpcommercialvehicleoperators
5IHSAutomotiveacquiredR.L.Polk&Co.in2013andcontinuestheformerPolkautomotiveregistrationsproprietarydataseries.
obtainadequaterestwhileadheringtoFederalhoursofserviceregulationsisamajorhighwaysafetyconcern.InarecentFHWAparkingsurvey,morethan75percentoftruckdriversreportedhavingdifficultyfindingsafeandlegalparkingduringmandatoryrestperiods,andthatnumberincreasedto90percentatnightasdriverswaitfortheirdestinationtoopenandacceptdeliveries[USDOTFHWA2015].Thistopicisdiscussedinchapter6.
Traffic Control Systems
Trafficcontrolfeatures,suchastrafficsigns,signals,andpavementmarkings,areanimportantelementofthehighwaysystem,butthereisnonationaldatabaseontrafficcontrolsystemsandtheircondition.Anestimated311,000trafficsignalshavebeeninstalledintheUnitedStates,withanaggregatepubliccapitalinvestmentof$83billion[NTOC2012].Therearenocomparableestimatesofthenumbersofothertypesoftrafficcontroldevices.
Future Highway Infrastructure and Vehicles
Box1-Adescribesnewdevelopmentsinautomatedhighwaysthatwilltransformhighwayinfrastructureandvehicles.Asautonomousvehicle(AV)on-the-roadtestinghasbecomemorewidespread,manystateshaveconsideredenactingregulationstoaddressthepotentialimpactsofthesevehiclesontheirroads,particularlywhenAVsorconnectedvehicles(CVs)areoperatingintrafficmixedwithnon-equippedvehicles.Since2012atleast41statesandtheDistrictofColumbia(DC)haveconsideredsuchlegislation.AsofSeptember2017,21states

1-11
Transportation Statistics Annual Report
Box 1-A Automated Highways Autonomous Vehicles
Autonomousvehicles(AVs),alsoknownasautomated,self-driving,driverless,orroboticvehicles,arethoseinwhichsomeaspectofvehiclecontrolisautomatedbythecar.InnovationsinAVmayfundamentallytransformhowthecurrenttransportationsystemworks.Thesevehicleshavethepotentialtoincreasesafety,improvemobility,andreduceenvironmentalimpacts.
Manyvehiclesonthemarkettodayalreadyincludesomelevelofautomation.Severalhigh-endvehiclemodelsnowhavenewAVtechnologiesalreadybuiltintothem,includingadaptivecruisecontrol,lanetrackingradarsandsteering,collisionavoidancesystems,globalpositioningsystem(GPS)location,andevensomelimitedself-drivingcapabilities.
SeveralcompanieshavemadeadvancementsinAVtechnology.Since2009,Google’sSelf-DrivingCarprojecthasmadesubstantialprogressinAVtechnologyandtestinginrealworldscenarios.Todate,the23vehiclesinitsself-drivingcartestinghavetraveledover1millionmilesonroadsinTexasandCalifornia.BMW,Toyota,Audi,Volkswagen,andTeslaareafewofthecarmanufacturersthatarealsomakingsubstantialprogressinAVtechnologies.
Inrecognitionofthesedevelopingtechnologies,USDOT’sNationalHighwayTrafficSafetyAdministration(NHTSA)recentlyadoptedtheSocietyofAutomotiveEngineers’levelsforautomateddrivingsystems,whichrangefromcompletedrivercontrol(Level0)tofullautonomy(Level5).Theprojectsoughttostudy
transfersofcontrolbetweenthedriverandautomatedvehiclesatconditional,orLevel3,automation.Atthisleveldriverscanshiftboththephysicalandmentalaspectsofdrivingtotheautomateddrivingsystembutcanstillinterveneifnecessary[ITSJPO2015].
Connected Vehicles
Connectedvehicles(CVs)arethosethatcancommunicatewith:
• eachother,usingvehicle-to-vehicle(V2V)communications;
• roadsidedevicessuchastrafficsignals,usingvehicle-to-infrastructure(V2I)communications;and
• non-motorizedentitiessuchassmartphones,usingvehicle-to-anything(V2X)communications.
ThisisincontrastwiththeAVsdiscussedabove,whichuseanarrayofsensorstodetectvehiclesandobstacles,anddonotrelyoncommunicationwithothervehicles.
Asystemofconnectedautonomousvehicles(CAVs)willhelpmakestridesinsafetyandmobility.Insuchasystemofconnectedautomation,AVstakeadvantageofCVtechnologytoobtaingreatersituationalawareness.TheNationalHighwayTrafficSafetyAdministration(NHTSA)isalreadyworkingonaregulatoryproposaltorequireCVtechnologydevicesinlightvehicles,withplanstofollowupwithasimilarrulingforheavyvehicles[SMITH2016].

1-12
Chapter 1: Extent and Physical Condition of the U.S. Transportation System
FIGURE 1-5 Autonomous Vehicle Legislation by State: 2017
AL
AR
CA
CT
FL
GA
ID
IL IN
KSKY
MD
MA
MN
MS
NE
NJ
NM
NY
NC
OH
OR
SC
SD
TN
VA
WA
WV
MT
PA
WI
AZ
CO
DE
IA
LA
ME
MI
MO
ND
OK
NV
NH
TX
UT
VT
WY
AK
HI 0 100 Miles0 200 Miles 0 100 Miles
RI
DC
Autonomous Vehiclelegislation
LegislationExecutive OrderNone
AL
AR
CA
CT
FL
GA
ID
IL IN
KSKY
MDMD
MA
MN
MS
NE
NJ
NM
NY
NC
OH
OR
SC
SD
TN
VA
WA
WV
MT
PA
WI
AZ
CO
DEDE
IA
LA
ME
MI
MO
ND
OK
NV
NH
TX
UT
VT
WY
AK
HI 0 100 Miles0 200 Miles 0 100 Miles
RI
DC
Autonomous Vehiclelegislation
LegislationExecutive OrderNone
SOURCE: National Conference of State Legislators, Autonomous Vehicles Legislative Database, available at http://www.ncsl.org/research/transporta-tion/autonomous-vehicles-self-driving-vehicles-enacted-legislation.aspx as of July 2017.
andtheDistrictofColumbiahaveenactedsuchlaws,andthegovernorsof5stateshaveissuedexecutiveordersrelatedtoAVs(figure1-5).Box1-Bhighlightsvarioustestsandpilotsofautonomousvehicleandconnectedvehicletechnologydeployments.
Public TransitPublictransitprovided10.6billionunlinkedtripsin2015,upby1.85billion(21.2percent)overthe2000total.About900urbantransitagenciesandmorethan1,400ruralandtribalgovernmenttransitagenciesofferarange
oftraveloptions,includingcommuterrail,subway,andlight-rail;transitandtrolleybus;andferryboat.Busesaccountedfornearlyhalf(about47.3percent)ofthe136,000transitvehiclesin2015(table1-5).In2015thesetransitagenciesoperatedover5,200stations,80percentofwhichcomplywiththeAmericans with Disabilities Act(Pub.L.101-336),and2,400maintenancefacilities.Transitagenciesvarywidelyinsize,rangingfrom1to12,800vehicles(e.g.,theNewYorkCityMetropolitanTransportationAuthority)[USDOTFTA2016].

1-13
Transportation Statistics Annual Report
Box 1-B On-the-Road Connected Vehicle Test ProgramsTestdeploymentsofconnectedvehicle(CV)technologyhavebeenunderwaysince2012inMichigan,NewYork,Wyoming,andFlorida,assummarizedbelow.
AnnArbor,MIAsafetypilotmodeldeploymentprogramtotestvariousvehicle-to-vehicle(V2V)andvehicle-to-infrastructure(V2I)technologieswasconductedinAnnArbor,Michiganin2012.Thetestinvolved73milesofinstrumentedroadwaywith27roadsideunitsandover2,800vehiclesequippedwithavarietyofdevices.DatawerecollectedforoneyeartosupportNationalHighwayTrafficSafetyAdministration’sdecision-making,andtheprojecthassincetransitionedtopublicroadsforadditionaltesting.
USDOT Connected Vehicle Pilot Deployment Program
InSeptember2015,USDOTawardedcompetitivegrantstothreeconsortialedbypublicagenciestoconductthreeverydifferentCVdeploymenttests.
NewYorkCity
• TheNewYorkCityDOT(NYCDOT)projectareaencompassesthreedistinctareasintheboroughsofManhattanandBrooklyn.Approximately5,800cabs,1,250MetropolitanTransportationAuthoritybuses,400commercialfleetdeliverytrucks,and500CityvehiclesthatfrequenttheseareaswillbefitwiththeCVtechnology.UsingDedicatedShortRangeCommunication(DSRC),thedeploymentwillincludeapproximately310signalizedintersectionsforV2Itechnology.Inaddition,NYCDOTwilldeployapproximately44roadsideunits(RSUs)atstrategiclocationsthroughouttheCitytosupportsystemmanagementfunctions.Asacitybustlingwithpedestrians,thepilotwillalsofocusonreducing
vehicle-pedestrianconflictsthroughin-vehiclepedestrianwarnings,andapproximately100pedestrianswillbeequippedwithpersonaldevicestoassisttheminsafelycrossingthestreet.
Wyoming
• WyomingDOT(WYDOT)willtestV2VandV2Isystemstoaidfreightmovementonthe402milesofI-80insouthernWyoming,througharangeofadvisoriesincludingadverseweatherandotherroadsidealerts,parkingnotificationsanddynamictravelguidance.Approximately75RSUsthatcanreceiveandbroadcastmessageusingDSRCwillbedeployedalongvarioussectionsofI-80.WYDOTwillequiparound400vehicles,acombinationoffleetvehiclesandcommercialtruckswithon-boardunits(OBUs).Atleast150ofthesevehicleswillbeheavytrucksthatareexpectedtoberegularusersofI-80.Inaddition,100WYDOTfleetvehicles,snowplowsandhighwaypatrolvehicles,willbeequippedwithOBUsandmobileweathersensors.
Florida
• InFlorida,theTampa-HillsboroughExpresswayAuthority(THEA)willdeployavarietyofV2VandV2IapplicationsontheSelmonReversibleExpressLanes(REL)torelievecongestion,reducecollisions,andpreventwrongwayentryattheRELexit.THEAalsoplanstouseCVtechnologytoenhancepedestriansafety,speedbusoperationsandreduceconflictsbetweenstreetcars,pedestriansandpassengercars.TheTHEACVPilotwillemployDSRCtoenabletransmissionsamongapproximately1,600cars,10buses,10trolleys,500pedestrianswithsmartphoneapplications,andapproximately40RSUsalongcitystreets.
Overall,includinglocationsnotmentionedabove,therearecurrently20communitiesmovingforwardwithalmost$350millioninadvancedtechnologyinvestmentsbyUSDOT[ITSJPO2017].

1-14
Chapter 1: Extent and Physical Condition of the U.S. Transportation System
TABLE 1-5 Transit Vehicles and Ridership: Revenue Years 2000, 2010, 2014, and 20152000 2010 2014 2015
TOTAL, transit vehicles 106,136 135,808 131,974 135,641
TOTAL, rail transit vehicles 17,114 20,374 20,172 20,366 Heavy rail cars 10,311 11,510 10,551 10,737 Commuter rail cars and locomotives 5,497 6,768 7,177 7,151 Light rail cars 1,306 2,096 2,444 2,478
TOTAL, non-rail transit vehicles 89,022 115,434 111,802 115,275 Motor bus 59,230 63,679 62,449 64,184 Demand response 22,087 33,555 31,359 32,490 Ferry boat 98 134 144 145 Other 7,607 18,066 17,850 18,456
Average age of vehicles Heavy-rail passenger cars 22.9 18.7 20.4 22.2 Commuter-rail passenger coaches 16.9 18.9 18.8 19.5 Light-rail vehicles 16.1 16.8 16.7 17.3 Full-size transit buses 8.1 7.9 7.2 7.4 Transit vans 3.1 3.4 3.5 3.4 Ferry boats 25.6 20.5 23.8 22.8
TOTAL, transit person-miles traveled (PMT) (millions) 45,100 52,670 57,013 56,109
TOTAL, rail transit PMT 24,583 29,353 32,614 32,804 Heavy rail 13,844 16,407 18,339 18,400 Commuter rail 9,400 10,774 11,600 11,759 Light rail 1,339 2,173 2,675 2,645
TOTAL, non-rail transit PMT 20,517 23,317 24,399 23,305 Motor bus 18,999 20,739 21,587 20,390 Demand response 588 874 864 929 Ferry boat 298 389 414 492 Other 632 1,315 1,534 1,493
TOTAL, Transit Unlinked Passenger Trips (UPT) (billions) 8.72 9.96 10.51 10.57
TOTAL, rail transit UPT 3.36 4.47 4.9 4.92 Heavy rail 2.63 3.55 3.93 3.89 Commuter rail 0.41 0.46 0.49 0.49 Light rail 0.32 0.46 0.48 0.54
TOTAL, non-rail transit UPT 5.36 5.49 5.61 5.65 Motor bus 5.16 5.24 5.04 5.31 Demand response 0.07 0.1 0.1 0.17 Ferry boat 0.05 0.06 0.06 0.07 Other 0.08 0.1 0.4 0.1NOTES: Motor bus includes Bus (MB), Commuter Bus (CB), Bus Rapid Transit (RB), and Trolley Bus (TB). Light Rail includes Light Rail (LR), Streetcar Rail (SR), and Hybrid Rail (YR). Demand response includes Demand Response (DR) and Demand Response Taxi (DT). Other includes Alaska railroad, automated guideway transit, cable car, inclined plane, monorail, and vanpool. Unlinked passen-ger trips is the number of passengers who board public transportation vehicles. Passengers are counted each time they board vehicles no matter how many vehicles they use to travel from their origin to their destination.SOURCES: Transit vehicles: U.S. Department of Transportation (USDOT). Federal Transit Administration (FTA). National Transit Da-tabase (NTD) as cited in USDOT. Bureau of Transportation Statistics (BTS). National Transportation Statistics (NTS). Tables 1-11 and 1-29. Available at http://www.bts.gov/ as of March 2017. Person-miles traveled: USDOT/FTA/NTD as cited in USDOT/BTS/NTS. Table 1-40. Available at http://www.bts.gov/ as of March 2017. Unlinked passenger trips: USDOT/FTA/NTD, Table 19. Available at http://www.ntdprogram.gov/ as of March 2017.

1-15
Transportation Statistics Annual Report
Theaverageageoftransitvehiclesfrom2000to2015isshownintable1-5.Commuterrailpassengercoacheshadthegreatestincreaseinaverageageofallrailvehiclesoverthatperiodandareamongtheoldestofalltransitequipment.Theheavy-railcarfleetagedecreasedby0.7yearsbetween2000and2015,butwasstill22.2yearsoldonaverage.Light-railvehicleshadanaverageageof16to17yearsandtransitbuses7to8yearsoverthereportingperiod,indicatingthatmanytransitagenciesretiredandreplacedoldervehiclesonaregularbasisoraddednewvehiclestothefleet.Thetransitbusfleetremainedconsiderablynewerthantherailfleet,whichhaslocomotivesandcarsthattypicallylastfordecades.Theaverageageofferryboatsdroppedby2.8years,buttheyremainedtheoldestpartofthetransitvehiclepopulation.
In2015transitridersmade10.6billiontripsandtraveled56.1billionmiles,anincreaseof6.5and8.2percent,respectively,since2010(table1-5).Railtransit(heavy,commuter,andlightrail)comprisedonly15percentofthetransitvehicles,butaccountedfor46.5percentoftransittripsand58.5percentofperson-milestraveled.Busesrecordedthehighestshareoftransittrips,50.2percent,and36.3percentoftheperson-miles.Becausebuspassengerstakeshortertripsandbusesoperateatlowerspeedscomparedtoothermodes,theycarrylessthantwo-fifthsofallperson-milestraveled.Conversely,railvehiclesprovideonly15percentofvehiclerevenuehoursofservice.Duetolongertripsandhigherspeeds,railcarries55percentofallperson-milestraveledontransit[APTAFactBook2015].Thenatureofdemand-responsesystems,whicharelargelysocialserviceagencytripproviders,isclearly
showninthetable.Thesesystemsoperated24.0percentoftransitvehiclesin2015,butprovided1.6percentoftripsand1.7percentofperson-miles.
AccordingtoUSDOT’sBiennialConditionsandPerformancereport,thecurrenttotalinvestmentacrossalltransitsystemsisabout$16.9billionannually.Bringingallsystemstoastateofgoodrepairwouldrequireanincreaseto$17.0billionperyear,withallspendinggoingtosystempreservationandnonetoserviceexpansion(whichiscurrently$7.1billionperyear).However,increasingsystemcapacitytoaccommodatehighertransitridershipwouldrequireanestimated$22.8billiontosupporta1.4percentannualridershipgrowthrate,versusanestimated$26.4billiontosupporta2.2percentannualridershipgrowthrate[USDOTFHWAandFTA2015].Inbothofthesegrowthscenarios,annualspendingonsystempreservationwouldbemorethan$16billion.
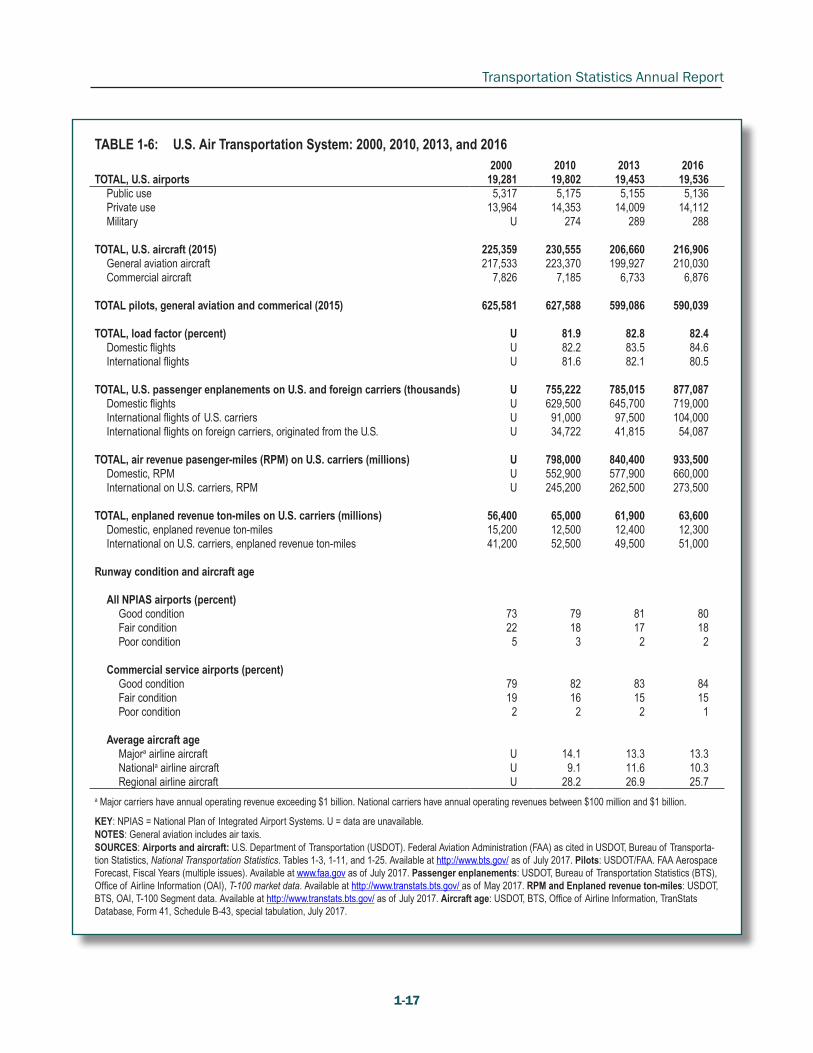
AviationThemainelementsoftheaviationsystemincludeairportrunwaysandterminals,aircraft,andairtrafficcontrolsystems.Table1-6showsthatin2016theUnitedStateshadabout19,500airports,rangingfromruralgrasslandingstrips,tourbanrooftopheliports,tolargepavedmultiple-runwayairports.Mostofthe5,136public-usefacilitiesaregeneralaviationairports,servingawiderangeofusers.Inaddition,therearemorethan14,100privateairports,whicharerelativelysmall.
U.S.airportshandledabout5.6millioncommercialairlineflightsin2016,downabout3.6percentfromtheprior2years.Figure1-6showspassengerboardingsatthetop50U.S.

1-16
Chapter 1: Extent and Physical Condition of the U.S. Transportation System
airportsin2016.Theseairportsaccountedfor84.9percent(about652million)oftheU.S.passengerenplanementsin2016.ThenumberofU.S.airportswithnonstopinternationalserviceincreasedfrom72in1993to123in2016,offeringmorelocationsthroughoutthecountrywithcommercialairservicetotheworld.Severalcarriersstoppedorstartednonstopinternationalservice,thusthetotalnumberofairportswithnonstopinternationalserviceisdownslightlyfrom128in2015.Forexample,
AtlanticCity,NJ,Charleston,SC,andBangor,ME,discontinuedthatservicein2016[USDOTBTS2016a].
TheFederalAviationAdministration(FAA)compilesdataonrunwaypavementconditions.Mostairportpavements(commercialservice,reliever,andselectgeneralaviation)wereingoodconditionbetween2000and2016,withonly2percentratedaspoor(table1-6).Therearenosimilardataforotherelementsofaviationinfrastructure.
FIGURE 1-6 Passengers Enplaned on U.S. Flights at the Top 50 US Airports: 2016
PHX
LAX
OAK
SMF
SAN
SFO SJC
SNA
DENDCADCAIAD
FLLRSW
MIA
MCO
TPA
ATL
MDWORD
IND
MSY
BOS
BWIBWI
DTW
MSP
MCI
STL
CLTRDU
EWR
LAS
JFK
LGALGA
CLE
CMH
PDX
PHLPIT
BNA
AUS
DFWDAL
HOU
IAH
SAT
SLC
SEA
MKE
HNL
0 100 Miles0 200 Miles 0 100 Miles
3 million
Number of enplanements
10 million
47 million25 million
NOTES: Includes passengers enplaned on U.S. carrier scheduled domestic service.
SOURCE: U.S. Department of Transportation, Bureau of Transportation Statistics, Office of Airline Information, T-100 Market Data, available at www.transtats.bts.gov as of May 2017.
1-17
Transportation Statistics Annual Report
TABLE 1-6: U.S. Air Transportation System: 2000, 2010, 2013, and 20162000 2010 2013 2016
TOTAL, U.S. airports 19,281 19,802 19,453 19,536 Public use 5,317 5,175 5,155 5,136 Private use 13,964 14,353 14,009 14,112 Military U 274 289 288
TOTAL, U.S. aircraft (2015) 225,359 230,555 206,660 216,906 General aviation aircraft 217,533 223,370 199,927 210,030 Commercial aircraft 7,826 7,185 6,733 6,876
TOTAL pilots, general aviation and commerical (2015) 625,581 627,588 599,086 590,039
TOTAL, load factor (percent) U 81.9 82.8 82.4 Domestic flights U 82.2 83.5 84.6 International flights U 81.6 82.1 80.5
TOTAL, U.S. passenger enplanements on U.S. and foreign carriers (thousands) U 755,222 785,015 877,087 Domestic flights U 629,500 645,700 719,000 International flights of U.S. carriers U 91,000 97,500 104,000 International flights on foreign carriers, originated from the U.S. U 34,722 41,815 54,087
TOTAL, air revenue pasenger-miles (RPM) on U.S. carriers (millions) U 798,000 840,400 933,500 Domestic, RPM U 552,900 577,900 660,000 International on U.S. carriers, RPM U 245,200 262,500 273,500
TOTAL, enplaned revenue ton-miles on U.S. carriers (millions) 56,400 65,000 61,900 63,600 Domestic, enplaned revenue ton-miles 15,200 12,500 12,400 12,300 International on U.S. carriers, enplaned revenue ton-miles 41,200 52,500 49,500 51,000
Runway condition and aircraft age
All NPIAS airports (percent) Good condition 73 79 81 80 Fair condition 22 18 17 18 Poor condition 5 3 2 2
Commercial service airports (percent) Good condition 79 82 83 84 Fair condition 19 16 15 15 Poor condition 2 2 2 1
Average aircraft age Majora airline aircraft U 14.1 13.3 13.3 Nationala airline aircraft U 9.1 11.6 10.3 Regional airline aircraft U 28.2 26.9 25.7a Major carriers have annual operating revenue exceeding $1 billion. National carriers have annual operating revenues between $100 million and $1 billion.
KEY: NPIAS = National Plan of Integrated Airport Systems. U = data are unavailable. NOTES: General aviation includes air taxis. SOURCES: Airports and aircraft: U.S. Department of Transportation (USDOT). Federal Aviation Administration (FAA) as cited in USDOT, Bureau of Transporta-tion Statistics, National Transportation Statistics. Tables 1-3, 1-11, and 1-25. Available at http://www.bts.gov/ as of July 2017. Pilots: USDOT/FAA. FAA Aerospace Forecast, Fiscal Years (multiple issues). Available at www.faa.gov as of July 2017. Passenger enplanements: USDOT, Bureau of Transportation Statistics (BTS), Office of Airline Information (OAI), T-100 market data. Available at http://www.transtats.bts.gov/ as of May 2017. RPM and Enplaned revenue ton-miles: USDOT, BTS, OAI, T-100 Segment data. Available at http://www.transtats.bts.gov/ as of July 2017. Aircraft age: USDOT, BTS, Office of Airline Information, TranStats Database, Form 41, Schedule B-43, special tabulation, July 2017.

1-18
Chapter 1: Extent and Physical Condition of the U.S. Transportation System
Table1-6showsaverageagesofU.S.commercialairlineaircraftforselectedyearsbetween2000and2016.Theaircraftflownbymajorandnationalairlinesareroughlyhalftheageofsmallerplanesusedbyregionalairlines.Overall,theaircraftfleetbecameabityoungerbetween2013and2016.Therearenopublicdatatoindicatethephysicalconditionoftheaircraftfleet.
TheFAAisamidamajorefforttoupgradetheU.S.airtrafficcontrolsystemtoincreaseitscapacity.CurrenteffortsarefocusedondevelopingtheNextGenerationAirTransportationSystem(NextGen),whichwillutilizeglobalpositioningsystemsatellitetechnologyandrelatedcommunicationsandinformationtechnologyimprovements.
NewapproachproceduresusingtheWideAreaAugmentationSystem(WAAS)willincreaseaccesstogeneralaviationairports,especiallyduringlowvisibility.TheFAAhaspublished3,767WAAS-enabledapproachproceduresat1,832airportsasofFebruary2017[USDOTFAA2017].
RailroadsTheUnitedStateshadabout138,000railroadroute-milesin2015[AAR2016],includingroughly93,600milesownedandoperatedbythesevenClassIrailroads.6Amtrak,local,andregionalrailroadsoperatedtheremaining44,000miles.ClassIrailroadsprovidedfreighttransportationusingover26,000locomotives
6IncludesBNSFRailway,CSXTransportation,GrandTrunkCorp.(CanadianNationaloperationsintheUnit-edStates),KansasCitySouthern,NorfolkSouthern,SooLine(CanadianPacificoperationsintheUnitedStates),andUnionPacific.
and1.56millionrailcars(table1-6).Thisislargelyduetotheincreasednumberofhopperandtankcarsenteringservice.Averagefreightcarcapacitywasabout93tonsin2000,andreached103tonsduring2013–2015duetoconstructionoflargercarsandamixofdifferentcartypes.
Overthepast50years,ClassIrailroadsandconnectingfacilitieshavedevelopedincreasinglyefficientwaystocarryandtransfercargo(e.g.,largercarsasnotedabove,double-stackcontainerrailcars,andon-dockrail),allowingmorecargotobecarriedwithfewerrailcars.Figure1-7showsthatthesystemmileageofClassIrailroadsin2015waslessthanone-halfthemileagein1960.However,freightrailton-milestripledto1.8trillionduringthesameperiod(despiteadeclineduringthelastrecession).
Intercity Passenger Rail
TheNationalRailPassengerCorp.(Amtrak)istheprimaryoperatorofintercitypassengerrailserviceintheUnitedStates.Amtrakoperated21,300route-milesin2016andmorethan500stationsthatserved46statesandWashington,DC.Figure1-8ashowsthetop25stationsbyridershipacrossthecountry,andfigure1-8bshowsthestationsbyridershipintheNortheastCorridor(NEC).RidershipwasalsohigharoundChicagoaswellasatseverallocationsinCaliforniaandthePacificNorthwest.
Amtrakownsasmallfractionofitsroute-miles,primarily363ofthe457-mileNECbetweenBoston,MA,andWashington,DC,plusthreeothershortersegmentstotaling261miles[Amtrak2016].TheclearmajorityofpassengertrainservicesoutsidetheNECare

1-19
Transportation Statistics Annual Report
TABLE 1-7 Rail Transportation System: Fiscal Years 2000, 2010, and 2013–2015
2000 2010 2013 2014 2015
Equipment and Mileage Operated by Amtrak
Locomotives 378 282 418 428 423
Passenger cars 1,894 1,274 1,447 1,419 1,428
System mileage 23,000 21,178 21,356 21,356 21,358
Stations 515 519 516 518 518
Passengers (millions) 20.9 28.7 30.9 31.0 30.7
Passenger-miles traveled (millions) 5,498 6,420 6,810 6,675 6,536
Equipment and Mileage Operated by Class I
Locomotives 20,028 23,893 25,033 25,916 26,574
Freight cars (million)a 1.56 1.57 1.50 1.52 1.56
Average freight car capacity (tons) 92.7 101.7 103.4 103.3 103.2
System mileage 99,250 95,700 95,235 94,372 93,628
Ton-miles (trillion) 1.47 1.69 1.74 1.85 1.74
New rail and crossties laid
Rail, thousand tons 690 564 620 673 691
Crossties, million 11.5 15.6 16.2 15.4 15.5
Capital expenditures, $ billion
Roadway and structures $4.55 $7.86 $9.32 $10.01 $11.44
Equipment $1.51 $1.91 $3.77 $5.07 $5.97
Total $6.06 $9.77 $13.09 $15.08 $17.41 a Includes totals for Canada and Mexico.
NOTE: Fiscal year ending in September.
SOURCES: Amtrak-Locomotives, Railcars, System mileage, Stations and Passenger-miles travelled: Amtrak as cited in U.S. Department of Transportation (USDOT). Bureau of Transportation Statistics (BTS). National Transportation Statistics (NTS). Tables 1-1,1-7, 1-11, 1-40. Available at http://www.bts.gov/ as of April 2017. Passengers: USDOT, Federal Railroad Administration, Office of Safety Analysis, as cited in USDOT, BTS, Multimodal Transportation Indicators. Available at www.bts.gov as of April 2017. Class I railroads-Locomotives, Freight cars, and System Mileage: Association of American Railroads, Railroad Facts (Annual issues) as cited in USDOT/BTS/NTS. Tables 1-1, 1-11, 1-49. Available at http://www.bts.gov/ as of April 2017. Ton-miles, rail, crossties, and capital expenditures: Association of American Railroads, Railroad Facts (Annual issues), as of April 2017.

1-20
Chapter 1: Extent and Physical Condition of the U.S. Transportation System
FIGURE 1-7 Class I Railroad System Mileage and Ton-miles of Freight: 1960, 1965, 1970–2015
0
50,000
100,000
150,000
200,000
250,000
0
200,000
400,000
600,000
800,000
1,000,000
1,200,000
1,400,000
1,600,000
1,800,000
2,000,000
1960 1965 1970 1975 1980 1985 1990 1995 2000 2005 2010 2015
Syst
em m
ileag
e
Ton-
mile
s (m
illio
ns)
Ton-miles
System mileage
NOTES: Report was every 5 years until 1970.
SOURCE: Association of American Railroads, Railroad Facts, Statistical Highlights (Washington, DC: Annual Issues).
FIGURE 1-8a Top 25 Busiest Amtrak Stations: Fiscal Year 2016
!(
!(
!(
!(
!(
!(
!(
!(
!(
!(
!(
!(!(
!(
!(
!(
!(
!(
!(
!(
!(
!(
!(
!(
!(
!(
!(
!(
!(
!(
!(
!(
!(
!(
!(
!(
!(
!(
!(
!(
!(
!(
!(
!(
!(
!(
!(!(
!(
!(
!(
!(
!(
!(
!(
!(
!(
!(
!(
!(
!(
!(
!(
!(
!(!(
!(
!(
!(!(
!(
!(!(
!(
!(
!(
!(
!(!(
!(
!(
!(
!(
!(
!(
!(
!(!(
!(
!(
!(
!(!(
!(
!(
!(
!(
!(
!(
!(
!(
!(
!(
!(
!(
!(
!(
!(
!(
!(
!(
!(
!(
!(
!(
!(
!(
!(
!(
!(
!(
!(
!(
!(!(
!(
!(
!(
!(
!(!(
!(
!(
!(
!(
!(
!(
!(
!(
!(
!(!(
!(
!(
!(
!(
!(
!(
!(
!(
!(
!(
!(
!(
!(
!(
!(
!(
!(
!(
!(
!(
!(
!(
!(
!(
!(
!(
!(
!(
!(
!(
!(
!(
!(
!(
!(
!(
!(
!(
!(
!(
!(
!(
!(
!(
!(
!(
!(
!(
!(
!(
!(
!(
!(!(
!(
!(
!(
!(
!(
!(
!(!(
!(
!(
!(
!(
!(
!(
!(
!(
!(
!(
!(
!(
!(
!(
!(
!(
!(
!(
!(!(!(
!(
!(
!(
!(
!(
!(
!(
!(
!(
!(
!(
!(
!(
!(
!(
!(
!(
!(
!(
!(
!(
!(
!(
!(
!(
!(!(
!(
!(
!(
!(
!(
!(!(
!(
!(
!(
!(
!(
!(
!(
!(
!(
!(
!(
!(
!(
!(
!(
!(
!(
!(
!(
!(
!(
!(
!(
!(
!( !(
!(
!(
!(
!(!( !(
!(
!(
!(!(
!(
!(
!(
!(
!(
!(
!(
!(!(
!(
!(
!(
!(
!(
!(
!(
!(
!(
!(!(
!(
!(
!(
!(!(
!(
!(
!(
!(
!(
!(
!(
!(
!(
!(!(
!(
!(
!(
!(!(
!(
!(
!(
!(
!(
!(
!(
!(
!(
!(
!(
!(
!(
!(
!(
!(
!(!(
!(
!(
!(
!(
!(
!(
!(
!(
!(
!(
!(
!(
!(
!(
!(
!(
!(
!(!(
!(
!(
!(
!(!(!(
!(
!(
!(
!(
!(
!(!(
!(
!(
!(
!(
!(
!(!(
!(
!(
!(
!(
!(
!(
!(
!(
!(
!(!(
!(
!(
!(
!(
!(
!(
!(
!(
!(
!(
!(
!(
!(!(
!(
!(
!(
!(
!(
!(
!(
!(
!(!(
!(
!(
!(
!(
!(
!(
!(
!(
!(
!(
!(
!(
!(
!(
!(
!(
!(
!(
!(
!(
!(
!(!(
!(!(
!(
!(
!(
!(
!(!(
!(
!(
!(
!(
!(
!(
!(
!(
!(
!(
!(
!(
!(
!(
!(
!(
!(
!(
!(
!(
!(
!(
!(
!(
!(
!(
!(
!(
!(
!(
!(
!(
!(
!(
!(
!(
!(
!(
!(
!(
!(
!(
!(
!(
!(
!(
!(
!(
!(
Los Angeles1,635,039Los Angeles1,635,039
Chicago3,247,117
Chicago3,247,117
San Diego777,352
Sacramento1,051,001Sacramento1,051,001
Portland590,076Portland590,076
Bakersfield491,824Bakersfield491,824
Seattle649,491Seattle649,491
Emeryville581,573Emeryville581,573
Irvine450,732Irvine450,732
Milwaukee597,134597,134
0 100 Miles0 200 Miles 0 100 Miles
See inset figure for details
Top 25 Amtrak station ridership
5 million
1million
10 million
Other Amtrak stationAmtrak rail line
!(
SOURCE: Amtrak, State Fact Sheets, available at www.amtrak.com as of February 2017.

1-21
Transportation Statistics Annual Report
FIGURE 1-8b Amtrak Stations Along the Northeast Corridor: Fiscal Year 2016
!(
!(
!(
!(
!(!(
!(
!(
!(
!(
!(
!(
!(
!(
!(
!(
!(
!(
!(
!(
!(
!(
!(
!(
!(
!(
!(
!(
!(
!(
!(
!(
!(
!(
!(
!(
!(
!(!(
!(
!(
!(
!(
!(
!(
!(!(
!(
!(
!(
!(
!(
!(
!(
!(
!(
!(
!(
!(!(
!(
!(
!(
!(
!(
!(
!(
!(
!(
!(
!(!(
!(
!(
!(
!( !(
!(
!(
!(!( !(
!(
!(
!(
!(
!(
!(
!(
!(
!(
!(
!(
!(
!(
!(!(
!(
!(
!(
!(!(
!(
!(
!(
!(
!(
!(
!(
!(
!(
!(
!(
!(
Boston South1,574,450
Baltimore1,030,161
Philadelphia4,328,718
New York10,436,909
Washington5,098,562
Providence717,537
Newark 661,344Newark 661,344
Wilmington691,694
Boston Back Bay611,527
Lancaster560,257
BWI Airport689,042BWI Airport689,042
Route 128Route 128450,301
New Haven642,471
Harrisburg508,624
Albany-Rensselaer855,176
0 50 Miles
Top 25 Amtrak station ridership
5 million
1million
!(
10 million
Other Amtrak stationAmtrak rail line
SOURCE: Amtrak, State Fact Sheets, available at www.amtrak.com as of February 2017.

1-22
Chapter 1: Extent and Physical Condition of the U.S. Transportation System
providedovertracksownedbyandsharedwiththeClassIfreightrailroads.Hence,theconditionoftheinfrastructureAmtrakusesislargelydependentontheconditionofthehostrailroads,exceptfortheNEC.
Freight Rail
TheU.S.freightrailsystemisprivatelyownedandoperated,andrailcarriersareundernoobligationtoreportfreighttrackconditionstopublicsectoragencies.Thus,universaltrackconditionreportsareunavailable.Railroadsregularlyinspecttheirtrackandperformnecessaryrepairstoensuretracksafety.FederalRailroadAdministration(FRA)regulationsrequirerailroadstomaintaintrackinspectionrecordsandmakethemavailable
toFRAorStateinspectorsonrequest.TheFRA’srailsafetyauditsfocusonregulatorycompliance,andpreventionandcorrectionoftrackdefects.FRApublishesanannualenforcementreport,summarizingthecivilpenaltyclaimsforviolations.InFY2016morethan4,200recommendedtrackviolationswerecitedbyFRAinspectorsorotherrailroadregulators[USDOTFRA2016].
Inaddition,FRA’sAutomatedTrackInspectionProgram(ATIP)utilizesasmallfleetofhighlyinstrumentedtrackgeometryinspectioncarstosurveytensofthousandsofmilesofhigh-trafficdensityandotherhigh-priorityrouteseachyear.Table1-8providesasummaryoftrackinspectionresultsfortheyears2007to2017.TheFRAupgradedtheinspection
TABLE 1-8 Automated Track Inspection Program (ATIP) Exceptionsa per 100 Miles: 2007–20172007 2008 2009 2010 2011 2012 2013 2014 2015 2016 2017
Profile 3.2 2.4 1.9 2.1 2.4 1.4 17.4 9.9 1.5 1.1 0.6 Alignment 1.7 1.4 1.8 2.0 2.0 1.5 18.4 10.6 1.8 2.9 0.6 Gage 5.1 12.2 7.2 3.1 2.1 4.4 5.9 2.1 5.5 1.8 1.1 Crosslevel 2.0 2.0 2.2 1.2 1.3 1.1 6.9 4.0 1.3 0.6 0.6 Warp 4.7 3.7 4.0 2.8 1.8 1.7 10.9 4.6 1.3 0.7 0.9 Runoff 0.4 0.6 0.7 0.6 0.8 0.4 10.0 8.4 0.7 0.5 0.6 Twist 1.8 1.7 1.5 1.3 1.0 0.8 5.6 3.0 U U U Limited Speed 9.9 9.7 8.7 11.8 3.1 2.6 2.5 1.4 2.2 0.9 0.8
Total Per 100 Miles 28.7 33.7 27.9 24.8 14.5 14.1 77.6 44.0 14.3 7.6 4.5
Miles Inspected 59,165 52,997 74,715 83,013 74,541 70,049 62,882 74,202 61,753 86,997 70,848
KEY: ATIP = Automated Track Inspection Program. U = data are unavailable.a Exceptions mean track did not meet normal operation standardsNOTES: The ATIP program does not provide a comprehensive evaluation of the national rail network on an annual basis due to the limited number of surveying cars. Inspection locations vary by year and are prioritized by factors such as safety risk analysis and operation types. The FRA imple-mented upgrades to the inspection and collection technology in the ATIP fleet in 2013 which allowed for increased sensitivity of exception detection. Multiple cars surveying except for 2005. Defects are briefly defined as variations from design values for the following track geometry properties:Profile - rail surface elevationsAlignment - track direction (tangent or curvature)Gage - distance between railsCross-level - elevation difference between the railsWarp - maximum change in cross-level over a specified distanceRunoff - elevation (ramp) difference of a line along the top of the rail is used for the projectionTwist - rate of introduction and removal of cross-level on transitions from straight to curved track alignmentLimited Speed - reduced operating speed due to track geometry constraintsDetailed definitions and standards may be found in U.S. Department of Transportation, Federal Railroad Administration, Track and Rail and Infra-structure Integrity Compliance Manual, July 2012.SOURCE: U.S. Department of Transportation, Federal Railroad Administration, Office of Safety, ATIP Statistics, special tabulation, October 2017.

1-23
Transportation Statistics Annual Report
andcollectiontechnologyintheATIPfleetin2013,whichallowedforincreasedsensitivityofexceptiondetection,soearlierresultsmaynotbecomparabletothoseforthemostrecentyears.Since2013theincidencesofalleighttrackinspectionexceptionshavegenerallytendedtodecreaseovertime.Thenumberoflocationsandmilesinspectedvarybyyearduetothelimitednumberofsurveyingcarsandareprioritizedbyfactorssuchassafetyriskanalysisandoperationtypes.
Theinstallationofnewrailandcrosstiesisoneindicatorofhowtrackconditionsaremaintainedandimproved.TheAssociationofAmericanRailroads(AAR)reportedthatClassIrailroadsreplacedorinstalled691thousandtonsofrailand15.5millioncrosstiesin2015,whichismorethantheannualaverageof546thousandtonsofrailand13.4millioncrosstiesfrom2001to2005(table1-8)[AAR2016].
TheAARalsoprovidesdataontheageofthesevenClassIrailroadlocomotivefleets[AAR2016].Thefleethasbecomeneweroverallsince2000.Thepercentageoflocomotivesthatwerelessthan10yearsoldwas30percentin2015,versusabout33percentin2000,andthemedianagedecreasedfrom17toabout16years.Nocomparablecompilationoftheagedistributionofrailcarsisavailable.
Table1-7showsrailroadcapitalexpenditures,whichtotaled$17.4billionin2015,almosttripledthespendingin2000.Incontrast,revenueton-milesincreased18percentoverthatperiod.Freightrailisaprofit-makingenterprisethatself-fundsitsinvestments,andcarriershaveastrongincentivetomaintain,rehabilitate,andupgradetheirsystemsas
neededtoremaincompetitiveinthemarketplaceandearnreturnsfortheirinvestors.
Ports and Waterways Thereweremorethan8,200U.S.watertransportationfacilities,includingcargohandlingdocks,in2015.Ofthesefacilities,2,000handledbothforeignanddomesticcargo,lessthan80handledforeigncargoonly,andnearly6,100handleddomesticcargoonly.About69percentofcargo-handlingfacilitiesarelocatedonthecoasts—Gulfcoastfacilitiesaccountedfor26.2percentofthetotal,followedbytheAtlanticcoast(21.9percent),andthePacificcoast(20.6percent).Theremaining31.3percentofcargo-handlingfacilitiesaresituatedalongtheGreatLakesorinlandwaterways.Thesefacilitiesareservedbyafleetof40,500domesticvessels—31,500bargesand9,000self-propelledvessels,includingmorethan3,000towboatsusedtomovethebarges[USACEIWRNDC2016].
DamsandnavigationlocksaretwooftheprincipalinfrastructurefeaturesoftheU.S.domesticwaterwaytransportationsystem.Theyenableshallowdraftoperationsonmostrivers.TheprincipalexceptionsaretheLowerMississippiRiverandtheMissouriRiver,whicharefree-flowingbutstillrequiresometypeofhydrologicstructures,suchaslargerockandconcretegroinsandrevetments,tomanagetheflowoftheriverandpreservenavigation.TheU.S.ArmyCorpsofEngineers(USACE)ownsandoperates239lockchambersat193sites,whichaccountformostoftheU.S.inlandnavigationlocks.Theaverageageofalllocksisover64years(table1-9).ATransportationResearchBoardreport[TRB2015]showsthat,whenadjusted

1-24
Chapter 1: Extent and Physical Condition of the U.S. Transportation System
TABLE 1-9 Water Transportation System: 2000, 2010, 2013, and 2014
2000 2010 2013 2014U.S.-Flag privately owned merchant fleet (1,000 GT or over) 282 221 187 179Recreational boats, millions 12.8 12.4 12.0 11.8Lock chambers 276 239 239 239Lock sites 230 193 193 193Waterway facilities (including cargo handling docks) 9,309 8,060 8,231 8,229Ports (handling over 250,000 tons) 197 178 182 183Miles of navigable waterways 25,000 25,000 25,000 25,000Average age of locks, years 50.2 59.5 62.5 63.5
TOTAL, U.S.-flag Vessels 41,354 40,512 39,999 40,082 Barge/non-self-propelled vessels 33,152 31,412 31,081 31,043 Self-propelled vessels 8,202 9,078 8,918 9,039
Age of U.S.-flag vessels, percent < 6 years old 19.6 18.5 19.3 17.7 6 to 10 years old 9.2 11.5 12.1 14.1 11 to 15 years old 5.1 17.0 14.3 12.4 16 to 20 years old 19.6 8.7 13.6 15.1 21 to 25 years old 18.3 4.2 7.7 8.3 > 25 years old 27.7 39.3 32.6 31.9KEY: GT = gross tons.
NOTE: U.S.-Flag privately owned merchant fleet includes only oceangoing self-propelled, cargo-carrying vessels of 1,000 GT and above. Total, Vessels includes unclassified vessels. CFR 33 Part 329 defines the mileage of navigable waterways of the U.S.
SOURCES: Fleet: U.S. Army Corps of Engineers. Waterborne Commerce Statistics Center. Navigation Data Center. Waterborne Transportation Lines of the United States (Annual issues). Available at http://www.navigationdatacenter.us/ as of May 2016. Recre-ational boats: U.S. Department of Homeland Security. Coast Guard. Recreational Boating Statistics as cited in USDOT. BTS. National Transportation Statistics. Table 1-11. Available at http://www.bts.gov/ as of May 2016. Waterways and Vessels: U.S. Army Corps of Engineers. Institute for Water Resources. Navigation Data Center. The U.S. Waterway System: Transportation Facts and Information (Annual issues). as cited in USDOT. BTS. National Transportation Statistics. Tables 1-1 and 1-11. Available at http://www.bts.gov/ as of May 2016. Locks, Facilities, and Seaports: U.S. Army Corps of Engineers. Institute for Water Resources. Navigation Data Center. General Characteristics of Locks, and The U.S. Waterway System: Transportation Facts and Information (Annual issues). Available at http://www.navigationdatacenter.us/ as of May 2016.
forthedatesofmajorrehabilitationprojects,theeffectiveaverageageoflocksisabout10yearsless,butthatstillputstheaverageageatover50years.TheUSACEmaintainscomprehensivedataonlocktraffic,lockagetimeanddelay,andlockoutagesforwaterwayperformanceanalysis.
Table1-10providesdataonrepresentativemainlockchambersthroughouttheinlandwaterwaysystem.Thesedatashowsomeoftherelationshipsbetweenlockageand
performancefactors,suchastowdelayandmainlockchamberdowntime.Forexample,theEmsworthLockontheOhioRiver,closetotheheadofnavigationnearPittsburgh,isoneoftheoldeststructuresinthesystemandisconsideredfunctionallyobsoleteinthatithandlestowslongerthanits600-footdesignlimit.Ithaslockchambersdesignedforvesselsofanearliereraandhaslengthyout-of-servicedelays.ThenewerlocksontheOhioRiver,suchasJohnT.MyersnearUniontown,KY,are1,200-feetlong

1-25
Transportation Statistics Annual Report
andhaverelativelylowaveragetowdelaysandonlyshort-durationserviceoutages.Lock52ontheOhioRiver,located23milesupstreamfromtheconfluenceoftheOhioandMississippiRiversatCairo,IL,isthebusiestandalsooneoftheoldest,withchambersthatare47and88yearsold,respectively.7Ithadoneofthehigheraveragetowdelaysintheentireinlandwaterwaysystemin2016,at3.7hourspertow(asshowninfigure1-9),whichisabouthalfthedelaypertowin2015.
OntheUpperMississippiRiver,theMelvinPriceLock,whichis17milesnorthofSt.
7OhioRiverLocks52and53willbereplacedbythenewOlmstedLock,whichispresentlyunderconstruction.
Louis,MO,hasthetwonewestlockchamberslistedintable1-10.Itpassesover60milliontonsoffreightperyearwithmoderatedelayanddowntime.Just15milesdownstream,ChainofRocksLock27,withtwoidenticalsizebutmucholderchambers(64years),hasanaveragetowdelayofnearly2½hours.TheInnerHarborNavigationLock,inNewOrleans,isoneoftheprincipalbottlenecksintheGulfIntracoastalWaterway.Thesmallchambersizeofthe94-year-oldlockresultsinanaveragetowdelayofmorethan16hours(asshownintable1-10)eventhoughthenumberofoutageshasdecreased,thehoursofdowntimeincreasedin2016.
TABLE 1-10 Selected Inland Waterway Lock Characteristics: 2016Main lock chamber only Outages in 2016b
RiverRiver milea Lock Name
Length, feet
Width, feet
Age, years
Tons in 2016, millionsb Number Hours
Avg. hr. per outage
Avg. delay per tow, hr b
Ohio 6.2 Emsworth Lock & Dam Aux. 360 56 96
Ohio 6.2 Emsworth Lock & Dam 600 110 96 11.0 37 1,147 31.00 2.04
Ohio 846 John T. Myers Lock & Dam Aux. 600 110 42
Ohio 846 John T. Myers Lock & Dam 1,200 110 42 47.8 75 326 4.35 0.70
Ohio 938.9 Lock & Dam 52 Aux. 600 110 89
Ohio 938.9 Lock & Dam 52 1,200 110 48 70.7 22 60 2.73 3.71
Mississippi 200.8 Melvin Price Lock & Dam Aux. 600 110 23
Mississippi 200.8 Melvin Price Lock & Dam 1,200 110 27 63.7 12 47 3.92 2.18
Mississippi 185.5 Chain of Rocks L/D 27 Aux. 600 110 64
Mississippi 185.5 Chain of Rocks L/D 27 1,200 110 64 68.2 4 2 0.50 2.47
GIWW East 7 Inner Harbor Navigation Canal Lock 640 75 94 9.9 227 4,440 19.56 16.59
Columbia 292 McNary Lock & Damc 675 86 64 5.4 2 3 1.33 0.23a Miles from the 0.0 milepoint reference location, usually at the mouth of the river, except on the Ohio River where mile 0.0 is at the source of the river at Pittsburgh, PA.
b Includes all lock chambers at sites with more than one chamber. c McNary Lock outage data are for 2015, since 2016 data are unavailable.
KEY: Aux = Auxiliary; GIWW = Gulf Intracoastal Waterway; L/D = Lock & Dam; N/A = Not Applicable.
SOURCES: U.S. Army Corps of Engineers, Institute for Water Resources, Navigation Data Center, Locks by Waterway, Tons Locked by Commodity Group, CY 1993 - 2016. Available at http://www.navigationdatacenter.us/lpms/cy2013comweb.htm as of May 2017. U.S. Army Corps of Engineers, Institute for Water Resources, Navigation Data Cen-ter, Locks by Waterway, Lock Usage, CY 1993 - 2016. Available at http://www.navigationdatacenter.us/lpms/lock2013web.htm as of May 2017. U.S. Army Corps of Engineers, Institute for Water Resources, Navigation Data Center. Locks by Waterway, Lock Unavailability, CY 1993 - 2016. Available at http://www.navigationdatacenter.us/lpms/data/lock2013webunavail-021914.htm as of May 2017. U.S. Army Corps of Engineers, Institute for Water Resources, Navigation Data Center, Lock Characteristics General Report. Available at http://www.navigationdatacenter.us/lpms/pdf/lkgenrl.pdf as of May 2017.

1-26
Chapter 1: Extent and Physical Condition of the U.S. Transportation System
FIGURE 1-9 Average Hours Delayed per Tow for Selected Inland Waterway Locks: 2015 and 2016
0
2
4
6
8
10
12
14
16
18
Emsworth John T. Myers Lock & Dam 52 Melvin Price Chain of Rocks 27 Inner Habor
Ave
rage
hou
rs d
elay
ed
2016 2015
NOTE: The average delay time, expressed in hours, calculated only for tows that experienced a wait in passing through the lock chamber.
SOURCE: U.S. Army Corps of Engineers, Institute for Water Resources, Navigation Data Center, Usage Reports, CY 1993 - 2016. Available at http://www.navigationdatacenter.us/lpms/ as of November 2017.
Shallowanddeep-draftportsandchannelsareotherimportantinfrastructureelementsofthewaterwaysystem.Thereareseveralthousandinlandriverportsandterminals.Theclearmajorityofwhichareprivatelyownedandservespecificcargo-handlingneeds(e.g.,coalloadingorpetrochemicaltransfers).Deepdraftportsarelargeandcapital-intensivefacilities,typicallywithextensivedocks,wharves,cranes,warehouses,andothercargotransferequipment,andintermodalconnectionsthatintegrateoceantransportwithinlandconveyance.
Privateterminaloperatorsdonotroutinelyreleasedatapubliclyontheconditionoftheirfacilities.TheUSACEmaintainsanextensivedatabaseofmarineterminals,bothshallowdraftanddeepdraft,butitislargelystaticanddoesnotincludeconditionorperformancedataandsummarytabulations[USDOTBTS2016b].
Toaddressthelimitationsonportperformancedata,BTSwasdirectedtodevelopaportperformancefreightstatisticsprogram.Asnotedinthefirstannualportperformancereport,8[USDOTBTS2016b]defininga“port”ishighlycontextspecific.Insomecases,asinglecargoterminalmaybeaport,orattheotherextremeaportmaycompriseallthecargoterminalsalongmanymilesofwaterfront.The50portslistedintable1-11areamongthetop25U.S.portsfor1ormoreof3measures:totaltonnage,containerTEU(20-footequivalentunits),anddrybulktonnage.Aboutathirdoftheportslistedrankinthetop25bymorethanoneofthesemeasures.
8TheFixing America’s Surface Transportation (FAST)Act(Pub.L.114-94;Dec.4,2015;129Stat.1312)directstheUSDOTBureauofTransportationStatistics(BTS)toestablishaportperformancestatisticsprogram,andsubmitanannualreporttoCongressthatincludesstatisticsoncapacityandthroughputforatleastthetop25ports,asmeasuredbytotalcargotonnage,drybulktonnage,andtwenty-footequivalentunits(TEU)ofcontainershandled.

1-27
Transportation Statistics Annual Report
TABLE 1-11 Top 25 Ports by Tonnage, TEU, and Dry Bulk (2015)
Port Total tonnage TEU Dry bulk tonnageAnchorage, AK •Baltimore, MD • • •Baton Rouge, LA • •Beaumont, TX •Boston, MA •Camden-Gloucester, NJ •Charleston, SC •Chicago, IL •Cleveland, OH •Corpus Christi, TX • •Detroit, MI •Duluth-Superior, MN and WI • •Honolulu, HI •Houston, TX • • •Huntington – Tristate, KY, OH, and WV • •Indiana Harbor, IN •Jacksonville, FL •Juneau, AK •Kalama, WA •Lake Charles, LA •Long Beach, CA • •Longview, WA •Los Angeles, CA • •Miami, FL •Mobile, AL • • •New Orleans, LA • • •New York and New Jersey, NY and NJ • • •Oakland, CA •Pascagoula, MS •Philadelphia, PA •Pittsburgh, PA •Port Arthur, TX •Port Everglades, FL •Port of Plaquemines, LA • •Port of South Louisiana, LA • •Port of Virginia, VA • • •Portland, OR •Ports of Cincinnati and Northern KY, OH and KY • •Richmond, CA •San Juan, PR •Savannah, GA • •Seattle, WA • •St. Louis, MO and IL • •Tacoma, WA •Tampa, FL • •Texas City, TX •Two Harbors, MN •Valdez, AK •Wilmington, DE •Wilmington, NC •
KEY: TEU = twenty-foot equivalent unit.NOTE: Ports are listed in alphabetical order.SOURCE: U.S. Department of Transportation (USDOT). Bureau of Transportation Statistics (BTS). 2016. Port Performance Freight Statistics Program: Annual Report to Congress 2016. Table 4. Available at https://www.rita.dot.gov/bts/sites/rita.dot.gov.bts/files/PPFS_Annual_Report.pdf as of May 2017.

1-28
Chapter 1: Extent and Physical Condition of the U.S. Transportation System
Manyofthecoastalseaportsareservedbypost-Panamaxvessels9thatcontinuetoincreaseinsize.ContainershipscallingatU.S.portshadanaveragecapacityof4,666TEUin2015,anincreaseof32percentfrom3,542TEUin2013[USDOTMARAD2015].Servingthesevesselsefficientlycallsfortheporttohavetherequisitecomplementoflargecontainercranes.Figure1-10showsthenumberofcontainercranesatthetop25containerportsbyTEUintheUnitedStatesin2015.Thisshowsthe
9VesselsexceedingthelengthandwidthofthelockchambersinthePanamaCanal.TheCanalexpansionprojectwascompletedin2016,sovesselsthatexceeditsnewlargerlockchambersizearereferredtoas“newPanamax.”
correlationbetweenthenumberofcontainercranesandTEUhandled.LosAngeles,LongBeach,andNewYork-NewJerseyhavethemostcranesandhandlethemostcontainers.Today’slargestcontainershipscancarryupwardsof18,000TEU.Largervesselsaffordgreatereconomiesofscaleandcostsavings.However,theyrequireinvestmentsinU.S.ports,suchasincreasingbridgeclearances,channeldepths,landsideaccess,andportandterminalinfrastructure[USACEIWR2012].
Thekeycharacteristicofnavigationchannelsthatrelatestoconditioniswhethertheauthorizedchanneldepthisavailable.Nearlyallchannelsneedperiodicdredgingtomaintain
FIGURE 1-10 Number of Container Cranes at the Top 25 Container Ports by TEU: 2015
Virginia
TacomaSeattle
Savannah
Oakland
New York and New Jersey
Los Angeles
Long Beach
Houston
Charleston
0.0
1.0
2.0
3.0
4.0
5.0
6.0
7.0
8.0
9.0
0 10 20 30 40 50 60 70 80 90
Mill
ions
of A
nnua
l TEU
s
Total Container CranesWilmington (NC)
Wilmington (DE)
San Juan
Philadelphia
New Orleans
Mobile
Miami
Juneau
Jacksonville
Honolulu
Everglades
Camden-Gloucester
Boston
Baltimore
Anchorage
0.0
0.5
1.0
1.5
0 5 10 15 20
NOTES: The Port of Juneau uses roll on/roll off operations instead of cranes to move some of the containers.
SOURCE: Multiple sources as published in U.S. Department of Transportation, Bureau of Transportation Statistics, Port Performance Freight Trans-portation Statistics Program: Annual Report to Congress 2016. Figure 13. Available at www.bts.gov as of July 2016.

1-29
Transportation Statistics Annual Report
theauthorizeddepth.MostchanneldredgingoccursundertheauspicesoftheUSACE.In2015USACEdredgesremoved186millioncubicyardsofmaterial,whichmatchedthe2014total,butwasdownfrom197millioncubicyardsdredgedin2013.Maintenancedredgingaccountedfor89percentoftheremovedmaterial;theaveragecostpercubicyardincreased4.7percentto$5.58,a40.5percentincreaseoverthe2013cost[USACEIWRNDC2016].Theyear2015markedthethirdconsecutiveyearthatthetotalamountofmaterialdredgedfellbelowthe238millioncubicyardsdredgedin2012,representingadropof22percentoverthe3-yearperiod.Asnotedabove,manycoastalseaportsareservingpost-Panamaxvessels,whichrequiredredgingofnavigationchannelstomaintainsafeoperations.TheUSACEmaintainsdetaileddredgingdata,butitdoesnotproducesummarytabulationsthatdifferentiatetheworkbydeeporshallowdraftchannels.
U.S.flagvesselsoperateonbothshallowanddeepdraftwaterways,andnumerousforeignflagvesselscallatdeepdraftports.Table1-9providesagedistributionsofU.S.flagvesselsforthe2000to2015period.Thefleetgotabityoungeroverthatperiod.Thepercentofvesselsyoungerthan16yearsincreasedfrom34to44percent.Inlandwaterwaytowboatsandbargesaccountforthelargestshare(85percent)ofU.S.vessels.Towboatsaretheoldestvesselsinthisassemblage;66percentareolderthan25years[USACEIWRNDC2016].Incontrast,bargesareamongtheyoungestvesselsduetoacombinationofretirementandreplacementofolderdrycargobargesandacquisitionofnewtankbarges.ThisislargelyinresponsetotheOil Pollution Act
of 1990(Pub.L.101-380)thatdecreedtankbargesandvesselsmusthavedoublehullsbyJanuary1,2015.
In2015U.S.ferriescarriedanestimated118.9millionpassengersandover25millionvehicles[USDOTBTS2017].Therewere163ferryoperatorsworkingin37states,6inU.S.territoriesand2betweenU.S.andnon-U.S.locations(e.g.,Canada).10TheU.S.ferryfleetcomprised652vessels,609ofwhichwereinactiveservice.NewYorkandCaliforniahadthemostferryvesselswith56and55,respectively.Nearlyallthevesselscarriedpassengers(93.3percent),whilelessthanhalf(42.8percent)carriedvehicles,andlessthanaquartercarriedfreight(19.9percent).Operatorsparticipatinginthe2016NationalCensusofFerryOperatorsreportedthattherewere560terminalsintheU.S.ferrysystemincalendaryear2015.Morethantwo-thirds(69.4percent)hadparkingonsiteornearby,andnearlyone-third(29.5percent)wereaccessiblebylocalbusservice.
PipelinesNaturalgaswastransportedviaabout320,000milesofnaturalgastransmissionandgatheringpipelinesandover2.1millionmilesofnaturalgasdistributionmainandservicepipelinesin2015(table1-12).Thesepipelinesconnectto67millionhouseholdsand5millioncommercialbusinessesaswellasthe1,900electricalgeneratingunitsthatsupplyapproximately25percentofU.S.electricity[AGA2016].Therewereover212,000milesofcrude/refinedoilandhazardousliquid
10Thetotalnumberofoperatorsin2015waslargerthanstatedhere.Thisnumberrepresentsthosewhorespond-edtothecensus.

1-30
Chapter 1: Extent and Physical Condition of the U.S. Transportation System
TABLE 1-12 Pipeline System: 2000, 2010, and 2013–2015
Gas distribution systems mileage 2000 2010 2013 (R) 2014 2015
Distribution, main mileage 1,050,802 1,229,538 1,255,340 1,266,359 1,276,844
Distribution, estimated service mileage 737,298 872,384 894,356 902,896 913,097
TOTAL, gas distribution 1,788,100 2,101,921 2,149,697 2,169,254 2,189,941
Natural gas transmission & gathering systems mileage 2000 2010 2013 (R) 2014 2015
Onshore transmission 293,716 299,343 298,336 297,880 297,343
Offshore transmission 5,241 5,432 4,490 3,925 3,833
TOTAL, transmission 298,957 304,775 302,827 301,804 301,177
Onshore gathering 21,879 12,940 11,288 11,420 11,586
Offshore gathering 5,682 6,699 6,080 6,089 6,193
TOTAL, gathering 27,561 19,640 17,369 17,509 17,748
TOTAL, gas transmission & gathering 326,518 324,415 320,196 319,313 318,925
Hazardous liquid or carbon dioxide systems mileage 2000 2010 2013 (R) 2014 2015
Crude oil U 54,631 61,087 66,813 73,204
Petroleum / refined products U 64,800 63,351 61,767 62,588
Highly volatile liquids U 57,980 62,768 65,787 66,813
CO2 or other U 4,560 5,195 5,276 5,233
Fuel grade ethanol U 16 16 16 15
TOTAL, hazardous liquid or CO2 systems U 181,986 192,417 199,659 208,616
KEY: U = Data are unavailable; R = revised.
SOURCE: U.S. Department of Transportation, Pipeline Hazardous Material Safety Administration. Annual Report Mileage Summary Statistics. Avail-able at http://www.phmsa.dot.gov/ as of April 2017.
pipelinesin2016[USDOTPHMSA2017a],andthissystemcarried2.9billionbarrelsacrosstheUnitedStates,anincreaseof5.9percentover2015[USDOEEIA2017a].
In2016U.S.naturalgasproductionreached26.7trillioncubicfeet(tcf).Pipelinesdeliverabout37.4percentofnaturalgasproductiontopowerplantstoproduceelectricity,29.0percenttotheindustrialsector,11.6percenttothecommercialsector,and16.3percenttohomesforheating[USDOEEIA2017b].
Naturalgascanbeconvertedtoaliquidbycoolingittoatemperatureof-260degreesFahrenheit.Liquefiednaturalgas(LNG)is1/600thofitsgaseousvolume,makingiteasiertotransportbyvesseloverlongdistances.LNGvesselsaredouble-hulledandspecificallydesignedtohandleLNG’slowtemperature,preventdamageorleaks,andlimitLNGevaporation.ShortLNGpipelinesareusedtomovetheproductfromthevesseltospecialLNGterminals.Alaskahasbeentheprincipal

1-31
Transportation Statistics Annual Report
U.S.LNGexporter,primarilytoPacificRimcountries,butthevolumehasbeensmall.TheEnergyInformationAdministrationreportedthatthefirstLNGexportshipmentproducedinthelower48stateswasshippedonFebruary24,2016,fromtheSabinePassLNGterminalinLouisiana.LNGcanalsobetransportedbycryogenictankertrucksandrailwaytankercars[USDOEEIA2016].LNGstoragefacilitiesincreasefrom122in2010to155in2016,increasingU.S.storagecapacityby17.5percent[PHMSA2017b]
ThePipelineandHazardousMaterialsSafetyAdministration(PHMSA)collectsannualreportdatafrompipelineoperators,coveringtheirsystemmileage,commoditiestransported,andinspectionactivities,butthereisnopubliclyavailabledatabasethattrackspipelinecondition.Aseriousfailure,suchastheSantaBarbara,CA,crudepetroleumpipelinespillinMay2014,servesasareminderthatthispartofthetransportationsystemhasthesameproblemswithaginginfrastructureasothermodesprofiledinthischapter.Thenumberofseriouspipelineincidents,whicharethoseinvolvingfatalitiesorinjuries,havetrendeddownwardsince2000,whentherewere62suchincidents,andhaveaveragedabout30incidentsperyearoverthepast5years[USDOTPHMSA2017c].
ChallengesTheU.S.facesacontinuingchallengeofmaintainingsystemconditionsinsufficientlygoodshapetomeettheincreasingmobilityrequirementsoftheAmericaneconomyandsociety.Asindicatedearlier,theconditionoftransportationinfrastructureisimproving,butadditionalimprovementsareneeded.That
said,littleisknownabouttheconditionofprivatelyownedinfrastructure(e.g.,railroadsandpipelines).Theaverageageofallinlandwaterwaynavigationlocksismorethan50years,and9.1percentofhighwaybridgesareconsideredstructurallydeficient.Iftheseandotherconditionissuesarenotaddressed,theycontinuetoaffectsystemperformanceandsafetyinthecomingyears.Anemergingchallengewillbetoretrofitthehighwaysystemwith(largely)electronicandcommunicationstechnologytotransitiontoautomatedhighwaysandconnectedautonomousvehicles.
ReferencesAmericanGasAssociation(AGA).2016.Natural Gas: The Facts.Availableathttps://www.aga.org/asofMay2017.
AmericanPublicTransportationAssociation(APTA),2015 Public Transportation Fact Book,availableathttps://www.apta.com/asofOctober2017.
AssociationofAmericanRailroads(AAR).2016.Railroad Facts.Availableathttps://www.aar.org/asofMay2017.
Chester,M.,A.Horvath,andS.Madanat.2010.ParkingInfrastructure:Energy,Emissions,andAutomobileLife-CycleEnvironmentalAccounting.Environmental Research Letters, 5(3).Availableathttp://iopscience.iop.org/asofMay2017.
IHSAutomotive(IHS).2015.Class8CommercialVehiclesContinuetoDriveOverallU.S.CommercialVehicleDemand.Availableathttp://press.ihs.com/asofMay2017.
1-32
Chapter 1: Extent and Physical Condition of the U.S. Transportation System
NationalBureauofEconomicResearch(NBER).2012.U.S. Business Cycle Expansions and Contractions.Availableathttp://www.nber.org/asofMay2017.
NationalRailroadPassengerCorporation(AMTRAK).2017.National Fact Sheet: FY 2016.Availableathttp://www.amtrak.com/asofMay2017.
NationalTransportationOperationsCoalition(NTOC).2012 National Traffic Signal Report Card Technical Report.InstituteofTransportationEngineers,Washington,DC.Availableathttp://library.ite.org/asofMay2017.
TransportationResearchBoard(TRB).2015.Funding and Managing the U.S. Inland Waterways System: What Policy Makers Need to Know, Special Report 315.TheNationalAcademies,Washington,DC.Availableatwww.trb.orgasofMay2017.
Smith,Egan,PlanningforConnectedAutomatedVehiclesinSmartCities,2016AMPOAnnualConference,FortWorth,TX,October2016.
U.S.ArmyCorpsofEngineers(USACE).InstituteforWaterResources(IWR).NavigationDataCenter(NDC).2016.The U.S. Waterway System: 2015 Transportation Facts and Information.Availableathttp://www.navigationdatacenter.us/asofMay2017.
U.S.ArmyCorpsofEngineers(USACE).InstituteforWaterResources(IWR).2012.U.S. Port and Inland Waterways Modernization Preparing for Post-Panamax Vessels.Availableathttp://www.iwr.usace.
army.mil/asofMay2017.
U.S.DepartmentofCommerce(USDOC).CensusBureau(CENSUS).2017.Quick Facts(QF).Availableathttp://www.census.gov/asofMay2017.
U.S.DepartmentofEnergy(USDOE).EnergyInformationAdministration(EIA).
—2017a.Natural Gas Summary(May).Availableathttps://www.eia.gov/dnav/ng/ng_sum_lsum_dcu_nus_a.htmasofMay2017.
—2017b.Crude Oil and Petroleum Products Movements by Pipeline.Availableathttp://www.eia.gov/asofMay2017.
—2016.GrowthindomesticnaturalgasproductionleadstodevelopmentofLNGexportterminals.Today in Energy(March4).Availableathttp://www.eia.gov/asofMay2017.
U.S.DepartmentofEnergy(USDOE).OakRidgeNationalLaboratory(ORNL).2016.Transportation Energy Data Book.35thedition.Availableathttp://cta.ornl.gov/asofMay2017.
U.S.DepartmentofTransportation(USDOT).BureauofTransportationStatistics(BTS):
—2017.National Census of Ferry Operators(NCFO).Availableathttp://www.bts.gov/asofNovember2017.
—2016a.OfficeofAirlineInformation(OAI).Airlines and Airports.Availableathttp://www.bts.gov/asofMay2017.
—2016b.Port Performance Freight Statistics Program: Annual Report to Congress 2016.

1-33
Transportation Statistics Annual Report
Availableathttps://www.bts.govasofMay2017.
U.S.DepartmentofTransportation(USDOT).FederalAviationAdministration(FAA).2017.WideAreaAugmentationSystem(WAAS)QuickFacts.Availableathttp://www.faa.gov/asofMay2017.
U.S.DepartmentofTransportation(USDOT).FederalHighwayAdministration(FHWA):
—2017.Bridges & Structures; Tables of Frequently Requested NBI Information.Availableatwww.fhwa.dot.gov/asofMay2017.
—2016.2015 Highway Statistics.Availableathttp://www.fhwa.dot.gov/asofMay2017.
—2015.Jason’s Law Public Truck Parking Survey Results and Comparative Analysis.Availableatwww.ops.fhwa.dot.govasofMay2017.
U.S.DepartmentofTransportation(USDOT),IntelligentTransportationSystemsJointProgramOffice(ITSJPO),ConnectedVehiclePilotDeploymentProgram.Availableathttps://www.its.dot.gov/pilots/index.htm,asofMay2017.
U.S.DepartmentofTransportation(USDOT),IntelligentTransportationSystemsJointProgramOffice(ITSJPO),2015-2019AutomationWhitePaper,Washington,DC,undated.Availableathttps://www.its.dot.gov/research_areas/pdf/WhitePaper_automation.pdf,asofMay2017.
U.S.DepartmentofTransportation(USDOT).FederalHighwayAdministration(FHWA)and
FederalTransitAdministration(FTA).2015 Status of the Nation’s Highways, Bridges, and Transit: Report to Congress(Washington,DC).Availableathttps://www.fhwa.dot.gov/policy/2015cpr/asofJuly2017.
U.S.DepartmentofTransportation(USDOT).FederalRailroadAdministration(FRA).Fiscal Year 2016 Enforcement Report. Availableathttps://www.fra.dot.gov/asofOctober2017.
U.S.DepartmentofTransportation(USDOT).FederalTransitAdministration(FTA).2016.National Transit Database:2015 Data Tables.Availableathttp://www.ntdprogram.gov/asofMay2017.
U.S.DepartmentofTransportation(USDOT).MaritimeAdministration(MARAD).2016. 2015 Container Ship Capacities calling at U.S. Container Ports.Availableathttps://www.marad.dot.gov/,asofMay2017.
U.S.DepartmentofTransportation(USDOT),NationalHighwaySafetyAdministration,FederalAutomatedVehiclesPolicy;AcceleratingtheNextRevolutioninRoadwaySafety,Washington,DC,September2016.
U.S.DepartmentofTransportation(USDOT).PipelineandHazardousMaterialsSafetyAdministration(PHMSA):
—2017a.Serious Incidents.Availableathttps://phmsa.dot.gov/asofMay2017.
—2017b.Liquefied Natural Gas (LNG) Facilities.Availableathttps://phmsa.dot.gov/asofOctober2017.
—2017c.Annual Report Mileage.Availableathttps://phmsa.dot.gov/asofOctober2017.
