chapter 1: executive summary the need for a statistical...
TRANSCRIPT

DRAFT FOR CONSULTATION – please do not quote or reference
1
Asia-Pacific Expert Group on Disaster-related Statistics
DRSF DRAFT 2.0 (2nd consultation draft)
DRAFT FOR CONSULTATION – Please Do Not Reference or Quote
Chapter 1: Executive Summary
The Need for a Statistical Framework
1. The purpose of the DRSF is to help national statistical systems, particularly the national disaster
management agencies and national statistics offices, provide statistical information for informed
disaster risk reduction policies to achieve the goals and targets in the Sendai Framework on
Disaster Risk Reduction and the 2030 Agenda for Sustainable Development. Disasters pose direct
threats to sustainable development and while many hazards, like earthquakes and floods, are, to
some extent, unavoidable, many lives can be saved and huge damages can be avoided through
evidence-based disaster risk reduction, response, and recovery.
2. ESCAP Resolution E/ESCAP/RES/70/2 on “Disaster-related Statistics in Asia and the Pacific”,
established a regional expert group and requested the development of a framework for a basic
range of disaster-related statistics along with guidance for implementation. The Resolution 70/2
recognized better use of disaggregated data as a challenge for evidence-based disaster risk
management policy,
3. The demand for improvements to the quality and accessibility of basic statistics on disasters has
been acknowledged extensively elsewhere as well, for example in many reports on disaster risk
surveys of current data availability and national capacities. Research (e.g. World Bank, 2017) has
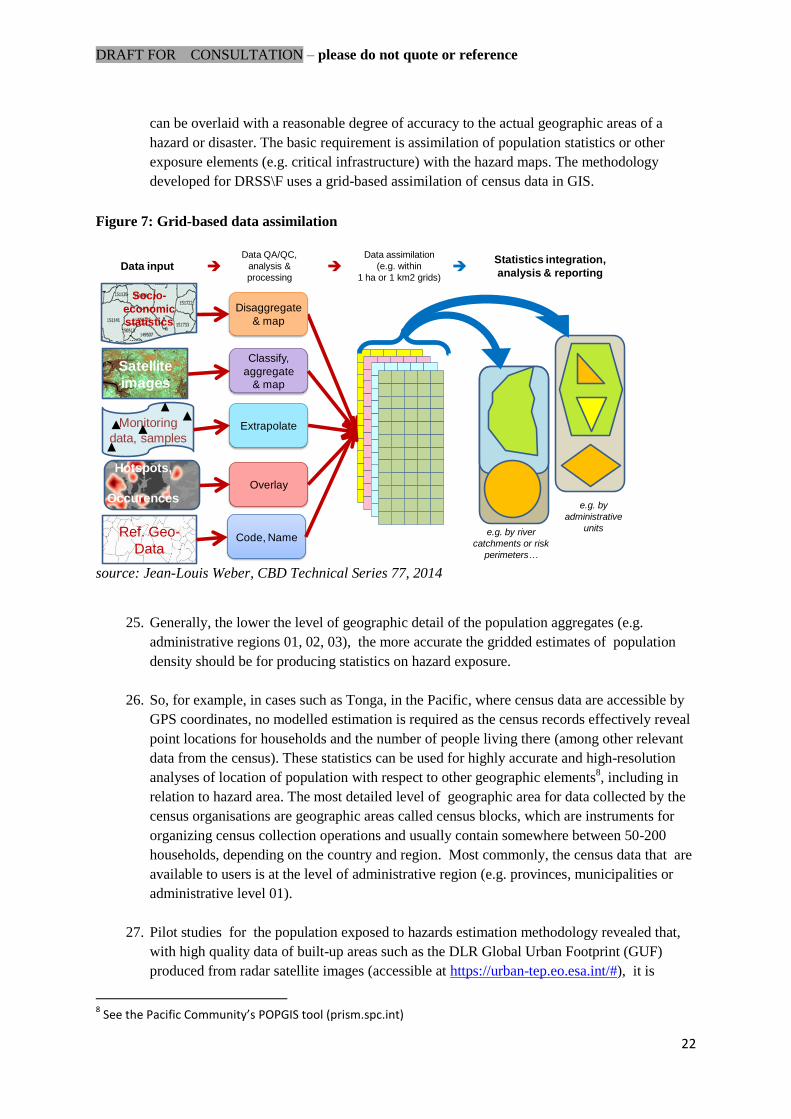
suggested, in the past, effects of disasters have been underestimated. The Report of the OECD
titled “Joint Expert Meeting on Disaster Loss Data: Improving the Evidence Base on the Costs of
Disasters: Key Findings from an OECD Survey” outlined some critical problems and limited
availability of internationally comparable statistics for many types of analyses on disasters,
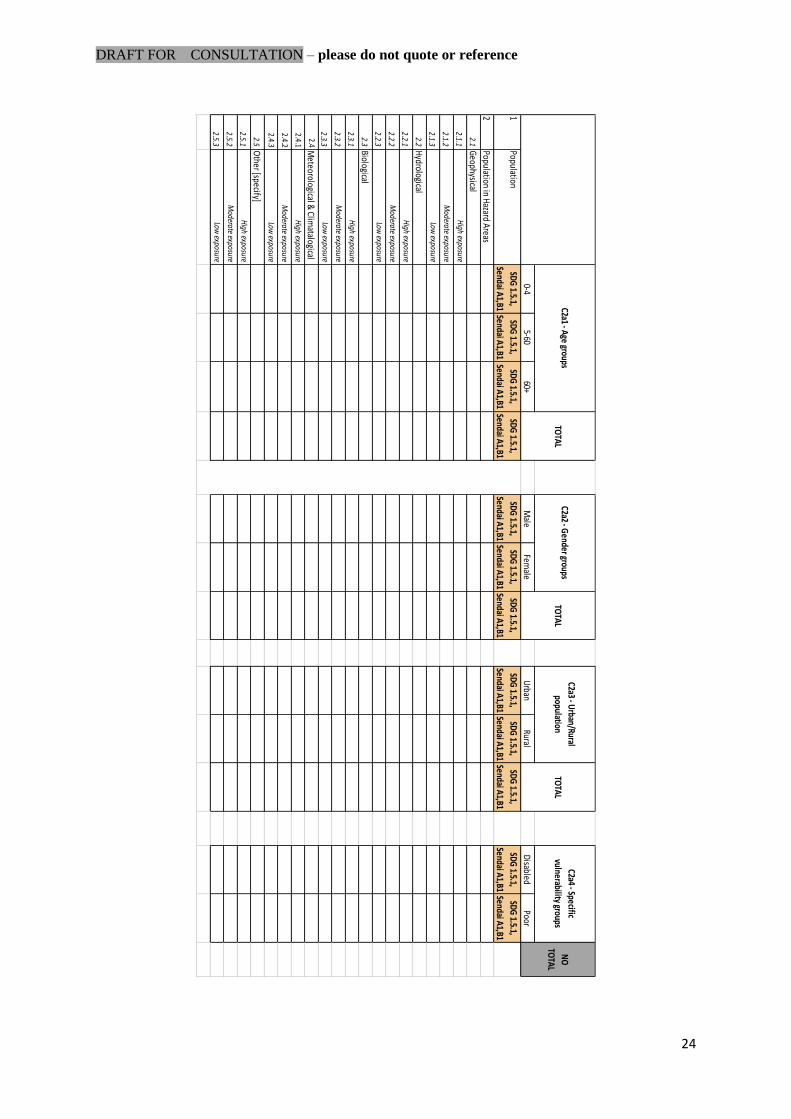
including for measuring economic loss and for monitoring activities in disaster response and risk
reduction. The introductory paragraph of this report states:
“The rationale for the work on improving the evidence base on the cost of disasters
is grounded in the evidence that recent shocks from natural and man-made disasters
continue to cause significant social and economic losses across OECD countries. The
increase in damages is widely considered to outpace national investments in disaster
risk reduction, but this claim is more intuitive than supported by evidence. Indeed, there
is hardly any comparable data available on national expenditure for disaster risk
management and data on disaster losses is generally incomplete and thought to be
underestimated. Such estimates of the comprehensive costs of disasters are necessary to
DRAFT FOR CONSULTATION – please do not quote or reference
2
analyse the benefits of past and future risk management policies. In particular, this
information is helpful to inform decision making and to develop cost effective strategies
and measures to prevent or reduce the negative impacts of disasters and threats. Policy
makers, at present, possess usually scattered and incomplete data resources, which are
not comparable across countries. To design policies to reduce losses from disasters we
need to know how such economic losses are counted.”- OECD, 2016
4. The Hyogo Framework for Action 2005-2015, predecessor to the Sendai Framework, emphasized
the importance to: “Develop systems of indicators of disaster risk and vulnerability at national and
sub-national scales that will enable decision-makers to assess the impact of disasters on social,
economic and environmental conditions and disseminate the results to decision-makers, the public
and population at risk.” (UN, 2005, p.9).
5. Demands for comparable statistics for international analyses of disaster risk has been updated and
given increased attention with the adoption of the Sendai Framework and SDG indicators.
Indicators in the international databases managed by the United Nations and other organizations
are produced based on the official statistics of the national statistical systems. Requirements for
these systems include comparability of concepts and methods for measurement across disaster
occurrences. Thus, the systems depend heavily on coordination and consistency, which is
accomplished via the adoption and application (at national and local levels) of a commonly agreed
measurement framework.
6. As development of centralized databases to a basic range of disaster-related statistics is a new
endeavour in nearly all countries, there is a strong demand for technical guidance and sharing of
tools and good practices internationally.
7. There are growing challenges to predicting disaster risk due to climate change and other factors of
the modern globalized world. However, from a technical perspective, there are also many
enhanced opportunities, like free availability of software and methodologies for making use of
new data sources, such as remote sensing, mobile phone datasets, and so on. The World Bank’s
Global Facility for Disaster Reduction and Recovery (GFDRR) stressed that “these advances and
innovations create a need for better standards and transparency, which would enable replicating
risk results by other actors, reporting on modelling assumptions and uncertainty, and so forth.” A
statistical framework and common set of conventions and sample metadata can help with
greater transparency and replicability for the statistical inputs.
8. A crucial part of the Expert Group’s approach in developing this guidance was extensive study of
existing practices within leading national agencies in their production and use of statistics.
Disaster statistics is a unique domain in several ways. Each hazard or disaster is different,
random and creates significant changes to the social and economic context for affected regions.
Disaster risk is unevenly dispersed within countries, across the world and over time. To identify
authentic trends, rather than random fluctuations or effects of extreme values, much of the
analyses of disaster related statistics requires a very long time series. This puts an exceptionally
high value for longitudinal coherence of measurement for disaster statistics.
9. Statistics provide the context and a broad vision for comparisons and for a deeper understanding
of risk across individual and multiple hazards. Harmonized statistics is used to inform
DRAFT FOR CONSULTATION – please do not quote or reference
3
international support and boost solidarity, not only for responding to major disasters but also for
addressing risks on a continuous basis and with support from international cooperation.
Roles & Responsibilities
10. The main users of this framework are expected to be national disaster management agencies and
national statistics offices, but there are a diverse range of other national agencies involved in
relevant data collections, such as ministries of environment, ministries of finance, ministries of
health, economic and social development policy makers, meteorological organizations, and so on.
Implementation of a statistical framework should help national agencies to define and implement
clear requirements, roles and responsibilities across government regarding collection and
application of data , and how it is made accessible for policy-relevant research and monitoring
purposes.
11. A statistical framework is a tool to identify the opportunities to utilize existing data sources within
the national statistical system (NSS). In some cases adaptions to the sources or to the way that
data are shared between agencies will be need to fit the purposes for disaster risk reduction
statistical analysis. It is usually more efficient to adapt and reuse existing streams of data than to
establish new ones in response to each new question or indicator.
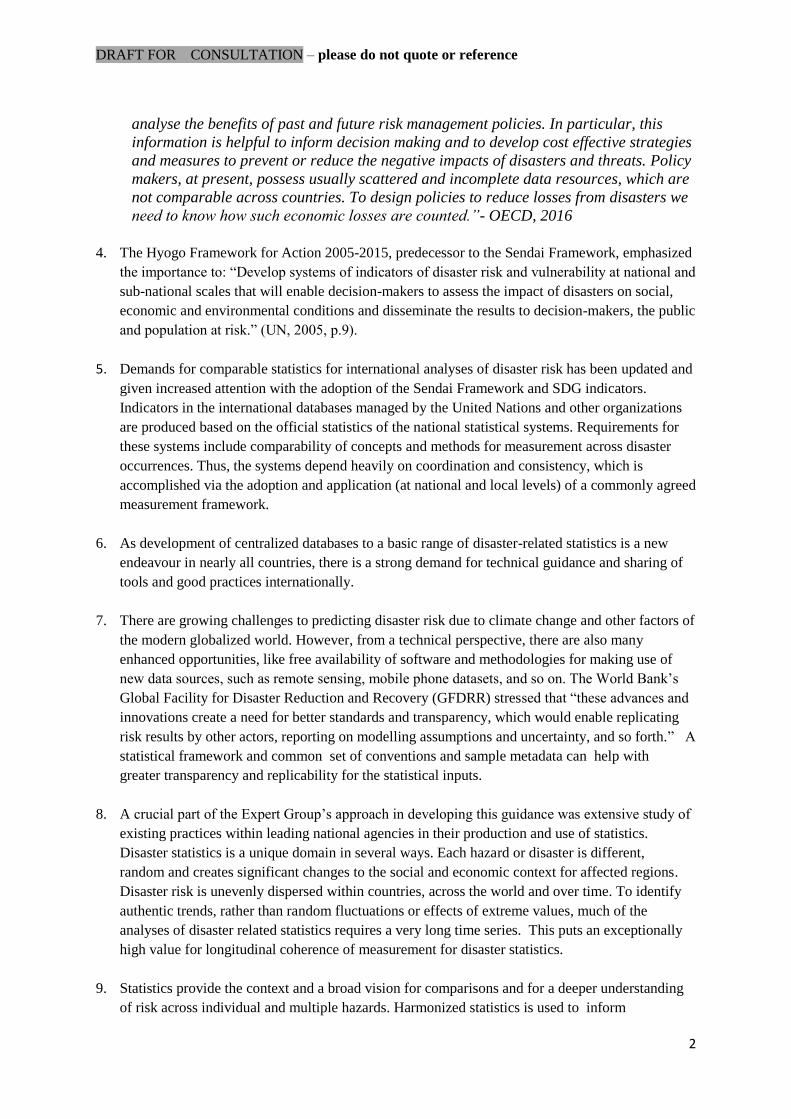
12. Through implementation of DRSF it will be possible to: (i) improve production of statistics from
existing databases and (ii) bridge the representations of the realm of disasters and risk reduction
on the one hand, with the socio-economic statistics on the other. The bridge between the two
domains of statistical information is essential for producing indicators. This bridge requires
strong partnership between disaster management agencies, national statistical offices, and other
official sources of relevant data and a strong mutual understanding of road concepts and the
methods for applying these concepts to practice for producing coherent statistics.
Figure 1: Statisical data and Policy Planning
DRAFT FOR CONSULTATION – please do not quote or reference
4
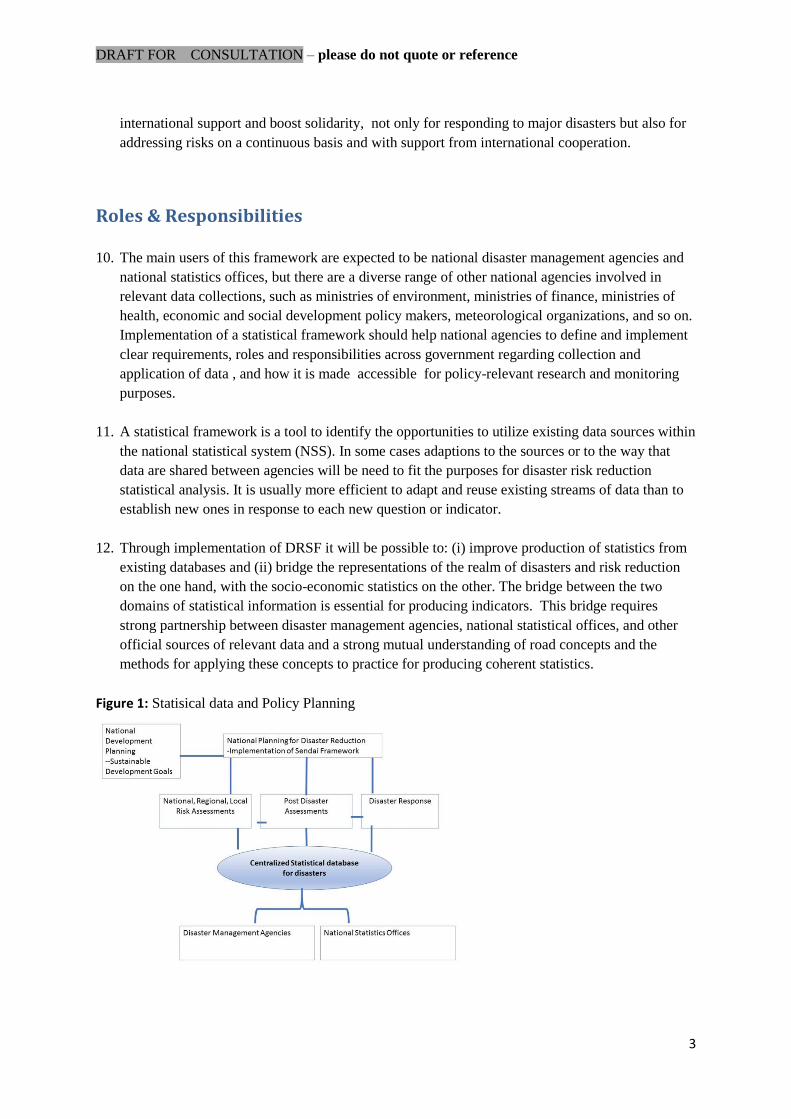
13. The scope for demands on official disaster-related statistics and indicators rests within a broader
context, which includes operational databases that are used for emergency response.
Implementation of DRSF will allow governments to produce coherent information and to make
use of the same instruments and collections of data for multiple purposes.
Figure 2: Uses of disaster-related data collections
Data Collection
Infrastructure Development Risk Assement Exposure
Resilience of Communities Post Disaster Assesment Hazard
Land use planning Indicators/Monitoring Vulnerability
Poverty Reduction Empirical Research Coping Capacity
Economic Development Planning Disaster Impact
DRR Activity
Operational Uses
Emergency Response
Evacuations
Early Warning Systems
Disaster Risk Management Planning
Summary & Time Series Statistics
Integrated Sustainable
Development Policy
14. The ideal scenario for disaster-related statistics, as described within the Sendai Framework, is
that, with improved availability of statistics, disaster risk reduction becomes an integrated part of
the broader sustainable development planning of the country at national and local levels. Some
examples are integrating disaster risk assessments into land use planning and urban zoning and
building resilience to disasters as a part of the broader strategy against multi-dimensional poverty.
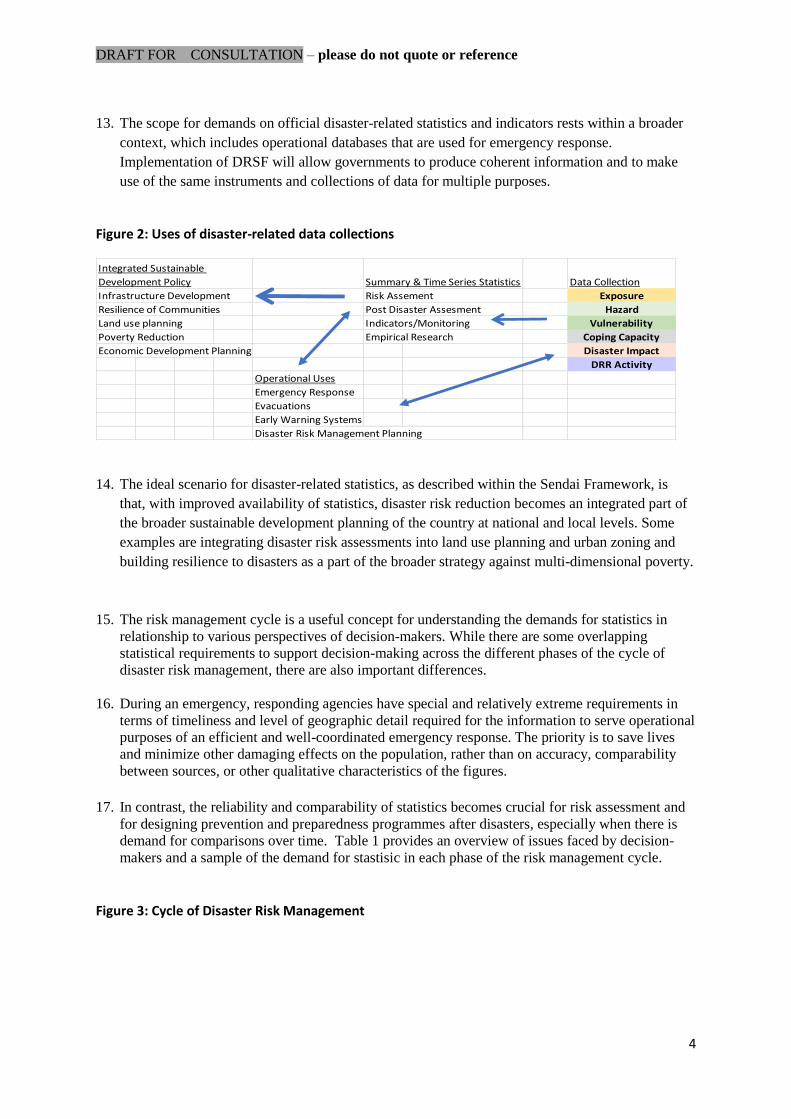
15. The risk management cycle is a useful concept for understanding the demands for statistics in
relationship to various perspectives of decision-makers. While there are some overlapping
statistical requirements to support decision-making across the different phases of the cycle of
disaster risk management, there are also important differences.
16. During an emergency, responding agencies have special and relatively extreme requirements in
terms of timeliness and level of geographic detail required for the information to serve operational
purposes of an efficient and well-coordinated emergency response. The priority is to save lives
and minimize other damaging effects on the population, rather than on accuracy, comparability
between sources, or other qualitative characteristics of the figures.
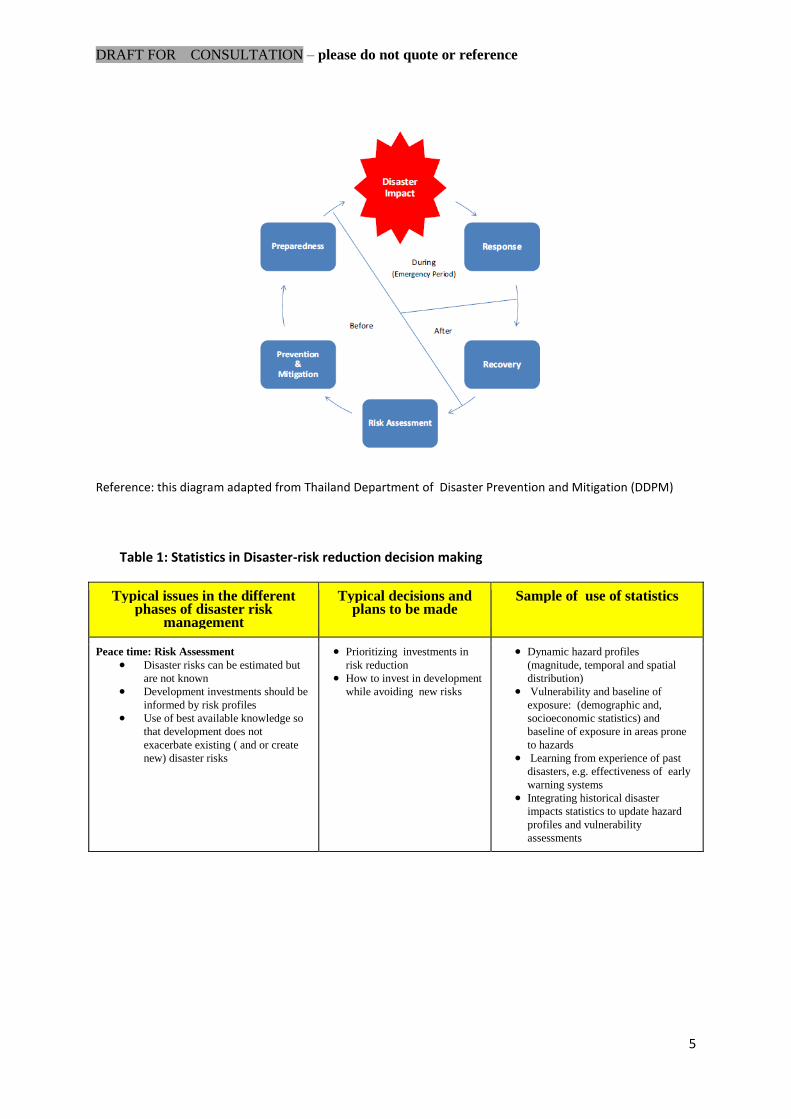
17. In contrast, the reliability and comparability of statistics becomes crucial for risk assessment and
for designing prevention and preparedness programmes after disasters, especially when there is
demand for comparisons over time. Table 1 provides an overview of issues faced by decision-
makers and a sample of the demand for stastisic in each phase of the risk management cycle.
Figure 3: Cycle of Disaster Risk Management
DRAFT FOR CONSULTATION – please do not quote or reference
5
Reference: this diagram adapted from Thailand Department of Disaster Prevention and Mitigation (DDPM)
Table 1: Statistics in Disaster-risk reduction decision making
Typical issues in the different phases of disaster risk
management
Typical decisions and plans to be made
Sample of use of statistics
Peace time: Risk Assessment Disaster risks can be estimated but
are not known
Development investments should be
informed by risk profiles
Use of best available knowledge so
that development does not
exacerbate existing ( and or create
new) disaster risks
Prioritizing investments in
risk reduction
How to invest in development
while avoiding new risks
Dynamic hazard profiles
(magnitude, temporal and spatial
distribution)
Vulnerability and baseline of
exposure: (demographic and,
socioeconomic statistics) and
baseline of exposure in areas prone
to hazards Learning from experience of past
disasters, e.g. effectiveness of early
warning systems
Integrating historical disaster
impacts statistics to update hazard
profiles and vulnerability
assessments
DRAFT FOR CONSULTATION – please do not quote or reference
6
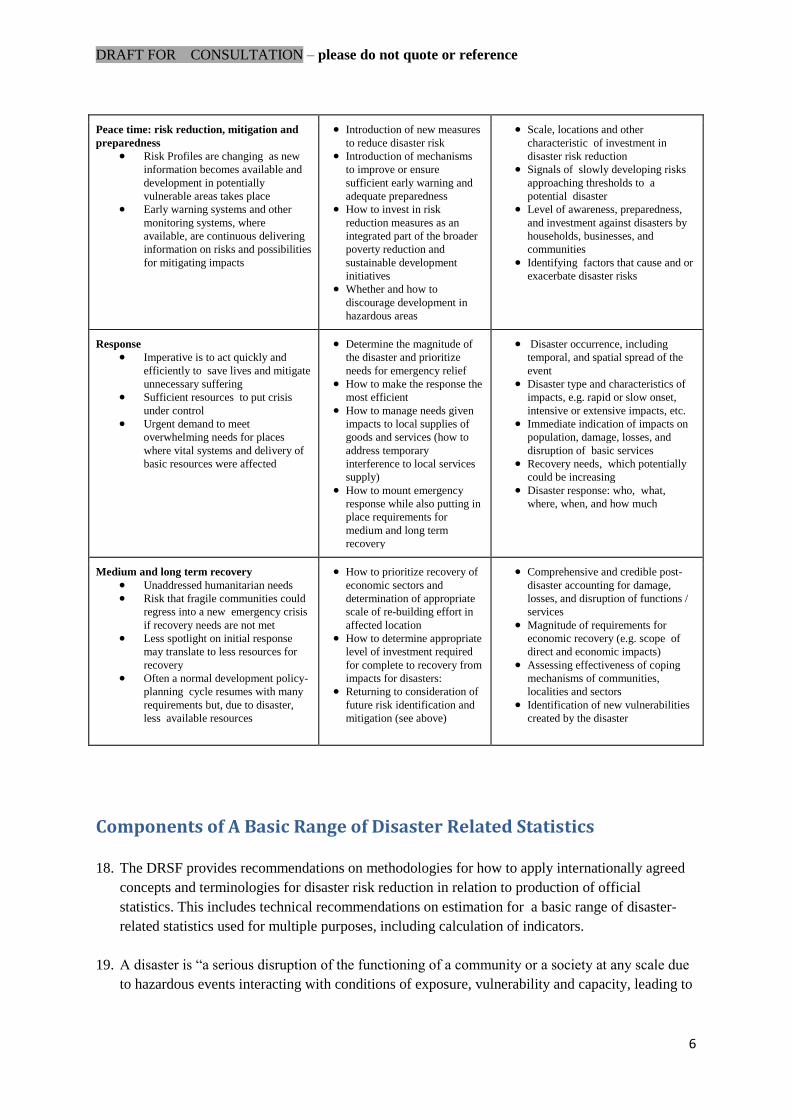
Peace time: risk reduction, mitigation and
preparedness Risk Profiles are changing as new
information becomes available and
development in potentially
vulnerable areas takes place
Early warning systems and other
monitoring systems, where
available, are continuous delivering
information on risks and possibilities
for mitigating impacts
Introduction of new measures
to reduce disaster risk
Introduction of mechanisms
to improve or ensure
sufficient early warning and
adequate preparedness
How to invest in risk
reduction measures as an
integrated part of the broader
poverty reduction and
sustainable development
initiatives
Whether and how to
discourage development in
hazardous areas
Scale, locations and other
characteristic of investment in
disaster risk reduction
Signals of slowly developing risks
approaching thresholds to a
potential disaster
Level of awareness, preparedness,
and investment against disasters by
households, businesses, and
communities
Identifying factors that cause and or
exacerbate disaster risks
Response Imperative is to act quickly and
efficiently to save lives and mitigate
unnecessary suffering
Sufficient resources to put crisis
under control
Urgent demand to meet
overwhelming needs for places
where vital systems and delivery of
basic resources were affected
Determine the magnitude of
the disaster and prioritize
needs for emergency relief
How to make the response the
most efficient
How to manage needs given
impacts to local supplies of
goods and services (how to
address temporary
interference to local services
supply)
How to mount emergency
response while also putting in
place requirements for
medium and long term
recovery
Disaster occurrence, including
temporal, and spatial spread of the
event
Disaster type and characteristics of
impacts, e.g. rapid or slow onset,
intensive or extensive impacts, etc.
Immediate indication of impacts on
population, damage, losses, and
disruption of basic services
Recovery needs, which potentially
could be increasing
Disaster response: who, what,
where, when, and how much
Medium and long term recovery Unaddressed humanitarian needs
Risk that fragile communities could
regress into a new emergency crisis
if recovery needs are not met
Less spotlight on initial response
may translate to less resources for
recovery
Often a normal development policy-
planning cycle resumes with many
requirements but, due to disaster,
less available resources
How to prioritize recovery of
economic sectors and
determination of appropriate
scale of re-building effort in
affected location
How to determine appropriate
level of investment required
for complete to recovery from
impacts for disasters:
Returning to consideration of
future risk identification and
mitigation (see above)
Comprehensive and credible post-
disaster accounting for damage,
losses, and disruption of functions /
services
Magnitude of requirements for
economic recovery (e.g. scope of
direct and economic impacts)
Assessing effectiveness of coping
mechanisms of communities,
localities and sectors
Identification of new vulnerabilities
created by the disaster
Components of A Basic Range of Disaster Related Statistics
18. The DRSF provides recommendations on methodologies for how to apply internationally agreed
concepts and terminologies for disaster risk reduction in relation to production of official
statistics. This includes technical recommendations on estimation for a basic range of disaster-
related statistics used for multiple purposes, including calculation of indicators.
19. A disaster is “a serious disruption of the functioning of a community or a society at any scale due
to hazardous events interacting with conditions of exposure, vulnerability and capacity, leading to
DRAFT FOR CONSULTATION – please do not quote or reference
7
one or more of the following: human, material, economic and environmental losses and impacts.”
(UNGA, 2015)
20. Presently, countries have different practices with regards to applying this definition for compiling
data and preparing statistical tables, which makes it difficult to make comparisons between
countries or conduct time series analyses over time and across multiple disasters. This handbook
can be utilized to address challenges for creating coherence across data sources and to
incorporate statistics related to all types of disaster events (regardless of scale) in alignment with
the UN General Assembly definition, towards a nationally centralized and internationally-
coherent basic range of disaster-related statistics.
21. Since governments are approaching challenges of improving their statistics and developed
centralized disaster-related compilations from different baseline capacities for nationally
harmonized disaster-related statistics, a tiered system of prioritization of statistical variables and
related practices have been developed for DRSF to help support a strategic implementation of the
guidelines.
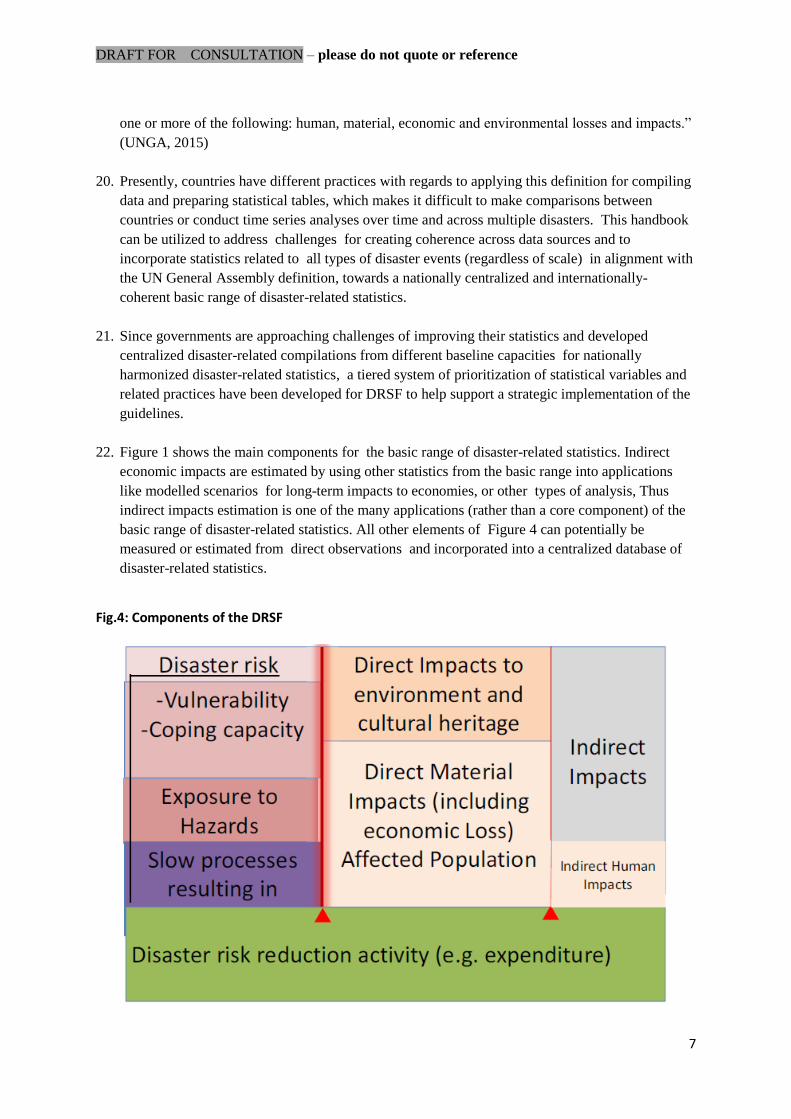
22. Figure 1 shows the main components for the basic range of disaster-related statistics. Indirect
economic impacts are estimated by using other statistics from the basic range into applications
like modelled scenarios for long-term impacts to economies, or other types of analysis, Thus
indirect impacts estimation is one of the many applications (rather than a core component) of the
basic range of disaster-related statistics. All other elements of Figure 4 can potentially be
measured or estimated from direct observations and incorporated into a centralized database of
disaster-related statistics.
Fig.4: Components of the DRSF
DRAFT FOR CONSULTATION – please do not quote or reference
8
23. Figure 1 can be read like a timeline from left to right. First, there are statistics on disaster risk,
before the hazard occurrence. A threshold is passed at the moment of a call for emergency, at
which point data begin to be collected on the disaster occurrence and especially its impacts on
people, infrastructure, and the economy. Disaster risk reduction activities occur on a continuous
basis (like other activities of an economy). Indirect impacts, generally are experienced and
estimated during a period of time after the emergency response needs have already been met.
24. This handbook describes conventions and technical guidance for applying the agreed international
concepts and definitions of disaster risk reduction into the practice of statistics collection and
reporting. This includes, for example, guidance on measurement units, classifications, and other
conventions for compilers of statistics to produce coherent statistics on disaster, risk, occurrences,
and impacts, over time and across countries.
25. Case studies of development of compilations of summary statistics, aggregated across multiple
disaster occurrences are presented as examples and to share experiences, with an aim towards
providing illustrations of the concepts and sample outputs, and rationale for recommendations
provided in the text.
26. The statistics in this framework must be derived from a wide variety of sources. Important data
sources for compiling a basic range of disaster-related statistics are: population and housing
census, household surveys, monitoring data from geophysical, meteorological and geographic
organizations, the national accounts and its sources, disaster management agency assessments
and monitoring, ministry of environment, administrative records of health and safety institutions,
administrative records from emergency response and recovery operations, and (where possible)
specialized surveys targeting disaster-affected households and businesses.
27. Background statistics, such as GDP, basic demographic statistics, indicators of poverty,
environmental condition, are essential information for providing context to statistics on disaster
impacts, or the risk of impacts, as meaningful indicators for making comparisons and tracking
progress.
Relationships with other Frameworks and Applications
28. Implementation of DRSF involves interaction with a wide range of existing guidelines and
international standards adopted by the UN Statistical Commission, including recommendations
for population censuses, a classifications and other standards for economic statistics, including the
SNA and the System for Environmental-Economic accounts (SEEA). The current precedent in
the Statistics Commission for disaster-related statistics comes from the Framework for the
Development of Environment Statistics (FDES), which defined a component for “extreme events
and disasters”. For development of this handbook, the Asia Pacific Expert Group on Disaster-
related statistics consulted with a broad spectrum of disaster risk reduction and statistical
expertise and with established groups and forums, including: thet UNECE Task Force on Extreme
Events and Disasters, UN Expert Group on Statistical Classifications, the Advisory Expert Group
DRAFT FOR CONSULTATION – please do not quote or reference
9
on National Accounts, UN Expert Group on Environment Statistics, an the UN Committee of
Experts on Global Geospatial Information Management (UN-GGIM).
29. Key applications for disaster-related statistics are risk assessment and post-disaster impacts
assessments. Risk assessment is a continuous process because risks are dynamic. Moreover,
outcomes of disaster impacts assessments often will be important new information for future risk
assessment. Therefore variables used for vulnerability and for disaggregation of impacts statistics
will often mirror each other and risk assessment mechanisms need to be flexible for inputting new
data as it becomes available and, in particular, after a new disaster.
30. Usually, disaster risk assessment is primarily a responsibility of disaster management agencies
(or other related institutions). However, a lot of the data used for describing core drivers of
disaster risk (particularly exposure and vulnerability) are derived from established social and
economic statistics systems managed by national statistics offices. Also, data inputs used to
describe and predict hazards are derived from various other ministries and by the meteorological,
geological, and other geographic authorities.
31. Post-Disaster Needs Assessments (PDNAs) are conducted by the governments of affected
countries in collaboration with international agencies, particularly the World Bank. Guidelines
for conducting post disaster assessments and for using these assessments for developing disaster
recovery plans have been developed and published by the World Bank’s Global Facility for
Disaster Risk Reduction (GFDRR), in collaboration with the European Commission and the UN
Development Programme. The basic framework for PDNA studies derived the Damage and Loss
Assessment (DALA) Handbook (ECLAC, 2003). The DALA Handbook provides a globally
recognized conceptual framework for assessment studies, organized according to the different
components or sectors in the economy. The DALA methodology “focuses on the conceptual and
methodological aspects of measuring or estimating the damage caused by disasters to capital
stocks and losses in the production flows of goods and services, as well as any temporary effects
on the main macroeconomic variables.” (UNECLAC, 2003).
32. Assessment studies, including the PDNAs, are among the main applications for the basic range of
disaster-related statistics and the major sources of estimats of indirect impacts of disasters. DRSF
is built, where feasible, upon the existing data sources and standards in the national statistical
systems. Therefore, implementation of DRSF can lead to increased availability and comparability
of statistical inputs for use in the assessments and an improved alignment between PDNAs and
the regular outputs of official statistical systems, such as the System of National Accounts (SNA).
33. PDNAs, following DALA methodology, are usually only conducted after very large scale disaster
events such as hurricane Yolanda in the Philippines, Thailand’s 2011 floods, and Cyclone Evan
that caused major economic destruction in Fiji and Samoa. The World Bank’s GFDRRR website
currently hosts post-disaster assessment reports for 49 disasters in 40 countries, including 15
cyclones and multiple droughts, floods, earthquakes, tropical storms, and 1 volcanic eruption
(Cape Verde 2014-15).
34. In addition to published outputs rom PDNAs, several international compilations of statistics or
reporting tools are available for public access and were utilized by the expert group as important
references to develop guidance in this handbook included: UNISDR Global Assessment Report
(GAR) Risk Data Platform, DesInventar (Disaster Information Management System), and the UN
Environment Global Resource Information Database (GRID) network, and Munich Re Natural
catastrophe statistics online (NatCatSERVICE).
DRAFT FOR CONSULTATION – please do not quote or reference
10
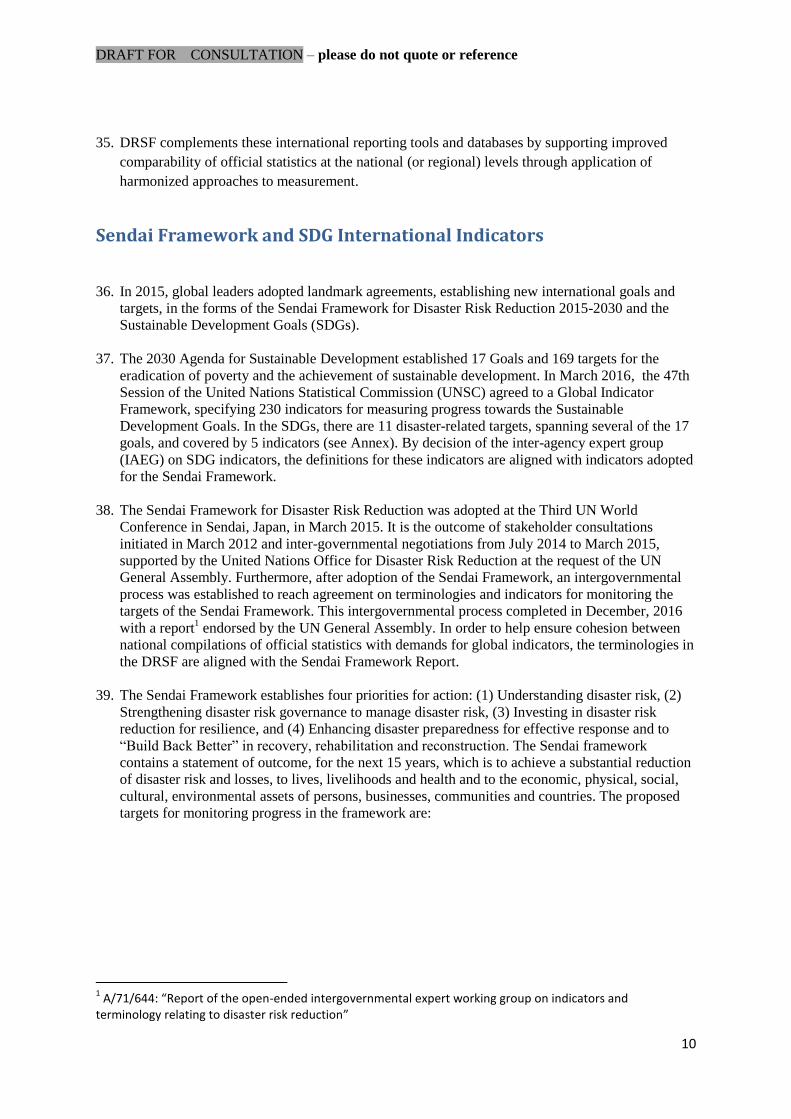
35. DRSF complements these international reporting tools and databases by supporting improved
comparability of official statistics at the national (or regional) levels through application of
harmonized approaches to measurement.
Sendai Framework and SDG International Indicators
36. In 2015, global leaders adopted landmark agreements, establishing new international goals and
targets, in the forms of the Sendai Framework for Disaster Risk Reduction 2015-2030 and the
Sustainable Development Goals (SDGs).
37. The 2030 Agenda for Sustainable Development established 17 Goals and 169 targets for the
eradication of poverty and the achievement of sustainable development. In March 2016, the 47th
Session of the United Nations Statistical Commission (UNSC) agreed to a Global Indicator
Framework, specifying 230 indicators for measuring progress towards the Sustainable
Development Goals. In the SDGs, there are 11 disaster-related targets, spanning several of the 17
goals, and covered by 5 indicators (see Annex). By decision of the inter-agency expert group
(IAEG) on SDG indicators, the definitions for these indicators are aligned with indicators adopted
for the Sendai Framework.
38. The Sendai Framework for Disaster Risk Reduction was adopted at the Third UN World
Conference in Sendai, Japan, in March 2015. It is the outcome of stakeholder consultations
initiated in March 2012 and inter-governmental negotiations from July 2014 to March 2015,
supported by the United Nations Office for Disaster Risk Reduction at the request of the UN
General Assembly. Furthermore, after adoption of the Sendai Framework, an intergovernmental
process was established to reach agreement on terminologies and indicators for monitoring the
targets of the Sendai Framework. This intergovernmental process completed in December, 2016
with a report1 endorsed by the UN General Assembly. In order to help ensure cohesion between
national compilations of official statistics with demands for global indicators, the terminologies in
the DRSF are aligned with the Sendai Framework Report.
39. The Sendai Framework establishes four priorities for action: (1) Understanding disaster risk, (2)
Strengthening disaster risk governance to manage disaster risk, (3) Investing in disaster risk
reduction for resilience, and (4) Enhancing disaster preparedness for effective response and to
“Build Back Better” in recovery, rehabilitation and reconstruction. The Sendai framework
contains a statement of outcome, for the next 15 years, which is to achieve a substantial reduction
of disaster risk and losses, to lives, livelihoods and health and to the economic, physical, social,
cultural, environmental assets of persons, businesses, communities and countries. The proposed
targets for monitoring progress in the framework are:
1 A/71/644: “Report of the open-ended intergovernmental expert working group on indicators and
terminology relating to disaster risk reduction”

DRAFT FOR CONSULTATION – please do not quote or reference
11
1. Reduce global disaster mortality
2. Reduce the number of affected people
3. Reduce direct disaster economic loss
4. Reduce disaster damage to critical infrastructure and disruption of basic services, among them
health and educational facilities
5. Increase the number of countries with national and local disaster risk reduction strategies
6. Enhance international cooperation
7. Increase the availability of and access to multi-hazard early warning systems and disaster risk
information
40. A collection of 27 independent (excluding composite) indicators were adopted for international
monitoring of all seven Sendai Framework targets.2 Monitoring the 7 targets in the Sendai
Framework requires, as a minimum, good quality basic statistics on disaster risk, disaster
occurrences, direct impacts and commitments to interventions for reducing risks. These basic
requirements, in terms of a system of compilation of statistics draws from multiple data sources
across multiple governmental agencies and should cover, in principle a complete range of
different types of disasters relevant to the country.
41. The specifications for the Sendai Framework and SDG Indicators provide the common baseline
reference on the scope and prioritization for the high-level international demands for statistics.
However, all countries are starting from very different contexts in terms of the nature (e.g. extent
and intensity) of their baseline disaster risk factors. Thus, implementation of DRSF is a tool to
support national agencies with their reporting of aggregated indicators and also with development
of statically compilations with a broader scope and broader range of applications, as required for
decision-making at the national and local levels.
42. Diversity in current practices combined with the demand for international comparisons and time
series indicators creates the need for clear guidance on practical measures and, in some cases,
simplifying conventions for harmonization of measurement. Improved coherence and
transparency of approaches to measurement of basic disaster statistics is necessary for analyses of
the critical drivers of differences and trends in the internationally-adopted indicators, including
differences in underlying risk factors faced by different countries and communities.
Harmonization statistics is also needed for analyses that can distinguish between authentic
examples of progress from random variations in the time series.
43. Statistical databases are summaries of broader collections of raw data gathered from a number of
sources, including the operational databases, surveys, censuses, monitoring systems, and
administrative records. Indicators are designed to provide limited and targeted information to
policy-makers and to the general public to help inform disaster risk reduction policy frameworks
and to identify if and where progress is being made. Where possible, indicators should also be to
identify and encourage positive actions towards sustainable development pre-emptively, before
disasters.
44. DRSF rests in the middle of the theoretical information pyramid. The production of statistical
tables inevitably involve some degree of aggregation and summary of basic microdata, but the
statistics framework also needs to be relatively complete and flexible for calculating a broad
range of indicators, as well as for facilitating other types of analyses.
2 See complete list in Annex
DRAFT FOR CONSULTATION – please do not quote or reference
12
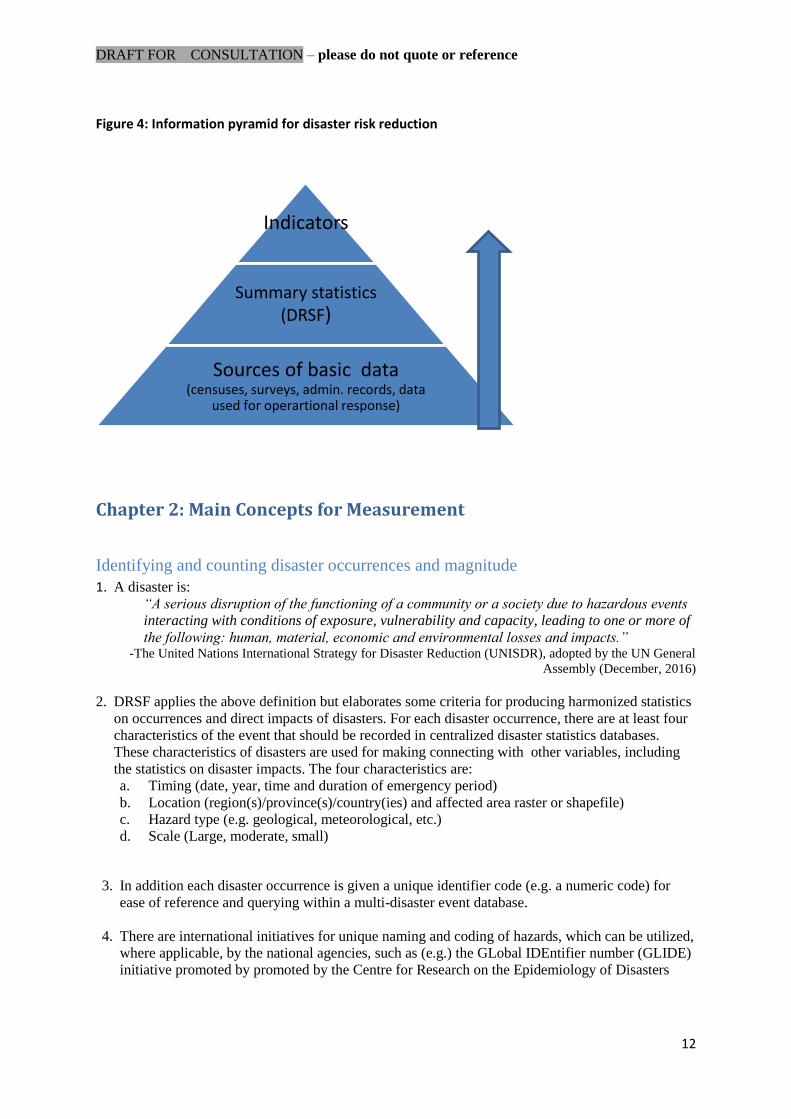
Figure 4: Information pyramid for disaster risk reduction
Chapter 2: Main Concepts for Measurement
Identifying and counting disaster occurrences and magnitude
1. A disaster is:
“A serious disruption of the functioning of a community or a society due to hazardous events
interacting with conditions of exposure, vulnerability and capacity, leading to one or more of
the following: human, material, economic and environmental losses and impacts.” -The United Nations International Strategy for Disaster Reduction (UNISDR), adopted by the UN General
Assembly (December, 2016)
2. DRSF applies the above definition but elaborates some criteria for producing harmonized statistics
on occurrences and direct impacts of disasters. For each disaster occurrence, there are at least four
characteristics of the event that should be recorded in centralized disaster statistics databases.
These characteristics of disasters are used for making connecting with other variables, including
the statistics on disaster impacts. The four characteristics are:
a. Timing (date, year, time and duration of emergency period)
b. Location (region(s)/province(s)/country(ies) and affected area raster or shapefile)
c. Hazard type (e.g. geological, meteorological, etc.)
d. Scale (Large, moderate, small)
3. In addition each disaster occurrence is given a unique identifier code (e.g. a numeric code) for
ease of reference and querying within a multi-disaster event database.
4. There are international initiatives for unique naming and coding of hazards, which can be utilized,
where applicable, by the national agencies, such as (e.g.) the GLobal IDEntifier number (GLIDE)
initiative promoted by promoted by the Centre for Research on the Epidemiology of Disasters
Indicators
Summary statistics (DRSF)
Sources of basic data (censuses, surveys, admin. records, data
used for operartional response)
DRAFT FOR CONSULTATION – please do not quote or reference
13
(CRED) of the University of Louvain in Brussels (Belgium), OCHA/ReliefWeb, OCHA/FSCC,
ISDR, UNDP, WMO, IFRC, OFDA-USAID, FAO, La Red and the World Bank.3
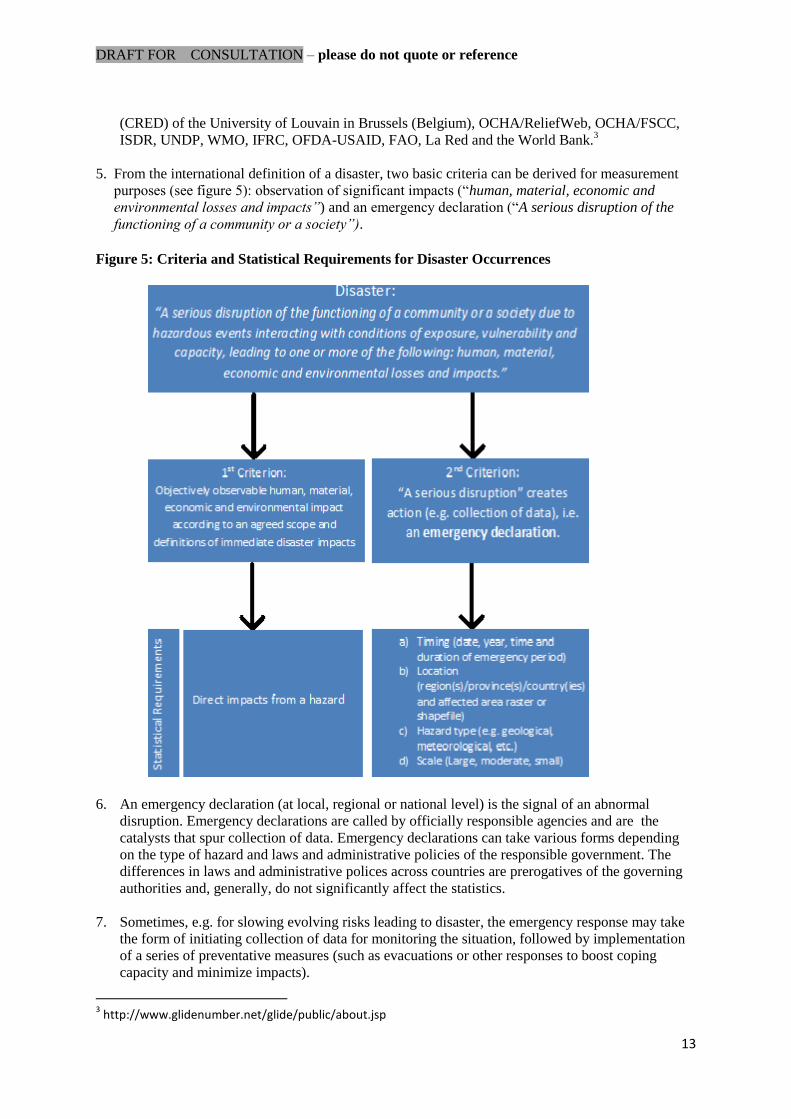
5. From the international definition of a disaster, two basic criteria can be derived for measurement
purposes (see figure 5): observation of significant impacts (“human, material, economic and
environmental losses and impacts”) and an emergency declaration (“A serious disruption of the
functioning of a community or a society”).
Figure 5: Criteria and Statistical Requirements for Disaster Occurrences
6. An emergency declaration (at local, regional or national level) is the signal of an abnormal
disruption. Emergency declarations are called by officially responsible agencies and are the
catalysts that spur collection of data. Emergency declarations can take various forms depending
on the type of hazard and laws and administrative policies of the responsible government. The
differences in laws and administrative polices across countries are prerogatives of the governing
authorities and, generally, do not significantly affect the statistics.
7. Sometimes, e.g. for slowing evolving risks leading to disaster, the emergency response may take
the form of initiating collection of data for monitoring the situation, followed by implementation
of a series of preventative measures (such as evacuations or other responses to boost coping
capacity and minimize impacts).
3 http://www.glidenumber.net/glide/public/about.jsp
DRAFT FOR CONSULTATION – please do not quote or reference
14
8. Other emergencies, especially sudden or unexpected hazards, are more explicitly represented by a
formal and public declaration and request to mobilize resources for response. The scale of
emergency declaration local, regional, national or international) is a useful indication for
assessing and categorizing the scale of the disaster.
9. The statistical requirements at the bottom of Figure should be developed and maintained in
centralized databases for each country and for each identified disaster occurrence. This is a
minimum requirement to identify disasters and describe their basic characteristics.
10. While the more common statistical demands in relation to individual occurrences of disasters is
information on impacts, counting and describing disaster occurrences according to their basic
characteristics has some limited but important analytical applications as well. Counts of
occurrences provide the context for analyzing disaster impacts statistics or for reviewing the
trends in occurrences over a very long time period (e.g. 50-100 year trends), which can be used as
inputs for risk assessment. Counts of disaster occurrences also provide the basis for calculating
statistics on intensity of impacts from disaster occurrences over time.
11. It is of central importance that the counts and descriptive characteristics of disaster occurrences
are done consistently over time (i.e. across individual events). If the scope for incorporating
disaster occurrences into outputs of official statistics, than there will be fundamental
inconsistencies in the scope of impacts statistics over time.
12. Such inconsistencies are common in the current national and international compilations for
disaster occurrences. A comparison of simple counts of disaster occurrences by hazard types for
any given country from different databases (e.g. a comparison from international sources versus
the records of an official national agency) reveals large differences in the numbers of events that
are recognized as the basis for statistics like number of deaths or economic impacts. Sometimes
inconsistencies are caused by errors but there can also be valid conceptual differences in scope of
measurement between databases, which will be improved through implementation of a common
framework.
13. There will also way be borderline cases and small differences in interpretations for special cases,
but a goal disaster occurrence statistics is to minimize the inconsistencies. There are two primary
sources for conceptual inconsistencies for counting disasters (and their impacts) in the current
national and international practices. The first source is a different scope of the hazards that are
accounted as a disaster. The second source is use of a minimum scale of impact threshold.
14. Impact thresholds are an application of basic statistcs on disaster for analysis and comparisons.
Thresholds are used as a practical tool to put practical limits on the scope for disaster impacts
statistics and for time series or multi-country analyses. For example, within the CRED EMDAT
databse, minimum threshold criteria were defined so that the compilations focus primarily on
moderate to large-scale emergencies. For the primary sources and in the official national
databases, there is no need to define a minimum scale of impact threshold, prior to analysis. For
databases, compilations need only to apply the criteria for a disaster occurrence in diagram 1, i.e.
at least some impact was recorded. Regardless of how minor the impacts, there must be at least
some objectively observed social-economic impact to qualify as a disaster.4 In this way, the
relatively small-scale disaster events are, in principle, included within the statistical databases and
it is up to users of these statistics (including CRED and others) to define thresholds or other
criteria, as needed, to match their own needs. In general, producers of official statistics should
4 Ground-shaking from earthquake with no impacts is a hazard, but it becomes a disaster occurrence at the
moment that impacts, however large or small, could be identified.

DRAFT FOR CONSULTATION – please do not quote or reference
15
avoid introducing analytical criteria or other potential biases into the primary database so that a
broader range of potential applications of the statistics will be feasible from the official data
sources, through the subsequent grouping, threshold filtering, or other analyses of the basic data.
15. In principle, collection of statistics related to disasters are applicable for disasters of any scale.
Paragraph 15 of the Sendai Framework states that it applies “to the risk of small-scale and large-
scale, frequent and infrequent, sudden and slow-onset disasters caused by natural or man-made
hazards, as well as related environmental, technological and biological hazards and risks. It aims
to guide the multi-hazard management of disaster risk in development at all levels as well as
within and across all sectors.” Thus, there is a clear demand for a nationally coherent
measurement framework for application at different scales.
Hazards types
16. Current practices for scope of coverage of hazard types are extremely variable. Many countries
have an officially adopted list of hazard types and definitions inscribed into the national laws for
disaster responses. In these cases, the scope of official data collections (and metadata) usually
should be aligned with the scope and terminologies from the legal text. For all cases, a formal list
and glossary of the hazards should be published as part of the core metadata alongside the
statistics.
17. As with the case of the impacts threshold, it is only at the stage of analyses and production of
indicators from the databases that filtering or limiting the selection of hazard types will become
applicable, depending on the particular requirements of the study or reporting. Statistics for all
hazard types recognized within the country could be compiled in accordance with DRSF.
18. However, as a general recommendation towards increased consistency in scope of disaster-related
statistics, national agencies are encouraged to follow the scope of hazards defined for
international monitoring for the Sendai Framework and SDGs global monitoring according to
UNGA (2016) and the subsequent UNISDR Methodological Guidance for indicators. This
recommendation is to report nationally aggregated statistics according to the overall scope of
coverage of the IRDR Peril Classification and Hazard Glossary (IRDR, 2014) and for two
additional categories of hazards: environmental hazards and technological hazards.
19. For organization of the presentation of statistics on disaster occurrences into categories of hazard
types, the main perspective is time series analysis. One of the important examples of aggregated
category that should be derivable from an agreed classification of hazards is climate-related
disasters. These are hazards in the meteorological and hydrological hazard families as defined by
IRDR (2014).5
20. Climate is “the synthesis of weather conditions in a given area, characterized by long-term
statistics (mean values, variances, probabilities of extreme values, etc.) of the meteorological
elements in that area.” (WMO, 2017)
21. The Intergovernmental Panel on Climate Change (IPCC) has indicated a strong likelihood that
climate change will lead to increases in frequency and severity of related hazards, thus reducing
overall predictability of such hazards based on historical records (see, e.g., IPCC, 2012 and
5 Allignment with meteorological and hydrological families of IRDR can be used as the broad scope for
measurement of climate-related disasters. However, some special distinctions may be needed in the details, for example to distinguish between fires that are accidents caused directly by human activities in urban area as compared to wildfires that are consequences of extreme climate conditions (dry heat).
DRAFT FOR CONSULTATION – please do not quote or reference
16
Birkman, 2013). Trends will be different and unevenly distributed across the globe. Statistics are
needed for assessing how climate change may be impacting disaster risk for different countries or
different regions over time.
22. Another aggregated category of hazards mentioned in the Sendai Framework are “man-made
disasters”. Although the term “natural disasters” is no longer used, man-mad hazards refers
especially to environmental and technological hazards, which are not covered by IRDR (2014).
23. In UNGA (2016), technological hazards “originate from technological or industrial conditions,
dangerous procedures, infrastructure failures or specific human activities. Examples include
industrial pollution, nuclear radiation, toxic wastes, dam failures, transport accidents, factory
explosions, fires and chemical spills. Technological hazards also may arise directly as a result of
the impacts of a natural hazard event.”
24. Also from UNGA (2016), environmental hazards: “may include chemical, natural and
biological hazards. They can be created by environmental degradation or physical or chemical
pollution in the air, water and soil. However, many of the processes and phenomena that fall into
this category may be termed drivers of hazard and risk rather than hazards in themselves, such as
soil degradation, deforestation, loss of biodiversity, salinization and sea-level rise.”
25. Other hazards not covered in the scope of the 2014 IRDR publication are violent conflicts,
including civil war and the associate human crises, e.g. refugee crises. The OECD estimates that
approximately 80% of international transfers of humanitarian aid goes to conflict-related
settings.6. UNGA (2016) excludes "the occurrence or risk of armed conflicts and other situations
of social instability or tension which are subject to international humanitarian law and national
legislation" from its definition of a hazard for the purpose of Sendai Framework monitoring.
26. A cascading multiple-hazard disaster occurrence is a disaster occurrence in which one type of
hazard (such as a strong storm or a tropical cyclone) causes one or more additional hazards (e.g.
flooding or landslides), that create combined impacts to the population, infrastructure and the
environment (see further description in Chapter 3). In some cases (e.g. Indonesia), cascading
multi-hazard disasters can be reported as their own specialized category of hazard types, noting
also the original trigger hazard (e.g. storm), as well as the connected hazards (e.g. floods,
landslide). Cascading multiple-hazard are not simply events with proximate timing or locations by
coincidence. They are events that are explicitly linked to the same original trigger hazard, and
thus are part of a broader single disaster occurrence.
27. “A slow-onset disaster “emerges gradually over time. Slow-onset disasters could be associated
with, e.g., drought, desertification, sea level rise, epidemic disease.” (UNGA, 2016). Slow-onset
disasters emerge after a period of slowly evolving catastrophic risk, which, given available data
and the right monitoring conditions, can be identified early in order to develop preventative and
mitigation measures for minimizing impacts in advance of the emergency.
28. “A sudden-onset disaster is one triggered by a hazardous event that emerges quickly or
unexpectedly. Sudden-onset disasters could be associated with, e.g., earthquake, volcanic
eruption, flash flood, chemical explosion, critical infrastructure failure, and transport accident.”
(UNGA, 2016).
Scale
6 See statistics on humanitarian aid at stats.oecd.org
DRAFT FOR CONSULTATION – please do not quote or reference
17
29. Scale of impacts is another important characteristic for organization and presentation of statistics.
Usually, large scale disasters are less frequent but also attract international attention and solidarity
for response and assistance. Smaller scale disasters have less extensive impacts, but may be more
frequent and the cumulative effect can be very significant but also more likely underrepresented
by current databases.
30. It is a common practice of disaster management agencies to categorize disaster occurrences
according to a 3-category scale (minor, moderate, and large scale occurrences). There are various
ways for classifying scale. The recommended (first tier) approach is to refer to the geographic
scale of the call for emergency and support, i.e.: national scale, regional, or local scale disasters.
The use of the geography of the call for emergency is useful as a generic proxy measure for the
scale of the impacts to society.
31. Large disasters are disasters in which the emergency is at a national (or higher) sale and have
special characteristics of interest for analysis because they are relatively rare but have extensive
and long-term effects on sustainable development. Large disasters are often also covered by post
disaster assessment studies, creating opportunities for more comprehensive and more detailed
compilations of statistics on direct and indirect impacts. The impacts of large disasters often cross
administrative boundaries, including international borders, and therefore recordings of statistics
for large scale events are usually applicable to multiple reporting regions. An example was
Cyclone Evan (2012), which caused major damages in Fiji and Samoa, spurring separate
internationally-funded post disaster assessment studies in both countries.
32. Medium and small scale disasters refer to emergencies at smaller than national geographic
scales, which usually result in relatively smaller values of impacts aggregated at the national scale
but with large shares of the total number of disaster occurrences for a country or region. This
distinction is related to the concept of intensive and extensive risk from disasters developed by
UNISDR (2015). “Extensive risk is used to describe the risk associated with low-severity, high-
frequency events, mainly associated with highly localized hazards. Intensive risk is used to
describe the risk associated to high-severity, mid to low-frequency events, mainly associated with
major hazards.”
Disaster Occurrences Time Series
33. Disasters occur randomly in space and over time, which makes analysis of their impacts also
highly sensitive to the time period. The current international standard for a baseline time series
analysis of disaster impacts statistics from the Sendai Framework and SDGs is the 16-year period
from 2015-2030. For some other analytical purposes, such as for risk assessments by hazard
types, a much longer time period is needed.
34. Since disasters occur randomly, trends are easier to identify over a relatively longer time period.
Although year to year variations in disaster impacts are highly susceptible to randomness of
disaster occurrences, compilations of annual statistics within the databases allow for flexibility by
users to modify their own selections of time periods for their analysis. Flexibility is important
because, in some extreme cases, inclusion (or exclusion) within the timer period of one particular
abnormal occurrence could dramatically change the analyses. Choices in relation to time periods
for dissemination and analyses of statistics vary depending on the special characteristics of hazard
types. For example, the time scale for occurrences of earthquakes and tsunamis is typically much
longer than certain types of floods or meteorological hazards.
2b) Disaster risk

DRAFT FOR CONSULTATION – please do not quote or reference
18
Background
1. Improved utilization of official statistics for understanding disaster risk is a basic motivation
for development of DRSF and its implementation in national statistical systems. Improved
understanding of risk is also priority number one of the Sendai Framework.
2. Disaster risk “is the potential loss of life, injury, or destroyed or damaged assets which
could occur to a system, society or a community in a specific period of time, determined
probabilistically as a function of hazard, exposure, vulnerability and capacity.” (UNGA,
2016)
3. Disasters are the outcome of present conditions of risk, including exposure to a hazard and
the related patters of population and socioeconomic development. (UNGA, 2016) “Disaster
risk is geographically highly concentrated and very unevenly distributed” (Pelling, in UNU
2013). Measurement must account for extreme variability of risk with a broad coverage of
the land and population while also targeting relatively high-risk hotspots with disagregated
statistics.
4. Statistics on the underlying risk are the contextual information for analyzing statistics on
disaster impacts and for understanding how impacts from disasters can be reduced for the
future.
5. Paragraph 6 of the Sendai Framework, states:
“More dedicated action needs to be focused on tackling underlying disaster risk drivers,
such as the consequences of poverty and inequality, climate change and variability,
unplanned and rapid urbanization, poor land management and compounding factors such as
demographic change, weak institutional arrangements, non-risk-informed policies, lack of
regulation and incentives for private disaster risk reduction investment, complex supply
chains, limited availability of technology, unsustainable uses of natural resources, declining
ecosystems, pandemics and epidemics. Moreover, it is necessary to continue strengthening
good governance in disaster risk reduction strategies at the national, regional and global
levels and improving preparedness and national coordination for disaster response,
rehabilitation and reconstruction, and to use post-disaster recovery and reconstruction to
‘Build Back Better’, supported by strengthened modalities of international cooperation.”
6. Disaster risk is dynamic and its measurement is capture, in part, by common work of
national statistics offices and other providers of official statistics at the national level, such
as: demographic changes, poverty and inequality, structure of the economy, expenditure,
economic production, conditions of ecosystems, and land management.
7. The focus in DRSF is to clarify the role of official statistics as inputs, made as accessible as
possible, for risk assessments. In Birkman (2013), Mark Pelling describes two
complementary types of risk assessment internationally: risk indices and hotspots. UNDP
and UNEP-GRID have been among the leading international agencies developing global
disaster risk indices (or DRIs). DRIs can be developed for individual hazard types (e.g. for
floods or cyclones) or multi-hazard risk, i.e an index covering multiple hazard types.
DRAFT FOR CONSULTATION – please do not quote or reference
19
8. The early DRI analyses were conducted mainly at a national scale (e.g. in comparison to
GDP and population density at the national scale) instead of as analyses of the areas exposed
to or directly affected by the hazards. The hotspots approach follows a similar model that
has been used in the domain of biodiversity, and focuses on applying analyses at a more
geographically detailed scale, utilizing key data that can indicate relatively high levels of
likelihood for hazards combined with exposure and vulnerabilities of the population. Many
interesting examples are emerging, for example in the disaster management agency of
Indonesia (BNPB), which is tracking statistical information on economic activities (derived,
e.g., from local tax revenue records) and on children (from administrative records on
enrolment in schools) in relation to the hazard areas of the country.
9. Modern versions of DRIs and other models that can be found in the literature now
incorporate both approaches through geographically disaggregated statistics and analysis
using geographic information systems (GIS) . An advantages of the GIS-based risk
production of statistics for assessment is the potential to apply the methods at different
levels of geographic scale, i.e. at the global, national or regional scales, or for hotspots.
Scope of measurement
10. In the literature and current practice of many disaster management agencies (e.g. the national
disaster management agency of Indonesia, BNPB), disaster risk is defined and measured
according to three core elements: exposure to hazards, vulnerability and coping capacity.
𝑅𝑖𝑠𝑘 = 𝑓(𝐻𝑎𝑧𝑎𝑟𝑑, 𝑉𝑢𝑙𝑛𝑒𝑟𝑎𝑏𝑖𝑙𝑖𝑡𝑦, 𝐶𝑎𝑝𝑎𝑐𝑖𝑡𝑦)
11. This basic definition for measurement of risk appears in many sources in the disaster risk
reduction literature, and has also been known as the PAR model (Birkman, 2013). Disasters
occur at the intersection of the hazard (e.g. an earthquake) and the human processes
generating exposure, vulnerability and coping capacity. Risk of impacts from a disaster is
not driven only by the scale of the hazard itself (e.g. force of energy of the earthquake or
category of storm) but equally so by social factors that create exposure, vulnerability and
coping capacity (UNISDR, 2015).
12. The three elements of exposure to hazards, vulnerability and coping capacity are not
independent factors of risk. This basic formula is useful as the conceptual basis for defining
the scope and organizing statistics on risk in DRSF. It should not to be taken literally as a
mathematical formula for econometrics.
Estimating exposure to hazards
13. There are two main elements to measuring hazard exposure; there is a probabilistic mapping
of the hazard on the one side and a complement mapping of the population, critical
infrastructure (and other objects of interest such as high nature value ecosystems) for the
exposure side.
DRAFT FOR CONSULTATION – please do not quote or reference
20
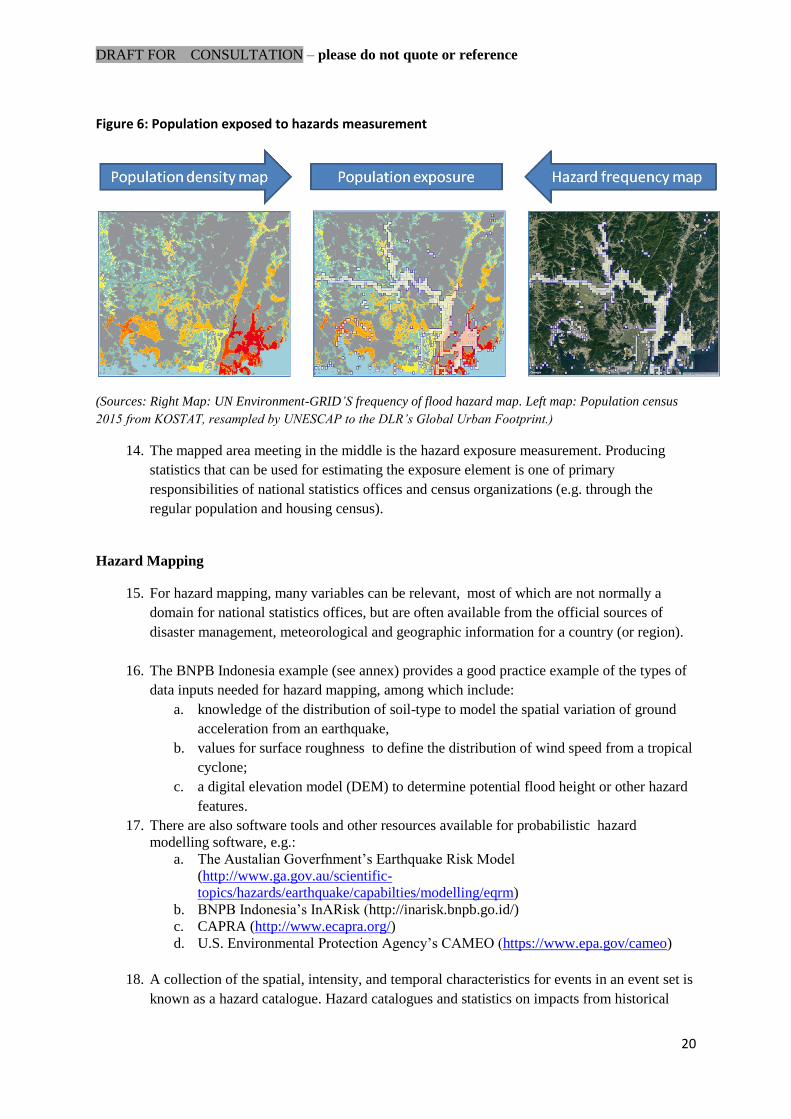
Figure 6: Population exposed to hazards measurement
(Sources: Right Map: UN Environment-GRID’S frequency of flood hazard map. Left map: Population census
2015 from KOSTAT, resampled by UNESCAP to the DLR’s Global Urban Footprint.)
14. The mapped area meeting in the middle is the hazard exposure measurement. Producing
statistics that can be used for estimating the exposure element is one of primary
responsibilities of national statistics offices and census organizations (e.g. through the
regular population and housing census).
Hazard Mapping
15. For hazard mapping, many variables can be relevant, most of which are not normally a
domain for national statistics offices, but are often available from the official sources of
disaster management, meteorological and geographic information for a country (or region).
16. The BNPB Indonesia example (see annex) provides a good practice example of the types of
data inputs needed for hazard mapping, among which include:
a. knowledge of the distribution of soil-type to model the spatial variation of ground
acceleration from an earthquake,
b. values for surface roughness to define the distribution of wind speed from a tropical
cyclone;
c. a digital elevation model (DEM) to determine potential flood height or other hazard
features.
17. There are also software tools and other resources available for probabilistic hazard
modelling software, e.g.:
a. The Austalian Goverfnment’s Earthquake Risk Model
(http://www.ga.gov.au/scientific-
topics/hazards/earthquake/capabilties/modelling/eqrm)
b. BNPB Indonesia’s InARisk (http://inarisk.bnpb.go.id/)
c. CAPRA (http://www.ecapra.org/)
d. U.S. Environmental Protection Agency’s CAMEO (https://www.epa.gov/cameo)
18. A collection of the spatial, intensity, and temporal characteristics for events in an event set is
known as a hazard catalogue. Hazard catalogues and statistics on impacts from historical
DRAFT FOR CONSULTATION – please do not quote or reference
21
events together with risk models can be used in a deterministic or probabilistic manner.
Deterministic risk models are used to assess the impact of specific events on exposure.
Typical scenarios for a deterministic analysis include renditions of past historical events,
worst-case scenarios, or possible events at different return periods. A probabilistic risk
model contains a compilation of all possible “impact scenarios” for a specific hazard and
geographical area. A goal for probabilistic hazard modelling is convergence of results and a
long time series of input data is usually necessary. For example, a simulation of 100 years of
hazard events is too short to determine the return period and random samples over a period
of 100 years of events could easily omit events, or include multiple events.
19. According to IPCC, three changes are likely to be observed for climate-related hazards for
some geographic regions as a result of rising global temperatures: increases in frequency,
severity, and decreased predictability of hazards. Thus, climate change has contributed to the
dynamic nature of hazards, as an input into the formula for assessing risk. Other risk factors
(exposure, vulnerability, capacity) are, for different reasons, also highly dynamic.
Exposure Statistics
20. For the exposure side, the objective is to measure people, infrastructure, housing, production
capacities and other assets located in hazard-prone areas.
21. Exposure statistics have dual purposes in disaster statistics. In addition to one of the three
basic metrics for disaster risk, exposure statistics are also useful as baseline statistics for
assessing (or estimating) impacts after a disaster.
22. An approach has been developed for DRSF (see annex), applying the available population
census data using GIS. A method was developed and pilot tested among countries in Asia
and the Pacific to demonstrate the possibilities for applying census statistics for estimating
population exposure to hazard at different scales, based on the available public access
population census counts by administrative region (which can be accessed from national
statistics offices at different scales, depending on the country). The methodology7 was
developed and tested among Expert Group countries during 2016 and 2017 and a complete
step-by-step manual describing the steps to replicate the output statistics for any country
using the available population data from census authorities.
23. The basic objective for this methodology is to provide national agencies with a simple,
reproducible and scalable approach to producing statistics on population exposure, i.e.
estimations of population density in areas exposed to natural hazards or disasters from
publically-accessible data sources.
24. The difference in geographic distribution of hazard areas as compared to the normal
dissemination of population data (i.e. administrative areas at sub-regional or district levels )
creates the requirement to re-allocate t distribution (down-scale) population data so that it
7 See full methodology descriptions at the Expert Group website (http://communities.unescap.org/asia-pacific-
expert-group-disaster-related-statistics)
DRAFT FOR CONSULTATION – please do not quote or reference
22
can be overlaid with a reasonable degree of accuracy to the actual geographic areas of a
hazard or disaster. The basic requirement is assimilation of population statistics or other
exposure elements (e.g. critical infrastructure) with the hazard maps. The methodology
developed for DRSS\F uses a grid-based assimilation of census data in GIS.
Figure 7: Grid-based data assimilation
source: Jean-Louis Weber, CBD Technical Series 77, 2014
25. Generally, the lower the level of geographic detail of the population aggregates (e.g.
administrative regions 01, 02, 03), the more accurate the gridded estimates of population
density should be for producing statistics on hazard exposure.
26. So, for example, in cases such as Tonga, in the Pacific, where census data are accessible by
GPS coordinates, no modelled estimation is required as the census records effectively reveal
point locations for households and the number of people living there (among other relevant
data from the census). These statistics can be used for highly accurate and high-resolution
analyses of location of population with respect to other geographic elements8, including in
relation to hazard area. The most detailed level of geographic area for data collected by the
census organisations are geographic areas called census blocks, which are instruments for
organizing census collection operations and usually contain somewhere between 50-200
households, depending on the country and region. Most commonly, the census data that are
available to users is at the level of administrative region (e.g. provinces, municipalities or
administrative level 01).
27. Pilot studies for the population exposed to hazards estimation methodology revealed that,
with high quality data of built-up areas such as the DLR Global Urban Footprint (GUF)
produced from radar satellite images (accessible at https://urban-tep.eo.esa.int/#), it is
8 See the Pacific Community’s POPGIS tool (prism.spc.int)
Satellite
images
Hotspots,
Occurences
,
Monitoring
data, samples
Socio-
economic
statistics
Classify,
aggregate
& map
Extrapolate
Overlay
Data inputData assimilation
(e.g. within
1 ha or 1 km2 grids)
Statistics integration,
analysis & reporting
Ref. Geo-
DataCode, Name
Disaggregate
& map
Data QA/QC,
analysis &
processing
e.g. by
administrative
unitse.g. by river
catchments or risk
perimeters…

DRAFT FOR CONSULTATION – please do not quote or reference
23
possible to estimate location of population using a simple model with results that are at
least comparable with other existing international estimations (such as, e.g., by
Worldpop.org (http://maps.worldpop.org.uk/#/ or by Global Human Settlement Layer by
JRC http://ghslsys.jrc.ec.europa.eu/) based on census results produced for public use by
national statistics offices. Due to the method’s simplicity, transparency and the opportunity
for free access to high resolution GUF data, reproducing estimations for population to hazard
exposure is feasible at different scales according to the detail of population data available
and to varying policy requirements.
28. Hazard exposure statistics come in the form of maps that are also very simply converted into
standardized statistical tables. The figure below summarizes the basic inputs from the
hazard and the exposure side, which will have close relationships to the measurement of
vulnerability.
Figure 8: Hazard Exposure Model
Summary Statistics Table B1b: Population Exposure by Population Groups
DRAFT FOR CONSULTATION – please do not quote or reference
24
0-45-60
60+M
aleFem
aleUrban
RuralDisabled
Poor
1Population
SDG 1.5.1,
Sendai A1,B1
SDG 1.5.1,
Sendai A1,B1
SDG 1.5.1,
Sendai A1,B1
SDG 1.5.1,
Sendai A1,B1
SDG 1.5.1,
Sendai A1,B1
SDG 1.5.1,
Sendai A1,B1
SDG 1.5.1,
Sendai A1,B1
SDG 1.5.1,
Sendai A1,B1
SDG 1.5.1,
Sendai A1,B1
SDG 1.5.1,
Sendai A1,B1
SDG 1.5.1,
Sendai A1,B1
SDG 1.5.1,
Sendai A1,B1
2Population in Hazard Areas
2.1Geophysical
2.1.1H
igh exposure
2.1.2M
oderate exposure
2.1.3Low
exposure
2.2Hydrological
2.2.1H
igh exposure
2.2.2M
oderate exposure
2.2.3Low
exposure
2.3Biological
2.3.1H
igh exposure
2.3.2M
oderate exposure
2.3.3Low
exposure
2.4M
eteorological & Clim
atalogical2.4.1
High exposure
2.4.2M
oderate exposure
2.4.3Low
exposure
2.5O
ther [specify]
2.5.1H
igh exposure
2.5.2M
oderate exposure
2.5.3Low
exposure
TOTAL
C2a4 - Specific
vulnerability groupsN
O
TOTAL
C2a1 - Age groupsTO
TALC2a2 - G
ender groupsTO
TAL
C2a3 - Urban/Rural
population
DRAFT FOR CONSULTATION – please do not quote or reference
25
Vulnerability
29. The Sendai Framework recommendations adopted by the UN General Assembly in 2016
defined vulnerability as “the conditions determined by physical, social, economic and
environmental factors or processes which increase the susceptibility of an individual, a
community, assets or systems to the impacts of hazards.”
30. In some reports, terminologies such as susceptibility, exposure, sensitivity, fragility, and
coping capacity have been used interchangeably with vulnerability. Also the variables for
describing different type of risk factors are not always independent. However, from a
measurement perspective, vulnerability is a distinct and useful concept for organizing
statistics on the baseline conditions, as descriptions of the population and infrastructure, a
step beyond the simple overlapping of location with hazards (i.e. exposure).
31. Previous studies can suggest a potential short list for geographically disaggregated variables
for compilation to improve the availability of reference statistics for identifying potentially
vulnerable segments of the population, such as:
Median household disposable income
Education enrolment, by age group and level of achievement an by male and female
heads of households
Information on assets of households, such as type of dwelling
Other human development statistics, by age group, including evidence related to
nutrition and childhood health,
Type of employment, e.g. identifying households engaged in agriculture of fishing
Urban versus rural distribution of affected or exposed areas
32. All of the above are items for potential disaggregation of the exposed populations, where
available, and could be compiled into basic summary statistics on disaster risk, similar to
DRSF table B1b. The same information is also avaialable in the form of gridded maps and
could be disseminated at different scales of geographic disaggregation, as needed for the
risk assessment studies.
33. Vulnerability arises from a wide variety of causes. Children are more vulnerable than adults
for physiological reasons. Women could be more vulnerable as a result of social factors,
related to (e.g.) type of employment or economic status. Studies of vulnerabilities for ageing
populations have revealed location and type of residence can be a good reference for
assessing vulnerability for the elderly, especially in cities.
34. If the statistics used in vulnerability assessments are gathered and updated on a regular
basis by geographic regions and specifically for hazard areas within countries, than disaster
management agencies would have a priori information on extent and specific locations
(among other characteristics) of vulnerability for developing targeted disaster risk reduction
or response strategies at local and national levels, in alignment with the overarching
objective of Sustainable Development Goals and of not leaving anyone behind.
DRAFT FOR CONSULTATION – please do not quote or reference
26
35. Vulnerability assessments for disasters cut across three traditional sustainable development
pillars (economic, social, and environmental) and measusrement goes beyond people or
households. For example, although pollution in water bodies is generally considered as an
environmental problem, in the context of disaster risk, pollution is also a social and
economic liability because it can lead to significantly worse impacts to human lives and
health and to the economic costs of recovery. Another example is vulnerability of assets (or
infrastructure), which is sometimes called “physical vulnerability”. The response of existing
structures to potential hazards is not only an engineering problem. In most cases, physical
vulnerability also stems from other social-economic or environmental problems. Relatively
poor households often have little choice but to accept relatively less resilient shelters in their
dwellings or work places. Poorer communities, such as slums or lower income areas of urban
sprawl, often are also the most e likely to be situated in areas with environmental
vulnerabilities affecting the degree of exposure to hazards.
36. The 2010 World Development Report (World Bank, 2010) stated that “natural systems,
when well-managed, can reduce human vulnerability”. Examining and supporting cases of
positive synergies between environmental protections, also called ‘pro poor environmental
policies’ is one of the objectives for the United Nations Poverty and Environment Initiative
(PEI). Wherever environments are heavily polluted or degraded, often it is the relatively
poor populations that are more likely to be disproportionately affected and, by extension,
more vulnerable in the event of a disaster.
37. Population density and geographic location are the basic dimensions of exposure
measurement, but they also can be factors for vulnerability. Many rural communities face
marginally higher vulnerabilities due to the generally poorer access to transportation, health
facilities, and other types of critical infrastructure or support services. The largest share of
people living in poverty also tends to be in rural areas in developing countries. On the other
hand, other facets of rural communities, such as informal community support systems, could
be notable sources of resilience.
38. The defining characteristic of the urban centres, particularly the megacities, many of which
are located in coastal zones or otherwise hazardous locations in Asia and Pacific, is extreme
population density. While there are social benefits to having large groups of people
concentrated within relatively small geographic areas, such conglomerations can be
inherently vulnerable to impacts from hazards. Also, the characteristics of urban slums9, as
defined by the United Nations Human Settlements Programme (UN-Habitat) are likely to be
key factors for vulnerability in those communities.
39. Economic-related vulnerabilities include structural factors that are specific to geographic
regions within countries. For example, tourism and agriculture both have characteristics that
can lead to increased vulnerability to impacts from a disaster as compared to other types of
economic activity. So, economies based on agriculture and other kinds of productive
activities that are space intensive and/or heavily dependent on meteorological and other
9 A slum household suffers: lack of access to improved water source, lack of access to improved sanitation
facilities, lack of sufficient living area, lack of housing durability or lack of security of tenure (UN-
Habitat,2016)
DRAFT FOR CONSULTATION – please do not quote or reference
27
environmental conditions will, in most cases, be relatively more vulnerable to natural
hazards as compared to, for example, services-based economies. Thus, some of the
economic vulnerabilities to disasters are assessed through macroeconomic analysis on the
structure of economies for specific geographic areas exposed to hazards.
Coping capacity
40. The term “resilience” has been applied in reports on disaster risk reduction with various
meanings or descriptions. Commonly, resilience is mentioned almost interchangeably with
the concept of coping capacity. This is the ability for households or businesses or
infrastructure to withstand external shocks without sustaining major permanent negative
impacts, and instead guiding towards opportunities for improvements in the future (e.g..
“building back better”).
41. Birkman (2013) writes: “In contrast to vulnerability, resilience emphasizes that stressors and
crises in social-ecological systems also provide windows of opportunity for change and
innovation. Hence crises and destabilization processes are seen as important triggers for
renewal and learning.”
42. Many strategies for coping with disasters are informal and not managed by governments or
through regulations, and therefore their significance to understanding risk is difficult to
measure with statistics. For example, one of the coping mechanisms in the case of drought or
other types of climate or hydrological-related hazards is simply migration, either
permanently or temporarily, in search of a livelihood outside the worst affected areas.
Population displacement and other movements of the population that correspond in timing
with a disaster can sometimes be captured via statistics from population censuses or
population administrative records. More difficult is to attribute movements specifically to
hazards or a past disaster.
43. There also are coping mechanisms which are organized efforts that can be captured by
statistics for disaster risk assessments. Disaster preparedness is a good example. After major
earthquakes struck in the Canterbury province of New Zealand, population and housing
census results revealed significant increases in disaster preparedness of households (e.g.
rationing emergency food and water storage). Such information reveals a decrease in overall
risk, via increased coping capacities, and also direct benefits from learning and from
educational programmes enacted after the experience of previous disasters.
44. Basic statistics on coping capacities are an important input for understanding risk, but an
additional use for statistics on coping capacity is to show direct results from investments in
increased preparedness. Disaster management agencies utilize the best available risk
information to design and implement activities to reduce the impacts of disasters. The aim of
these activities is that they improve preparedness and strengthen the overall resilience of a
community before a hazard or disaster.
45. Disaster risk reduction-related activities (see Section 2e) are activities that boost the coping
capacities of society. In order to assess the direct results of these investments, governments

DRAFT FOR CONSULTATION – please do not quote or reference
28
should also collect statistics for assessing how these investments affect coping capacities,
e.g. coverage of early warning systems and the basic knowledge and preparedness of
households.
46. People are not equally able to access the resources and opportunities (or knowledge and
information about hazards). The same social processes involved in the disadvantages of
poverty also can have a significant role in determining their level of preparedness and
access to information and knowledge. (Wisner et al., 2003). Thus, at the household level,
vulnerability and coping capacity are related measurements.
Summary Statistics Table B3: Coping Capacity Background Statistics
Geographic disaggregation
Geo Region
1
Geo Region
2
Geo Region
3… National
Measuremen
t Unit
Coping Capacity Table1 GDP SDG 1.5.2 SDG 1.5.2 SDG 1.5.2 SDG 1.5.2 SDG 1.5.2 Currency
2 GDP per capita Currency
3 Median Households disposable income Currency
3.1 Local currency (NAME...)Currency
3.2 US$ PPP US$ PPP
4 Number of dwellings with slum
designation
no. of units
5 Population living in areas with slum
designation
no. of people
No. of systems
6.1 Population covered Sendai G-3 Sendai G-3 Sendai G-3 Sendai G-3 Sendai G-3 %
6.2 Share of population in exposure areas covered %
6.3InvestmentExpenditure (also DRRE_A,
3.2) Currency
7.1 Share of households with emergency plan %
7.2 Share of households with backup storage of food and water %
7.3 Share of households with improved access to water and sanitation %
7.4 Other Preparedness (houehold level) %
8.1 Forest area sq km
8.2 Share of water bodies in good condition %
8.3 Other ecosystem condition measures
Currency
9.1 Disaster risk reduction characteristic transfers received Currency
9.2 Disaster Risk Prevention Currency
9.3 Disaster Risk Mitigation Currency
9.4 Disaster Management Currency
9.5 Disaster Recovery Currency
9.6 General Government, Research & Development, Education Expenditure Currency
Currency
6 Early Warning Systems
9 Risk Reduction Activity
10 DRRCA Transfers fom Central to local
government
7 Household Preparedness
8 Environmental Resilience
DRAFT FOR CONSULTATION – please do not quote or reference
29
47. For producing, and utilizing in risk assessment, the many potentially relevant variables on
disaster risk, the key requirement is geographic disaggregation. Data assimilation in GIS
creates possibilities to apply the available data to produce and communicate statistics at
multiple scales. At a minimum, variables identified for vulnerability to disasters should be
compiled to the lowest available sub-national administrative regions (e.g. Administrative
region 02 or 03). In DRSF background statistic tables, all variables are organized according
to geographic regions used for statistics within the country. In reporting tables, geographic
disaggregation is predetermined by existing practices and requirements of users. However,
within GIS, geographic regions can be defined or adapted to the specific analysis.
48. Often it is useful to define homogenous regions --- e.g. urban and rural, residential and non-
residential, agricultural land, etc. One of the basic inputs for developing exposure statistics
are land cover and land use maps and, where available, the cadastres of municipalities. Land
cover and land use maps, among other kinds of geospatial information, serve an additional
purpose in DRSF by providing baseline information for defining specific geographic objects
of interest in risk assessment.
49. Risk statistics differ from impacts statistics in that they are baseline information about the
population or infrastructure compiled prior to a disaster whereas impacts statistics are
information for describing population affected by a specific and unique disaster occurrence.
Producing impacts statistics requires not only geographic data disaggregation but also
disaggregation according to the different types of demographic and social groups in the
affected area. The disaggregation of statistics for the affected population (see section 2d)
should, in many cases, mirror the groups that were identified in the vulnerability assessments
– e.g. children, the elderly and the income poor – and eventually the two types of
assessments should become mutually reinforcing to improve one another, built upon the
same basic initial data collections used for disaster risk measurement. For example, baseline
statistics on economic activity for areas exposed to hazards can be reused for estimating
costs of damages in impacts assessments.
50. Increasingly, traditional data sources of the national statistical system like household and
business registers, household and business surveys, population and housing censuses are
conducted with use of detailed geographic referencing. The geographic referencing may be
confidential at the level of individual records, but summary statistics can be disseminated for
use for comparisons for relative levels of risk at practically any scale. The quality and level
of detail of available data with geographic location referencing of households, businesses,
and other land uses, varies greatly between countries, and sometimes within countries (e.g.
between rural areas and urban centres). But the broad trend for official statistics has been a
rapid expansion in the possibilities, using affordable tools and the existing data, to greater
level of flexibility and level detail for geographic disaggregation of statistics on risk.
2c) Material Impacts and Economic Loss
Material Impacts

DRAFT FOR CONSULTATION – please do not quote or reference
30
1) Direct material impacts encompass damages to assets, including critical infrastructure,
triggered by a hazard. Direct material impacts also constitute the source of direct economic
loss measurement, as defined for the Sendai Framework (see section on International
Indicators)
2) Initially, statistics on direct material impacts are produced by disaster management agencies
based on assessments conducted immediately after an emergency (UNGA, 2016). These
statistics are complemented by statistical information on the location and basic characteristics
of infrastructure in a disaster areas known prior to the hazard, i.e. estimates of exposed
infrastructure.
3) Background statistics on infrastructure serve a dual purpose of baseline or contextual
information for analyses of impacts data and as inputs to estimating risk prior to a disaster.
4) Also complementing assessments of material impacts by the disaster management agencies
are results of analysis of regular sources of time series statistics within the national statistical
system, such as the population and housing census, business surveys, and compilations of
other records of economic activity that are used to evaluated trends on a continuous basis, i.e.
before, during, and after disasters. In particular, comparisons for an affected area before and
after a disaster can be used to estimate the extent of materials impacts and their economic
costs.
5) Basic statistics on material impacts from a disaster are compiled, initially, in physical terms,
i.e. in terms of area (sq. m), or volume, number of people affected, or counts of units (or
buildings) that are damaged or destroyed. Defining measurement units (see discussion in
Chapter 6) is a crucial step for designing the collection and dissemination of a robust and
consistent compilation of material impacts statistics. The scope of meausurement is defined
according to the stocks of physical assets potentially exposed to hazards ( see classification of
material impacts in Chapter 5). Prioritization is given to especially important groups of assets,
such as the critical infrastructure and agricultural crops.
6) There are multiple possibilities, with rangin analytical relevance for measurement units and
other choices for compiling direct material impacts from historical disasters in physical units.
Ccollection of basic data on number of units (e.g. no of buildings) of the differtent categories
of critical infrastructure, see example below from the Philippines, is a good starting point. On
this basis, additional data – e.g. classes of hospitals damaged, length of roads, numbers of
people affected by disruptions, and so on, can be integrated for the production of statistics
needed for assessing the scale of the impacts and the recovery needs.
Sample Table 1: Damages to Critical Infrastructure in the Philippines, 2013-15
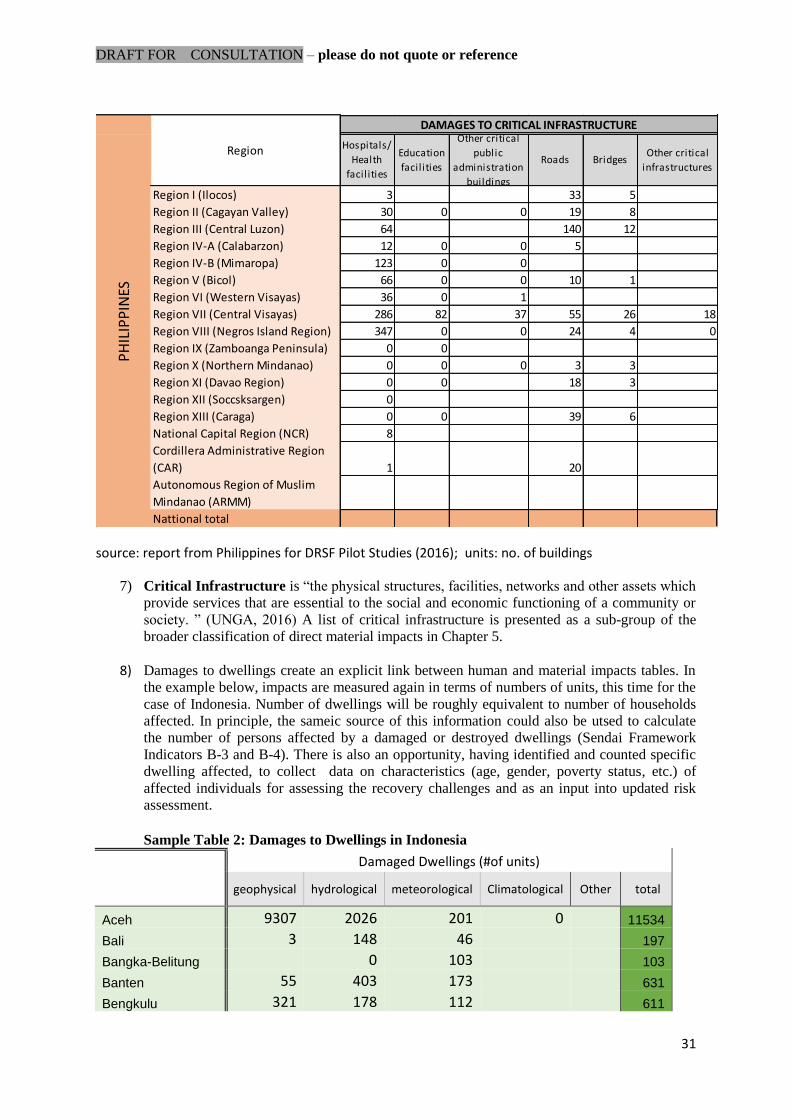
DRAFT FOR CONSULTATION – please do not quote or reference
31
source: report from Philippines for DRSF Pilot Studies (2016); units: no. of buildings
7) Critical Infrastructure is “the physical structures, facilities, networks and other assets which
provide services that are essential to the social and economic functioning of a community or
society. ” (UNGA, 2016) A list of critical infrastructure is presented as a sub-group of the
broader classification of direct material impacts in Chapter 5.
8) Damages to dwellings create an explicit link between human and material impacts tables. In
the example below, impacts are measured again in terms of numbers of units, this time for the
case of Indonesia. Number of dwellings will be roughly equivalent to number of households
affected. In principle, the sameic source of this information could also be utsed to calculate
the number of persons affected by a damaged or destroyed dwellings (Sendai Framework
Indicators B-3 and B-4). There is also an opportunity, having identified and counted specific
dwelling affected, to collect data on characteristics (age, gender, poverty status, etc.) of
affected individuals for assessing the recovery challenges and as an input into updated risk
assessment.
Sample Table 2: Damages to Dwellings in Indonesia
Damaged Dwellings (#of units)
geophysical hydrological meteorological Climatological Other total
Aceh 9307 2026 201 0 11534
Bali 3 148 46 197
Bangka-Belitung 0 103 103
Banten 55 403 173 631
Bengkulu 321 178 112 611
Region I (Ilocos) 3 33 5
Region II (Cagayan Valley) 30 0 0 19 8
Region III (Central Luzon) 64 140 12
Region IV-A (Calabarzon) 12 0 0 5
Region IV-B (Mimaropa) 123 0 0
Region V (Bicol) 66 0 0 10 1
Region VI (Western Visayas) 36 0 1
Region VII (Central Visayas) 286 82 37 55 26 18
Region VIII (Negros Island Region) 347 0 0 24 4 0
Region IX (Zamboanga Peninsula) 0 0
Region X (Northern Mindanao) 0 0 0 3 3
Region XI (Davao Region) 0 0 18 3
Region XII (Soccsksargen) 0
Region XIII (Caraga) 0 0 39 6
National Capital Region (NCR) 8
Cordillera Administrative Region
(CAR) 1 20
Autonomous Region of Muslim
Mindanao (ARMM)
Nattional total
PH
ILIP
PIN
ES
Region
DAMAGES TO CRITICAL INFRASTRUCTURE
Hospitals/
Health
facil ities
Education
facil ities
Other critical
public
administration
buildings
Roads BridgesOther critical
infrastructures
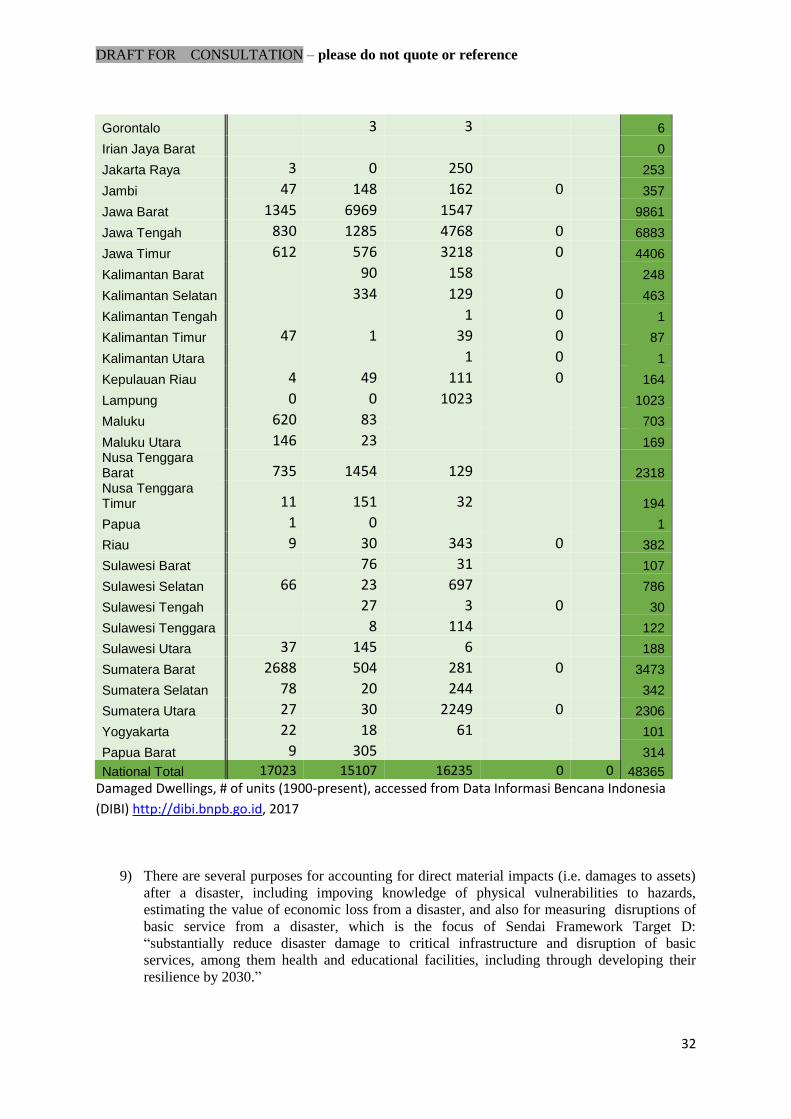
DRAFT FOR CONSULTATION – please do not quote or reference
32
Gorontalo 3 3 6
Irian Jaya Barat 0
Jakarta Raya 3 0 250 253
Jambi 47 148 162 0 357
Jawa Barat 1345 6969 1547 9861
Jawa Tengah 830 1285 4768 0 6883
Jawa Timur 612 576 3218 0 4406
Kalimantan Barat 90 158 248
Kalimantan Selatan 334 129 0 463
Kalimantan Tengah 1 0 1
Kalimantan Timur 47 1 39 0 87
Kalimantan Utara 1 0 1
Kepulauan Riau 4 49 111 0 164
Lampung 0 0 1023 1023
Maluku 620 83 703
Maluku Utara 146 23 169 Nusa Tenggara Barat 735 1454 129 2318 Nusa Tenggara Timur 11 151 32 194
Papua 1 0 1
Riau 9 30 343 0 382
Sulawesi Barat 76 31 107
Sulawesi Selatan 66 23 697 786
Sulawesi Tengah 27 3 0 30
Sulawesi Tenggara 8 114 122
Sulawesi Utara 37 145 6 188
Sumatera Barat 2688 504 281 0 3473
Sumatera Selatan 78 20 244 342
Sumatera Utara 27 30 2249 0 2306
Yogyakarta 22 18 61 101
Papua Barat 9 305 314
National Total 17023 15107 16235 0 0 48365
Damaged Dwellings, # of units (1900-present), accessed from Data Informasi Bencana Indonesia
(DIBI) http://dibi.bnpb.go.id, 2017
9) There are several purposes for accounting for direct material impacts (i.e. damages to assets)
after a disaster, including impoving knowledge of physical vulnerabilities to hazards,
estimating the value of economic loss from a disaster, and also for measuring disruptions of
basic service from a disaster, which is the focus of Sendai Framework Target D:
“substantially reduce disaster damage to critical infrastructure and disruption of basic
services, among them health and educational facilities, including through developing their
resilience by 2030.”
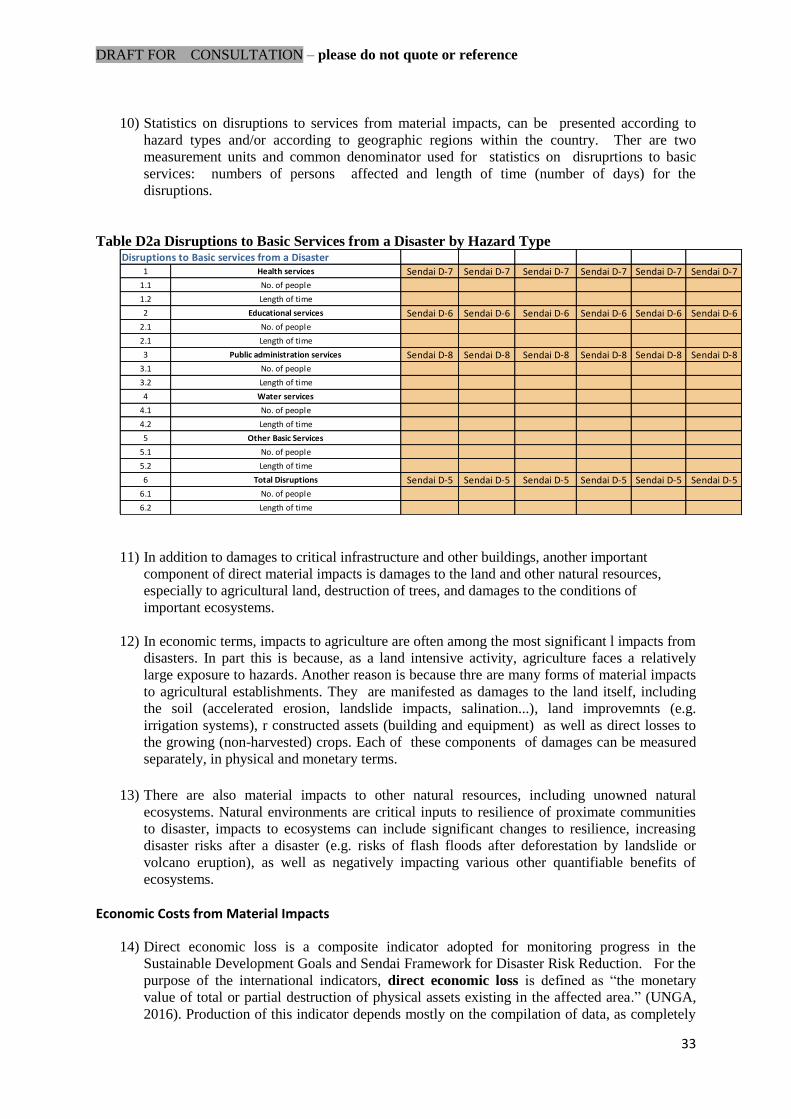
DRAFT FOR CONSULTATION – please do not quote or reference
33
10) Statistics on disruptions to services from material impacts, can be presented according to
hazard types and/or according to geographic regions within the country. Ther are two
measurement units and common denominator used for statistics on disruprtions to basic
services: numbers of persons affected and length of time (number of days) for the
disruptions.
Table D2a Disruptions to Basic Services from a Disaster by Hazard Type
11) In addition to damages to critical infrastructure and other buildings, another important
component of direct material impacts is damages to the land and other natural resources,
especially to agricultural land, destruction of trees, and damages to the conditions of
important ecosystems.
12) In economic terms, impacts to agriculture are often among the most significant l impacts from
disasters. In part this is because, as a land intensive activity, agriculture faces a relatively
large exposure to hazards. Another reason is because thre are many forms of material impacts
to agricultural establishments. They are manifested as damages to the land itself, including
the soil (accelerated erosion, landslide impacts, salination...), land improvemnts (e.g.
irrigation systems), r constructed assets (building and equipment) as well as direct losses to
the growing (non-harvested) crops. Each of these components of damages can be measured
separately, in physical and monetary terms.
13) There are also material impacts to other natural resources, including unowned natural
ecosystems. Natural environments are critical inputs to resilience of proximate communities
to disaster, impacts to ecosystems can include significant changes to resilience, increasing
disaster risks after a disaster (e.g. risks of flash floods after deforestation by landslide or
volcano eruption), as well as negatively impacting various other quantifiable benefits of
ecosystems.
Economic Costs from Material Impacts
14) Direct economic loss is a composite indicator adopted for monitoring progress in the
Sustainable Development Goals and Sendai Framework for Disaster Risk Reduction. For the
purpose of the international indicators, direct economic loss is defined as “the monetary
value of total or partial destruction of physical assets existing in the affected area.” (UNGA,
2016). Production of this indicator depends mostly on the compilation of data, as completely
Disruptions to Basic services from a Disaster1 Health services Sendai D-7 Sendai D-7 Sendai D-7 Sendai D-7 Sendai D-7 Sendai D-7
1.1 No. of people
1.2 Length of time
2 Educational services Sendai D-6 Sendai D-6 Sendai D-6 Sendai D-6 Sendai D-6 Sendai D-6
2.1 No. of people
2.1 Length of time
3 Public administration services Sendai D-8 Sendai D-8 Sendai D-8 Sendai D-8 Sendai D-8 Sendai D-8
3.1 No. of people
3.2 Length of time
4 Water services
4.1 No. of people
4.2 Length of time
5 Other Basic Services
5.1 No. of people
5.2 Length of time
6 Total Disruptions Sendai D-5 Sendai D-5 Sendai D-5 Sendai D-5 Sendai D-5 Sendai D-5
6.1 No. of people
6.2 Length of time
DRAFT FOR CONSULTATION – please do not quote or reference
34
as possible, on the estimated costs of reconstruction or replacement of damaged or destroyed
assets, as observed by disaster management agencies after an emergency.
15) UNISDR developed guidance for producing the direct economic loss indicators for
international monitoring of Target C in the Sendai Framework (UNISDR, 2016). However,
national agencies still face significant challenges for estimating the monetary value of direct
material impacs from disasters consistently across disasters and, as much as possible, with
established principles practices in economic stsatistics (e.g. the national accounts). There are
also a broader collection economic impacts, including the indirect economic impacts, that are
estimated as applications of basic statistics on material impacts. For consultation on this
draft, a working paper (see annex) was prepared on relationships between direct economic
loss measurement and the System of National Accounts (SNA) for the purpose of collecting
inputs and feedback from the Advisory Expert Group (AEG) on national accounts.
16) When it comes to estimating monetary value for direct economic loss, the challenge is to put
a value to the physical damages to assets observed by the disaster management agencies (and
other relevant authorities). These are negatives changes in volume to stocks of assets, to
which some estimation of economic value needs to be attached coherently, as much as
possible, across the full range of types of assets that were damaged or destroyed.
17) While there is a strong international demand for internationally comparable indicators of
direct economic loss, there is also an interest to produce multiple related figures, where
possible, in order to meet different purposes of economic analysis, including, subsequently,
for assessments of the indirect impacts of disasters. For the purpose of a fist-tier basic range
of disaster-related statistics, measurement of direct economic loss should follow, as much as
the definitions from UNGA (2016) and indicators guidance in UNISDR (2017.
18) For most cases, these are estimates for replacement costs of assets, as defined by the SNA
and in the classification of direct material impacts (chapter 5).
19) Conceptually, the replacement costs are value markers for changes to the stocks of assets, as
estimated according to the costs for recovery of pre-disaster assets. However, they are also
actual expenditures (recorded whenever the reconstruction activity takes place) and therefore
recorded as a contribution to overall national expenditure and GDP. In other words, while the
principle is to value changes in value of stocks of asset, the information for valuing the
changes is also found in activity (flow) accounts for production and expenditure.
Economic Impacts to Agriculture
20) Reconstruction or recovery costs for direct impacts to assets are not always available, even as
estimates and there is a need for exceptions for valuation of damages to certain types of
assets. A very important case for understanding the different types of scenarios for direct
impacts and their valuation in monetary terms s is the range of possible direct economic
impacts of disasters for agriculture, forestry and fisheries.
21) For agriculture, economic assets exposed to potential direct economic losses take a broad
range of forms: including land (or improvements to land, following the SNA definition) ,
machinery and equipment, and other resources like crops, livestock and plantations.
22) The measurement of the output of agriculture, forestry and fishing is complicated by the fact
that the process of production may extend over many months, or even years. Many

DRAFT FOR CONSULTATION – please do not quote or reference
35
agricultural crops are annual with most costs incurred at the beginning of the season when the
crop is sown and again at the end when it is harvested. Value for assets and crops may depend
on their maturity and closeness to harvest. According to the accounting principles, the value
of the crop has to be spread over the year and treated as work-in-progress. Often the final
value of the crop will differ from the estimate made for the growing crop before harvest. In
such cases revisions to the early estimates are made to reflect the actual outcome. When the
crop is harvested, the cumulated value of work-in-progress is converted to inventories of
finished goods that is then run down as it is used by the producer, sold or is lost to vermin.
[SNA 6.137] Thus, in principle, the value of losses of crops to a disaster (catastrophic
losses) depends on the timing of the hazard with respect to the timing in relation to
harvesting. In practice, the measurement can be simplified by estimating average per-unit
values for each agricultural output for the region affected at the time of the disaster (or at the
time of harvesting closest to the date of the hazard).
23) When it comes to livestock, and fisheries and to forest cover (cultivated and non-cultivated
forests are recognized as assets in the SNA), the approach could differ slightly from the case
of single-yield crops by taking the value, according to the practice of asset accounting , at
the time of the disaster, which, in principle includes the potential decline in value over time
as the assets age and are used up (consumption of capital). However, for cases where
updated values for the assets are unavailable, average per unit value estimates is a practical
simplification of measurement for market prices for the lost asset. In principle, even the
average price based estimateds should approximate the value as defined according to the SNA
definition of assets (i.e the present value of future benefits to owners).
24) Thus, for the case of agriculture, there are at least 3 distinct types of direct impacts and
valuation. These different values can be aggregated for direct impacts without double-
counting: (i) estimated market price value of destroyed crops, livestock, and trees (as a proxy
for the loss of value to owners of assets/inventories), (ii) replacement costs for damaged or
destroyed buildings and equipment, and (iii) recovery costs for damages to restore
improvements to the land.
25) Impacts from disasters refer especially to direct impacts from disasters, as defined within the
framework and not all types of damages or losses to agricultural units. For example, the SNA
specifies that ‘incidental losses of animals due to occasional deaths from natural causes form
part of consumption of fixed capital. Consumption of fixed capital of an individual animal is
measured by the decline in its value as it gets older.” [SNA 10.94]. This is the basic
distinction, using the example of livestock, between the gradual consumption of capital (AkA
depreciation) and catastrophic losses (i.e. direct material impacts) from disasters.
2d) Human Impacts
1. In DRSF, there are two basic categories of statistics on impacts from disasters: the material
impacts (previous section) and human impacts. Some of the statistics relate to both categories
and therefore provide a bridge between the material and human impacts tables. For example,
in principle, the same data sources are used for accounting for damaged or destroyed
DRAFT FOR CONSULTATION – please do not quote or reference
36
dwellings (an indicator in the Sendai Framework Target C for economic loss) should also be
applied for estimating the number of people whose houses were damaged due to hazardous
events (also an indicator for monitoring the Sendai Framework, under Target B for affected
population).
2. Human impacts include the components used as inputs for calculating indicators for
“Affected Population”, defined for monitoring the Sendai Framework and SDGs as a
composition of indicators on deaths, missing, injured, ill, disrupted or destroyed livelihood,
and otherwise affected (see annex for more information on indicators for international
monitoring).
3. The rows in the summary statistics tables on human impacts (see Table C2 below) provides a
summary of a basic range of statistical outputs compiled from various sources for describing
the human impacts of disasters.
DRSF Table C2: Summary of human impacts by hazards types and geographic regions
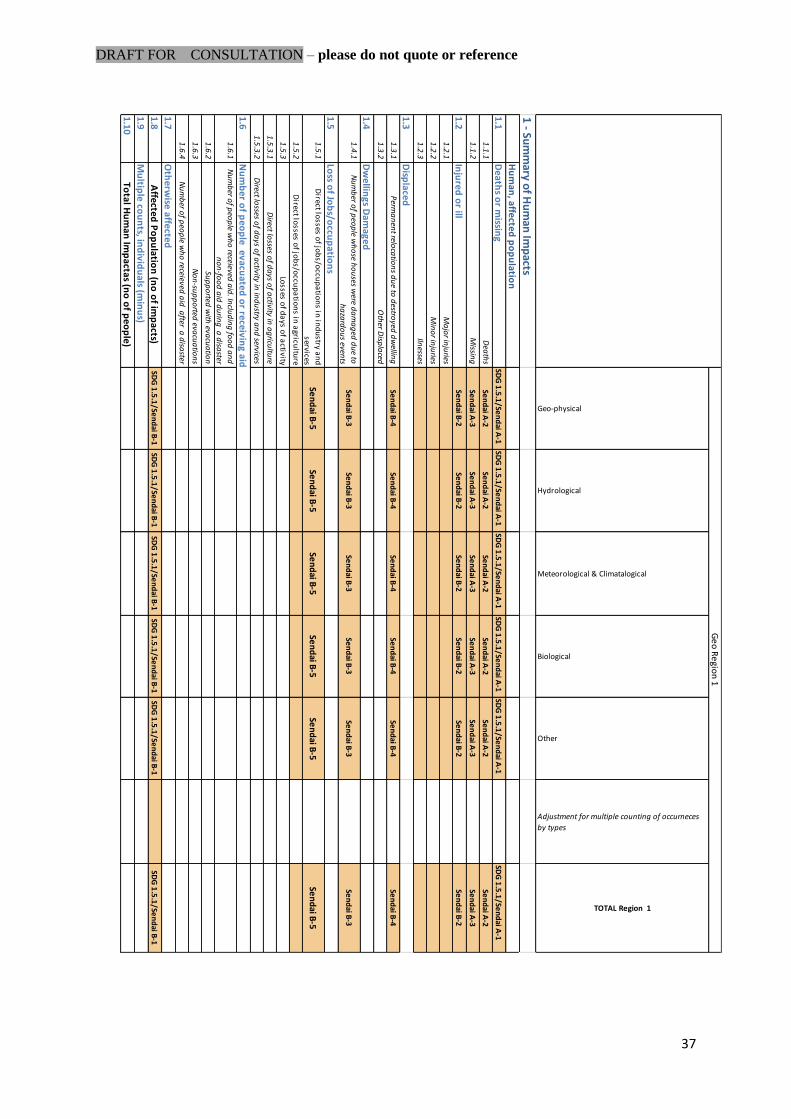
DRAFT FOR CONSULTATION – please do not quote or reference
37
Geo-physical
Hydrological
Meteorological & Climatalogical
Biological
Other
Adjustment for multiple counting of occurneces
by types
TOTAL Region 1
1 - Su
mm
ary of H
um
an Im
pacts
Hu
man
, affected p
op
ulatio
n
1.1D
eaths o
r missin
gSD
G 1
.5.1
/Sen
dai A
-1SD
G 1
.5.1
/Sen
dai A
-1SD
G 1
.5.1
/Sen
dai A
-1SD
G 1
.5.1
/Sen
dai A
-1SD
G 1
.5.1
/Sen
dai A
-1SD
G 1
.5.1
/Sen
dai A
-1
1.1
.1D
eath
sSe
nd
ai A-2
Sen
dai A
-2Se
nd
ai A-2
Sen
dai A
-2Se
nd
ai A-2
Sen
dai A
-2
1.1
.2M
issing
Sen
dai A
-3Se
nd
ai A-3
Sen
dai A
-3Se
nd
ai A-3
Sen
dai A
-3Se
nd
ai A-3
1.2In
jured
or ill
Sen
dai B
-2Se
nd
ai B-2
Sen
dai B
-2Se
nd
ai B-2
Sen
dai B
-2Se
nd
ai B-2
1.2
.1 M
ajo
r inju
ries
1.2
.2 M
ino
r inju
ries
1.2
.3Iln
esses
1.3D
isplaced
1.3
.1P
erma
nen
t reloca
tion
s du
e to d
estroyed
dw
elling
Sen
dai B
-4Se
nd
ai B-4
Sen
dai B
-4Se
nd
ai B-4
Sen
dai B
-4Se
nd
ai B-4
1.3
.2O
ther D
ispla
ced
1.4D
wellin
gs Dam
aged
1.4
.1N
um
ber o
f peo
ple w
ho
se ho
uses w
ere da
ma
ged
du
e to
ha
zard
ou
s events
Sen
dai B
-3Se
nd
ai B-3
Sen
dai B
-3Se
nd
ai B-3
Sen
dai B
-3Se
nd
ai B-3
1.5Lo
ss of Jo
bs/o
ccup
ation
s1
.5.1
Direct lo
sses of jo
bs/o
ccup
atio
ns in
ind
ustry a
nd
servicesSe
nd
ai B-5
Sen
dai B
-5Se
nd
ai B-5
Sen
dai B
-5Se
nd
ai B-5
Sen
dai B
-5
1.5
.2D
irect losses o
f job
s/occu
pa
tion
s in a
gricultu
re
1.5
.3Lo
sses of d
ays o
f activity
1.5
.3.1
Direct lo
sses of d
ays o
f activity in
ag
ricultu
re
1.5
.3.2
Direct lo
sses of d
ays o
f activity in
ind
ustry a
nd
services
1.6N
um
ber o
f peo
ple evacu
ated o
r receiving aid
1.6
.1N
um
ber o
f peo
ple w
ho
receieved a
id. In
clud
ing
foo
d a
nd
no
n-fo
od
aid
du
ring
a d
isaster
1.6
.2Su
pp
orted
with
evacu
atio
n
1.6
.3N
on
-sup
po
rted eva
cua
tion
s
1.6
.4N
um
ber o
f peo
ple w
ho
receieved a
id a
fter a d
isaster
1.7O
therw
ise affected
1.8A
ffected P
op
ulatio
n (n
o o
f imp
acts)SD
G 1
.5.1
/Sen
dai B
-1SD
G 1
.5.1
/Sen
dai B
-1SD
G 1
.5.1
/Sen
dai B
-1SD
G 1
.5.1
/Sen
dai B
-1SD
G 1
.5.1
/Sen
dai B
-1SD
G 1
.5.1
/Sen
dai B
-1
1.9M
ultip
le cou
nts, in
divid
uals (m
inu
s)
1.10To
tal Hu
man
Imp
actas (no
of p
eop
le)
Ge
o R
egio
n 1
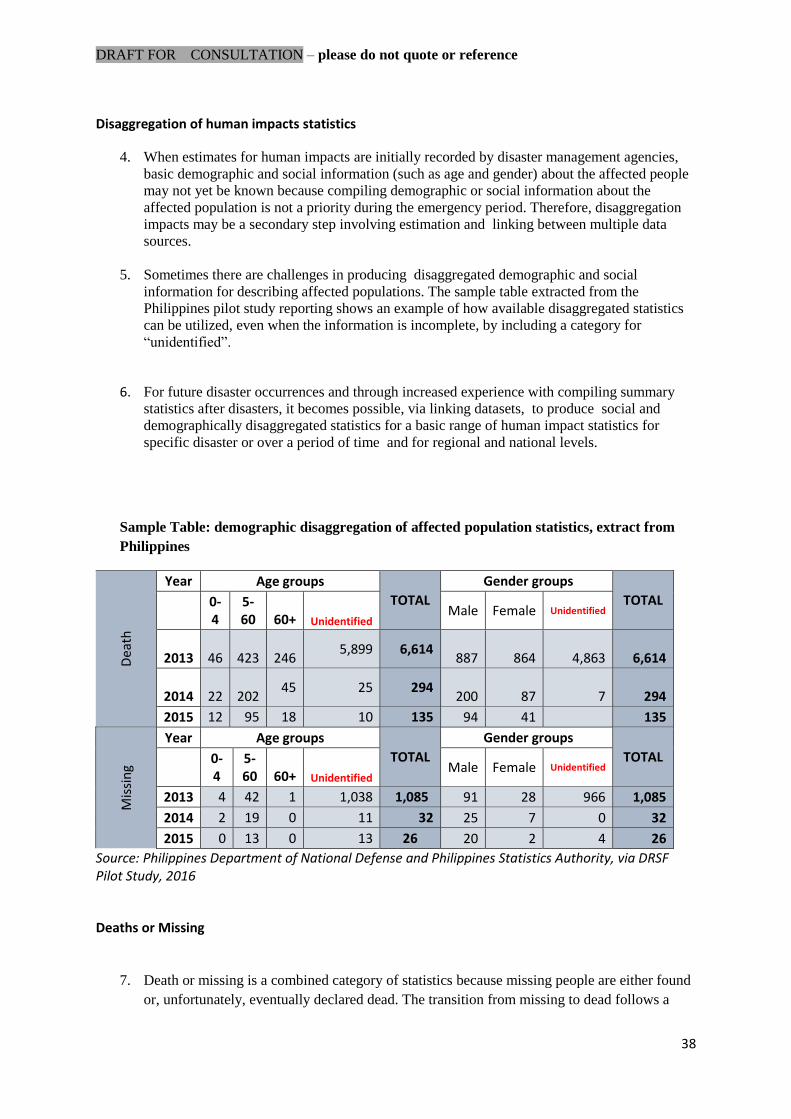
DRAFT FOR CONSULTATION – please do not quote or reference
38
Disaggregation of human impacts statistics
4. When estimates for human impacts are initially recorded by disaster management agencies,
basic demographic and social information (such as age and gender) about the affected people
may not yet be known because compiling demographic or social information about the
affected population is not a priority during the emergency period. Therefore, disaggregation
impacts may be a secondary step involving estimation and linking between multiple data
sources.
5. Sometimes there are challenges in producing disaggregated demographic and social
information for describing affected populations. The sample table extracted from the
Philippines pilot study reporting shows an example of how available disaggregated statistics
can be utilized, even when the information is incomplete, by including a category for
“unidentified”.
6. For future disaster occurrences and through increased experience with compiling summary
statistics after disasters, it becomes possible, via linking datasets, to produce social and
demographically disaggregated statistics for a basic range of human impact statistics for
specific disaster or over a period of time and for regional and national levels.
Sample Table: demographic disaggregation of affected population statistics, extract from
Philippines
Dea
th
Year Age groups
TOTAL
Gender groups
TOTAL
0-4
5-60 60+ Unidentified
Male Female Unidentified
2013
46
423
246 5,899 6,614
887 864 4,863 6,614
2014
22
202 45 25 294
200 87 7 294
2015 12 95 18 10 135 94 41
135
Mis
sin
g
Year Age groups
TOTAL
Gender groups
TOTAL
0-4
5-60 60+ Unidentified
Male Female Unidentified
2013 4 42 1 1,038 1,085 91 28 966 1,085
2014 2 19 0 11 32 25 7 0 32
2015 0 13 0 13 26 20 2 4 26
Source: Philippines Department of National Defense and Philippines Statistics Authority, via DRSF Pilot Study, 2016
Deaths or Missing
7. Death or missing is a combined category of statistics because missing people are either found
or, unfortunately, eventually declared dead. The transition from missing to dead follows a
DRAFT FOR CONSULTATION – please do not quote or reference
39
procedure and period of time, which varies according to national laws. The differences in
laws and practices in terms of the time period for missing persons do not affect the
measurement because, eventually, in all cases the total amount of fatalities includes the
missing and later declared dead in the final statistics.
8. However, rules for attribution for deaths or missing population to a disaster currently varies
internationally, which effects the comparability for scope of human impacts measurements.
Rules for attribution of deaths to a disaster cannot be standardized across all cases, but the
general framework for attribution is:
a. deaths occurring during an emergency period (or deaths caused by an injury or illness
sustained during an emergency) and believed to be caused by a disaster as defined in
Section 2a, and
b. indirect fatalities associated with a hazard, e.g. deaths from illnesses caused by
consequences (poor access to water and sanitation, exposure to unsanitary or unsafe
conditions), resulting from a hazard.
9. The usual source of official records for deaths and causes of death, where it could be
determined, are via civil registration authorities and the Ministry of Health, which is
responsible for maintaining and monitoring health information systems. However, in the
event of a disaster, records for deaths or missing is, in the short-term, more commonly a
responsibility of the national disaster management agency (or equivalent organisation) in
partnership with the Ministry of Health and others as part of the disaster response and the
broader compilation and assessment of data on impacts from the disaster. These figures are
reported by and to the different levels of local and national government and usually at some
stage are shared in official reports to the press and the general public. Commonly there is a
need to revise original reported counts on deaths (and other human impacts) following the
emergency and after sufficient time to assess the sources of data and account for all of the
cases. The revised figures, which may be different than initial reports to the public, must be
stored in the centralized compilations of disaster impacts statistics across occurences and
utilized for indicators.
10. A key consideration for the broader statistical system is ensuring that the final official counts
of deaths after a disaster are also incorporated into the broader official system of
administrative statistics (i.e. the civil registration system), which is also the source use for the
long-term and comprehensive official statistics on mortality and health of the population.
These administrative sources have many important uses, including for estimating the rate of
growth of populations and for investigating public health issues, such as trends in mortality
from different types of health challenges. Civil and health administrative records contain
confidential information, but can be utilized to produce broad summary statistics for
describing trends in the population without revealing private information about individuals.
Injured and ill
11. Besides deaths, the other two main physical impacts from disasters to humans are injuries
and illness. Injuries and illness have both direct and indirect costs for households. The relative
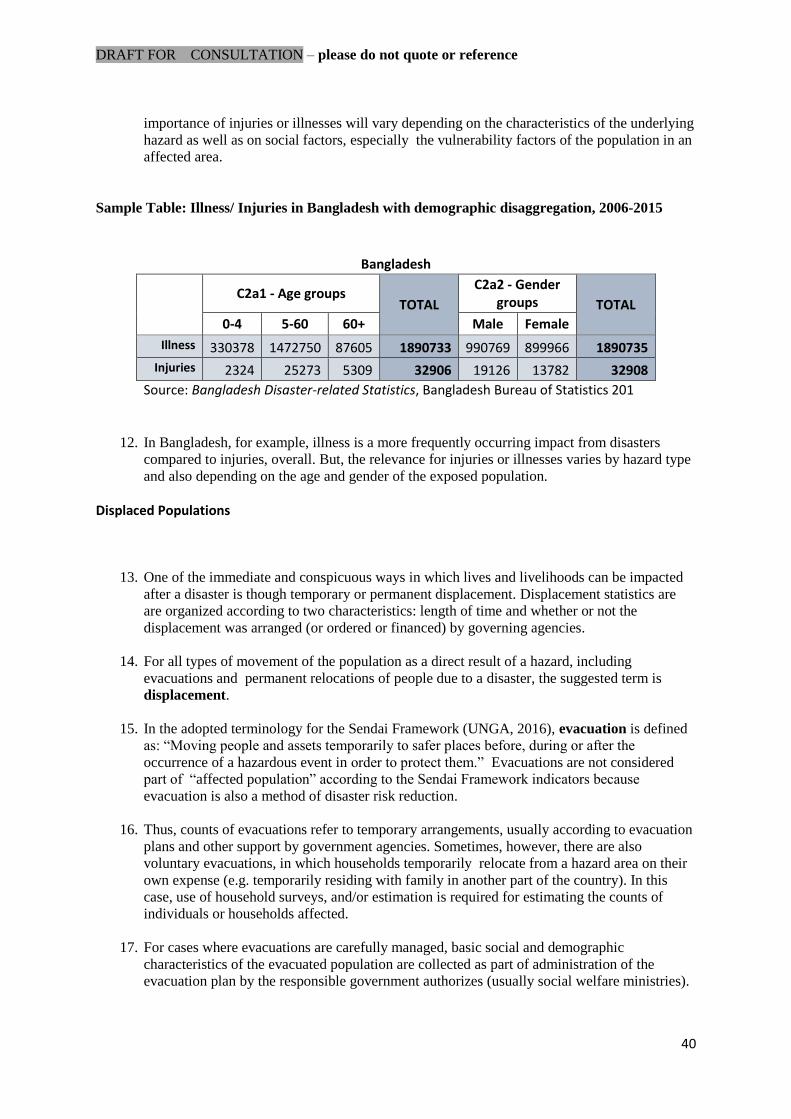
DRAFT FOR CONSULTATION – please do not quote or reference
40
importance of injuries or illnesses will vary depending on the characteristics of the underlying
hazard as well as on social factors, especially the vulnerability factors of the population in an
affected area.
Sample Table: Illness/ Injuries in Bangladesh with demographic disaggregation, 2006-2015
Bangladesh
C2a1 - Age groups TOTAL
C2a2 - Gender groups TOTAL
0-4 5-60 60+ Male Female
Illness 330378 1472750 87605 1890733 990769 899966 1890735
Injuries 2324 25273 5309 32906 19126 13782 32908
Source: Bangladesh Disaster-related Statistics, Bangladesh Bureau of Statistics 201
12. In Bangladesh, for example, illness is a more frequently occurring impact from disasters
compared to injuries, overall. But, the relevance for injuries or illnesses varies by hazard type
and also depending on the age and gender of the exposed population.
Displaced Populations
13. One of the immediate and conspicuous ways in which lives and livelihoods can be impacted
after a disaster is though temporary or permanent displacement. Displacement statistics are
are organized according to two characteristics: length of time and whether or not the
displacement was arranged (or ordered or financed) by governing agencies.
14. For all types of movement of the population as a direct result of a hazard, including
evacuations and permanent relocations of people due to a disaster, the suggested term is
displacement.
15. In the adopted terminology for the Sendai Framework (UNGA, 2016), evacuation is defined
as: “Moving people and assets temporarily to safer places before, during or after the
occurrence of a hazardous event in order to protect them.” Evacuations are not considered
part of “affected population” according to the Sendai Framework indicators because
evacuation is also a method of disaster risk reduction.
16. Thus, counts of evacuations refer to temporary arrangements, usually according to evacuation
plans and other support by government agencies. Sometimes, however, there are also
voluntary evacuations, in which households temporarily relocate from a hazard area on their
own expense (e.g. temporarily residing with family in another part of the country). In this
case, use of household surveys, and/or estimation is required for estimating the counts of
individuals or households affected.
17. For cases where evacuations are carefully managed, basic social and demographic
characteristics of the evacuated population are collected as part of administration of the
evacuation plan by the responsible government authorizes (usually social welfare ministries).
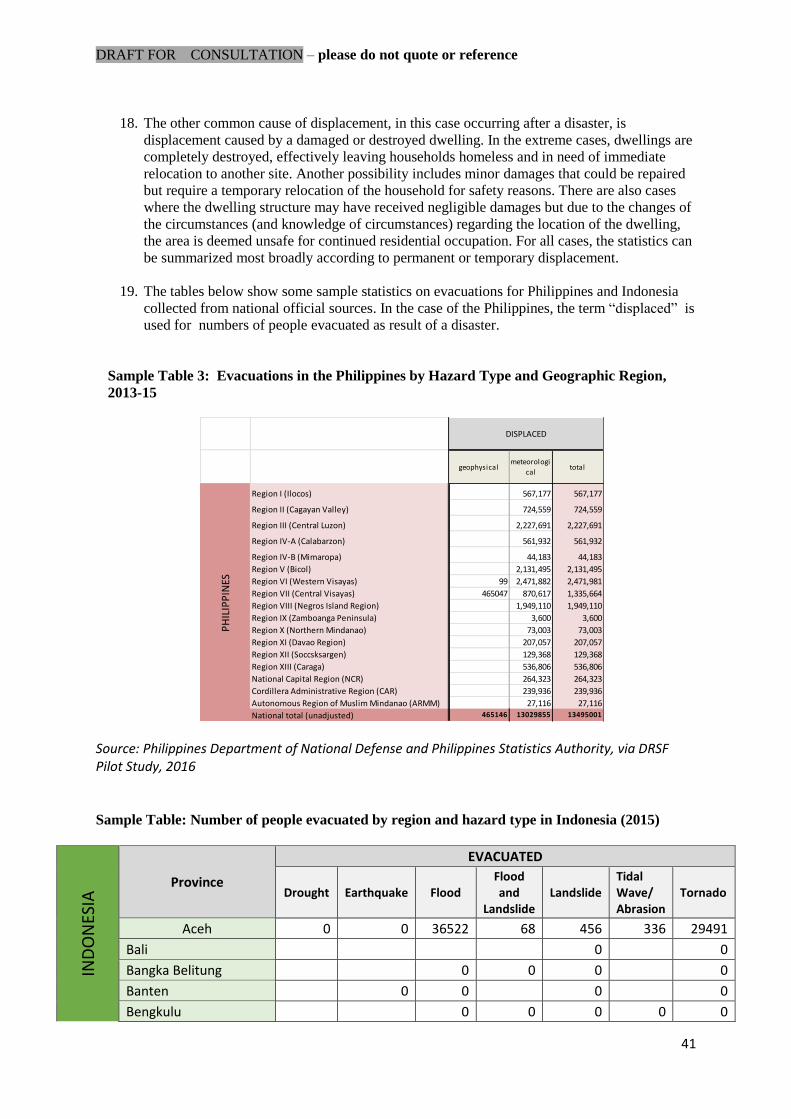
DRAFT FOR CONSULTATION – please do not quote or reference
41
18. The other common cause of displacement, in this case occurring after a disaster, is
displacement caused by a damaged or destroyed dwelling. In the extreme cases, dwellings are
completely destroyed, effectively leaving households homeless and in need of immediate
relocation to another site. Another possibility includes minor damages that could be repaired
but require a temporary relocation of the household for safety reasons. There are also cases
where the dwelling structure may have received negligible damages but due to the changes of
the circumstances (and knowledge of circumstances) regarding the location of the dwelling,
the area is deemed unsafe for continued residential occupation. For all cases, the statistics can
be summarized most broadly according to permanent or temporary displacement.
19. The tables below show some sample statistics on evacuations for Philippines and Indonesia
collected from national official sources. In the case of the Philippines, the term “displaced” is
used for numbers of people evacuated as result of a disaster.
Sample Table 3: Evacuations in the Philippines by Hazard Type and Geographic Region,
2013-15
Source: Philippines Department of National Defense and Philippines Statistics Authority, via DRSF Pilot Study, 2016 Sample Table: Number of people evacuated by region and hazard type in Indonesia (2015)
IND
ON
ESIA
Province
EVACUATED
Drought Earthquake Flood Flood and
Landslide Landslide
Tidal Wave/ Abrasion
Tornado
Aceh 0 0 36522 68 456 336 29491
Bali
0
0
Bangka Belitung
0 0 0
0
Banten
0 0
0
0
Bengkulu
0 0 0 0 0
geophysicalmeteorologi
caltotal
Region I (Ilocos) 567,177 567,177
Region II (Cagayan Valley) 724,559 724,559
Region III (Central Luzon) 2,227,691 2,227,691
Region IV-A (Calabarzon) 561,932 561,932
Region IV-B (Mimaropa) 44,183 44,183
Region V (Bicol) 2,131,495 2,131,495
Region VI (Western Visayas) 99 2,471,882 2,471,981
Region VII (Central Visayas) 465047 870,617 1,335,664
Region VIII (Negros Island Region) 1,949,110 1,949,110
Region IX (Zamboanga Peninsula) 3,600 3,600
Region X (Northern Mindanao) 73,003 73,003
Region XI (Davao Region) 207,057 207,057
Region XII (Soccsksargen) 129,368 129,368
Region XIII (Caraga) 536,806 536,806
National Capital Region (NCR) 264,323 264,323
Cordillera Administrative Region (CAR) 239,936 239,936
Autonomous Region of Muslim Mindanao (ARMM) 27,116 27,116
National total (unadjusted) 465146 13029855 13495001
DISPLACED
PH
ILIP
PIN
ES

DRAFT FOR CONSULTATION – please do not quote or reference
42
Central Java 0 0 2833 25 1166
700
Central Kalimantan
0
0
0
Central Sulawesi
0 200 375 4 East Java 0 0 1040 0 760 0 5
East Kalimantan
0 10 0 5 0 12165
East Nusa Tenggara 0
85
1190
5439
Gorontalo
406
0
522
Jakarta
1762
5997
7419
Jambi
150
0
0
Lampung
0
0
0
Maluku 4 0 8 423 12
1069
North Kalimantan
2238
0
11
North Maluku
11796 0
0
North Sulawesi
4031
3672
583
North Sumatra
0 75 77 500
11113
Papua
0
0
0
Riau
0 55 0 0
86
Riau Islands
0
0
792
South Kalimantan
0 0 0
0
South Sulawesi
30 103
211 0 40
South Sumatra
0 0 0 0
0
Southeast Sulawesi
0 65
0
West Java
0 1577 65 11825 0 4154
West Kalimantan
51 0 1740
8
West Nusa Tenggara
0 600 0 2500
0
West Papua
0 West Sulawesi
0
0
0
West Sumatra
0 1854 0 8382
75
Yogyakarta
0
22
3
National Total 4 30 65461 1033 38442 336 73675
Source: Informasi Bencana Indonesia (DIBI): http://dibi.bnpb.go.id
Impacts to livelihood
34. Impacts (or disruptions) to livelihoods is a concept from the internationally adopted
recommendation for the Sendai Framework monitoring (UNGA, 2016). The concept is broad
and measurement for Sendai Framework indicators is deferred to national practices. UNISDR
guidance defines livelihoods as: “the capacities, productive assets (both living and material)
and activities required for securing a means of living, on a sustainable basis, with dignity.”
35. Many of the assets and capacities related to this definition for livelihood are covered in the
framework as material impacts (i.e. impacts to dwellings, impact to agricultural crops and
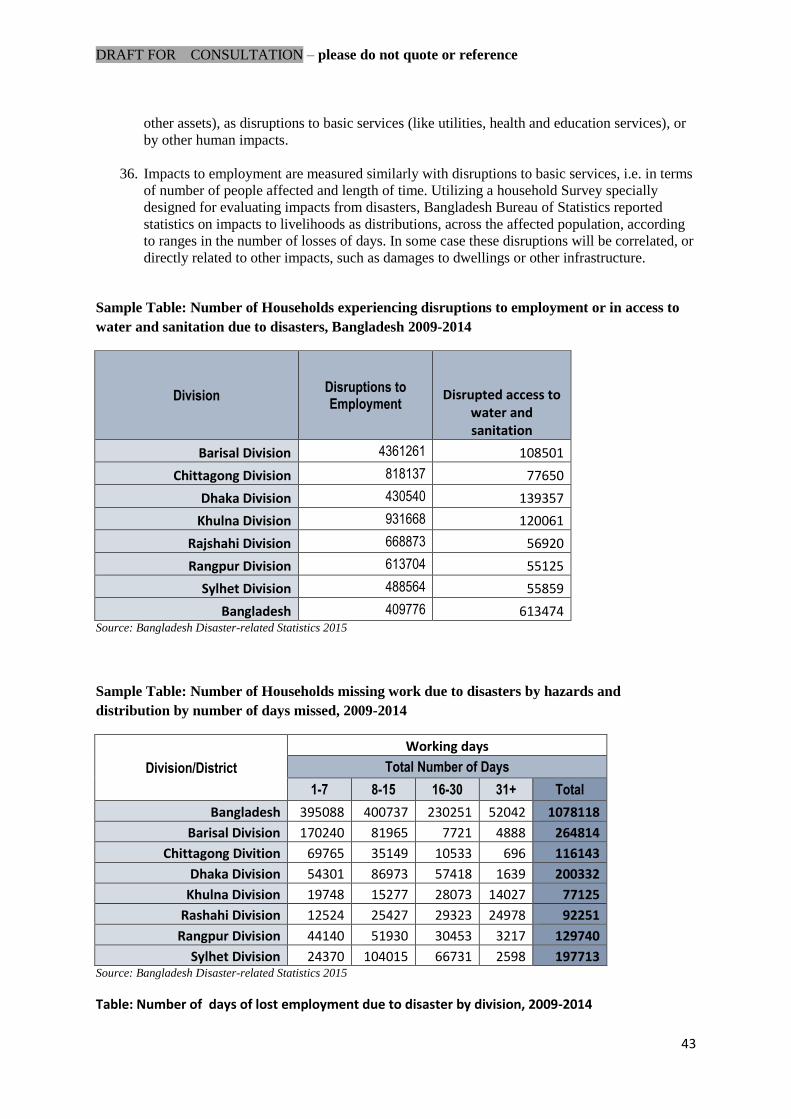
DRAFT FOR CONSULTATION – please do not quote or reference
43
other assets), as disruptions to basic services (like utilities, health and education services), or
by other human impacts.
36. Impacts to employment are measured similarly with disruptions to basic services, i.e. in terms
of number of people affected and length of time. Utilizing a household Survey specially
designed for evaluating impacts from disasters, Bangladesh Bureau of Statistics reported
statistics on impacts to livelihoods as distributions, across the affected population, according
to ranges in the number of losses of days. In some case these disruptions will be correlated, or
directly related to other impacts, such as damages to dwellings or other infrastructure.
Sample Table: Number of Households experiencing disruptions to employment or in access to
water and sanitation due to disasters, Bangladesh 2009-2014
Division Disruptions to Employment
Disrupted access to water and sanitation
Barisal Division 4361261 108501
Chittagong Division 818137 77650
Dhaka Division 430540 139357
Khulna Division 931668 120061
Rajshahi Division 668873 56920
Rangpur Division 613704 55125
Sylhet Division 488564 55859
Bangladesh 409776 613474 Source: Bangladesh Disaster-related Statistics 2015
Sample Table: Number of Households missing work due to disasters by hazards and
distribution by number of days missed, 2009-2014
Division/District
Working days
Total Number of Days
1-7 8-15 16-30 31+ Total
Bangladesh 395088 400737 230251 52042 1078118
Barisal Division 170240 81965 7721 4888 264814
Chittagong Divition 69765 35149 10533 696 116143
Dhaka Division 54301 86973 57418 1639 200332
Khulna Division 19748 15277 28073 14027 77125
Rashahi Division 12524 25427 29323 24978 92251
Rangpur Division 44140 51930 30453 3217 129740
Sylhet Division 24370 104015 66731 2598 197713 Source: Bangladesh Disaster-related Statistics 2015
Table: Number of days of lost employment due to disaster by division, 2009-2014
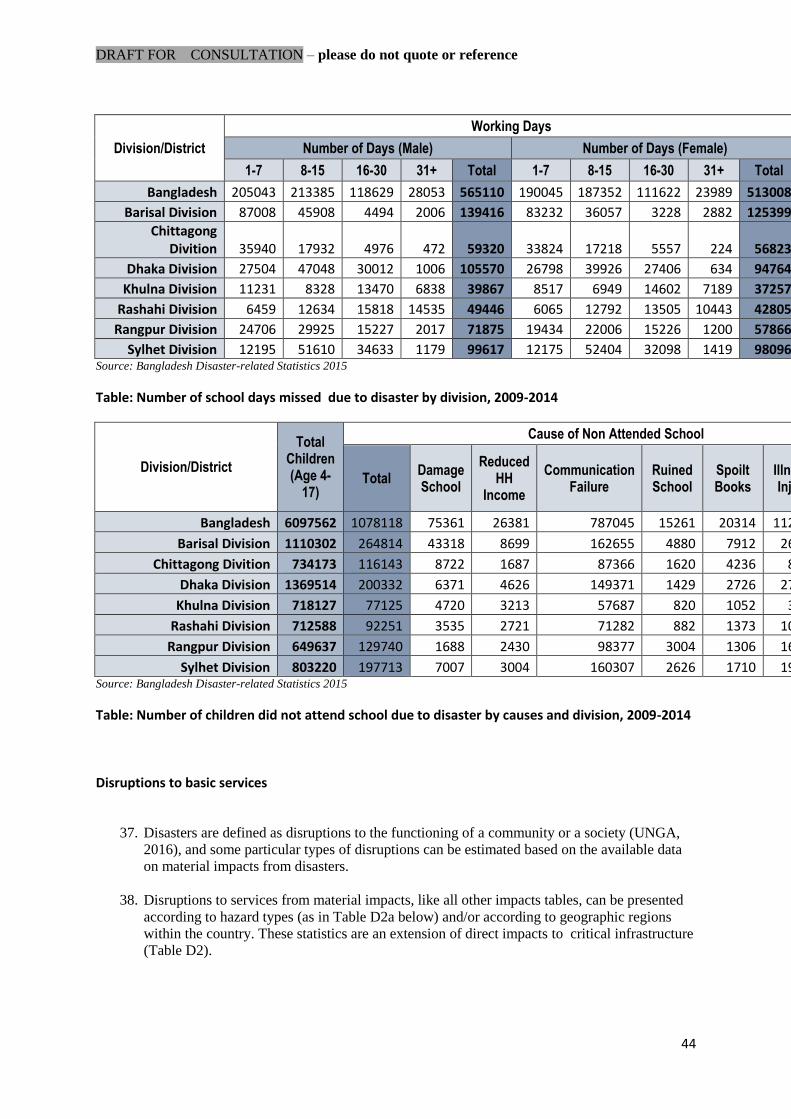
DRAFT FOR CONSULTATION – please do not quote or reference
44
Division/District
Working Days
Number of Days (Male) Number of Days (Female)
1-7 8-15 16-30 31+ Total 1-7 8-15 16-30 31+ Total
Bangladesh 205043 213385 118629 28053 565110 190045 187352 111622 23989 513008
Barisal Division 87008 45908 4494 2006 139416 83232 36057 3228 2882 125399
Chittagong Divition 35940 17932 4976 472 59320 33824 17218 5557 224 56823
Dhaka Division 27504 47048 30012 1006 105570 26798 39926 27406 634 94764
Khulna Division 11231 8328 13470 6838 39867 8517 6949 14602 7189 37257
Rashahi Division 6459 12634 15818 14535 49446 6065 12792 13505 10443 42805
Rangpur Division 24706 29925 15227 2017 71875 19434 22006 15226 1200 57866
Sylhet Division 12195 51610 34633 1179 99617 12175 52404 32098 1419 98096 Source: Bangladesh Disaster-related Statistics 2015
Table: Number of school days missed due to disaster by division, 2009-2014
Division/District
Total Children (Age 4-
17)
Cause of Non Attended School
Total Damage School
Reduced HH
Income
Communication Failure
Ruined School
Spoilt Books
Illness/ Injury
Others
Bangladesh 6097562 1078118 75361 26381 787045 15261 20314 112808 40948
Barisal Division 1110302 264814 43318 8699 162655 4880 7912 26573 10777
Chittagong Divition 734173 116143 8722 1687 87366 1620 4236 8888 3624
Dhaka Division 1369514 200332 6371 4626 149371 1429 2726 27197 8612
Khulna Division 718127 77125 4720 3213 57687 820 1052 3276 6356
Rashahi Division 712588 92251 3535 2721 71282 882 1373 10479 1978
Rangpur Division 649637 129740 1688 2430 98377 3004 1306 16907 6028
Sylhet Division 803220 197713 7007 3004 160307 2626 1710 19487 3574 Source: Bangladesh Disaster-related Statistics 2015
Table: Number of children did not attend school due to disaster by causes and division, 2009-2014
Disruptions to basic services
37. Disasters are defined as disruptions to the functioning of a community or a society (UNGA,
2016), and some particular types of disruptions can be estimated based on the available data
on material impacts from disasters.
38. Disruptions to services from material impacts, like all other impacts tables, can be presented
according to hazard types (as in Table D2a below) and/or according to geographic regions
within the country. These statistics are an extension of direct impacts to critical infrastructure
(Table D2).

DRAFT FOR CONSULTATION – please do not quote or reference
45
Table D2a Disruptions to Basic Services from a Disaster by Hazard Type
Aggregated statistics on human impacts
39. There are many waysthat human impact statistics can be presented or aggregated in summary
tables. This is a choice of presentation for dissemination of statistics, rather than a conceptual
decision, but the structure of tables also can affect th eaggregations into combined counts of
multiples types of human impacts from disasters Databases can always be queried in multiple
ways for multiple purposes. In this chapter we have shown a few examples, drawn from real
data and case studies conducted as part of the development of this handbook. The presentation
and organized structure of human impacts tabulation will vary depending on the requests of
users – whether to calculate a time series for specific indicators (such as SDGs and Sendai
Framework international monitoring indicators) or for other purposes, like a post-disaster
needs assessment (PDNA). The figure below demonstrates one way (among several
possibilities) of structuring human impact variables with the scope of the basic range of
disaster-related statistics
Figure 9: Sample structure of basic range of human impacts statistics
Geo
-ph
ysic
al
Hyd
rolo
gica
l
Met
eoro
logi
cal &
Clim
atal
ogi
cal
Bio
logi
cal
Oth
er
TOTA
L
Disruptions to Basic services from a Disaster1 Health services Sendai D-7 Sendai D-7 Sendai D-7 Sendai D-7 Sendai D-7 Sendai D-7
1.1 No. of people
1.2 Length of time
2 Educational services Sendai D-6 Sendai D-6 Sendai D-6 Sendai D-6 Sendai D-6 Sendai D-6
2.1 No. of people
2.2 Length of time
3 Public administration services Sendai D-8 Sendai D-8 Sendai D-8 Sendai D-8 Sendai D-8 Sendai D-8
3.1 No. of people
3.2 Length of time
4 Transport services
4.1 No. of people
4.2 Length of time
5 Electricity and energy services
5.1 No. of people
5.2 Length of time
6 Water services
6.1 No. of people
6.2 Length of time
7 ICT services
7.1 No. of people
7.2 Length of time
8 Other basic services
8.1 No. of people
8.2 Length of time
9 Total disruptions Sendai D-5 Sendai D-5 Sendai D-5 Sendai D-5 Sendai D-5 Sendai D-5
Hazard types
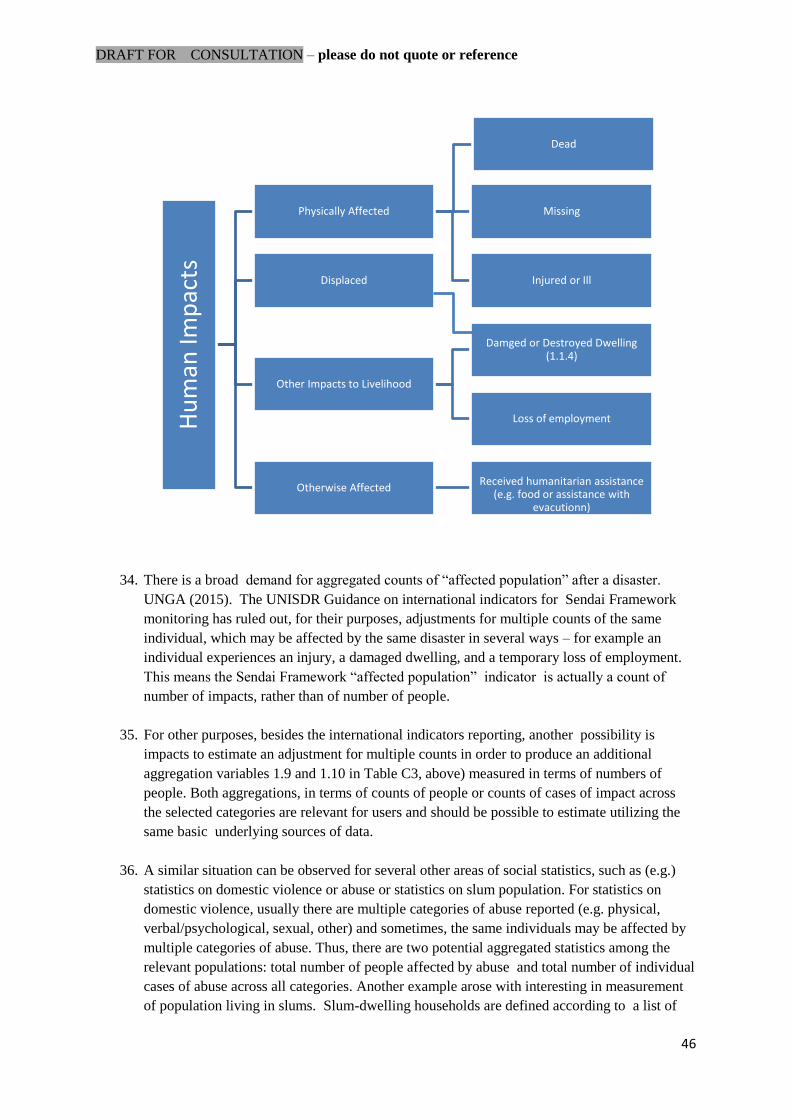
DRAFT FOR CONSULTATION – please do not quote or reference
46
34. There is a broad demand for aggregated counts of “affected population” after a disaster.
UNGA (2015). The UNISDR Guidance on international indicators for Sendai Framework
monitoring has ruled out, for their purposes, adjustments for multiple counts of the same
individual, which may be affected by the same disaster in several ways – for example an
individual experiences an injury, a damaged dwelling, and a temporary loss of employment.
This means the Sendai Framework “affected population” indicator is actually a count of
number of impacts, rather than of number of people.
35. For other purposes, besides the international indicators reporting, another possibility is
impacts to estimate an adjustment for multiple counts in order to produce an additional
aggregation variables 1.9 and 1.10 in Table C3, above) measured in terms of numbers of
people. Both aggregations, in terms of counts of people or counts of cases of impact across
the selected categories are relevant for users and should be possible to estimate utilizing the
same basic underlying sources of data.
36. A similar situation can be observed for several other areas of social statistics, such as (e.g.)
statistics on domestic violence or abuse or statistics on slum population. For statistics on
domestic violence, usually there are multiple categories of abuse reported (e.g. physical,
verbal/psychological, sexual, other) and sometimes, the same individuals may be affected by
multiple categories of abuse. Thus, there are two potential aggregated statistics among the
relevant populations: total number of people affected by abuse and total number of individual
cases of abuse across all categories. Another example arose with interesting in measurement
of population living in slums. Slum-dwelling households are defined according to a list of
Hu
man
Imp
acts
Physically Affected
Dead
Missing
Injured or Ill Displaced
Other Impacts to Livelihood
Damged or Destroyed Dwelling (1.1.4)
Loss of employment
Otherwise Affected
Received humanitarian assistance
(e.g. food or assistance with evacutionn)
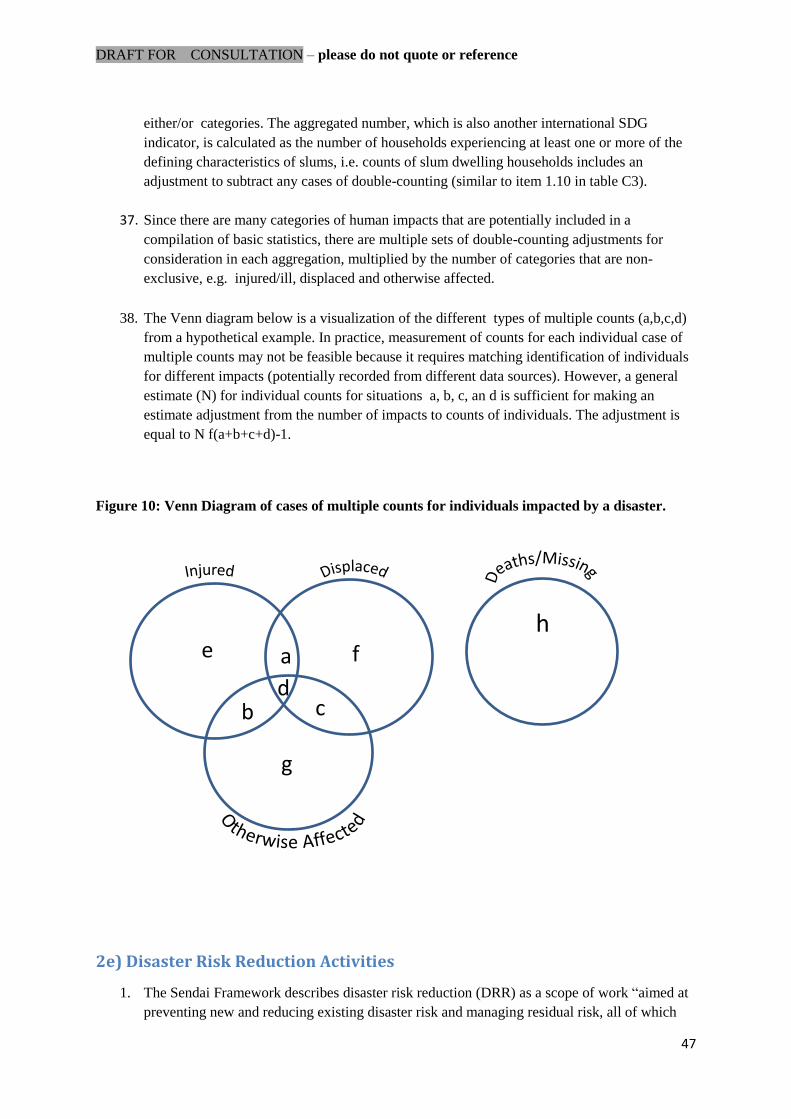
DRAFT FOR CONSULTATION – please do not quote or reference
47
either/or categories. The aggregated number, which is also another international SDG
indicator, is calculated as the number of households experiencing at least one or more of the
defining characteristics of slums, i.e. counts of slum dwelling households includes an
adjustment to subtract any cases of double-counting (similar to item 1.10 in table C3).
37. Since there are many categories of human impacts that are potentially included in a
compilation of basic statistics, there are multiple sets of double-counting adjustments for
consideration in each aggregation, multiplied by the number of categories that are non-
exclusive, e.g. injured/ill, displaced and otherwise affected.
38. The Venn diagram below is a visualization of the different types of multiple counts (a,b,c,d)
from a hypothetical example. In practice, measurement of counts for each individual case of
multiple counts may not be feasible because it requires matching identification of individuals
for different impacts (potentially recorded from different data sources). However, a general
estimate (N) for individual counts for situations a, b, c, an d is sufficient for making an
estimate adjustment from the number of impacts to counts of individuals. The adjustment is
equal to N f(a+b+c+d)-1.
Figure 10: Venn Diagram of cases of multiple counts for individuals impacted by a disaster.
2e) Disaster Risk Reduction Activities
1. The Sendai Framework describes disaster risk reduction (DRR) as a scope of work “aimed at
preventing new and reducing existing disaster risk and managing residual risk, all of which
h f e a
b c d
g
DRAFT FOR CONSULTATION – please do not quote or reference
48
contributes to strengthening resilience. DRR encompasses all aspects of work including the
management of residual risk, i.e. managing risks that cannot be prevented nor reduced, and
are known to give rise to, or already, materialize into a disaster event.” (United Nations,
2015)
2. In order to make a case for increases or improvements in DRR, a sufficiently accurate
quantification of the existing activities is needed. Government and other entities allocate
budgets to DRR and information on these activities is needed to determine effective means,
within the different contexts of disaster risk, to identify new proejcts or investment
opportunities that could significantly raise reduce risk or prevent unacceptable risks of
impacts from a disaster.
3. Another important purpose for measuring and monitoring DRR activities and expenditures is
they can be critical inputs for estimating the economic costs from disasters, since a large part
of post-disaster recovery is support for basic needs of affected communities and the
reconstruction effort, good as overall indicators of economic impacts.
4. Often the publically-financed disaster risk reduction activities, particularly disaster recovery,
are transfers from budget from central government to local authorities, and/or international
transfers (e.g. ODA). These transfers can be tracked through balance of payments and
national accounts statistics, just as with other types of transfers and activities (i.e. production,
investment, employment) in the economy as long as the activities with a DRR purpose can be
specifically identified and isolated from the broader national figures.
5. Statistical information on DRR activities particularly transfers and expenditures, are also
critical inputs for estimating the economic costs from disasters. (see section 2c)
6. Often the publically-financed disaster risk reduction activities, particularly disaster recovery,
are transfers of budget from central government to local authorities, and/or international
transfers (e.g. ODA). These transfers can be tracked through national accounts and balance of
payments statistics, like with other types of transfers and activities (i.e. production,
investment, employment) in the economy as long as the activities with a DRR purpose can be
specifically identified and isolated, for measurement purposes, from the broader aggregated
values.
7. There are two complementary approaches that can be applied for isolating the relevant values
and producing statistics on DRR activities, particularly the quantifications, in monetary terms,
of DRR transfers and expenditures.
8. The first approach is to produce a focused analysis of transfers from relevant institutions and
to analyze transfers and expenditures on a particular geographic region and time period where
there is a large-scale disaster recovery underway. This is an application of the existing
statistics on government finance and statistics derived from administrative records or
outcomes of surveys or censuses on the activities of businesses and households. A second
approach is to develop a series of functional accounts and indicators that track all types of
transfers and expenditures in the economy with a specific DRR purpose.
DRAFT FOR CONSULTATION – please do not quote or reference
49
9. The tool that statisticians use to produce the economic statistics in the latter approach is to
develop specific functional classifications in order to define the domain of interest. DRR-
characteristic activities are defined (in order to objectively identify shares of expenditures or
transfers with a DRR purpose) and classificaed in Chapter 5.
10. The provisional classification of DRRCA is developed (see detail in Chapter 5), starting from
the Sendai Framework and the recently adopted terminology adopted by the UN General
Assembly. (UNGA, 2016) Following the Sendai Framework definition for disaster risk
reduction quoted above, the scope of DRRCA. activities is:
1. Disaster Risk Prevention
2. Disaster Risk Mitigation
3. Disaster Management
4. Disaster Recovery
5. General Government, Research & Development, Education Expenditure
Disaster risk reduction characteristic transfers include:
6. Internal transfers between public government services
7. Risk transfers, insurance premiums and indemnities
8. Disaster related international transfers
9. Other transfers
11. The same approach is also utilized for several other important cross-cutting domains of
economies (e.g. health, tourism, education), often designed as “satellite accounts”, which
refers to their nature as specially designed extracts (or “satellites”) of the system of national
accounts (SNA).
12. Typical outputs from accounts of expenditures or transfers of DRR activity, following the
basic framework of the SNA, will include:
a. Total national expenditure with a DRR purpose
b. DRR expenditure by source of financing (e.g. central government, local government,
private sector)
c. DRR expenditures and transfer by beneficiaries
d. DRR expenditure by type of DRR activity (e.g. disaster preparedness, recovery and
reconstruction, early warning systems, etc. – see Chapter 3 for the complete proposed
list of categories DRR activity categories)
e. Values of transfers from central government to local authorities
f. Values of transfers from international donors – i.e. DRR-related overseas
development assistance (ODA).
13. While hazards and disasters are events happening randomly in terms of timing and in relation
to the society, DRR is a continuous activity needed to strengthen society’s resistance and
resilience and thus DRR statistics should be compiled on a continuous and periodic basis (e.g.
as annual accounts). In this way, DRR statistics become an integrated and relatively
conventional domain of statistics, as an extension to the existing national accounts.
DRAFT FOR CONSULTATION – please do not quote or reference
50
14. However, as there may be special demands for analysis of DRR activities at certain periods,
such as after a large-scale disaster, regular compilations of accounts of DRR expenditures and
transfers are complemented by specially designed studies and statistics for analyses of
specific events or to improve the understanding of the effectiveness of DRR investments
made before or after a disaster.