chapter 1 diabetic macular edema - amedeolucente.it · 1.2 pathophysiology of retinal edema retinal...
TRANSCRIPT
Chapter 1Diabetic Macular Edema
Conceicao Lobo, Isabel Pires, and Jose Cunha-Vaz
Abstract The optical coherence tomography (OCT), a noninvasive and noncontactdiagnostic method, was introduced in 1995 for imaging macular diseases.
In diabetic macular edema (DME), OCT scans show hyporeflectivity, due tointraretinal and/or subretinal fluid accumulation, related to inner and/or outer blood–retinal barrier breakdown. OCT tomograms may also reveal the presence of hardexudates, as hyperreflective spots with a shadow, in the outer retinal layers, amongothers.
In conclusion, OCT is a particularly valuable diagnostic tool in DME, helpfulboth in the diagnosis and follow-up procedure.
1.1 Introduction
The World Health Organization (WHO) estimates that more than 180 million peopleworldwide have diabetes, and this number is expected to increase and to rise to epi-demic proportions within the next 20 years [1]. Diabetic retinopathy, one of the mostfrequent complications of diabetes, remains a major public health problem withsignificant socioeconomic implications, affecting approximately 50% of diabeticsubjects, and remains the leading cause of blindness in working-age populations ofindustrialized countries.
Diabetic macular edema (DME) is the largest cause of visual acuity loss indiabetes [2]. It affects central vision from the early stages of retinopathy, and it is the
C. Lobo (�)AIBILI-Association for Innovation and Biomedical Research on Light and Image,Azinhaga Santa Comba, 3000-548 Coimbra, Portugale-mail: [email protected]
R. Bernardes and J. Cunha-Vaz (eds.), Optical Coherence Tomography,Biological and Medical Physics, Biomedical Engineering,DOI 10.1007/978-3-642-27410-7 1, © Springer-Verlag Berlin Heidelberg 2012
1
2 C. Lobo et al.
most frequent sight-threatening complication of diabetic retinopathy, particularly inolder type 2 diabetic patients. Its role in the process of vision loss in diabetic patientsand its occurrence in the evolution of the retinal disease are being increasinglyrecognized.
DME leads to distortion of visual images and may cause a significant decreasein visual acuity even in the absence of severe retinopathy.
Although macular edema is a common and characteristic complication ofdiabetic retinopathy and shows apparent association with the systemic metabolicalterations of diabetes, it does not necessarily fit the regular course of diabeticretinopathy progression. It may occur at any stage of diabetic retinopathy, whethernonproliferative, moderate, or severe, or even at the more advanced stages of theretinopathy [3].
These facts are particularly important regarding the relevance of DME in thenatural history of diabetic retinopathy. Diabetic retinopathy often progresses formany years without vision loss, making it sometimes challenging for the physicianto counsel the patient for the need for treatment when progression occurs.
1.2 Pathophysiology of Retinal Edema
Retinal edema occurs when there is an increase of water in the retinal tissue,resulting in an increase in its thickness. This increase in water content of the retinaltissue may be initially intracellular (cytotoxic edema) or extracellular (vasogenicedema) [4]. In DME, extracellular edema resulting from breakdown of the blood–retinal barrier (BRB) is generally present.
In the retina, there is a specialized structure, the BRB, that regulates fluidmovements into and out of the retinal tissue. If the BRB breaks down, as occursin diabetes, it results in an “open BRB”, which enables increased movements offluids and molecules into the retina, with extracellular accumulation of fluid anddeposition of macromolecules.
1.3 Extracellular Edema
Extracellular edema is directly associated with a situation of “open BRB” [4]. Inthis situation, the increase in tissue volume is due to an increase in the retinalextracellular space. Breakdown of the BRB is well identified by fluorescein leakage,which can be detected in a clinical environment by fluorescein angiography orvitreous fluorometry measurements. In this type of edema, Starling’s law governingthe movements of fluids applies [5].
1 Diabetic Macular Edema 3
1.4 Starling’s Law
In extracellular edema, the “force” driving water across the capillary wall is theresult of a hydrostatic pressure difference �P and an effective osmotic pressure dif-ference � . The equation regulating fluid movements across the BRB is, therefore
Driving force D Lp Œ.Pplasma � Ptissue/ � � .�plasma � �tissue/�
where Lp is the membrane permeability of the BRB, ¢ is an osmotic reflection coef-ficient, Pplasma is blood pressure, and Ptissue is the retinal tissue osmotic pressure.
An increase in �P, contributing to retinal edema, may be due to an increasein Pplasma and/or a decrease in Ptissue. An increase in Pplasma due to increasedsystemic blood pressure contributes to retinal edema formation only after loss ofautoregulation of retinal blood flow and alteration of the structural characteristicsof the BRB. A decrease in Ptissue is an important component that has not beengiven sufficient attention. Any loss in the cohesiveness of the retinal tissue due topathologies such as cyst formation, vitreous traction, or pulling at the inner limitingmembrane will lead to a decrease in Ptissue. A decrease in Ptissue, i.e., increasedretinal tissue compliance, may lead to fluid accumulation, edema formation, and anincrease in retinal thickness.
A decrease in � , contributing to retinal edema, may occur due to increasedprotein accumulation in the retina after breakdown of the BRB. Extravasation ofproteins will draw more water into the retina. This is the main factor provoking adecrease in �� , as a reduction in plasma osmolarity high enough to contribute toedema formation is an extremely rare event.
After a breakdown of the BRB, the progression of retinal edema depends directlyon the �P and � gradients. In these situations, tissue compliance becomes moreimportant, influencing directly the rate of edema progression.
Thus, in the presence of retinal edema, it is essential to recognize the presence ofan “open BRB” [6].
1.5 Incidence and Prevalence of DME
The incidence and prevalence of DME have been reported in different epidemiologicstudies with significant variations, depending on the type (type I or II), treatment(insulin, oral hypoglycemic agents, or diet only), and the mean diabetes duration.Although DME can develop at any stage of DR, it is frequently related with increasein duration and severity of DR.
DME prevalence, indicated in the Wisconsin Epidemiologic Study in Dia-betic Retinopathy (WESDR), is only about 3% in mild nonproliferative diabeticretinopathy (NPDR), but increases to 38% in moderate to severe NPDR and to 71%in eyes with proliferative diabetic retinopathy (PDR). In this study, the incidence of

4 C. Lobo et al.
clinically significant DME was 4.3% in type I diabetic patients and 5.1% in type IIwith insulin and 1.3% in those without insulin. At 10 years, the rate of developingDME was 20.1% in patients with diabetes type I and 25.4% in type II diabeticpatients needing insulin and 13.9% in those without insulin [7].
1.6 Clinical Evaluation of Macular Edema
Clinical evaluation of macular edema has been characterized by its difficulty andsubjectivity. Direct and indirect ophthalmoscopy may only show an alteration of thefoveal reflexes. Stereoscopic fundus photographs (SFP) and slit-lamp fundus stereobiomicroscopy have been the standard clinical methods to evaluate changes in reti-nal volume in the macular area, but they are dependent on the observer experience,and the results do not offer a reproducible measurement of the volume change [5].Nevertheless, together they are useful to visualize signs correlated with retinalthickening, such as hard and soft exudates, hemorrhages, and microaneurysms.
The introduction of imaging methods, such as optical coherence tomography(OCT), made macular edema evaluation more precise and reliable.
1.7 Diagnosis and Classification
The Early Treatment Diabetic Retinopathy Study Group (ETDRS) defined DRseverity stages [8] and DME [9] based on clinical grounds by SFP. DME is anincrease in retinal thickness at or within 1 disk diameter of the foveal center, whetherfocal or diffuse, with or without hard exudates, sometimes associated with cysts. Inthis study, the term “clinically significant macular edema” (CSME) was introducedto characterize the severity of the disease and to provide a threshold level to applylaser photocoagulation. Three different CSME situations can occur:
1. Increase in retinal thickness �500 �m of the center of the fovea2. Hard exudates �500 �m of the center of the fovea with increased retinal
thickness3. Increase in retinal thickness �1 disk diameter with at least one part within 1 disk
diameter at the center of the fovea
Fluorescein angiography (FA) has been an important method to evaluate DME,and although not considered a screening exam, it provides important informationabout retinal perfusion, blood–retinal barrier integrity, and new vessel growth.
Angiographic classifications of DME have included noncystoid and cystoidmacular edema (CME) [10] and focal or diffuse DME [11,12]. Focal macular edemais characterized by the presence of localized areas of retinal thickening associatedwith focal leakage of individual microaneurysms or clusters of microaneurysms ordilated capillaries. Diffuse macular edema is a more generalized and chronic form
1 Diabetic Macular Edema 5
of edema, visualized as widespread macular leakage and pooling of dye in cysticspaces [13].
Ophthalmoscopy, SFP, and FA have been for many years the traditional methodsused to evaluate diabetic retinopathy and DME, although they do not provide neitherquantitative measurements of retinal thickness nor information about cross-sectionalretinal morphology.
Recently, one methodology capable of measuring objective changes in reti-nal thickness and giving morphological and topographic surface images becameavailable, the OCT, changing dramatically the landscape of DME diagnostic andfollow-up.
OCT is a noninvasive and noncontact diagnostic method, well tolerated bypatients, that provides important information about the retina. OCT imaging isanalogous to B-scan ultrasound imaging, except that it uses infrared light reflectionsinstead of ultrasound. It produces reliable, reproducible, and objective cross-sectional images of the retinal structures and the vitreoretinal interface and allowsquantitative measurements of retinal thickness (RT). Since its commercial introduc-tion in 1995, it enhanced the ability to diagnose and guide treatment decisions inretinal pathology, namely, macular holes, DME, epiretinal membranes, choroidalneovascularization, and vitreomacular traction, and thus became a powerful tool,widely used, for research and clinical evaluation of retinal disease.
OCT brought new insights about morphological changes of the retina in diabeticretinopathy and DME. It showed that macular edema may assume different morpho-logic patterns [14,15]. In addition, a quantitative characterization of macular edemabecame feasible, as determined by measurements of retinal thickness and volume.OCT has been demonstrated to be more sensitive than slit-lamp biomicroscopy indetecting small changes in retinal thickness [16–19] and is clearly less subjective. Incases of DME, OCT scans may demonstrate diffuse thickening of the neurosensoryretina and loss of the foveal depression; cystic retinal changes, which manifestas areas of low intraretinal reflectivity; and serous retinal detachment, alone orcombined.
Over the last decade, the development of OCT instrumentation progressedrapidly. The first and second generations of commercial OCT instrument timedomain (TD) (OCT1, OCT2) had an axial resolution of 10–15 �m. Third generationOCT (OCT3, Stratus; Carl Zeiss Meditec, Dublin, California, USA) providedan axial resolution of 8–10 �m. The recently available spectral-domain OCT(SD-OCT) has an axial resolution of 5–6 �m and has almost 100-fold improvementin acquisition speed over conventional time-domain OCT scanners since the movingreference arm is eliminated and all data points can be analyzed simultaneously.With increased imaging speed and greater signal-to-noise ratio, SD-OCT scannersproduce more detailed and brighter images, with greater detail. Consequently, it ispossible to decrease the motion artifacts and obtain a more precise registrationfrom a larger area to be scanned. It is also possible to obtain an in vivo three-dimensional (3D) imaging that allows correlation between OCT images and clinicalfundus features.

6 C. Lobo et al.
Fig. 1.1 TD-OCT, Stratus: normal cross-sectional macular image
Fig. 1.2 SD-OCT, Cirrus: normal cross-sectional macular image; (a) false color; (b) gray scale
Cross-sectional images resemble closely the histological appearance of the retina[20] (Figs. 1.1–1.4). The top of the image corresponds to the vitreous cavity, whichis optically silent, in a normal patient, or may show the posterior hyaloidal face, ifthere is a posterior vitreous detachment [21]. Central foveal depression is visible innormal eyes. The anterior boundary of the retina corresponds to the internal limitingmembrane (ILM), at the vitreoretinal interface, hyperreflective and well defined,because of the contrast between the nonreflective vitreous and the backscattering ofthe retina.

1 Diabetic Macular Edema 7
1.RNFL2. GCL
3. IPL
4. INL
5. OPL6. ONL
7. ELM8. IS-OS PRL
9. OS/RPE10. RPE
Fig. 1.3 SD-OCT, Spectralis: normal cross-sectional macular image (gray scale) and anatomiccorrelation. (1) RNFL, (2) GCL, (3) IPL, (4) INL, (5) OPL, (6) ONL, (7) ELM, (8) IS-OS PRL,(9) OS/RPE junction, and (10) RPE
Fig. 1.4 SD-OCT, Spectralis: 3D image of RT from a healthy volunteer
The internal structure of the retina has heterogeneous reflections and distinctbands, and an anatomic correlation with the layers of the human retina has beenproposed [22] (Fig. 1.3). Retinal nerve fiber layer (RNFL) is aligned horizontally,demonstrating higher tissue signal strength and appears thicker closer to the opticnerve, as expected. Axially aligned cellular layers—ganglion cell layer, innernuclear layer, and outer nuclear layer (GCL, INL, and ONL, respectively)—havelower tissue signal compared with horizontally aligned layers, ILM, RNFL, andplexiform layers, which have higher tissue signal. Typically, nuclear layers appearhyporeflective, while plexiform layers (inner plexiform layer and outer plexiformlayer—IPL and OPL, respectively) and axonal layers are relatively hyperreflective.
In the outer retina, different hyperreflective structures (bands) are visualized.TD Stratus OCT image shows the outer retinal layers as two hyperreflectivebands, the photoreceptor’s outer segments (inner) and the RPE/choriocapillariscomplex (outer). On the other hand, SD-OCT scans of the outer retina allow thevisualization of more bands than the TD-OCT. With this high resolution technology,3 or 4 distinct strongly reflective bands are apparent, although their histologicalcorrelation remains a matter of discussion. According to Pircher et al. [23], thefirst (inner) band may correspond to the external limiting membrane (ELM),
8 C. Lobo et al.
the second to the interface of the inner and outer segments (IS-OS) of thephotoreceptor layer (IS-OS PRL), the third band may represent the outer segment-RPE junction (OS-RPE), and the fourth (outer) is assumed to represent the RPE(Fig. 1.3). The separation between the third and the fourth hyperreflective linesmay not always be visible [23]. The analysis of structural changes in the outerretinal layers, particularly affecting photoreceptors and their interface, is nowpossible, using SD-OCT scanners [24]. In fact, the disruption of the photoreceptorIS/OS junction appears to be an important indicator of photoreceptor integrity orimpairment and visual acuity outcome, as highlighted in several recent studieson distinct retinal diseases, such as branch retinal vein occlusion [25], centralserous chorioretinopathy [26], retinitis pigmentosa [27], type 2 idiopathic maculartelangiectasia (IMT) [28, 29], and DME [30, 31]. A recent report showed a strongcorrelation of photoreceptor’s outer segments length, measured with Cirrus SD-OCT, and visual acuity, in DME [32].
Initial studies found a good correlation between macular thickening, assessedwith OCT, and visual acuity [15, 33–35]. However, recent reports show only amoderate correlation between central retinal thickness and visual acuity, in patientswith DME [36,37], implying that visual acuity may depend mainly on the disruptionof the retinal architecture or direct photoreceptor damage.
The possibility to quantify retinal thickness by OCT is based in the distancebetween the anterior and posterior highly reflective boundaries of the retina, usingappropriate algorithms [38]. All instruments identify the vitreoretinal interface asthe inner retinal border; however, the segmentation of the outer retinal border differswidely among different OCT instruments. While the Stratus OCT system uses thephotoreceptor’s outer segments band for segmentation, spectral OCT devices usethe second or the fourth hyperreflective lines as the outer border of the retina.As a consequence, Stratus OCT generates lower values of retinal thickness, whilespectral-domain technology gives higher thickness values.
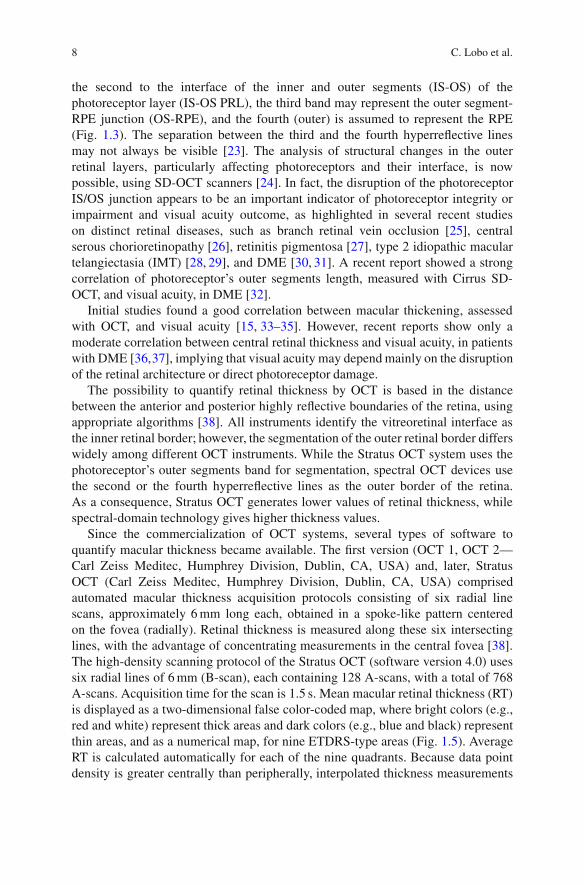
Since the commercialization of OCT systems, several types of software toquantify macular thickness became available. The first version (OCT 1, OCT 2—Carl Zeiss Meditec, Humphrey Division, Dublin, CA, USA) and, later, StratusOCT (Carl Zeiss Meditec, Humphrey Division, Dublin, CA, USA) comprisedautomated macular thickness acquisition protocols consisting of six radial linescans, approximately 6 mm long each, obtained in a spoke-like pattern centeredon the fovea (radially). Retinal thickness is measured along these six intersectinglines, with the advantage of concentrating measurements in the central fovea [38].The high-density scanning protocol of the Stratus OCT (software version 4.0) usessix radial lines of 6 mm (B-scan), each containing 128 A-scans, with a total of 768A-scans. Acquisition time for the scan is 1.5 s. Mean macular retinal thickness (RT)is displayed as a two-dimensional false color-coded map, where bright colors (e.g.,red and white) represent thick areas and dark colors (e.g., blue and black) representthin areas, and as a numerical map, for nine ETDRS-type areas (Fig. 1.5). AverageRT is calculated automatically for each of the nine quadrants. Because data pointdensity is greater centrally than peripherally, interpolated thickness measurements
1 Diabetic Macular Edema 9
Fig. 1.5 TD-OCT, Stratus: two-dimensional color-coded RT map and its numerical representationfrom a healthy volunteer
of regions farther from the fovea are determined from fewer measurements and thusmay be less accurate than those in central regions.
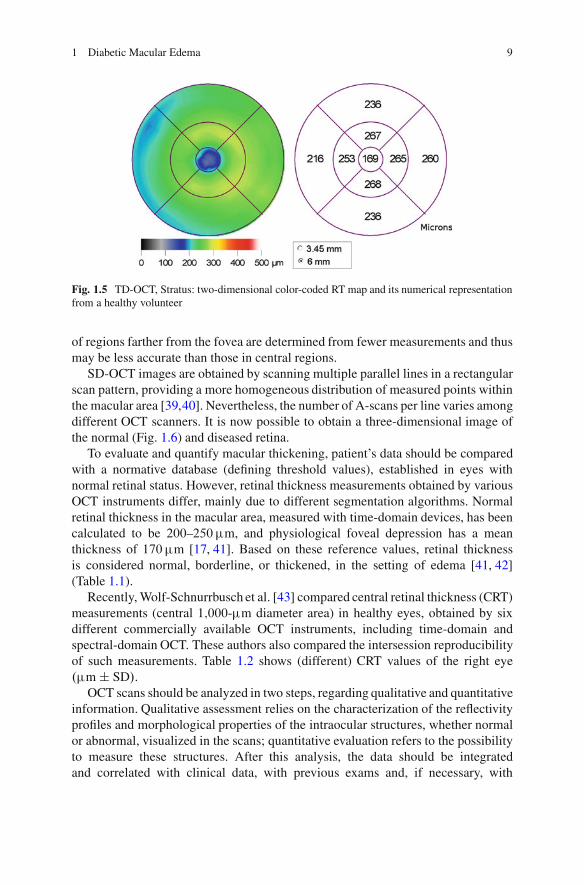
SD-OCT images are obtained by scanning multiple parallel lines in a rectangularscan pattern, providing a more homogeneous distribution of measured points withinthe macular area [39,40]. Nevertheless, the number of A-scans per line varies amongdifferent OCT scanners. It is now possible to obtain a three-dimensional image ofthe normal (Fig. 1.6) and diseased retina.
To evaluate and quantify macular thickening, patient’s data should be comparedwith a normative database (defining threshold values), established in eyes withnormal retinal status. However, retinal thickness measurements obtained by variousOCT instruments differ, mainly due to different segmentation algorithms. Normalretinal thickness in the macular area, measured with time-domain devices, has beencalculated to be 200–250 �m, and physiological foveal depression has a meanthickness of 170 �m [17, 41]. Based on these reference values, retinal thicknessis considered normal, borderline, or thickened, in the setting of edema [41, 42](Table 1.1).
Recently, Wolf-Schnurrbusch et al. [43] compared central retinal thickness (CRT)measurements (central 1;000-�m diameter area) in healthy eyes, obtained by sixdifferent commercially available OCT instruments, including time-domain andspectral-domain OCT. These authors also compared the intersession reproducibilityof such measurements. Table 1.2 shows (different) CRT values of the right eye.�m ˙ SD/.
OCT scans should be analyzed in two steps, regarding qualitative and quantitativeinformation. Qualitative assessment relies on the characterization of the reflectivityprofiles and morphological properties of the intraocular structures, whether normalor abnormal, visualized in the scans; quantitative evaluation refers to the possibilityto measure these structures. After this analysis, the data should be integratedand correlated with clinical data, with previous exams and, if necessary, with
10 C. Lobo et al.
Fig. 1.6 (a) SD-OCT, Spectralis: acquisition protocol (parallel lines); (b) SD-OCT, Cirrus: 3Dimage of RT from a healthy volunteer
Table 1.1 Retinal thickness (RT) and standard deviation (SD) values, measured by OCT2 [41]
RT [�m] (average ˙ SD)Fovea Central area
(1.0 mm diameter)Perifoveal andperipheral areas
Normal 150 ˙ 20 170 ˙ 20 230 ˙ 20
Borderline 170–210 190–230 250–290Edema �210 �230 �290
information obtained by other diagnostic tools, namely, fluorescein angiography,aiming for a better correct diagnosis [17].
Reflections of the low coherent light from the ocular tissues should bedifferentiated between hyperreflectivity, hyporeflectivity, and shadowing effects(Table 1.3) [17].

1 Diabetic Macular Edema 11
Table 1.2 Mean CRT values(˙standard deviation)obtained in central 1;000-�mdiameter area [43]
Instrument CRT [�m](average ˙ SD)
Stratus OCT 212 ˙ 19
Spectralis HRA C OCT 289 ˙ 16
Cirrus HD-OCT 277 ˙ 19
Spectral OCT/SLO 243 ˙ 25
SOCT Copernicus 246 ˙ 23
RTVue—100 245 ˙ 28
Table 1.3 OCT qualitativeinterpretation [17]
Hyperreflectivity Hyporeflectivity Shadow effect
Hard exudates Intraretinal edema HemorrhagesCotton wool spots Exudative retinal
detachmentExudates
Cystoid macularedema
Retinal vessels
Cross-sectional images and retinal thickness measurements from various OCTdevices show differences, due to different resolution, program segmentation, and/oralignment algorithms (Fig. 1.7).
Nowadays, OCT is increasingly used in the management of DME. Cross-sectional images of the retinal structures and thickness maps provide an objectiveand reproducible baseline characterization of the retinal disease. OCT imagingseems to be more sensitive than slit-lamp biomicroscopy to detect small changesin retinal thickness [16–18] and to visualize infraclinical foveolar detachments [19].OCT scans also allow an accurate evaluation of disease progression, over time, andparticularly after treatment.
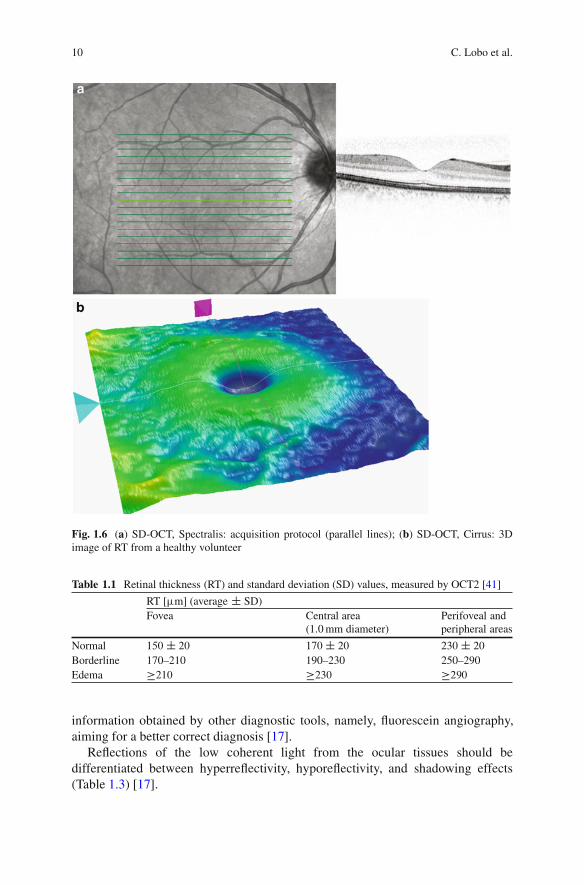
Optical coherent tomography images of DME depict the presence of lowintraretinal reflectivity, due to fluid accumulation in the extracellular space of theretina. The process begins as a diffuse retinal thickening with sponge-like appear-ance of the retinal layers, showing increase in the extracellular spaces advancing tothe typical image of cystoid spaces [44,45]. The hyporeflective cystoid-like cavitieswithin the neurosensory retina are separated by highly reflective septa bridgingretinal layers (Fig. 1.8a). They can progress to large and confluent hyporeflective(cystoid) spaces, involving the full thickness of the retina, with atrophy of thesurrounding layers (Fig. 1.8b). Therefore, in newly developed CME, cystoid spacesare primarily located in the plexiform layer, while in well-established CME, cystoidspaces become confluent, and large cystoid cavities appear. Micropseudocysts,sometimes in the inner retina, may be identified with spectral-domain devices, evenwhen retinal thickening is moderate, demonstrating the increase in extracellularspace. They appear as small round hyporeflective lacunae with high signal elementsbridging retinal layers (Fig. 1.8c) [44]. These small lesions are not visualized bytime-domain OCT.
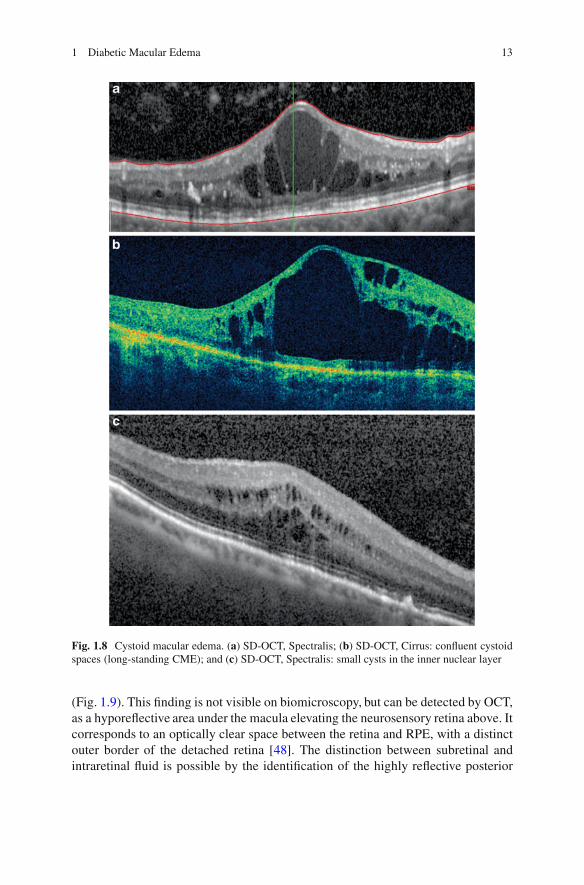
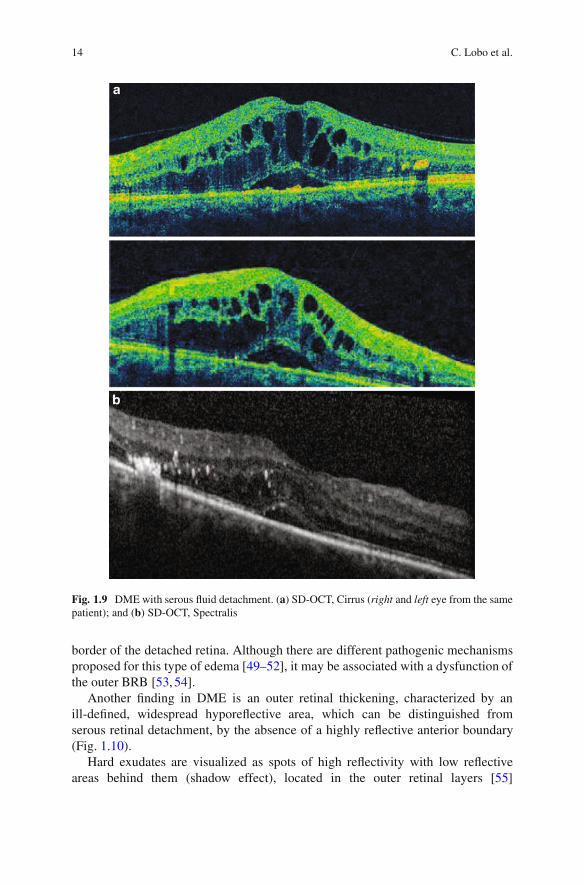
Increased thickening of the retina may also appear as an accumulation of serousfluid under the neurosensory retina, leading to a serous retinal detachment [46, 47]

12 C. Lobo et al.
Fig. 1.7 Normal cross-sectional image of the retina. (a) Scan obtained with TD-OCT, Stratus;(b) scan obtained with SD-OCT, Cirrus; (c) scan obtained with SD-OCT, Spectralis (gray scale);and (d) comparison between scan obtained with TD-OCT (Stratus) and SD-OCT (Spectralis)(false color scale)
1 Diabetic Macular Edema 13
Fig. 1.8 Cystoid macular edema. (a) SD-OCT, Spectralis; (b) SD-OCT, Cirrus: confluent cystoidspaces (long-standing CME); and (c) SD-OCT, Spectralis: small cysts in the inner nuclear layer
(Fig. 1.9). This finding is not visible on biomicroscopy, but can be detected by OCT,as a hyporeflective area under the macula elevating the neurosensory retina above. Itcorresponds to an optically clear space between the retina and RPE, with a distinctouter border of the detached retina [48]. The distinction between subretinal andintraretinal fluid is possible by the identification of the highly reflective posterior
14 C. Lobo et al.
Fig. 1.9 DME with serous fluid detachment. (a) SD-OCT, Cirrus (right and left eye from the samepatient); and (b) SD-OCT, Spectralis
border of the detached retina. Although there are different pathogenic mechanismsproposed for this type of edema [49–52], it may be associated with a dysfunction ofthe outer BRB [53, 54].
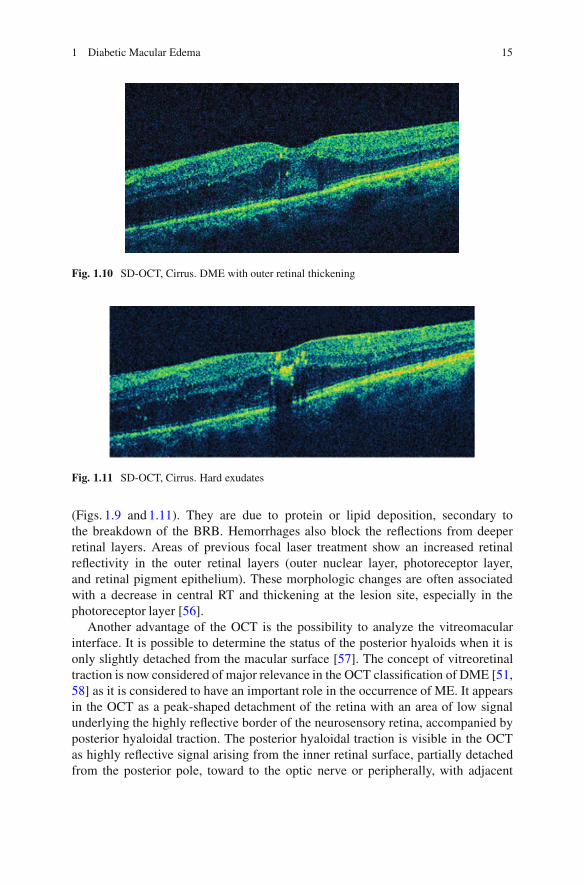
Another finding in DME is an outer retinal thickening, characterized by anill-defined, widespread hyporeflective area, which can be distinguished fromserous retinal detachment, by the absence of a highly reflective anterior boundary(Fig. 1.10).
Hard exudates are visualized as spots of high reflectivity with low reflectiveareas behind them (shadow effect), located in the outer retinal layers [55]
1 Diabetic Macular Edema 15
Fig. 1.10 SD-OCT, Cirrus. DME with outer retinal thickening
Fig. 1.11 SD-OCT, Cirrus. Hard exudates
(Figs. 1.9 and 1.11). They are due to protein or lipid deposition, secondary tothe breakdown of the BRB. Hemorrhages also block the reflections from deeperretinal layers. Areas of previous focal laser treatment show an increased retinalreflectivity in the outer retinal layers (outer nuclear layer, photoreceptor layer,and retinal pigment epithelium). These morphologic changes are often associatedwith a decrease in central RT and thickening at the lesion site, especially in thephotoreceptor layer [56].
Another advantage of the OCT is the possibility to analyze the vitreomacularinterface. It is possible to determine the status of the posterior hyaloids when it isonly slightly detached from the macular surface [57]. The concept of vitreoretinaltraction is now considered of major relevance in the OCT classification of DME [51,58] as it is considered to have an important role in the occurrence of ME. It appearsin the OCT as a peak-shaped detachment of the retina with an area of low signalunderlying the highly reflective border of the neurosensory retina, accompanied byposterior hyaloidal traction. The posterior hyaloidal traction is visible in the OCTas highly reflective signal arising from the inner retinal surface, partially detachedfrom the posterior pole, toward to the optic nerve or peripherally, with adjacent

16 C. Lobo et al.
vitreomacular traction (Figs. 1.12 and 1.13). The vitrectomy is considered beneficialin these cases [59–62].
DME can assume different morphologic patterns on OCT [15,44,45]. Kim et al.[15] proposed five morphologic patterns. A modification of their classificationbased on OCT interpretation and relationship with predominant inner or outer BRBbreakdown is followed by our group:
Patterns of macular edema:
I. – Edema of the inner retinal layers
– Breakdown of inner/outer BRB
II. – Cystoid spaces in the retina. Overall involvement
– Breakdown of inner/outer BRB
III. –Subretinal fluid accumulation
– Breakdown of outer BRB
IV. – Tractional retina edema
– Breakdown of inner BRB
V. – Combination of patterns I, II, III, IV
In summary, OCT is today the only method that allows an objective follow-up ofthe major characteristics of DME. It allows a clear identification of the intraretinalfluid distribution and the presence or absence of vitreous traction. It is an excellentmethod to document these findings. Furthermore, OCT allows a quantitative diag-nosis of ME, as it is used to obtain numerical representation of the retinal thickness.
CSME may be diagnosed using only biomicroscopy, but CSME with minimalincrease in retinal thickness is difficult to recognize without OCT. Different studiesdemonstrated that OCT may identify DME in patients with normal biomicroscopy[17, 18, 63]. In diabetic patients with increased retinal thickness between 200and 300 �m, considering abnormal values if they are above 200 �m, only 14%are detected by ophthalmoscopy. It corresponds to a subclinical form of macularedema [64].
Macular thickening is usually topographically correlated with leakage, in fluo-rescein angiography [39, 64, 65]; thus, it is considered an indicator of permeabilityof the BRB in the macular area. This correlation is better in the area within1;500–3;000 �m around the fovea and less clear in the central 500–1;000 �m [66].Recent work by our group has shown that it is possible to detect the alteration of theBRB, noninvasively with OCT measurements [67].
Clinical evaluation of macular edema should include the following parameters:extension of macular edema (i.e., thickened area); location of the edema in themacular area and, particularly, central foveal involvement (central area, 500 �mwide); presence or absence of vitreous traction; and chronicity of the edema(i.e., time elapsed since initial diagnosis and response to therapy). If considered

1 Diabetic Macular Edema 17
Fig. 1.12 Vitreomacular traction. (a) TD-OCT, Stratus (same patient); (b) SD-OCT, Cirrus; and(c) SD-OCT, Spectralis

18 C. Lobo et al.
Fig. 1.13 Detachment of posterior hyaloids with vitreomacular traction. SD-OCT, Spectralis
necessary to complement the information obtained with OCT, information aboutthe presence of ischemia may be obtained by performing fluorescein angiography.
In conclusion, OCT is a particularly valuable diagnostic tool in DME, helpfulboth in the diagnosis and follow-up procedure. DME classification systems shouldbe based on OCT evaluation and measurements.
References
1. H. King, R.E. Aubert, W.H. Herman, Global burden of diabetes, 1995–2025: prevalence,numerical estimates, and projections. Diabetes Care 21(9), 1414–1431 (1998)
2. L.P. Aiello, T.W. Gardner, G.L. King, G. Blankenship, J.D. Cavallerano, F.L.I.I.I. Ferris,R. Klein, Diabetic retinopathy. Technical review. Diabetes Care 21, 143–156 (1998)
3. B.E. Klein, R. Klein, K.E. Lee, Components of the metabolic syndrome and risk ofcardiovascular disease and diabetes in beaver dam. Diabetes Care 25(10), 1790–1794 (2002)
4. J. Cunha-Vaz, Diabetic macular edema. Eur. J. Ophthalmol. 8(3), 127–130 (1998)5. J. Cunha-Vaz, A. Travassos, Breakdown of the blood-retinal barriers and cystoid macular
edema. Surv. Ophthalmol. 28(Suppl), 485–492 (1984)6. C. Lobo, R. Bernardes, J.R. Faria de Abreu, J. Cunha-Vaz, Novel imaging techniques for
diabetic macular edema. Doc. Ophthalmol. 97, 341–347 (1999)7. R. Klein, B. Klein, S. Moss, K. Cruickshanks, The Wisconsin Epidemiologic study of Diabetic
Retinopathy XV. Ten year incidence and progression of diabetic retinopathy. Arch. Ophthal-mol. 112, 1217–1288 (1994)
8. Early Treatment Diabetic Retinopathy Study Research Group, Grading diabetic retinopathyfrom stereoscopic color fundus photographs—an extension of the modified Airlie Houseclassification. ETDRS report number 10. Ophthalmology 98(5 Suppl), 786–806 (1991)
9. Early Treatment Diabetic Retinopathy Study Group, Photocoagulation for diabetic macularedema: early treatment diabetic retinopathy study report no 1. Arch. Ophthalmol. 103(12),1796–1806 (1985)
10. G. Richard, G. Soubrane, L.A. Yannuzzi, Fluorescein and ICG Angiography,, 2nd edn.(Thieme, Stuttgart, 1998), chap. 2, pp. 15–16
11. A. Girach, H. Lund-Andersen, Diabetic macular edema: a clinical review. J. Clin. Pract. 61,88–97 (2007)
1 Diabetic Macular Edema 19
12. R. Klein, M.D. Knudtson, K.E. Lee, R. Gangnon, B.E. Klein, The Wisconsin Epidemiologicstudy of Diabetic Retinopathy XXIII: the twenty-five-year incidence of macular edema inpersons with type I diabetes. Ophthalmology 116, 497–503 (2009)
13. N. Bhagat, R.A. Grigorian, A. Tutela, M.A. Zarbin, Diabetic macular edema: pathogenesis andtreatment. Surv. Ophthalmol. 54(1), 1–32 (2009)
14. S. Yamamoto, T. Yamamoto, M. Hayashi, S. Takeuchi, Morphological and functional analysesof diabetic macular edema by optical coherence tomography and multifocal electroretino-grams. Graefes Arch. Clin. Exp. Ophthalmol. 239(2), 96–101 (2001)
15. B.Y. Kim, S.D. Smith, P.K. Kaiser, Optical coherence tomographic patterns of diabetic macularedema. Am. J. Ophthalmol. 142(3), 405–412 (2006)
16. M.R. Hee, C.A. Puliafito, C. Wong, J.S. Duker, E. Reichel, B. Rutledge, J.S. Schuman, E.A.Swanson, J.G. Fujimoto, Quantitative assessment of macular edema with optical coherencetomography. Arch. Ophthalmol. 113, 1019–1029 (1995)
17. G.E. Lang, Optical coherence tomography findings in diabetic retinopathy, in DiabeticRetinopathy, vol. 39, ed. by G.E. Lang. Dev Ophthalmol (Karger, Basel, 2007), pp. 31–47
18. C.S. Yang, C.Y. Cheng, F.L. Lee, W.M. Hsu, J.H. Liu, Quantitative assessment of retinalthickness in diabetic patients with and without clinically significant macular edema usingoptical coherence tomography. Acta Ophthalmol. Scand. 79(3), 266–270 (2001)
19. P. Massin, A. Girach, A. Erginay, A. Gaudric, Optical coherence tomography: a key to thefuture management of patients with diabetic macular oedema. Acta Ophthalmol. Scand. 84(4),466–474 (2006)
20. R. Margolis, K. Kaiser, Diagnostic modalities in diabetic retinopathy, in DiabeticRetinopathy—Contemporary Diabetes, vol. 1, ed. by E.J. Duh (Humana Press, Totowa, NJ,2008), pp. 109–133
21. J. Cunha-Vaz, G. Coscas, Diagnosis in macular edema. In: Steroids and management ofmacular edema. Ophthalmologica 224(Suppl 1), 2–7 (2010)
22. W. Drexler, Cellular and functional optical coherence tomography of the human retina: theCogan lecture 1. Invest Ophthalmol Vis Sci 48, 5339–5351 (2007)
23. M. Pircher, E. Gotzinger, O. Findl, S. Michels, W. Geitzenauer, C. Leydolt,U. Schmidt-Erfurth, C.K. Hitzenberger, Human macula investigated in vivo with polarization-sensitive optical coherence tomography. Invest. Ophthalmol. Vis. Sci. 47, 5487–5494 (2006)
24. G. Coscas, Optical Coherence Tomography in Age Related Macular Degeneration(OCT in AMD), (Springer; Edit., Heidelberg, 2009; 1389-Lamy, Publ., Marseille, 2009).ISBN 978-3-642-01468-0 (Print) 978-3-642-01467-3 (Online)
25. T. Murakami, A. Tsujikawa, M. Ohta, K. Miyamoto, M. Kita, D. Watanabe, H. Takagi,N. Yoshimura, Photoreceptor status after resolved macular edema in branch retinal vein occlu-sion treated with tissue plasminogen activator. Am. J. Ophthalmol. 143(1), 171–173 (2007)
26. C.M. Eandi, J.E. Chung, F. Cardillo-Piccolino, R.F. Spaide, Optical coherence tomography inunilateral resolved central serous chorioretinopathy. Retina 25(4), 417–421 (2005)
27. M.A. Sandberg, R.J. Brockhurst, A.R. Gaudio, E.L. Berson, The association between visualacuity and central retinal thickness in retinitis pigmentosa. Invest. Ophthalmol. Vis. Sci. 46(9),3349–3354 (2005)
28. L.A. Paunescu, T.H. Ko, J.S. Duker, A. Chan, W. Drexler, J.S. Schuman, J.G. Fujimoto,Idiopathic juxtafoveal retinal telangiectasis: new findings by ultrahigh-resolution opticalcoherence tomography. Ophthalmology 113(1), 48–57 (2006)
29. A. Gaudric, G. Ducos de Lahitte, S.Y. Cohen, P. Massin, B. Haouchine, Optical coherencetomography in group 2A idiopathic juxtafoveal retinal telangiectasis. Arch. Ophthalmol.124(10), 1410–1419 (2006)
30. A.S. Maheshwary, S.F. Oster, R.M. Yuson, L. Cheng, F. Mojana, W.R. Freeman, Theassociation between percent disruption of the photoreceptor inner segment-outer segmentjunction and visual acuity in diabetic macular edema. Am. J. Ophthalmol. 150(1), 63–67 (2010)
31. H.J. Shin, S.H. Lee, H. Chung, H.C. Kim, Association between photoreceptor integrity andvisual outcome in diabetic macular edema. Graefes Arch. Clin. Exp. Ophthalmol. 250(1),61–70 (2012)
20 C. Lobo et al.
32. F. Forooghian, P.F. Stetson, S.A. Meyer, E.Y. Chew, W.T. Wong, C. Cukras, C.B. Meyerle,F.L. Ferris 3rd, Relationship between photoreceptor outer segment length and visual acuity indiabetic macular edema. Retina 30(1), 63–70 (2010)
33. A. Martidis, J.S. Duker, P.B. Greenberg, A.H. Rogers, C.A. Puliafito, E. Reichel, C. Baumal,Intravitreal triamcinolone for refractory diabetic macular edema. Ophthalmology 109(5),920–927 (2002)
34. S. Yamamoto, T. Yamamoto, M. Hayashi, S. Takeuchi, Morphological and functional analysesof diabetic macular edema by optical coherence tomography and multifocal electroretino-grams. Graefes Arch. Clin. Exp. Ophthalmol. 239(2), 96–101 (2001)
35. C. Strøm, B. Sander, N. Larsen, M. Larsen, H. Lund-Andersen, Diabetic macular edemaassessed with optical coherence tomography and stereo fundus photography. Invest.Ophthalmol. Vis. Sci. 43(1), 241–245 (2002)
36. S. Nunes, I. Pereira, A. Santos, R. Bernardes, J. Cunha-Vaz, Central retinal thickness measuredwith HD-OCT shows a weak correlation with visual acuity in eyes with CSME. Br. J.Ophthalmol. 94(9), 1201–1204 (2010)
37. Diabetic Retinopathy Clinical Research Network, D.J. Browning, A.R. Glassman, L.P. Aiello,R.W. Beck, D.M. Brown, D.S. Fong, N.M. Bressler, R.P. Danis, J.L. Kinyoun, Q.D. Nguyen,A.R. Bhavsar, J. Gottlieb, D.J. Pieramici, M.E. Rauser, R.S. Apte, J.I. Lim, P.H. Miskala,Relationship between optical coherence tomography-measured central retinal thickness andvisual acuity in diabetic macular edema. Ophthalmology 114(3), 525–536 (2007)
38. M.R. Hee, C.A. Puliafito, C. Wong, J.S. Duker, E. Reichel, B. Rutledge, J.G. Coker,J.R. Wilkins, J.S. Schuman, E.A. Swanson, J.G. Fujimoto, Topography of diabetic macularedema with optical coherence tomography. Ophthalmology 105(2), 360–370 (1998)
39. P. Massin, E. Vicaut, B. Haouchine, A. Erginay, M. Paques, A. Gaudric, Reproducibility ofretinal mapping using optical coherence tomography. Arch.Ophthalmol. 119, 1135–1142(2001)
40. A. Polito, M. Del Borrello, M. Isola, N. Zemella, F. Bandello, Repeatability and reproducibil-ity of fast macular thickness mapping using stratus optical coherence tomography. Arch.Ophthalmol. 123(10), 1330–1337 (2005)
41. G. Panozzo, B. Parolini, E. Gusson, A. Mercanti, S. Pinackatt, G. Bertolo, S. Pignatto, Diabeticmacular edema: an OCT-based classification. Semin. Ophthalmol. 19(1–2), 13–20 (2004)
42. R. Brancato, B. Lumbroso, Guide to Optical Tomography Interpretation (Innovation-NewsCommunication, Rome, 2004)
43. U. Wolf-Schnurrbusch, L. Ceklic, C.K. Brinkmann, M. Iliev, M. Frey, S. Rothenbuehler,V. Enzmann, S. Wolf, Macular Thickness measurements in healthy eyes using six differentoptical coherence tomography instruments. Invest. Ophthalmol. Vis. Sci. 50(7), 3432–3437(2009)
44. T. Otani, S. Kishi, Y. Mauyama, Patterns of diabetic macular edema with optical coherencetomography. Am. J. Ophthalmol. 127(6), 688–693 (1999)
45. H. Alkuraya, D. Kangave, A.M. Abu El-Asrar, The correlation between coherence tomographyfeatures and severity of retinopathy, macular thickness and visual acuity in diabetic macularedema. Int. Ophthalmol. 26(3), 93–99 (2005)
46. H. Ozdemir, M. Karacorlu, S. Karacorlu, Serous macular detachment in diabetic cystoidmacular oedema. Acta Ophthalmol. Scand. 83, 63–66 (2005)
47. A. Catier, R. Tadayoni, M. Paques, A. Erginay, B. Haouchine, A. Gaudric, P. Massin, Opticalcoherence tomography characterization of macular edema according to various etiology. Am.J. Ophthalmol. 140(2), 200–206 (2005)
48. G.H. Bresnick, Diabetic macular edema: a review. Ophthalmology 93(7), 989–997 (1986)49. T. Otani, S. Kishi, Topographic assessment of vitreous surgery for diabetic macular edema.
Am. J. Ophthalmol. 129, 487–494 (2000)50. T. Nagaoka, N. Kitaya, R. Sugawara, Alteration of choroidal circulation in the foveal region in
patients with type II diabetes. Br. J. Ophthalmol. 88(8), 1060–1063 (2004)51. S. Kang, C. Yon Park, D. Ham, The correlation between fluorescein angiography and optical
coherence tomography features in clinically significant macular edema. Am. J. Ophthalmol.137(2), 313–322 (2004)
1 Diabetic Macular Edema 21
52. W. Soliman, B. Sancher, T. Martini, Enhanced optical coherence patterns of diabetic maculaedema and the correlation with the pathophysiology. Acta Ophthalmol. Scand. 85(6), 613–617 (2007)
53. D. Gaucher, C. Sebah, A. Erginay, B. Haoucine, R. Tadayoni, A. Gaudric, P. Massin, Opticalcoherence tomography features during the evolution of serous retinal detachment in patientswith macular edema. Am. J. Ophthalmol. 145(2), 289–296 (2008)
54. F. Bandello, M. Battaglia Parodi, P. Lanzetta, A. Loewenstein, P. Massin, F. Menchini,D. Veritti, Diabetic macular edema, in Macular Edema, vol. 47, ed. by G. Coscas. DevOphthalmol (Karger, Basel, 2010), pp. 73–110
55. M. Bolz, U. Schmidt-Erfurth, G. Deak, G. Mylonas, K. Kriechbaum, C. Scholda, Opticalcoherence tomographic hyperreflective foci: a morphologic sign of lipid extravasation indiabetic macular edema. Ophthalmology 116(5), 914–920 (2009)
56. M. Bolz, K. Kriechbaum, C. Simader, G. Deak, J. Lammer, C. Treu, C. Scholda, C. Prunte,U. Schmidt-Erfurth, Diabetic Retinopathy Research Group Vienna. In vivo retinal morphologyafter grid laser treatment in diabetic macular edema. Ophthalmology 117(3), 538–554 (2010)
57. D. Gaucher, R. Tadayoni, A. Erginay, B. Haouchine, A. Gaudric, P. Massin, Optical coherencetomography assessment of the vitreoretinal relationship in diabetic macular edema. Am. J.Ophthalmol. 139(5), 807–813 (2005)
58. G. Panozzo, E. Gusson, B. Parolini, A. Mercanti, Role of OCT in diagnosis and follow up ofdiabetic macular edema. Semin. Ophthalmol. 18(2), 74–81 (2003)
59. H. Lewis, G.W. Abrams, M.S. Blumen Krans, R.V. Campo, Vitrectomy for diabetic maculartraction and edema associated with posterior hyaloid traction. Ophthalmology 99, 753–759 (1992)
60. P. Massin, G. Duguid, A. Erginay, B. Haouchine, A. Gaudric, Optical coherence tomographyfor evaluating diabetic macular edema before and after vitrectomy. Am. J. Ophthalmol. 135(2),169–177 (2003)
61. D. Thomas, C. Bunce, C. Moorman, A.H. Laidlaw, Frequency and associations of a tautthickened posterior hyaloid, partial vitreomacular separation, and subretinal fluid in patientswith diabetic macular edema. Retina 25(7), 883–888 (2005)
62. S.D. Pendergast, T.S. Hassan, G.A. Williams, M.S. Cox, R.R. Margherio, P.J. Ferrone,B.R. Garretson, M.T. Trese, Vitrectomy for diffuse diabetic macular edema associated withtaut premacular posterior hyaloid. Am. J. Ophthalmol. 130(2), 178–186 (2000)
63. U.H. Schaudig, C. Glaefke, F. Scholz, G. Richard, Optical coherence tomography forretinal thickness measurement in diabetic patient without clinical significant macular edema.Ophthalmic Surg. Lasers. 31(3), 182–186 (2000)
64. J.C. Brown, S.D. Solomon, S.B. Bressler, A.P. Schachat, C. DiBernardo, N. Bressler, Detectionof diabetic foveal edema, contact lens biomicroscopy compared with optical coherencetomography. Arch Ophthalmol. 122(3), 330–335 (2004)
65. W. Goebel, T. Kretzchmar-Gross, Retinal thickness in diabetic retinopathy. A study usingoptical coherence tomography (OCT). Retina 22(6), 759–767 (2002)
66. A. Neubauer, C. Chryssafis, S. Priglinger, C. Haritoglou, M. Tiel, V. Welge-Luben, A. Kampik,Topography of diabetic macular edema compared with fluorescein angiography. ActaOphthalmol. Scand. 85(1), 32–39 (2007)
67. R. Bernardes, T. Santos, P. Serranho, C. Lobo, J. Cunha-Vaz, Noninvasive evaluation of retinalleakage using optical coherence tomography. Ophthalmologica 226(2), 29–36 (2011)

http://www.springer.com/978-3-642-27409-1