chapter 1: an overview of psd - state of michigan 1: an overview of psd john vial michigan...
TRANSCRIPT

Chapter 1: An Overview of PSD
John Vial
Michigan Department of Environmental
Quality
517-284-6805/ [email protected]
1

Overview
PSD = “Prevention of Significant Deterioration”
A regulatory (permitting) program
Applicable to major source and major modifications at major sources in attainment areas
Designed to maintain air quality, while allowing for industrial growth
2

Overview
An understanding of PSD terminology is essential to understand PSD permitting
3

Overview (cont.)
In very general terms, PSD Permitting is based on:
Physical Location (attainment areas)
Facility attributes
The proposed “project”
Past operation
Future or projected operations
4

Important Terms
National Ambient Air Quality Standards (NAAQS)
Pollutant specific ambient concentrations established and updated by EPA
Established for PM10, PM2.5, CO, SO2, NO2, lead, Ozone (the criteria pollutants)
Comprised of primary and secondary standards
Applied on a geographic basis
5

Important Terms - NAAQS
6
Pollutant Primary/
Secondary
Averaging
Time Level Form
Carbon
Monoxid
e (CO)
Primary 8-hour 9 ppm Not to be exceeded more than once per year
Secondary 1-hour 35 ppm
Lead
(Pb)
Primary
and
Secondary
Rolling 3-
month
average
0.15 µg/m3 Not to be exceeded
Nitrogen
Dioxide
(NO2)
Primary 1-hour 100 ppb 98th percentile, averaged over 3 years
Primary
and
Secondary
Annual 53 ppb Annual mean
Ozone
Primary
and
Secondary
8-hour 0.075 ppm Annual fourth-highest daily maximum 8-hr
concentration, averaged over 3 years
PM2.5
Primary Annual 12 µg/m3 Annual mean, averaged over
3 years
Primary
and
Secondary
24-hour 35 µg/m3 98th percentile, averaged over 3 years
PM10
Primary
and
Secondary
24-hour 150 µg/m3 Not to be exceeded more than once per year on
average over 3 years
Sulfur
Dioxide
(SO2)
Primary 1-hour 75 ppb 99th percentile of 1-hour daily maximum
concentrations, averaged over 3 years
Secondary 3-hour 0.5 ppm Not to be exceeded more than once per year
See Page 15 of workbook

Important Terms – cont.
“Attainment Areas”
Geographic areas of the state where measured air concentrations are below the NAAQS
The goal of PSD permitting is to allow for industrial growth in these areas, while maintaining air quality
7

Important Terms – cont.
“Attainment Areas”
those areas of the state where we are meeting the NAAQS
Statewide attainment (currently) for:
Carbon Monoxide
Nitrogen Dioxide
Ozone
PM10
PM2.5
8

Important Terms – cont.
“Non-Attainment Areas” Geographic areas of the state where measured air concentrations are above the NAAQS
Currently two non-attainment areas:
A portion of Wayne County for sulfur dioxide
A portion of Ionia County for Lead
9

Important Terms – cont.
10

Important Terms – cont.
NAAQS
Backgro
und
Concentr
ation
Incre
ment
NAAQS
Backgro
und C
oncentr
ation
Attainment Areas Non-Attainment Areas
11

Important Terms – cont.
“Class I Area” Attainment area
Has scenic, recreational, or historic value (national parks, national shorelines, areas of historical significance, and wilderness areas)
Are required to have additional analysis done
Are allowed lesser degradation than Class II areas
12

Important Terms – cont.
13

Important Terms – cont.
“Class II Area”
Attainment areas which are not regulated as stringently as Class I areas.
Regulated under Section 162 of the CAA.
Table 2 (p.16) provides comparison of Class I and Class II areas.
14

Important Terms – cont.
Pollutant Averagin
g Period
PSD Class
I
Increment
PSD Class II
Increment
Model Value Used for
Comparison to
NAAQS
SO2
3-hour 25 512 Highest Second High
24-hour 5 91 Highest Second High
Annual 2 20 Highest
PM10
24-hour 8 30 Highest Second High
Annual 4 17 Highest
PM2.5
24-hour 2 9 Highest Second High
Annual 1 4 Highest
NO2 Annual 2.5 25 Highest
15

Important Terms – cont.
“PSD Increment Concentrations”
An increment is an allowable increase in the ambient concentration of a criteria Pollutant
A PSD source cannot consume more than the allowable increment.
Increments established for SO2, PM10, PM2.5, and NO2
Increment values provided in Table 2, (p. 16) of the workbook
16

Important Terms – cont.
Regulated NSR Pollutants
Any pollutant which:
Has a NAAQS and/or;
Is regulated under an NSPS and/or;
Is regulated under the CAA (non HAPs) and/or;
Contributes to depletion of stratospheric ozone.
17

Important Terms – cont.
“Project”
Physical change or change in the method of operation at a existing stationary source
May impact other emissions units
De-bottlenecking
All parts of the project must be considered in the applicability analysis
18
Important Terms – cont.
“Best Available Control Technology”
An emission limit
Source specific
Determined by a specific procedure.
The five step “top down” approach starting with most stringent control
19

Important Terms - cont.
“Potential to Emit (PTE) ”
Maximum capacity to emit a pollutant
Based upon the use of a control device or devices
Must be enforceable as a practical matter (contained in a permit)
See www.michigan.gov/deqair (select “Clean Air Assistance” then “Potential to Emit”
20

Important Terms – cont.
“Significant Thresholds” – (p. 20)
A level of emissions used to determine PSD applicability for a project at an existing major stationary source.
To be subject to PSD the following must be true:
Significant emissions increase
Significant net emissions increase
21

Important Terms – cont.
“Major and Minor Source”
Classification of a facility based upon its potential emissions of a NSR regulated pollutant.
Major source thresholds are either 100 tpy or 250 tpy (depending on facility type)
See Table 3 (p. 19 of workbook)
22

Important Terms – cont.
Fossil fuel-fired steam electric plants of more
than 250 million BTU’s per hour heat input Coke oven batteries
Coal cleaning plants with thermal dryers Sulfur recovery plants
Kraft pulp mills Carbon black plants (furnace process)
Portland cement plants Primary lead smelters
Primary zinc smelters Fuel conversion plants
Iron and steel mill plants Sintering plants
Primary aluminum ore reduction plants Secondary metal production plants
Primary copper smelters Chemical process plants
Municipal incinerators capable of charging more
than 250 tons of refuse per day
Fossil fuel boilers, or combinations
thereof, totaling more than 250 million
BTU’s per hour heat input
Hydrofluoric, sulfuric and nitric acid plants
Petroleum storage and transfer units with
a total storage capacity exceeding
300,000 barrels
Petroleum refineries Taconite ore processing plants
Lime plants Glass fiber processing plants
Phosphate rock processing plants Charcoal production plants
See Table on Page 19 of workbook 23

Important Terms – cont.
“Contemporaneous Period”
Period of time (5 years) which precedes the commencement of operation of a new/modified source
Used for quantifying emission increases and decreases
24

Important Terms – cont.
“Emissions Unit”
Any part of a stationary source which emits (or has the potential to emit) a NSR regulated pollutant.
Logical grouping of process equipment required to make a product or raw material.
Additional guidance in AQD’s Policies and Procedures
25

Important Terms – cont.
“Allowable Emissions”
Level of emissions a source is allowed to emit by:
Permit
State rule
Federal regulation
Allowable emissions:
Short term and long term
Mass or concentration
26

Important Terms – cont.
“Actual Emissions”
Level of emissions actually emitted by the emission unit or source in a given timeframe
Based upon:
Actual levels of production or capacity
Actual operating hours
Actual levels of emissions control
27

Important Terms – cont.
“Baseline Actual Emissions”
Average rate of actual emissions which occurred over a 24 month period.
Continuous operation and emissions
Can be calculated from either a 5 year or 10 year period (depending on the type of emission unit).
28

Important Terms – cont.
“Projected Actual Emissions” Maximum level of emissions expected to occur.
Any 12 month (consecutive)
projection period during the
projection period
12 month projection period
can be within either a 5 year
period, or a 10 year period
Documentation on projection is critical
29

Important Terms – cont.
“Excludable Emissions”
Emissions which “could have been accommodated” during the baseline period.
Must have been achieved during the baseline period
30

Important Terms – cont.
“Pre-Construction Monitoring”
One year of ambient monitoring data for any regulated NSR pollutant for which source/project is significant
Waiver may be granted based upon written request with justification
Either monitoring, exemption, or waiver request must be provided
31

Summary of Chapter 1
We should now have an understanding of the important terms used for determining
PSD applicability.
More detailed
explanations to follow
32

Questions?
33

Michigan Department of
Environmental Quality
www.michigan.gov/deq
(800) 662-9278
34

Chapter 2: PSD Applicability
John Vial
Michigan Department of Environmental
Quality
517 284-6805/ [email protected]
35

Outline
Definition of a source
Major and minor sources
New and existing sources
Modifications vs. excluded changes and projects
Significant changes
Determining the net Emissions change
Changes not subject to applicability
36

PSD Summary Statement
If a proposed new source (or modification at an existing source) causes emissions increases greater than the appropriate applicable threshold, it will be subject to PSD.
37

Definition of a Source
R 336.2801(ss) defines a
“stationary source” as:
“. . . Any building, structure, facility, or installation which emits or may emit a regulated new source review pollutant”
38

Definition of a Source – cont.
While we usually consider a source to be a single structure or collection of structures at a geographic site, there are situations where a source can be multiple structures which may not be on a contiguous geographic site.
39

Definition of a Source – cont.
A source is considered to be:
All sources under common ownership or control.
All facilities with the same SIC code
All facilities are adjacent to one another or are contiguous
An exception to the above criteria is a “support facility”
40

Definition of a Source – cont.
Example 1:
Same owner
Same major SIC grouping
Different addresses, but a common physical boundary, adjacent
A and B are the same facility
A B 41

Definition of a Source – cont.
Example 2:
Same owner
Same major SIC grouping
Different addresses, but are contiguous
A and B are the same facility
A B
42

Definition of a Source – cont.
Example 3:
Different owner
Different major SIC grouping
Different addresses
A and B are the same facility. B is a support facility to A
A B
100%
43

Definition of a Source – cont.
Example 4:
Different owner
Different major SIC grouping
Different addresses
A and B are separate facilities.
A B
40%
60% To Grid
44

Major and Minor Source Status
o Major/Minor status determined by potential emissions of NSR regulated pollutants.
o Two thresholds:
o 100 tons per year
o Includes fugitive emissions
o 250 tons per year
45

Facility Description: Four New Combined Cycle Natural Gas Turbines with a combined heat input of 11,228 MMBTU/hour Source Category: Fossil fuel-fired electric plant with a capacity greater than 250 MMBTU/hr heat input Facility Status: New, no past emissions Location: Ingham County Potential Emissions CO 661 Tons per year
CO2e 5,397,056 Tons per year
NOx 508 Tons per year
PM10 210 Tons per year
PM2.5 204 Tons per year
SO2 36 Tons per year
VOCs 296 Tons per year
Sulfuric Acid Mist 5.7 Tons per year
Lead 0.00027 Tons per year
What NSR regulated Pollutants are subject to PSD?
See Page 29 of Workbook
46

Facility Description: Four New Combined Cycle Natural Gas Turbines with a combined heat input of 11,228 MMBTU/hour Source Category: Fossil fuel-fired electric plant with a capacity greater than 250 MMBTU/hr heat input Facility Status: New, no past emissions Location: Ingham County Potential Emissions CO 661 Tons per year
CO2e 5,397,056 Tons per year
NOx 508 Tons per year
PM10 210 Tons per year
PM2.5 204 Tons per year
SO2 36 Tons per year
VOCs 296 Tons per year
Sulfuric Acid Mist 5.7 Tons per year
Lead 0.00027 Tons per year
Major for CO, CO2e, NOx, PM10, PM2.5, and VOCs CO2e has a significance threshold of 100,000 tons per year for new sources, and 75,000 tons per year for modified sources.

New and Existing Sources
“Existing”
Has operated more than 24 consecutive months since the date of initial operation
“New”
Has operated less than 24 consecutive months since date of initial operation
An “idled or reactivated source” may be considered to be new.
48

Major Modifications
Major Modification
Physical change/change in method operation, and;
Has a significant emissions increase, and;
Has a significant net emissions increase.
49

The PSD Applicability Matrix (p. 31)
New Facility Existing Non-
PSD Facility
Existing PSD Facility
Minor
Project
No PSD, but may
require a minor
source Permit to
Install (PTI).
No PSD, but may
require a minor
source PTI.
No PSD unless the
project by itself exceeds
the significance
threshold based on
potential to emit, but
may require a minor
source PTI.
Major
Project
PSD for projects
that by themselves
exceed the major
stationary source
thresholds along
with any other
NSR pollutants
emitted at or
above significance
level.
PSD for projects
that by themselves
exceed the major
stationary source
thresholds along
with any other
NSR pollutants
emitted at or
above significance
level.
PSD for each NSR
pollutant emitted at
levels greater than the
significant levels.
50

Exempt Modifications
R 336.1801(aa)(iii) excludes the following activities from the definition of major modification:
Routine maintenance, repair, and replacement;
Alternative fuels;
Change in ownership;
Certain clean coal projects, etc.
51

Significant Change
o For new sources, the net emissions changes are not considered since there are no baseline emissions
o For existing sources it is necessary to determine both the emissions increase and the net emissions increase
o If “emissions increase” and “net emissions increase” >significant, the project will be subject to PSD
52

Determining the Net Emissions Change
Net emission increases are calculated by one of three methods:
• The A2P (actual to potential) emissions test
• The A2A (actual to projected actual) emissions test
• The hybrid test
PSD does not apply
53

Summary
o We now know how to determine whether a project results in a significant emission increase based on;
Whether the source is a major or minor source
Whether the source is new or existing
Whether the project results in a significant emissions increase
o After we determine that there is a significant emissions increase, the next step is to determine the net increase, which will be discussed in Chapters 3, 4, and 5
54

Questions?
55

Michigan Department of
Environmental Quality
www.michigan.gov/deq
(800) 662-9278
56

Chapter 3: Baseline
Actual Emissions (BAE)
Jeff Rathbun
Michigan Department of Environmental
Quality
517-284-6797/[email protected]
57
Outline for BAE
What are BAE? (p. 37)
Purpose of BAEs (p. 37)
Different BAE for different types of Emission Units (p. 37)
Steps for EUSGU (p. 38-39)
Steps for Non-EUSGU (p. 39-41)
58

BAE
What are BAE?
BAE are the starting point for PSD Applicability Determinations
BAE are established for 2 specific purposes:
For modifications
For netting
59

BAE (cont.)
Baseline Actual Emissions are:
The average rate of emissions, in tons per year, of a regulated NSR pollutant that actually occurred over a consecutive 24-month period; and
Calculated on an emissions unit (EU) specific basis.
60

BAE (cont.)
Two types of Emissions Units:
Electric utility steam generating unit (EUSGU)
All others (non-EUSGU)
61

BAE (cont.)
Not only are there two types of EUs, they can also be broken down into two categories, “New” and “Existing” Emission Units
62

BAE for EUSGU
For an EUSGU – the applicant must identify actual emissions that occurred during any consecutive 24-month period during the five years immediately preceding the date on which construction actually begins for a specific project, or the date a permit is issued if no construction is necessary.
63

BAE for EUSGU (cont.)
Estimated future date of when construction will begin
Adjust to allow for possible delays
Documentation showing calculations of actual emissions
CEMs data, MAERS reports, other source of emissions data may be used
64

BAE for EUSGU (cont.)
Different 24-month period for different pollutants
Must use the same 24-month period for each pollutant when multiple emissions units are involved in the project
65

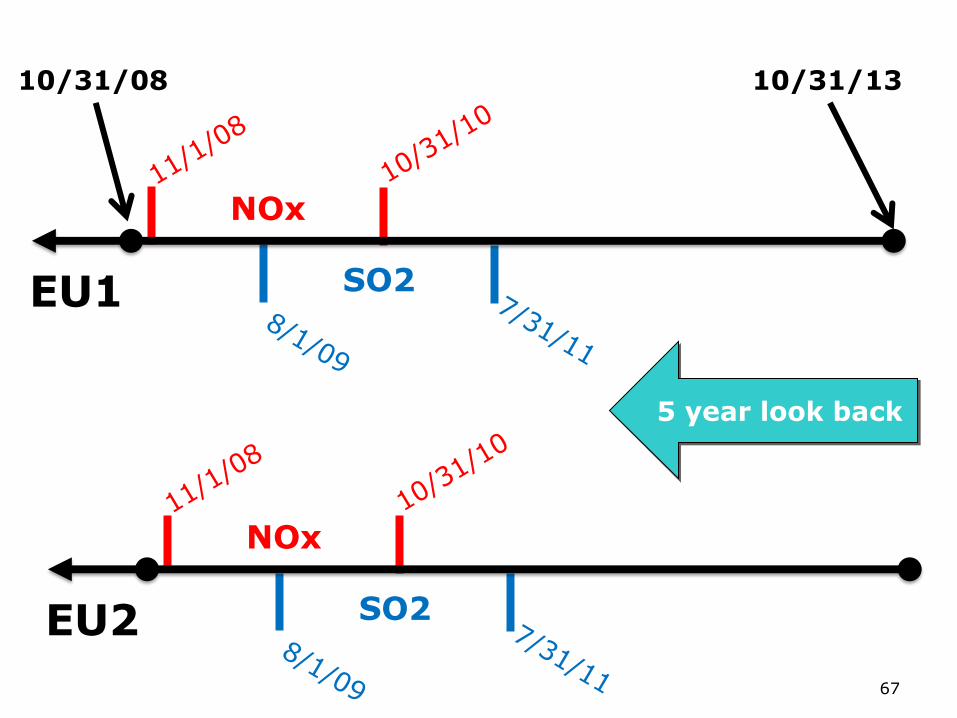
BAE for EUSGU (cont.)
Example:
Two EUSGUs will be modified, both emit NOx, SO2 and CO. Start of construction is scheduled for October 31, 2013 so 5 year look back to ? Applicant chooses November 1, 2008 to October 31,
2010 for NOx for both emissions units August 1, 2009 to July 31, 2011 for SO2 for both
emissions units December 1, 2008 to November 30, 2010 for CO for
both emissions units.
66
SO2
NOx
EU1
10/31/08 10/31/13
5 year look back
SO2
NOx
EU2
67

BAE for EUSGU (cont.)
Steps for BAE for an EUSGU
BAE is determined by:
1. Identifying the proper look back period for a project
68

BAE for EUSGU (cont.)
2. Selecting a 24-month period that meets all of the necessary criteria:
o Common to all affected emissions units included in the BAE;
o May be different for each pollutant; and
o Sufficient documentation exists to calculate actual emissions and any adjustments to actual emissions that are necessary.
69

BAE for EUSGU (cont.)
3. Calculating the annual average emission rate
Actual emissions from all affected emissions units
Same 24-month period
70

BAE for EUSGU (cont.)
4. Adjust the calculated emissions Non-compliant Emissions
Quantifiable Fugitive Emissions
Startup, Shutdown and Malfunction Emissions
71

BAE (cont.)
EUSGU to Non-EUSGU
72

BAE for Non-EUSGU
For a Non-EUSGU - BAE is the average actual emissions calculated over two consecutive years (i.e., 24 consecutive months) of actual operation.
Consecutive 24-month period
Ten years preceding:
Construction actually begins; or
Date a complete permit application is received
73

BAE for Non-EUSGU (cont.)
Must possess adequate documentation for the selected period
Must allow for adjustments
Documentation that is missing or incomplete for any part of a 24-month period means a different period must be used
74

BAE for Non-EUSGU (cont.)
Same as EUSGU for selecting a 24-month period for each pollutant and each emission unit:
One consecutive 24-month period for multiple emission units emitting the same pollutant(s)
A different consecutive 24-month period can be used for each regulated NSR pollutant
75

BAE for Non-EUSGU (cont.)
Example: Two emission units will be modified, both emit NOx, SO2 and CO. AQD received a complete application on October 1, 2013 so 10 year look back to October 1, 2003.
• Applicant chooses June 1, 2006 to May 31, 2008 for NOx for both emissions units
• August 1, 2009 to July 31, 2011 for SOx for both emissions units
• September 1, 2008 to August 31, 2010 for CO for both emissions units
76

SO2
NOx
77
EU1
10/1/03 10/1/13
10 year look back
SO2
NOx
EU2

BAE for Non-EUSGU (cont.)
BAE for a non-EUSGU must be adjusted downward to exclude any emissions that would have exceeded an emission limit with which the facility must currently comply, even if the limitation did not exist during the selected 24-month period.
78

BAE for Non-EUSGU (cont.)
Fugitive emissions, if they can be quantified, must be included in the BAE.
Also, emissions resulting from startup, shutdown and malfunctions must be included in the BAE.
79

BAE for Non-EUSGU (cont.)
Steps for a non-EUSGU BAE are determined by:
1. Identifying the proper look back period for a particular project.
80

BAE for Non-EUSGU (cont.)
2. Selecting a 24-month period that meets all of the necessary criteria:
Common to all affected emissions units included in the BAE;
May be different for each pollutant; and
Sufficient documentation exists to calculate actual emissions and any adjustments to actual emissions that are necessary.
81

BAE for Non-EUSGU (cont.)
3. Calculating the annual average emission rate:
Actual emissions from all affected Emission Units
Same 24-month period
82

BAE for Non-EUSGU (cont.)
4. Adjust the calculated emissions for:
Non-compliant emissions
Quantifiable fugitive emissions
Startup, shutdown and malfunction emissions
Regulations with which the facility must currently comply
83

Chapter 3
QUESTIONS?
84

Michigan Department of
Environmental Quality
www.michigan.gov/deq
(800) 662-9278
85

Chapter 4: Applicability
Tests Based on
Emissions Changes
Jeff Rathbun
Michigan Department of Environmental
Quality
517-284-6797/[email protected]
86

Outline for Applicability Tests
Types of Tests (P. 45)
A2P (P. 45-46)
A2A (P. 46-63)
Steps (P. 47-53)
A2A Example (P. 54-63)
87

PSD Applicability Tests
What are the applicability Tests?
Actual-to-Potential (A2P)
Actual-to-Projected-Actual (A2A)
Hybrid
88

Applicability Test – A2P
A2P
New or Existing Emission Units
Existing versus NEW
89

A2P (cont.)
Potential to emit is defined in
R 336.2801(hh) as: “Potential to emit” means the maximum capacity of a
stationary source to emit a pollutant under its physical and
operational design. A physical or operational limitation on the
capacity of the source to emit a pollutant, including air pollution
control equipment and restrictions on hours of operation or on
the type or amount of material combusted, stored, or
processed, shall be treated as part of its design if the limitation
or the effect it would have on emissions is legally enforceable
and enforceable as a practical matter by the state, local air
pollution control agency, or United States Environmental
Protection Agency. Secondary emissions do not count in
determining the potential to emit of a stationary source.
90

A2P (cont.)
The allowable emissions of an emissions unit after the proposed project represent that emissions unit’s potential to emit.
May take a permitted limit in order to avoid becoming subject to PSD.
91

A2P (cont.)
If the sum of the allowable (potential) emissions for all emissions units affected by the project exceeds the BAE by greater than significant for any regulated NSR pollutant, the proposed project is subject to PSD; or
If the sum is less than significant, not subject to PSD.
92

A2P (cont.)
A2P Example:
Consider a process that emits 50 lbs/hr of PM10 and consistently operates at 7600 hours per year.
The facility is an existing major stationary source.
93

A2P (cont.)
The BAE for the project is calculated as follows:
BAE = 50 lbs/hr * 7600 hrs/yr
2000 lbs/ton
BAE = 190 tons of PM10 per year
94

A2P Example (cont.)
The permit allows 217.5 TPY (8700 hours of operation * 50 lb/hr)
Project proposes to increase emissions from 50 to 60 lbs/hr
8700 hrs * 60 lb/hr = 261 TPY
This would increase the potential PM10 emissions from 217.5 TPY to 261 TPY
95

A2P Example (cont.)
For this project, using the A2P test would result in an increase of PM10 as demonstrated by the following equation:
261 TPY – 190 TPY = 71 TPY
96

A2P Example (cont.)
71 TPY is greater than significant for PM10 which is 15 TPY
This is a significant increase in emissions which could be subject to PSD for PM10 depending on the magnitude of the net emissions increase.
97

Applicability Test – A2A
Actual-to-Projected-Actual
98

A2A (cont.)
The A2A test involves comparing projected actual emissions from all affected emissions units to the BAE from the affected emissions units.
Involves future business activity
99

A2A (cont.)
R 336.2802(4)(c)
The actual-to-projected-actual (A2A) applicability test may be used for projects that only involve existing emission units.
100

A2A (cont.)
The AQD follows the following 8 steps for completing the A2A process:
Step 1: Determine BAE
Step 2: Determine PAE
Step 3: Determine Excludable Emissions (EE)
101

A2A (cont.)
Step 4: Draw a Diagram (Optional)
Step 5: Determine Projected Emissions Increase (PEI)
Step 6: Compare PEI to Significant Levels
Step 7: Recordkeeping and Reporting Obligations
Step 8: Permit Conditions
102

A2A Steps
Step 1:Determine BAE
Baseline Actual Emissions are determined on a pollutant by pollutant basis.
103
A2A Steps (cont.)
Step 1: BAE - Continued
Baseline period depends on process being modified
EUSGU – 5 years
Non-EUSGU – 10 years
Must be 24-month consecutive time period, can be different for each pollutant
104

A2A Steps (cont.)
Step 2 – Determine the Projected Actual Emissions (PAE)
Projection period begins the date the affected Emissions Unit(s) resume regular operation
5 or 10 years after resuming regular operations
105

A2A Steps (cont.)
106

A2A Steps (cont.)
Step 2 PAE – Continued
Resuming regular operation means:
Construction complete
Initial shakedown complete
107

A2A Steps (cont.)
Step 2 PAE - Continued
Default PAE = PTE
PAE is defined in R 336.2801(ll)(ii) and includes the following:
Historical operational data
Company’s own representations
Expected business activity
Highest projected business activity
Filings with state or federal regulatory authorities
108
A2A Steps (cont.)
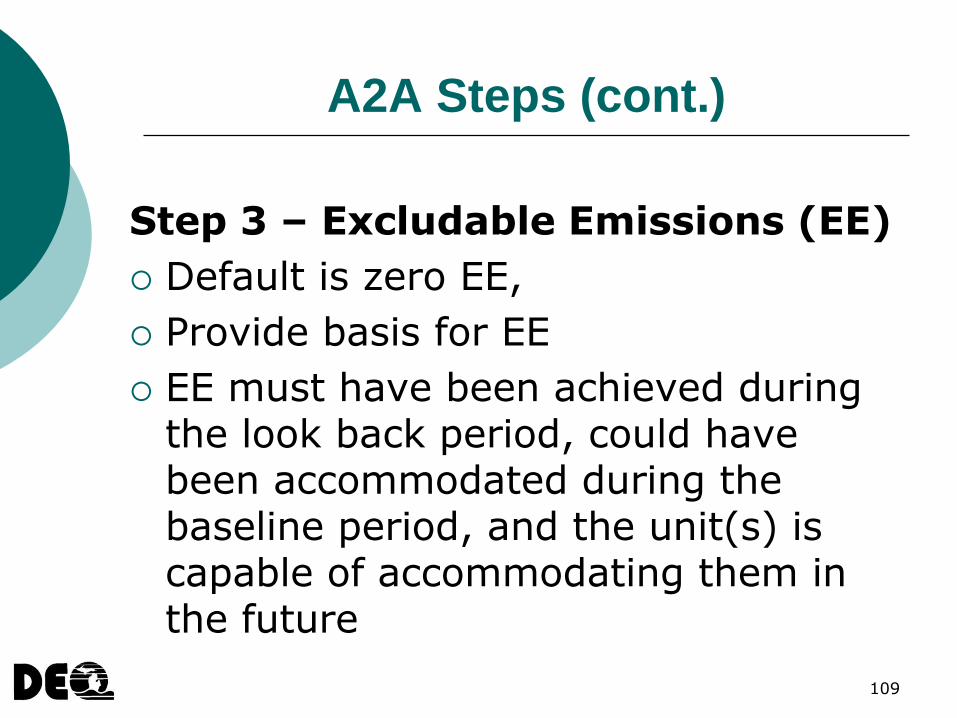
Step 3 – Excludable Emissions (EE)
Default is zero EE,
Provide basis for EE
EE must have been achieved during the look back period, could have been accommodated during the baseline period, and the unit(s) is capable of accommodating them in the future
109

A2A Steps (cont.)
PAE
Step 4: Draw A Diagram (Optional)

A2A Steps (cont.)
Step 5: Determine Projected Emissions Increase (PEI)
Use the Equation:
PEI = PAE – BAE - EE
111

A2A Steps (cont.)
Step 6 – Compare PEI to Significant Levels for each pollutant
If PEI is less than significant for each pollutant, then the project is not subject to PSD.
If PEI is equal to or above significant for any pollutant, go through PSD Review or proceed to netting.
112

A2A Steps (cont.)
Step 7: Recordkeeping and Reporting
R 336.2818(3) requires the following recordkeeping for all sources:
1. Document and maintain on file the following information prior to beginning actual construction on the project:
A description of the project;
Identification of each affected emission unit;
113

A2A Steps (cont.)
Step 7: Recordkeeping and Reporting (cont.)
A description of the applicability test used; including,
• The BAE;
• The PAE;
• The amount of EE;
• The reason for excluding that amount;
• Any netting calculations, if applicable.
114

A2A Steps (cont.)
Step 7: Recordkeeping and Reporting (cont.)
2. Calculate annual emissions, in tons per year, at the end of each year following the date that normal operation resumes after completion of the project.
115

A2A Steps (cont.)
Step 7: Recordkeeping and Reporting (cont.)
Reporting requirements for projects subject to R 336.2818(3) vary, depend on the type of source.
116

A2A Steps (cont.)
Step 7: Recordkeeping and Reporting (cont.)
Reporting for Non-EUSGU Projects: A report is only required for those years in which actual annual emissions exceed the BAE by more than the significant threshold and differ from the pre-construction projected emissions. Such a report for a non-EUSGU must include:
The name, address and telephone number of the facility;
The calculated annual emission; and,
Any other information the owner or operator wishes to include in the report (e.g., an explanation why the emissions differ from the projection). 117

A2A Steps (cont.)
Step 7: Recordkeeping and Reporting (cont.)
Reporting for EUSGU Projects:
Recordkeeping
A description of the project;
Identification of each affected emission unit;
A description of the applicability test used; including BAE, PAE, amount of EEs, reason for excluding that amount and netting calculations, if applicable.
118

A2A Steps (cont.)
Reporting for EUSGU Projects (cont.):
A report of the emissions units annual emissions must be submitted to MDEQ within 60 days after the end of each year of the projection period.
119

A2A Steps (cont.)
Step 7: Recordkeeping and Reporting (cont.)
Reasonable Possibility:
If there is a reasonable possibility that emissions could exceed significant after resuming normal operation following the completion of the project, then the facility is required to document the applicability determination and monitor future emissions of the regulated NSR pollutant.
120

A2A Steps (cont.)
Step 7: Recordkeeping and Reporting (cont.)
Reasonable Possibility is defined in R 336.2818(3)(f) and exists when:
The projected actual emissions increase is equal to or greater than 50 percent of the applicable pollutant significant level;
The projected actual emissions increase plus the excluded emissions is equal to or greater than 50 percent of the applicable significant level.
121

A2A Steps (cont.)
Step 8 – Permit Conditions
Monitoring
Emission Calculations
PAE may not be included as an enforceable permit requirement
Other conditions related to the A2A
Control device
5 or 10 year calculation records
122

A2A (cont.)
A2A Example:
The following slides will go through the steps of the example found in the book starting on p. 54.
123

A2A Example (cont.)
Define the Project:
1. It is 2009 and an existing major stationary source wants to put low NOx burners (LNB) on two existing boilers (which are classified as non-EUSGUs).
2. The facility is also removing two existing back up boilers.
3. The facility is located in an area that is currently designated as attainment for all criteria pollutants subject to regulation under the CAA.
124

A2A Example (cont.)
What is the project? The project is a physical change in the
operation of the two boilers (Low NOx burners) which affects NOx and CO emissions, no other equipment at the facility is being modified.
What about the two back up boilers? The two back up boilers only come
into play if the project has to go through netting.
125

A2A Example - Step 1: Determine BAE
Emission Rates for Determining BAE
126

A2A Example – Step 1 (cont.)
Baseline Period and Heat Input Values
127

A2A Example – Step 1 (cont.)
Baseline actual emissions:
128

A2A Example – Step 1 (cont.)
Sample Calculation for BAE:
Emission Rate x Heat Input/2000 = TPY
CO BAE = 298 TPY
129
CO BAE = 0.0276 lb/MMBtu x 21,622,450 MMBtu/yr
2000 lb/ton

A2A Example - Step 2: Determine PAE
Determine the Projected Actual Emissions (PAE)
Project the heat input with the LNB system for a 10 year period.
Pick the highest year – the applicant provided a 10 year projection period and the highest heat input rate was determined to be 23,489,348 MMBtu/year in 2015.
Note: Only CO and NOx are expected to change due to the addition of the LNBs, but all pollutants emitted from the boilers must be in the demonstration because of increased utilization due to the project could cause a significant increase for other pollutants.
130

A2A Example – Step 2 (cont.)
Emission Rates with LNB:
131

A2A Example – Step 2 (cont.)
Projected Actual Emissions:
* Emission rates are different for each boiler.
SO2
132

A2A Example – Step 2 (cont.)
Sample Calculation for PAE:
Emission Rate x Heat Input/2000 = TPY
CO PAE = 0.17 lb/MMBtu x 23,489,348 MMBtu/yr
2000 lb/ton
CO PAE = 1997 TPY
133

A2A Example - Step 3: Excludable Emissions
Determine the Excludable Emissions: The applicant projected the heat input
(future boiler utilization) without the LNB systems for a 10 year period.
The highest year was determined to be
2013 with a combined boiler maximum projected heat input rate of 23,408,885 MMBtu/year.
134

A2A Example - Step 3: Excludable Emissions
(cont.)
Determine the Excludable Emissions (cont.):
Because future demand shows a trend towards increased utilization of the boilers and the boilers are capable of accommodating the increased heat input, the EE can be determined using the pre-LNB projected heat input and the baseline emission rates for each pollutant (except for NOx).
This is allowed because this level of utilization was achieved on a short term basis at some point during the baseline year, i.e. – the boilers operated at a higher heat input on a short term basis during the baseline period that is the equivalent to the maximum projected heat input on an annual basis that is unrelated to the project.
135
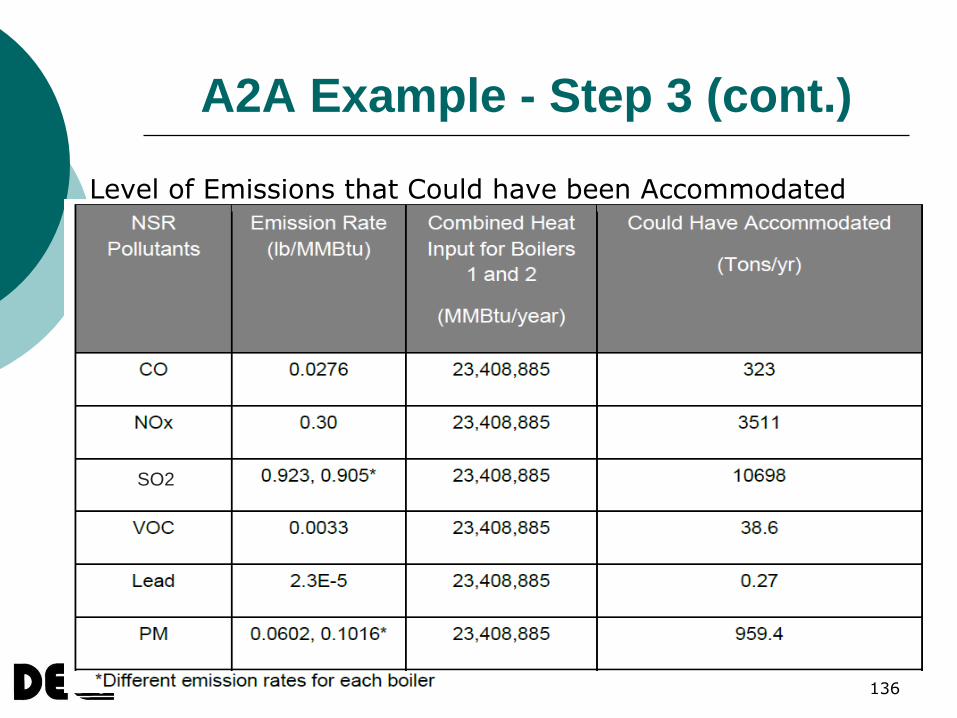
A2A Example - Step 3 (cont.)
Level of Emissions that Could have been Accommodated
SO2
136

A2A Example - Step 3 (cont.)
Sample Calculation for Could Have Accommodated for CO:
Emission Rate x Heat Input/2000 = TPY
If project did not occur:
CO (No Project) = 323 TPY
137
CO = 0.0276 lb/MMBtu x 23,408,885 MMBtu/yr 2000 lb/ton

A2A Example - Step 3 (cont.)
Excludable Emissions for this Project:
SO2
138

A2A Example - Step 3 (cont.)
Sample Calculation for determining EE for CO:
CO (No Project) = 323 TPY, could have accommodated
CO EE = CO could have accommodated – CO BAE
323 TPY – 298 TPY (BAE) = 25 TPY
139

A2A Example - Step 3 (cont.)
Note 1:
The NOx emission rate used for calculating EE is not the baseline emission rate of 0.33 lb/MMBtu but the projected actual emission rate of 0.30 lb/MMBtu because emissions above the projected actual emission rate can not be excluded.
140

A2A Example - Step 3 (cont.)
Note 2:
The CO emission rate is the baseline emission rate of 0.0276 lb/MMBtu because the emissions are directly related to the project (increase in CO emission rate) and therefore, can not be excluded.
141

A2A Example - Step 4: Draw Diagram for NOx
142
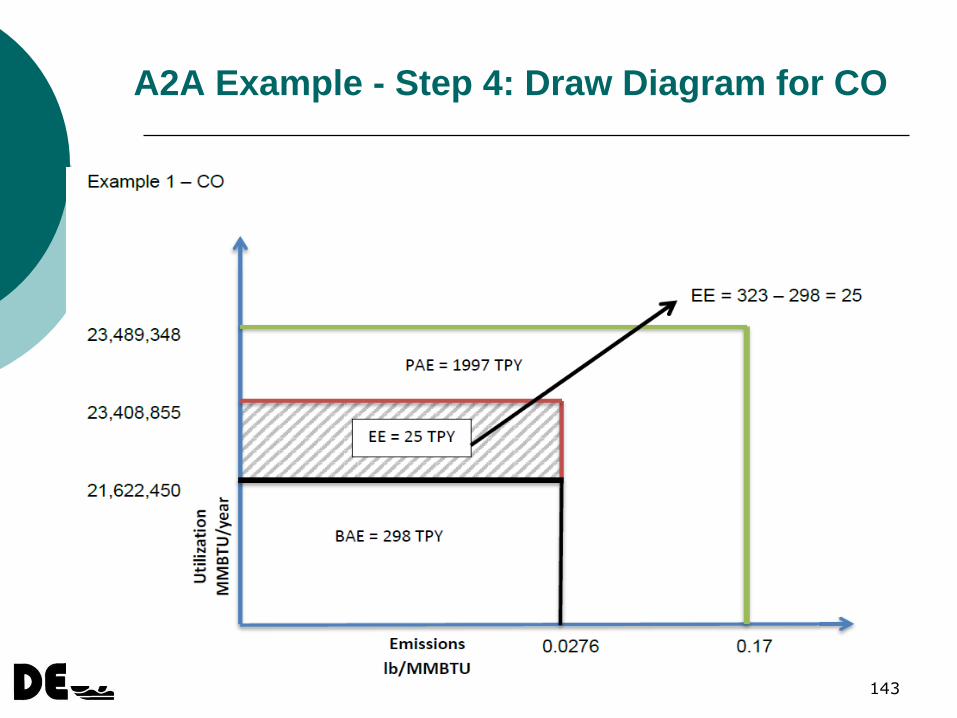
A2A Example - Step 4: Draw Diagram for CO
143

A2A Example - Step 5: Determine
Projected Emissions Increase
Projected Emissions Increase (PEI)
PEI = PAE – BAE – EE
As previously defined:
PAE = Projected Actual emissions
BAE = Baseline Actual Emissions
EE = Excludable Emissions
144
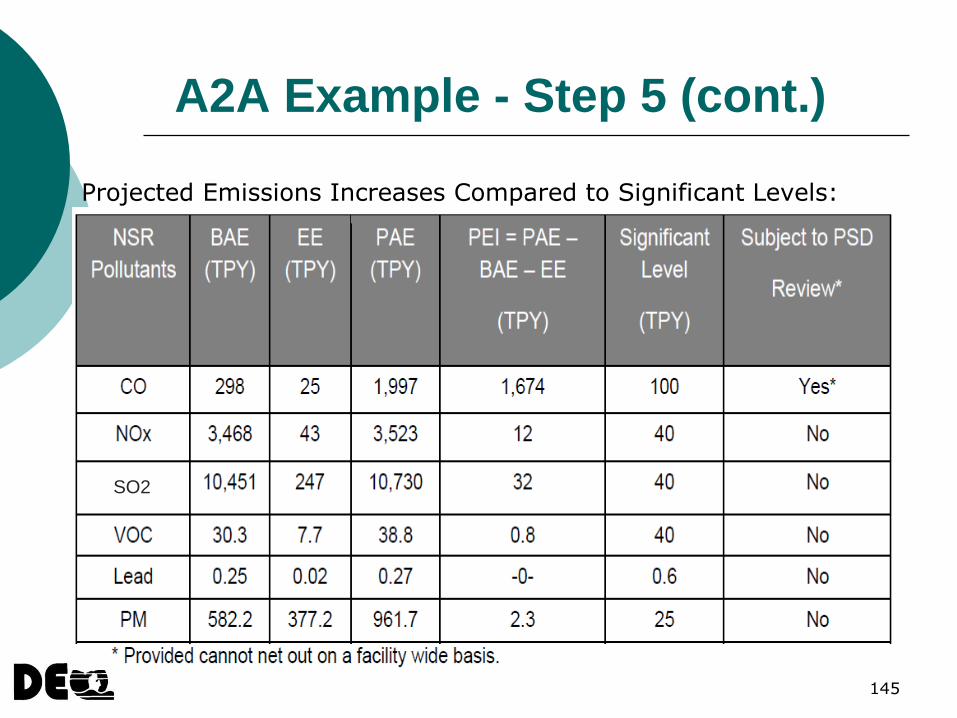
A2A Example - Step 5 (cont.)
Projected Emissions Increases Compared to Significant Levels:
SO2
145

A2A Example - Step 5 (cont.)
Sample Calculation for determining Projected Emissions Increase for CO:
1997 TPY – 298 TPY – 25 TPY = 1674 TPY
146

A2A Example - Step 6: Compare
PEI to Significant Thresholds
As seen in the table for Step 5, only CO PEI is greater than the significant level, therefore, only CO is subject to PSD review for this project.
If not for the A2A test, other pollutants would have been subject to PSD review.
147

A2A Example - Step 7: Recordkeeping and
Reporting due to Reasonable Possibility
SO2 PEI is greater than 50% of significant threshold
Recordkeeping and reporting for SO2 emissions are required as described by R 336.2818(3)(a) to (e) due to reasonable possibility.
All other pollutants that are less than 50% of significant, no records for reasonable possibility are required.
148

A2A Example –
Step 8: Permit Conditions
Because SO2 is greater than 50% of significant, conditions are required as described by Rule 1818(3)(a) to (e) due to reasonable possibility.
Addition of Low NOx burners need to be enforceable per Rule 910.
Conditions for CO including emission limits for PSD BACT are required because the increase in CO was greater than significant.
149

Chapter 4
QUESTIONS?
150

Michigan Department of
Environmental Quality
www.michigan.gov/deq
(800) 662-9278
151

Chapter 5: Netting
Jeff Rathbun
Michigan Department of Environmental
Quality
517-284-6797/[email protected]
152

Outline for Netting
Netting (p. 67)
Steps (p. 68-70)
Netting Example (p. 71-73)
153

Netting
If a project results in a significant increase, what are your choices:
Go through PSD review for each regulated NSR pollutant that is above significant
Go through netting to potentially “net out” of PSD requirements for some or all of the pollutants
154

Netting (cont.)
The process of evaluating a net emissions increase includes:
Quantifying all recent (contemporaneous) increases and decreases in actual emissions at the facility
Determining if they are creditable
155

Netting (cont.)
A contemporaneous period is:
The time which precedes the commencement of construction of a new or modified emission unit
Five years prior to the start of construction, plus the time it takes to complete construction and startup has occurred
156

Netting (cont.)
Eight steps to netting are:
1. Identify the contemporaneous period
2. Determine each physical change, or change in the method of operation that occurred, or will occur, during the contemporaneous period with a corresponding increase or decrease in actual emissions.
157

Netting (cont.)
Eight Steps (cont.)
3. Evaluate each change on the list to identify only those that are creditable.
4. List each remaining creditable, contemporaneous change.
5. Separately calculate the BAE for each creditable, contemporaneous change.
158
Netting (cont.)
Eight Steps (cont.)
6. Identify the post-change potential emissions for each emissions unit affected by each creditable, contemporaneous change.
7. Calculate the emissions increase or decrease for each emissions unit as post-change minus BAE.
159

Netting (cont.)
Eight Steps (cont.)
8. Sum all creditable emission increases and decreases with the emissions increase from the proposed project. For each pollutant where the sum is less than significant, then the project is not subject to PSD review for these regulated NSR pollutants.
160

Netting (cont.)
The basis for the eight steps is contained in R 336.2801(ee) which is the definition for:
“net emissions increase”
Contemporaneous Period
Creditable Change Cacluate BAE
161

Netting (cont.)
Step 1: Identify the Contemporaneous Period
- Begins five years prior to the start of construction on the proposed project
- Ends when the project begins initial operation
162

Netting (cont.)
Contemporaneous Period
163

Netting (cont.)
Step 2: Determine the Creditable Changes
There are restrictions on which contemporaneous changes can be credited in determining net emissions increases and decreases.
164

Netting (cont.)
Step 2 (cont.)
To be creditable, a contemporaneous emissions decrease must:
Be federally enforceable
Take place prior to the emissions increase from the project with which it is being netted
Must be permanent
165

Netting (cont.)
Step 3: Evaluate the Creditable Changes
Did the changes (increases and decreases) occur during the contemporaneous period?
Were they relied upon in the issuance of a PSD Permit?
Are they creditable?
166

Netting (cont.)
Step 4: List the Creditable Changes
Make a list of all the creditable increases and decreases that occurred during the contemporaneous period.
167

Netting (cont.)
For example, a project has a start up date of approximately April 21, 2014, construction started on December 1, 2013.
What is the contemporaneous period?
December 1, 2008 to April 21, 2014
Now list the changes that occurred during that time period
168

Netting (cont.)
Step 5: Determine BAE for Creditable Changes
As described in Chapter 3, BAE are the calculated annual average emission rate based on the actual emissions from the affected emissions units determined over a consecutive 24-month period.
169

Netting (cont.)
Step 5 (cont.)
The five or ten year look back period begins at the date of each contemporaneous change
Adequate documentation must exist to calculate actual emissions
170

Netting (cont.)
Step 5 (cont.)
BAE for creditable, contemporaneous emissions changes:
Not required to use a single 24-month period to determine the BAE
Each regulated NSR pollutant emitted from each emission unit may use a different 24-month period
171

Netting (cont.)
Contemporaneous Period
Creditable Changes
NOx
NOx
NOx
BAE
BAE
BAE
CO
CO
CO
10 years
10 years
10 years
172

Netting (cont.)
Step 6: Determine the Post-Change Potential Emissions for Creditable Changes
Physical change or change in the method of operation
In Michigan, most of these types of changes require a PTI
173

Netting (cont.)
Step 7: Determine the Magnitude of Each Creditable Change
Difference between the post-change potential and pre-change BAE
- Post-change > BAE = increase
- Post-change < BAE = decrease
174

Netting (cont.)
Step 8: Determining the Net Emissions Change
All creditable contemporaneous emissions changes must be accounted for at the stationary source for each regulated NSR pollutant
Creditable increases and decreases are added to the emissions increase from the project for which the netting analysis is being conducted
175

Netting (cont.)
Example
An existing major stationary source (non-
EUSGU) plans to modify a process (process
line A) which will increase production at the
facility. The project will cause an increase in
CO by 110 tons per year, SO2 by 35 tons per
year and NOx by 50 tons per year from
process line A.
The application was submitted in May 2013
and construction is planned to be completed
by the end of 2014. 176

Netting (cont.)
Example (cont.)
During May 2011, the applicant removed two old boilers.
In December 2012, the company was permitted to install three process heaters with combined emissions of 8 TPY of NOx, 40 TPY of CO and 5 TPY of SO2. The installation of the process heaters is not related to the modification of process line A. While permitted in December 2012, the applicant did not begin construction of these heaters until August 2013.
177

Netting (cont.)
Example (cont.)
Additionally, in June 2008, the company
began the process of shutting down process
line B and completed the removal of the line
in August 2008.
No other changes have occurred at the
facility in the last 15 years and they have not
had any enforcement issues.
178

Netting (cont.)
Example (Continued)
BAE for Process Line A, as provided by the applicant:
SO2 = 90 TPY (Sept. 2008 to Aug. 2010)
NOx = 65 TPY (Sept. 2008 to Aug. 2010)
CO = 230 TPY (Sept. 2008 to Aug. 2010)
179

Netting (cont.)
Example (Continued)
PAE after the project for Line A:
SO2= 125 TPY (90 + 35 = 125)
NOx = 115 TPY (65 + 50 = 115)
CO = 340 TPY (230 + 110 = 340)
180

Netting (cont.)
Example (cont.)
Change in Emissions for the project:
35 TPY of SO2 < 40 TPY, not significant
50 TPY of NOx > 40 TPY, significant emissions increase
110 TPY of CO > 100 TPY, significant emissions increase
181

Netting (cont.)
Example (cont.)
Step 1: Identify Contemporaneous Period
Construction is projected to begin shortly after permit issuance on September 1, 2013, therefore, the contemporaneous period begins on September 1,2008 and ends when Line A has begun normal operation.
182

Netting (cont.)
Example (cont.)
Step 2: Determine all Emission Changes During Contemporaneous Period
Removed the two boilers in 2011;
Began installation of the three process heaters in August 2013;
Process Line B was removed in June 2008.
183

Netting (cont.)
Example (cont.)
Step 3: Identify Changes that Caused Creditable Emission Changes
Boilers removed in October 2011
Heaters permitted in 2012, construction commenced in August, 2013
184

Netting (cont.)
Example (cont.)
Step 4: List the Changes that Cause Creditable Emission Changes
In Step 3, both the removal of the boilers and the addition of the heaters were deemed as the only creditable changes at the facility during the contemporaneous period.
185

Netting (cont.)
Example (cont.)
Step 5: Establish the BAE for the Creditable Changes
Both creditable, contemporaneous changes in emissions were for non-EUSGUs. Therefore, BAE is determined by the following:
186

Netting (cont.)
Example (Step 5: cont.)
1. Identify the proper look back period for the emissions unit. For netting purposes for a non-EUSGU, this is the ten year period immediately preceding the earlier of the date on which construction actually begins or when a complete application is submitted, but cannot include any period prior to November 15, 1990.
187

Netting (Cont.)
Example (Step 5: Cont.)
2. Select a 24-month period that meets all of the necessary criteria:
• May be different for each affected emissions unit;
• May be different for each pollutant; and
• Sufficient documentation exists to calculate actual emissions and any adjustments
188

Netting (cont.)
Example (Step 5: cont.)
3. Calculate the annual average emission rate based on the actual emissions from the emissions unit during the selected 24-month period.
4. Adjust the calculated emissions for non-compliant emissions, quantifiable fugitive emissions, startup, shutdown and malfunction emissions, and for regulations with which the facility must currently comply.
189

Installed process heaters 8/13
Contemporaneous Period
Construction begins 9/1/13
5 year prior
9/1/08
Normal operation resumes 12/31/14
PTI Application 5/13
Boilers removed 2011
Process Line B Removed 6/08
Netting Example
190

Netting (cont.)
Example (Step 5: cont.)
Boilers:
The boilers were removed October 10, 2011, so the ten year look back period begins October 10, 2001.
BAE for two Boilers for CO and NOx:
Based on actual fuel usage, from March 2009 to February 2011, emissions were determined to be 46 TPY of CO and 20 TPY of NOx. This matches what was reported to MAERs.
191

BAE
10/10/01
Boilers removed 10/10/11
NOx = 20 tpy CO = 46 tpy
2/11 3/09
10 year look back
Netting Example
192

Netting (cont.)
Example (Step 5: cont.)
Process Heaters
The process heaters were installed in August 2013; therefore, they have not begun operation as of the submittal of this PTI application.
BAE needs to be determined for CO and NOx:
No baseline has been established for the process heaters because they have not yet operated therefore, the BAE for each pollutant is zero.
193

Installed process heaters 8/13
Contemporaneous Period
Construction begins 9/1/13
9/1/08
Normal operation resumes 12/31/14
PTI Application 5/13
Boilers removed 2011
Process Line B Removed 6/08
Netting Example
194

Netting (cont.)
Example (cont.)
Step 6: Determine the Potential to Emit for Creditable Changes
Because the boilers have been removed, the potential to emit after the change to the A line for the boilers will be zero.
For the process heaters, they have not yet operated; therefore, the permitted limit is used as the PTE.
195

Netting (cont.)
Example (cont.)
Step 7: Calculate the Magnitude of each Creditable Change
Emissions Change for Each Creditable Change = PTE – BAE
196

Netting (cont.)
Example (Step 7: cont.)
Boilers Process Heaters
NOx CO NOx CO
PTE 0 0 8 40
BAE 20 46 0 0
Change -20 -46 8 40
197
Netting (cont.)
Example (cont.)
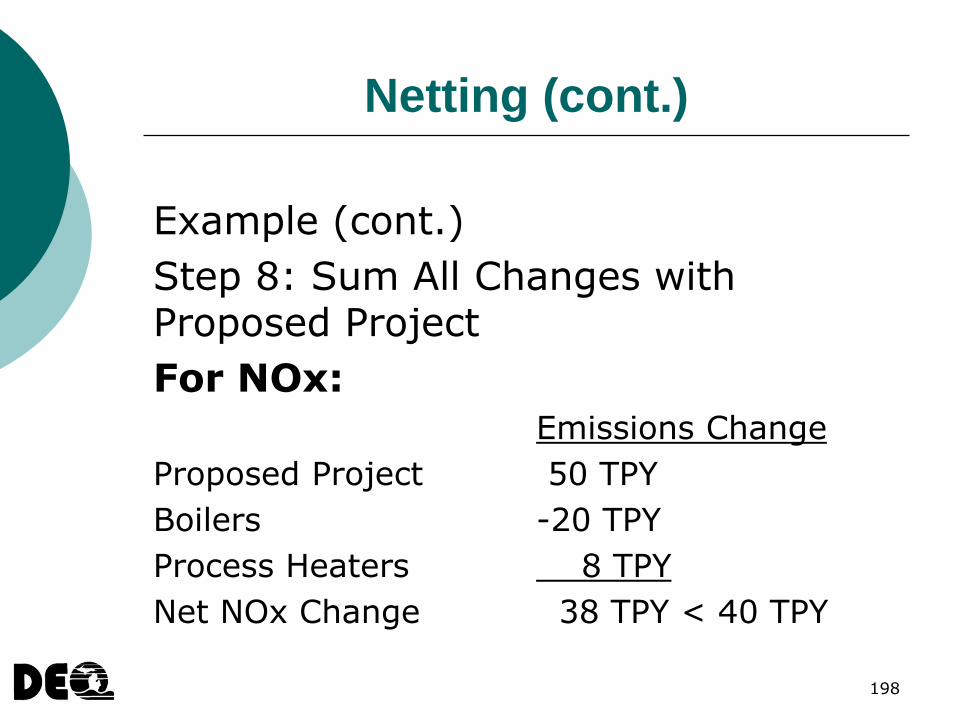
Step 8: Sum All Changes with Proposed Project
For NOx:
Emissions Change
Proposed Project 50 TPY
Boilers -20 TPY
Process Heaters 8 TPY
Net NOx Change 38 TPY < 40 TPY
198

Netting (cont.)
Example (Step 8: cont.)
For CO:
Emissions Change
Proposed Project 110 TPY
Boilers -46 TPY
Process Heaters 40 TPY
Net CO Change 104 TPY > 100 TPY
199

Netting
QUESTIONS?
200

Michigan Department of
Environmental Quality
www.michigan.gov/deq
(800) 662-9278
201

Best Available Control
Technology (BACT)
Julie Brunner, P.E.
Michigan Department of Environmental
Quality
517-284-6789 / [email protected]
202

Outline
Introduction (p.85)
Definition (p.85)
Top-Down BACT (p.85-89)
203

Introduction
The Best Available Control Technology (BACT) analysis is designed to ensure that state of the art technologies are implemented in order to minimize the impact of any significant emissions increase.
204

Definition
“Best available control technology” or BACT means an emissions limitation, including a visible emissions standard, based on the maximum degree of reduction for each regulated new source review pollutant from any proposed major stationary source or major modification which the department -- on a case-by-case basis, taking into account energy, environmental, and economic impacts and other costs -- determines is achievable for such source or medication through application of production processes or available methods, systems, and techniques, including fuel cleaning or treatment or innovative fuel combination techniques for control of the pollution. . .”
R 336.2801(f)
205

BACT
BACT means an emissions limitation based on the maximum degree of reduction for each regulated NSR pollutant from any proposed major stationary source or major modification.
206

Case-by-Case BACT
A BACT analysis is performed on a case-by-case basis for each pollutant subject to the PSD regulations, including visible emissions.
It is the responsibility of the applicant to perform the analysis.
It is the responsibility of the AQD to review the analysis, draft the permit, and approve the PSD permit.
207

Top-Down BACT
The top-down approach considers all available options for reducing emissions. There are five steps in the “top-down” BACT approach. 1. Identify all control technologies; 2. Eliminate technically infeasible options; 3. Rank the remaining control technologies by
control effectiveness; 4. Evaluate the most effective controls and
document the results; 5. Select BACT.
208
(USEPA New Source Review Workshop Manual – Prevention of Significant Deterioration and Nonattainment Area Permitting, DRAFT, October 1990.)

Minimum BACT
Must meet the standards in the State Implementation Plan (SIP).
Meet the requirements of any applicable standard of performance and emissions standard under 40 CFR Part 60 (NSPS) and 61 & 63 (NESHAP) for the source category.
209
Top-Down BACT – Step 1
Step 1: Identify all control technologies
The first step in a BACT analysis is to identify all available control options for each emission unit or for logical combinations of emission units for each regulated NSR pollutant subject to PSD.
210

Step 1 – Identification of Control
Potential control options include add-on controls, such as scrubbers or fabric filters;
Lower emitting processes and the use of materials that result in lower emissions, such as water-based coating instead of solvent-based coatings;
Work practices, such as good combustion practices; or
A combination of control technologies and work practices.
211

Step 1
Sources of information:
USEPA’s Air Pollution Control Technology Center Verified Technologies (at http://www.epa.gov/nrmrl/std/etv/vt-apc.html) and the RACT/BACT/LAER (RBLC) Clearinghouse (at http://www.epa.gov/ttn/catc/);
Other government and state agencies websites;
Testing and monitoring results, permits, and reviews from similar sources;
Environmental or industry organizations, technical journals and conferences; and
Control technology vendors.
212

Air Pollution Control Technology
Center Verified Technologies
213

214

RBLC Clearinghouse
215

RBLC Clearinghouse
216

Top-Down BACT – Step 2
Step 2: Eliminate technically infeasible options
Determine the technical feasibility of each control option identified in Step 1.
217

Technically Feasible
Control that has been installed and successfully operated at a comparable source is considered to be feasible.
At least in the licensing and commercial demonstration stage of development.
Transfer technology
218

Technically Infeasible
If it can not be realistically installed and operated on the proposed process, then it probably is not technically feasible.
Physical, chemical, or engineering data is needed to demonstrate that a technology would not work on the proposed process.
Not commercially available 219

Top-Down BACT – Step 3
Step 3: Rank the remaining control technologies by control effectiveness
The control options are ranked from the
most effective to the least effective in terms of emission reduction potential.
220

Step 3 - Ranking Control
The same units of measure should be used to compare performance levels of all options on the list.
% of control effectiveness
Controlled emission rate
This should be done for each emissions unit and each logical grouping of emissions units for each PSD pollutant.
221

Top-Down BACT – Step 4
Step 4: Evaluate the most effective controls and document the results
This involves an analysis of
all energy, environmental and economic impacts associated with
the list of available control technologies.
222

Energy Impacts
Determine any energy penalties or benefits that result from using each control technology.
223

Environment Impacts
Examples of environmental impacts include:
Solid or hazardous waste generation,
Discharges of polluted water, visibility impacts, or emissions of non-NSR pollutants.
If reduction of the pollutant under review is small compared to the collateral increase in another pollutant, the control option may potentially be eliminated.
224

Economic Impacts
Cost effectiveness (annualized cost), is measured in dollars per ton of pollutant removed and includes both the cost to install and operate.
The cost analysis methods in the Office of Air Quality Planning and Standards (OAQPS) Control Cost Manual (USEPA 453/B-96-001) may be used to assure consistency with other BACT analyses.
225

Cost Effectiveness
The cost effectiveness is calculated in two ways: average cost and incremental cost.
226

Cost Effectiveness (cont.)
The incremental cost is the difference in cost between two control options.
Used to analyze the difference between the control options with the most emission reductions for the least cost.
227
1 2
Cost Effectiveness - Example
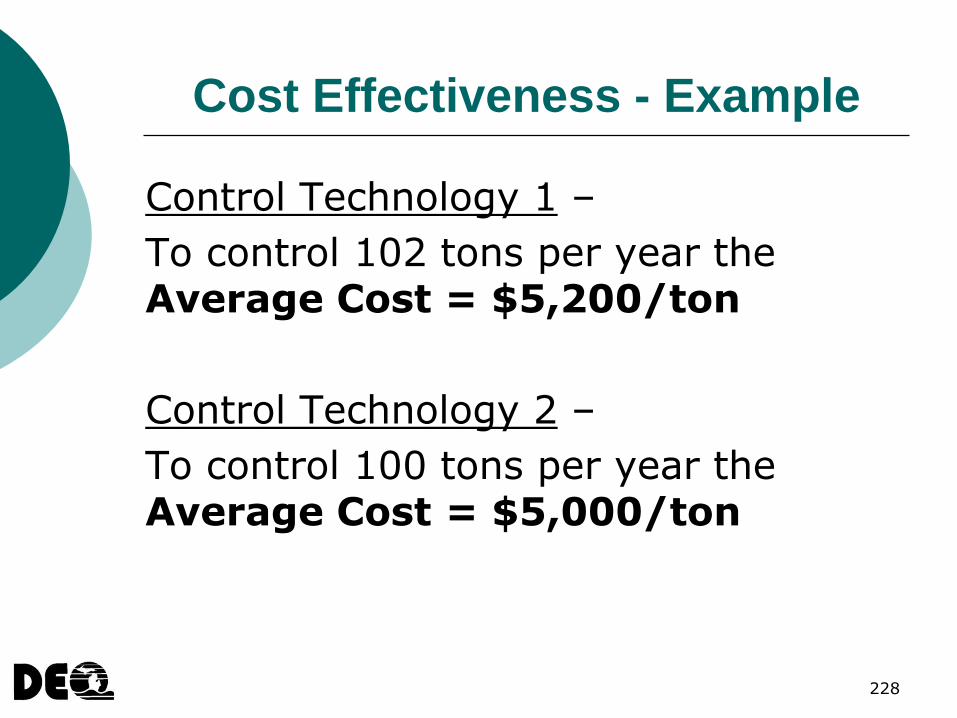
Control Technology 1 –
To control 102 tons per year the Average Cost = $5,200/ton
Control Technology 2 –
To control 100 tons per year the Average Cost = $5,000/ton
228

Cost Effectiveness - Example
229
Control Technology 1 Annualized Cost = $530,400
(i.e., $5,200/ton x 102 tons)
Control Technology 2 Annualized Cost = $500,000
(i.e., $5,000/ton x 100 tons)
Incremental Cost = $15,200 per ton
(i.e., $530,400 - $500,000 / 102 tons – 100 tons)
Control Technology 1 controls two more tons than Control Technology 2, but incrementally, costs $15,200 per ton for the two tons. It may not be cost effective to select Control Technology 1.

Cost Effectiveness (cont.)
In order to eliminate a control option on the basis of economic infeasibility;
The applicant must demonstrate that the control technology is significantly more than the control costs being borne by other similar sources, and
Not cost effective in its own right as in the cost of the control equipment is high compared to the total project cost.
230

Top-Down BACT – Step 4
It must be demonstrated that the control technology is significantly more than the control costs being borne by other similar sources.
231

Top-Down BACT – Step 5
Step 5: Select BACT
The most effective control option not eliminated under Steps 1 through 4 is proposed as BACT.
232

Top-Down BACT – Step 5 (cont.)
Establishing BACT Limits
The BACT emission limit must be met at all times;
Contain appropriate averaging time periods; and
Have proper compliance procedures and recordkeeping for the averaging period.
233

BACT Emissions Limitations
The emissions limit must be practically enforceable.
The averaging time and monitoring method must be consistent.
Any assumptions used need to be incorporated into enforceable limits.
Design, equipment, or work practice standards may be used in lieu of a numerical emission limit.
234
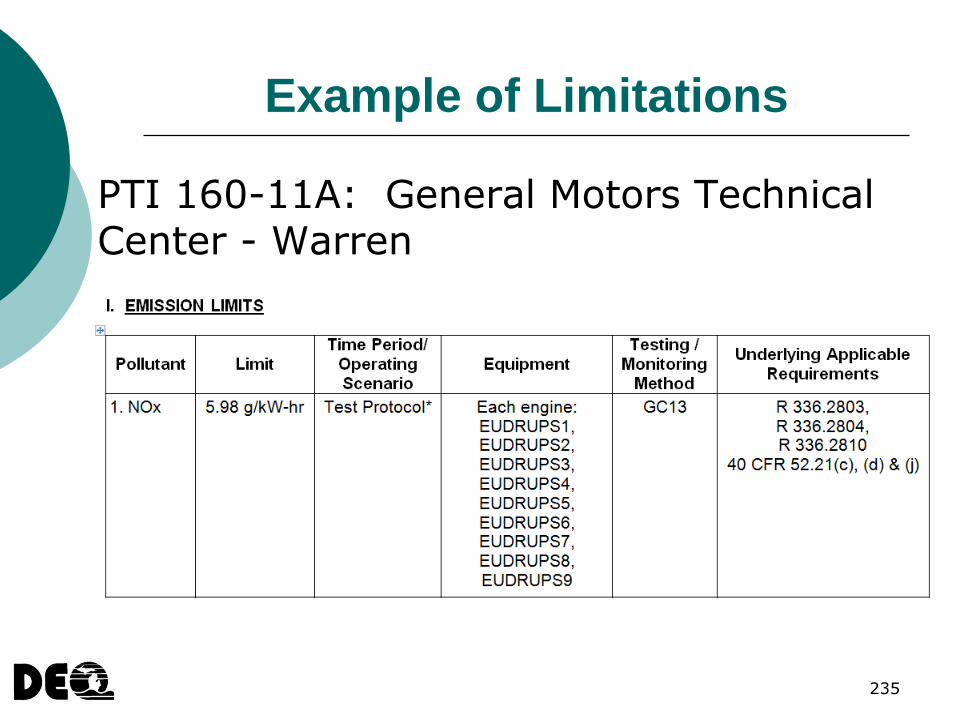
Example of Limitations
PTI 160-11A: General Motors Technical Center - Warren
235

Top-Down BACT – Step 5 (cont.)
The BACT emissions limitation can not cause a violation of NAAQS or PSD Increment.
236

BACT ANALYSIS EXAMPLE
COMBINED-CYCLE NATURAL GAS-FIRED TURBINES
237

Step 1 – Identify All Control Technologies
Available control technologies:
SCONOXTM
Selective catalytic reduction system (SCR)
SCR with water or steam injection
Selective non-catalytic reduction system (SNCR)
Water/steam injection
238

Step 2 - Eliminate Technically Infeasible Options
SNCR can be eliminated as technically infeasible because an exhaust gas temperature of 1,300 to 2,100°F is required, which is much higher than the exhaust gas temperature of a turbine.
239
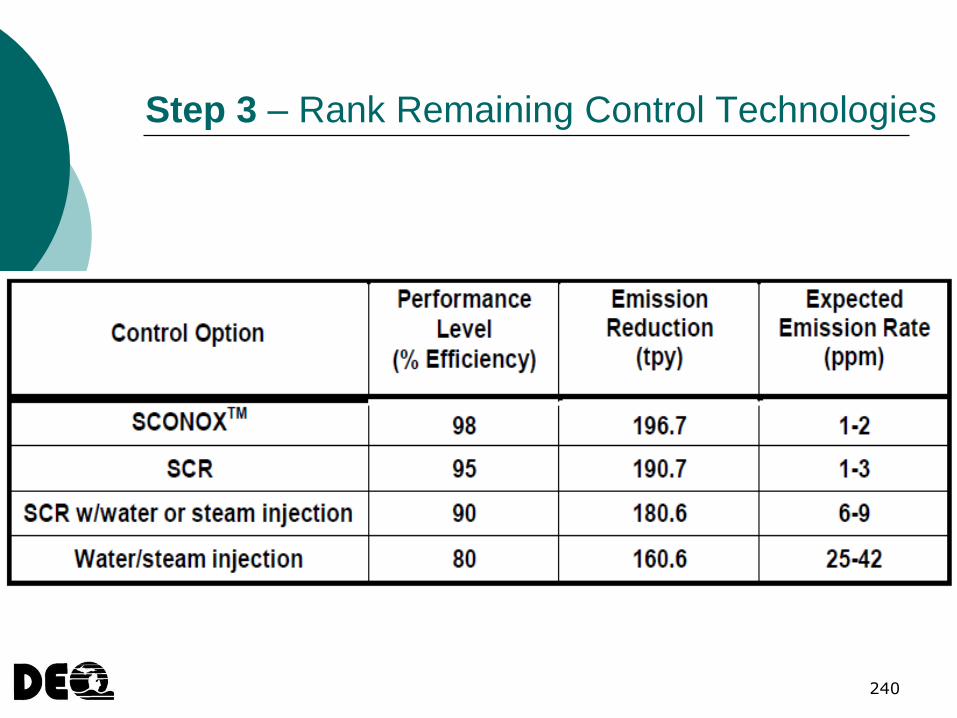
Step 3 – Rank Remaining Control Technologies
240

Step 4 – Evaluate the Most Effective Controls
1st choice—SCONOXTM
Energy and environmental impacts include the increased use of natural gas, reduced power output for the turbine, an increase in water use, and additional wastewater generation.
2nd choice—SCR
Energy and environmental impacts are not considered adverse or a cause for elimination. There may be an increase in particulate emissions while using an SCR system due to the potential formation of ammonia sulfates.
241

Step 4 (cont.) – Economic Impact
242
$7,865/ton

Step 5 – Select BACT
BACT for the turbines is demonstrated to be SCR systems with a NOx emission limit in the range of 1 – 3 ppm.
But the applicant is not finished!
Appropriate averaging time periods; and
Proper monitoring and recordkeeping need to be proposed.
243

BACT Pit-Falls
Confusing technically infeasible with cost effective.
Applicant does not propose a BACT emission limit. (e.g., BACT is not a control device.)
Not proposing a monitoring method that shows compliance with the BACT emission limit.
Not proposing an averaging time that is enforceable as a practical matter.
244

Summary
A case-by-case BACT analysis is a complex permitting process.
It may be helpful to meet with the MDEQ prior to submitting a BACT analysis to assure completeness.
245

Questions?
www.michigan.gov/deq
(800) 662-9278
246

DISPERSION MODELING
Jim Haywood
Michigan Department of Environmental
Quality
(517) 284-6745 / [email protected]
247

Air Quality Models
248

Prediction of Ambient Impacts
Provide estimates of the relationship between emissions and the resulting ambient impact.
249

Prediction of Ambient Impacts
Simulate conditions using emission and flow rates, angle of release, exhaust temperature, wind speed, wind direction, ambient temperature, atmospheric stability, chemical transformation rates and physical removal rates;
Resultant maximum ground level concentration is then compared to the NAAQS or PSD Increments.
250

Level of Model Sophistication
Screening Model
AERSCREEN
Refined Models
AERMOD
CALPUFF
251

AERSCREEN
A simple, interactive program which can quickly perform single source, short-term calculations;
Retains many of the simplicities of its predecessor, SCREEN3, while including many of the more sophisticated features found in the USEPA’s preferred refined model, AERMOD.
252

AERMOD
Simulates transport and dispersion from multiple points, area, and volume sources;
Employs hourly sequential meteorological data to estimate concentrations for averaging times ranging from one hour to one year.
Steady state plume dispersion model for assessment of pollutant concentrations from a variety of sources;
253

AERMOD PRE-PROCESSORS
AERMET /AERSURFACE / AERMAP
254

AERMET
Meteorological pre-processor for the AERMOD program;
Organizes available meteorological data into a format suitable for use by the AERMOD model;
Can incorporate 1-minute meteorology (AERMINUTE) for better resolution and fewer calms.
255

AERSURFACE
Processes land cover data to determine the surface characteristics for use in AERMET.
256

AERMAP
Simplifies and standardize the input of terrain elevation data for the AERMOD program.
257

CALPUFF
Visibility assessments and Class I area impact studies.
258

Modeling Elements
Significant Impact Analysis
PSD Increment
NAAQS
259

Significant Impact Analysis
If the predicted net project impact is less than the Significant Impact Level (SIL), the emissions of that pollutant will not be considered to cause or contribute to any violation (PM2.5 current exception);
Net project impacts greater than the SIL require further analysis.
Determines the predicted net impacts from the proposed project;
260

PSD Increment Analysis
Maximum allowable increase in concentration that may occur above a baseline concentration;
All sources (major and minor) installed after the applicable baseline date consume increment;
Highest-2nd-High concentrations (non-annual) predicted over 5 years should be used.
261

NAAQS Analysis
All nearby sources that have modeled impacts with a significant concentration gradient overlapping the proposed project;
The ambient background, based on monitored air quality data, must be added to the modeled impact;
NAAQS is based upon the total modeled air quality impact rather than just the post-baseline net increase;
262

Nearby Source Emissions
Inventory
An emissions inventory of nearby sources can be requested from the MDEQ;
Facilities, which do not have overlapping significant concentrations gradients, are no longer explicitly modeled and are assumed to be part of the background.
263

Background Concentration
Pre-Construction Monitoring
If there are no monitors located in the vicinity of the source, a “regional site” may be used to determine background;
A “regional site” is one that is located away from the area of interest but is impacted by similar natural and distant man-made sources.
At least one year of continuous air monitoring data to determine background is required;
264

Pre-Construction Monitoring
Waiver Request
In most cases, adequate representative existing monitoring data exists such that a monitoring waiver can be granted by the MDEQ.
All major new or modified sources that are required to conduct a full impact analysis should request a pre-construction monitoring waiver from the AQD, even if impacts are below Significant Monitoring Concentrations (SMC);
Waiver, please!
265

Secondary Pollutant Analysis
Ozone
Non-primary PM2.5
266

Secondary Pollutant Analysis
No USEPA promulgated tools are currently available;
USEPA has issued draft guidance for addressing secondary impacts of PM2.5 resulting from significant SO2 and/or NO2 emissions.
USEPA now requires a formal evaluation of secondary pollutants during Increment and NAAQS air impact reviews;
How???
267

Revoked NAAQS Thresholds
Recently revoked NAAQS pollutants:
SO2 (24-hour)
SO2 (annual)
PM10 (annual)
Note that PSD Increment still applies to
revoked NAAQS pollutants.
268

Modeling Protocol Submittal
Applicants for PSD permits are advised to submit the details of their proposed modeling analysis to the MDEQ before a PSD application is submitted;
The USEPA mandates their review and approval of any submitted modeling protocol if the suggested methodology involves any deviation from AERMOD default settings.
Full PSD modeling analysis must be submitted by the applicant. MDEQ will review and validate;
269

Common Modeling Slip Ups
Incorrect meteorology data;
No nearby source inventory;
No secondary analysis;
No preconstruction monitoring waiver;
Under-qualified technical staff;
Poor documentation; Poor QA/QC.
270

ADDITIONAL IMPACT ANALYSIS
Jim Haywood
Michigan Department of Environmental
Quality
(517) 284-6745 / [email protected]
271

Additional Impact Analysis (AIA)
AIA includes, but is not limited to, three parts:
Growth
Soil and Vegetation Impacts
Visibility Impairment
All PSD permit applications must include an additional impacts analysis for each pollutant subject to PSD;
There’s more???
272

Growth Analysis
The elements of a growth analysis include:
A projection of the associated industrial, commercial, and residential growth that will occur in the area due to the proposed project;
An estimate of the air emissions generated by the growth.
273

Soils and Vegetation
Analysis of impacts on soils and vegetation should be based on an inventory of the soil and vegetation types found in the area;
Should include all vegetation with any commercial or recreational value.
274

Class I Areas Impact Analysis
Class I areas are areas of national or regional natural, scenic, recreational, or historic value for which the PSD regulations provide special protection as well as additional protection of visibility;
Class I areas allow a lower increase in concentrations of pollutants (increment) above baseline concentrations than Class II areas.
275

Class I Areas Impact Analysis
Mandatory 100 km Radius
276

Icing and Fogging
Local Visibility Considerations
277

Fugitive Dust
Local Visibility Considerations
278

Odor Modeling
Local Odor Considerations
279

QUESTIONS?
280

Michigan Department of
Environmental Quality
www.michigan.gov/deq
(800) 662-9278
281

Decision-Making and
Public Participation
Julie Brunner, P.E.
Michigan Department of Environmental
Quality
517-284-6789 / [email protected]
282

Outline
Introduction (p.115)
Draft Conditions, Notice of Hearing, and Fact Sheet (p.115 - 116)
Public Input Process (p.116-118)
Decision-Making (p.119)
283

Introduction
All PSD permit applications are subject to the requirements for public participation in Michigan’s State Implementation Plan (SIP).
284

Public Participation
Other permits that could be subject to the public participation process:
Net outs of PSD
Opt out permits (contain restrictions greater than 90% of applicable thresholds)
Controversial permit actions
285

Permits Under Review
Not all permit applications go through public participation.
A list of all applications under review is available at: http://www.deq.state.mi.us/aps/PendApps.asp.
This list is sent monthly to each board of County Commissioners.
286

Draft Conditions
Once an application is both administratively and technically complete, and the technical review is concluded, a draft permit is developed.
287

Notice of Hearing and Fact Sheet
A notice of hearing and fact sheet is prepared for each draft PSD permit.
The fact sheet provides a description of the proposed process, the issues considered in preparing the draft permit, and other items of interest.
288

Notification
Components of the public participation process include notifying all interested parties of a public comment period, and the opportunity for a hearing.
Legal notice in a local paper of general circulation.
Electronic communication - Copies of public participation documents are placed on the MDEQ web page (http://www.deq.state.mi.us/aps/cwerp.shtml).
A notice of the pending permit action is also placed in the MDEQ calendar.
Area mailing lists either via direct or electronic mail.
289

Content of a Public Notice
The notice covers the details of the proposed action, and includes the following:
Name and address of the facility;
A brief description of the permit application;
Contact information of a person from whom interested persons may obtain further information on the application;
A brief description of the comment procedures, the time and place of any hearing, including how to request a hearing; and
A brief description of the nature and purpose of the hearing.
290

291

DEQ Web Page
292

Public Input Process
Following are the components of the public input portion of the decision making process:
Public Comment Period
Informational Meetings
Public Hearing
Public Comments
A public comment period lasts a
minimum of 30 days. 293

Informational Meetings and
Hearings
An informational meeting may be held to provide interested parties with the opportunity to ask questions of the MDEQ staff.
Public hearings provide the public with the opportunity to submit verbal testimony directly to the decision-maker.
294

Public Comments
All written comments submitted during the public comment period, as well as oral comments provided at the public hearing, are considered.
Comments may generate additional questions to be answered or additional technical review.
Air quality comments are addressed in a response to comment (RTC) document.
295
Permit Decision
A final permit decision is made by the decision-maker. The decision-maker will take one of the following actions:
Approve as drafted
Approve with amendments
Deny the permit
All interested parties are notified of the decision.
296

Appeals
A decision on a PSD permit may be appealed in one of two ways, depending on whether the source is new or existing:
For a new source, any person has the ability to appeal under section 324.5505(8) of Part 55 of NREPA, Act 451 of 1994 (as amended).
For an existing source, any person has the ability to appeal under section 324.5506(14) of Part 55 of NREPA, Act 451 of 1994 (as amended).
297

Permit Issued – Commence Construction!
298

Questions?
www.michigan.gov/deq
(800) 662-9278
299