chapter: 05 chewable press coated tablets of...
TRANSCRIPT

200 | P a g e
CHAPTER: 05
CHEWABLE PRESS COATED TABLETS OF ORLISTAT AND
VENLAFAXINE HYDROCHLORIDE- DEVELOPMENT AND
EVALUATION
5.1 INTRODUCTION
Obesity is an epidemic disease according to the latest WHO report. From the vast
literature survey it is confirmed that, the increase in calorie intake or excessive eating is
the main culprit for the rising obesity, in comparison to the other aspects (Marsha D.
Marcus et al., 2009, B. Rospond et al., 2015). The obese individuals are routinely
stigmatized in the society, with discrimination and bias being the most common. The
consequences of this stigmatization are seen in the denial of jobs, uncaring by the health
care personal, lagging in the education or victimized by the family members. Especially
the obese binge eaters suffer discrimination extensively from the both directly by abusers
and indirectly from the isolation and exclusion from the society (Rebecca M. P. et al.,
2014).
Many clinical studies have also proved the fact that there is very high prevalence of
psychological distress among obese patients. More than fifty percent of severely obese
patients suffer from psychological distress or depression. And the obese patients with
depression are usually accompanied by the symptoms of bing eating disorder (G. T.
Wilson et al., 1993, F.S. Luppino et al., 2010). Bing eting disorder is an eating problem
that is noted by repeated bing eating in a short period, and the sufferer will be unable to
control the carving for the high-calorie rich food (JA Linde et al., 2004).
Many pharmacological and psychological treatment approaches have been tried and used
in obese binge eaters with psychological distress. Some patients have suppressed bing
eting in the short term and some seem to be promising in the long term as well. However,
a sustained weight reduction with control of bing eating seems to be the unrealistic goal
at present. Recently, obese BED treatment programs have tried to address these goals by
combination therapy (MJ Devlin 2001, Rosenberger and Dorflinger, 2013, Brooke A.
Bailer et al., 2014).

201 | P a g e
Fig. 70 Press Coated Tablets Model Image
Chewable tablets are the uncoated tablets, designed and prepared to be chewed in the
mouth to produce a good taste residue with slow disintegrating in the buccal cavity that
can be easily swallowed and does not have unpleasant taste (S.K. Sing and V. Naini,
2007). Compression coated tablet is a solid dosage form, in which all the surface of an
inner core tablet is completely surrounded by coat layers. Compression coating is mainly
used to develop the combination of drugs and to protect the hygroscopic or unstable drug
in the core by press coating with the stable outer layers (Hariharan and Gupta 2001).
ORL is an anti-obesity drug that works in the gastrointestinal tract blocking lipese to
prevent the dietary fat going in the body And in few clinical randomized controlled trials
the ORL along with the cognitive behavioral therapy has proven to be effective in the
obese patients with binge eating order (James WPT et al., 1998, Lars Sjostrom et al.,
1998, C.M. Grilo et al., 2005). VNF is a drug acting on CNS as an antidepressant class of
serotonine noradrenaline-reuptake inhibitor (SNRI). It is very effective in depression
disorders, anxiety disorders and also binge eating disorder (Burnett and Dinan, 1998,
Malhotra S et al., 2002).
5.1.1 Objectives:
The objective of the present project was to prepare a 60mg ORL+β-CD orodispersible
core tablet, and to press coat this with 75mg of VNF microparticles, (prepared with
Eudragit EPO for masking the bitter characteristics). Ultimately to obtain the biphasic
chewable press coated tablet dosage form for the treatment of obesity and bing eting
disorder.

202 | P a g e
5.2 MATERIALS AND METHODOLOGY
5.2.1 MATERIALS
Orlistat (ORL) was procured as a gift simple from RA Chem., Pvt Ltd.
Hyderabad. Venlafaxine Hcl. (VNF) was procured from SL drugs & pharmaceuticals
Hyderabad. Ludipress LCE, Ludiflash, Kollidon CLF and Kollidon-30 were the
generous gift simple from BASF Pvt Ltd. Mumbai. β-cyclodextrin and Maltodextrin were
procured from SD fine chem. Pvt Ltd. Mumbai. Sucralose, Cherry and Peppermint
flavour were a gift simple from Cheminova Pvt Ltd. Hyderabad, Magnesium Stearate and
Talc were procured from Qualikem fine chem. Pvt Ltd, Vadodara. Other excipients used
in the project were purchased from SD fine chem. Pvt Ltd. Mumbai.

203 | P a g e
5.2.2 Equipments Used in the Project work:
Equipments to be used in the present project work are listed in the below table.
Table-57 List of equipments
S.
No. Name of instruments Manufacturer Model
1 Bi-layer Tablet compression
machine
Karnavathi Rimek II DL 9
STATION
2 Dissolution Test Apparatus Electrolab TDT-08L
3 UV-Vis Spectrophotometer Shimadzu UV-1800
4 HPLC Perkin Elmer 200 Series
5 Disintegration Test apparatus Electrolab ED-2AL
6 Sonicator Prama Instruments SONI-111
7 Electronic Analytical balance Afcoset Pvt, Ltd ER-182-A
8 Millipore Distilled water System Millipore Pvt, Ltd MILLI Q
9 Tablet Friabilator Electro Labs EF-2(USP)
10 Tablet Hardness Tester Dr Schleuniger
Pharmatron
8M
11 Water bath Shaker Remi DS451
12 Melting Point Apparatus Analab THEMOCEL
10
13 Digital pH meter Elico Ltd ATC(CL51B)
14 Bulk density apparatus Electrolab ETD 1020
15 Dry Granulator- Kalweka Karnavati Rimek DGS-2

204 | P a g e
5.3 EXPERIMENTAL METHODS:
5.3.1 Preformulation Study:
5.3.1.1 Physical Examination of the Active and nonacitve Pharmaceutical
Ingredient:
In the physical examination of the (API) and the non active ingredients, the evaluation
was done manually by examining the colour odour and taste utilizing human senses.
5.3.1.2 Identification of Pure drug or Active pharmaceutical ingredient:
Purity of the active pharmaceutical ingredient was characterized by determining the
melting point, Lambda max by UV spectroscopy, FTIR spectra.
5.3.1.3 Determination of Melting Point (M.P)
Determination of melting point of an active pharmaceutical ingredient is carried out by
capillary method using instrument µ Thermocol 10 (Ana lab Scientific). By following the
standard procedure, first the sample API is carefully loaded into the capillary tube
through the open end by gently pressing the API into the capillary tube several times.
When the powder is pushed to the bottom of the capillary tube, then sample tube is kept
into one of the sample position slots located on top of the instrument. Then the maximum
heating cut off temperature is set to avoid overheating and the melting point apparatus is
started to run. Then the observation is done visually through the magnifying lense
attached to the apparatus. When the sample or API nears the reference melting point, it is
keenly observed to check the actual melting point temperature. When the sample melts,
that temperature is noted down as it is the actual melting point temperature of the sample.
5.3.1.4 ORL λ Max Determination in Methanol by UV Spectroscopy:
In this UV spectroscopic analysis of ORL λ max first a VF of 200ml was taken and few
milliliter of methanol is added then accurately weighed 200 mg or ORL was added and
the VF volume was made upto the mark by adding methanol. This suspension is shaken
vigorously first utilizing the cyclo mixture and then the bath sonicator for one hour. Once
the clear stock solution is formed it is filtered and is considered as the standard stock
solution. This std. stock solution is further used for preparing the different concentration
of ORL utilizing methanol as the diluting solution. Finally the different concentrations of

205 | P a g e
the ORL prepared are analyzed by UV spectroscopy between 190-390 nm, to find the λ
max of ORL.
5.3.1.5 Comparison of the FTIR Spectra:
The FT-IR spectra of the pure drug ORL and drug in combination with other excipients
were recorded with ABB Bowen Series spectrophotometer over the region of 400 – 4000
cm-1 by adopting Potassium bromide disc method at Sipra Labs, Hyderabad. The
compatability of the active and nonactive substances was analyzed utilizing the FT
infrared spectroscopy. In this method the FTIR spectrum of the pure drug is compared
with the FTIR spectrum of pure drug containing the excipients by overlapping both the
spectras.
5.3.1.6 FTIR Sample Measurement Method:
There are two common methods for the solid sample preparation in the FTIR
spectroscopy; KBr disc method and Nujol method. In the present project work KBr Disc
method was utilized and the procedure is explained below:
5.3.1.7 KBr Disc Method: In this method as the name indicate a 13mm diameter
discs are prepared by taking 0.1 to 1% sample and are mixed with approximately 200 to
250 mg of KBr powder. Then this mixture is finely pulverized and passed through the
200µ sieve and dried at around 110 °C. Removal of air and is done by degassing
procedure and stored in a desiccator. The sample is then placed into a disc forming die
and approximately eight to ten tons of pressure is applied under a vacuum of several mm
Hg for several minutes to form a transparent disc. The API+ KBr powder formed disc is
now ready to record the FTIR spectra by placing in the instrument and running
approximately between the regions of 4000 to 200 cm-1. When performing the FTIR
measurements the background can be measured with the empty disc of KBr free from the
active ingredient, by inserting into the sample chamber. This is done prior to taking the
actual spectrum of the sample, so that to ensure that the infrared light absorption by the
KBr or moisture absorption is nullified.

206 | P a g e
5.3.1.8 Drug- Excipients Compatibility Studies:
.
DRUG No Interaction
1:1 Mixture FTIR Excipients Recommend
Excipients Alternative Excipients? Interaction
Fig. 71 Schematic representation of compatibility studies
5.3.2 Analytical Methods Development:
5.3.2.1 Preparation of Buffers and Reagents
5.3.2.1 (a) Sodium hydroxide solution, 0.2 M:
Required quantities and different concentrations of sodium hydroxide solution was
prepared following the method in the standard monograph.
5.3.2.1 (b) Hydrochloric acid solution, 0.2 N:
Required quantities and different concentrations of hydrochloric acid solution was
prepared following the method in the standard monograph.
5.3.2.1 (c) Potassium Di hydrogen Phosphate, 0.2 M:
Required quantity of this solution was also prepared by following the standard
monograph. The required weighed quantities of above solid as described is taken and
mixed well with the required quantity of distilled water.
5.3.2.1 (d) Phosphate Buffer pH 3:

207 | P a g e
All the buffers required in the project work are prepared following the method described
in the pharmacopeias. By taking the required quantities of the solid substances and
dissolving properly in the distilled water.
5.3.2.2 UV Estimation Method for ORL:
5.3.2.2 (a) ORL Stock Solution (1000 µg/ml) in Methanol:
200 mg of ORL was accurately weighed, transferred into a 200 ml volumetric flask,
dissolve in methanol little approx. 20ml of methanol and make up the volume to 100ml
with methanol.
5.3.2.2 (b) Standard graph of ORL in Methanol:
From the methanol stock solution, prepare 20, 40, 60, 80,100, 120, 140, 160, 180, 200
µg/ml dilutions using methanol. Measure the absorbance of each sample at λ max taking
methanol as blank. Plot a standard carve of concentration versus absarbance, to obtain the
regression eqaution.
5.3.2.2 (c) Stock Solution of ORL in 3% SLS aqueous Solution:
ORL (1000 µg/ml):
200 mg of ORL was accurately weighed, and transfer into a 200 ml V.F, dissolve in the
little quantity of methanol and make up the volume with 3 % SLS up to 200ml.
5.3.2.2 (d) Estimation of λ max of ORL Water + 3% SLS by UV
Spectrophotometer:
From the standard stock solution, Transfer 10 ml of the above solution in to a 100 ml V.F
and make the volume up to 100 ml with the Water + 3 % SLS (100 µg/ml). Take the UV
scan for this solution (100 µ g/ml) between 200-400 nm. Determine the λ max from UV
spectra of ORL.
5.3.2.2 (e) Standard graph of ORL in Water + 3% SLS:

208 | P a g e
From the above stock solution, Prepare 20, 40, 60, 80,100, 120, 140, 160, 180, 200 µg/ml
dilutions using Water + 3% SLS. Measure the absorbance of each sample was at λ max
against Water + 3% SLS as blank. Plot a standard carve of concentration varsus
absarbance, to obtain the regrretion eqaution.
5.3.2.2 (f) Stock Solution VNF Hcl. in Water:
VNF Hcl Stock Solution (1000 µ g/ml): 200 mg of BPN Hcl was transferred into 200 ml
V.F and dissolved in water and make up the volume to 200ml with water
5.3.2.2 (g) λ max of VNF Hcl. in Water Estimation by UV Spectroscopy:
From the standard stock solution, Transfer 10 ml of the solution in to V flask and make
the volume to 100 ml with the distilled water (100 µ g/ml). Take the UV scan for this
solution (100 µg/ ml) between 200-400 nm. Then determine the λ max using UV spectra
of VNF Hcl.
5.3.2.2 (h) Standard Graph for BPN Hcl in Water by UV Spectroscopy:
From the above stock solution, Prepare 2, 4, 6, 8, 10, 12µg/ml dilutions using Water.
Measure the absorbance of each sample at λ max against Water as blank. Plot a standard
carve of concentration versus absarbance, to obtain the regrretion eqaution.
5.3.2.3 HPLC Method Development for ORL and VNF in the Formulaiton:
A liquid Chromatograpic method of estimation developed for the determination of ORL
and VNF in the formulation
A HPLC method utilizing the reverse phase was developed and validated as per the
international guidelines of ICH for the estimation of ORL and VNF in the formulation. A
HPLC System made by Perkin Elmer 200 Series equipped with UV-detector using (RP-
18e (5µm) Lichrospher® 100 column). The wavelength for UV detection was set at 210
nm. The mobile Phase composition was acetonitrile and the phosphoric acid buffer of
pH3 in the ratio of (95:5), at the mobile phase flowing rate of 1.2 ml/min the HPLC was
run for twelve minutes.

209 | P a g e
Table-58 HPLC method development of ORL and VNF parameters
Apparatus used HPLC (Perkin Elmer Series 200)
Column Lichrospher® 100
RP-18e (5µm)
Mobile Phase ACN : Buffer- pH 3 (95:5)
Flow rate 1.2 ml/min
Absorbance 210 nm
Injection volume 50 µl
Run time 12 min
5.3.3 Physico-Chemical Evaluations:
5.3.3.1 Solubility study of the pure ORL:
Solubility study of the pure ORL and with ORL β-CD complex was carried out. The
solubility study of the ORL in distilled water was carried out following the gold standard
method called shake flask. Excess amount of the API (ORL) was taken in a 50ml conical
flask with a closure to this 20ml of water was added. And this suspension is shaken at
room temperature on a shaker bath (Remi) at 100 rpm for 48h. Then solution was first
centrifuged, and the supernatant layer was filtered using the branded filter paper of 0.45µ
and the filtrated solution was diluted suitably and the drug content in water was
determined by analyzing using HPLC.
5.3.3.2 Partition Coefficient Study:
Partition coefficient study was performed by saturation shake flask method by using the
octanol-water system; in this method both the liquid are taken in the separating funnel
bottle and kept for saturation for two hours. Then excess of API or drug is added to this
solution and shaken vigorously for 24hrs. Then kept aside for two hours for the layer
separation, when both the layers are separated they are collected carefully without mixing

210 | P a g e
by using the separating funnel. Finally, the separated layers are assayed by HPLC to
determine the concentration of drug in the each layer.
5.3.3.3 Enhancing solubility and stability of ORL
ORL is low water soluble and very hygroscopic drug and technically difficult to prepare
as tablets. For this reason, different strategies for enhancing the solubility and stability of
ORL were tried in the preformulation study. Among these methods, Complexation with
the β-cyclodextrin was found to be more effectively enhancing the solubility and
stability. As a result, ORL β-CD physical mixture and complex in different ratio were
made.
5.3.3.4 Preparation of ORL β-cyclodextrin physical mixture and complex
5.3.3.4 (a) Physical mixing
Accurately weighed quantity of ORL was mixed vigrously with β-CD in the
different molar ratios of 1:0.5, 1:1, 1:1.5 and 1:2 in the dry state. The mixtures is then
sieved by pressed through #60 sieve to have uniform size and stored in a desiccator.
5.3.3.4 (b) ORL β-cyclodextrin inclusion complex by kneading method
The accurately weighed and passed through #60 quantity of ORL and β-CD in the
molar ratio of (1:0.5, 1:1, 1:1.5 and 1:2M), was put into a mortar with few drops of water-
alcohol (1:1) solution. The thick mass was vigorously kneaded to the paste consistency
for 1hour. The dry solid lump obtained is kept in the desiccator for 48h to remove the
moisture. The dried complex large aggloromates after drying were grounded and pressed
through sieve #60, and stored in a desiccator.
5.3.3.5 Evaluation of ORL β-cyclodextrin inclusion complex
5.3.3.5 (a) Evaluation of the inclusion complexes by X-Ray Diffraction
X-Ray Diffraction (XRD) is one of the sophisticated methods used techniques
utilized for the solid state characteristics of drugs. Therefore samples of pure drug and β-
CD complex were analyzed by XRD. XRD is the one of the novel technique for the
physical characterization of crystallite state of a solid substance.

211 | P a g e
5.3.3.5 (b) Drug content estimation of ORL- β-CD complex
200 mg of ORL-β-cyclodextrin complex was weighed accurately and dissolved
200 ml volumetric flask and the volume was made with buffer of pH 6.8 phosphate
buffer. Suitable dilutions are made by using pH 6.8 phosphate buffers. The amount of
drug present in the complex was analyzed by HPLC.
5.3.3.5 (c) Solubility determination of ORL-PM and ORL β-CD complex
To determine the solubility of pure ORL, β-CD (PM) and β-CD complex in
distilled water. A well recognized procedure called as the standard shake flask method
was followed. In this procedure the excess quantity of the powder is taken in a 50ml
conical flask with a closure to this 20ml of water is added, and the resulting suspension is
shaken on a shaker bath (Remi) at 100 rpm for 48hr at room temperature. The solution is
first centrifuged and kept stationary for one hr then supernatant layer is filtered using a
the branded filter paper of 0.45µ and the filtrate solution is diluted suitably and the
amount of drug present is analyzed by HPLC.
5.3.3.6 Taste Masking of VNF Hcl.
5.3.3.6 (a) VNF-β-cyclodextrin inclusion complexation by kneading method
The accurately weighed and passed through #60 quantities of VNF and β-CD in
the different molar ratio was put into a mortar with few drops of water-alcohol (1:1)
solution. The thick mass was vigorously kneaded to the paste consistency for 1hour. The
dry solid lump obtained is kept in the desiccator for 48h to remove the moisture. The
dried complex large aggloromates after drying were grounded and pressed through sieve
#60, and stored in a desiccator.
5.3.3.6 (b) Preparation of VNF Solid Dispersions (SD) by Solvent evaporation
method
Solid dispersions is the incorporating or dispersion of active pharmaceutical ingredient in
an inert solid carriar with sweet or no taste. Solid dispersion of API using the suitable

212 | P a g e
carriers, like sugars, or polymers is proven beneficial in the taste masking of bitter tasting
drugs.
In this project VNF Hcl. solid dispersion using Mannitol in the (1:1,1:2 and1:.3) ratios.
Required quantity of carrier Mannitol is weighed and placed in a proclaim china dish and
kept on the hot plate and slowly melted with constant stirring. When all the carriar
Mannitol is melted required quantity of the drug is incorporated into the hot mixture with
constant stirring to ensure homogeneous mixing. Then the china dish is removed from the
hot plate and immediately placed in the large bowl containing the ice cubes. This causes
the solidification of the dispersion and the obtained solid dispersion is collected and dried
for 24h in a desiccator. After drying the dry mass of solid dispersion is grounded in a
mortar using pestle and pressed through sieve #60, labeled and storred in a desicator
using later.
5.3.3.6 (c) Microencapsulation of VNF with Eudragit EPO by Emulsification
solvent evaporation method
In this process the polymer Eudragit-EPO is dissolved in a volatile solvent and the VNF
is added in and mixed well. To obtain the good microparticles high drug loading in the
microspheres is preferred. Further this polymer and drug solution or suspension (disperse
phase) is slowly dispersed in an aqueous phase (continuous phase). Usually the aqueous
phase contains heavy liquid paraffin with one percent of tween-80 that is stirred by
propeller stirrer at 800-1000 rpm for six hrs constantly at ambient temperature to remove
the organic solvent. Once the volatile solvent is completely evaporated fine drug
entrapped microparticles will be formed at the bottom. Then the stirring is stopped and
the aqueous phase is decanted to collect the microparticles by filtration and washed with
suitable solvent several times. Finally the microparticles are collected are spread on a
paper sheet and dried at 40°C for one to two hours and stored in the desiccator until
further use. (Donnell and McGinity, 1997, BolourtchianN, 2005).

213 | P a g e
5.3.4 Formulation and Preparation of Chewable Press Coated Tablets of ORL and
VNF:
The formulation of the chewable press coated tablets of ORL and VNF was done by first
preparing and optimizing the ORL inner dispersible core tablets and then taking a
placebo core tablet, six formulation trials of coating layers were tried and the outer
coating layers are optimised the formulation design of the inner dispersible core tablets
and the outer coating layers are shown in the tables.
5.3.4 (a) Formulation of ORL dispersible core tablets by direct compression method.
The rapid disintegrating inner core tablets were prepared by the direct compression
method taking the required quantity of the ORL-β-CD complex and ORL solid disprsion
and the excipients as shown in (Table no. 59). Then the lubricants magnesium stearate
and talc are added, the mixture is further blended for ten minutes and 200mg of the
resultant mixture of solid powder was manually compressed using 9mm round punches to
obtain the inner orodispersible core tablets of ORL>
Table-59 Formulations of ORL Inner core Tablet
Ingredients ORC_1
(%)
ORC_2
(%)
ORC_3
(%)
ORC_4
(%)
ORC_5
(%)
ORC_6
(%)
ORL-βCD [1:2M] 70 70 70 --- --- ---
ORL-SD Mannitol[1:3] --- --- --- 70 70 70
Ludiflash 18.5 14 11 18.5 14 11
Kollidon CLF --- 4.5 7.5 --- 4.5 7.5
Kollidon-30 04 04 04 04 04 04
SLS 02 02 02 02 02 02
Sucralose 02 02 02 02 02 02
Cherry Flavour 01 01 01 01 01 01
Methyl Paraben 0.5 0.5 0.5 0.5 0.5 0.5
Talc 01 01 01 01 01 01

214 | P a g e
Mg.stearate 01 01 01 01 01 01
Titanium dioxide (Red) q.s q.s q.s q.s q.s q.s
* ORC–Formulations of Inner Core Tablet contain 60mg of ORL.
5.3.4 (b) Formulation of mixed blend for outer layers
The outer layers blend was prepared by direct mixing method the VNF microparticles
and the VNF-β-CD complex along with the excipients as given in the (Table-60) are
taken and weighed accurately. And passed through a 40 mesh sieve and mixed in the dry
state for about twenty minutes, followed by addition of lubricants, talc and magnesium
stearate. The mixture was again blended for ten minutes and used as press-coating
powder.
Table-60 Formulations of VNF Outer coat layers (VLC 1-6)
Ingredients VCL_1
(%)
VCL_2
(%)
VCL_3
(%)
VCL_4
(%)
VCL_5
(%)
VCL_6
(%)
VNF+βCD [1:3M] 45 45 45 --- ---- ----
VNF+Eudragit EPO [1:3] ---- ---- ---- 55 55 55
Ludipress LCE 43 23 23 33 17 17
Maltodextrin --- 20 --- ---- 16 ---
Xanthan Gum --- ---- 20 ---- ---- 16
Kollidon-30 02 02 02 02 02 02
Citric acid 02 02 02 02 02 02
Sucralose 04 04 04 04 04 04
Peppermint Flavour 02 02 02 02 02 02
Propyl Paraben 0.5 0.5 0.5 0.5 0.5 0.5
Mg.stearate 02 02 02 02 02 02
Talc 1.5 1.5 1.5 1.5 1.5 1.5
*VCL-Formulations of outer coat Layers contains 75mg of VNF.
215 | P a g e
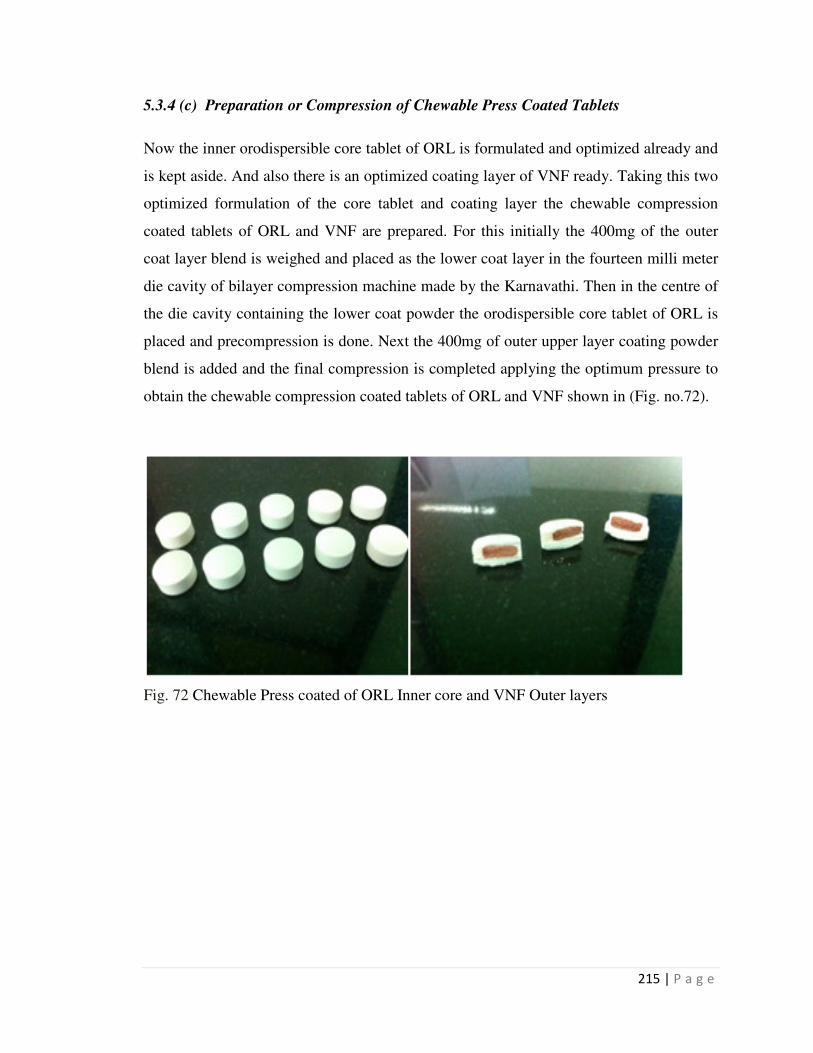
5.3.4 (c) Preparation or Compression of Chewable Press Coated Tablets
Now the inner orodispersible core tablet of ORL is formulated and optimized already and
is kept aside. And also there is an optimized coating layer of VNF ready. Taking this two
optimized formulation of the core tablet and coating layer the chewable compression
coated tablets of ORL and VNF are prepared. For this initially the 400mg of the outer
coat layer blend is weighed and placed as the lower coat layer in the fourteen milli meter
die cavity of bilayer compression machine made by the Karnavathi. Then in the centre of
the die cavity containing the lower coat powder the orodispersible core tablet of ORL is
placed and precompression is done. Next the 400mg of outer upper layer coating powder
blend is added and the final compression is completed applying the optimum pressure to
obtain the chewable compression coated tablets of ORL and VNF shown in (Fig. no.72).
Fig. 72 Chewable Press coated of ORL Inner core and VNF Outer layers

216 | P a g e
5.3.5 Pre-Compression Evaluation of Formulations Powder:
5.3.5.1 Flow properties
• Angale of Rupose (AR)
• Balk Dencity (BD)
• Tappad Dencity (TD)
• Comprassibility Index (CI) &
• Hasner Ratio (HR)
(Note: All the formulations lubricated blend flow properties evaluation was done as per
the procedures explained in the Chapter-03).
5.3.6 Post-Compression Evaluation of ODT Core and Chewable Press Coated Tablets
Evaluation of Compressed Tablets
5.3.6.1 (Note: Thickness, Hardness, Friability test and Weight Variation Test
Procedure is explained in the Post-compression evaluation methods in the Chapter-03)
5.3.6.2 In vitro disintegration pattern study of core tablets
The in vitro disintegration of the inner core tablets was carried out as per the method
described by (Chaudhari S. P.et al. 2007) with slight modification. Disintigrating
sequence was studied by taking images of the core tablets in a petri dish containing ten
milli liter of distilled water at different specified time periods and was observed visually.
5.3.6.3 In vitro drug release study of Chewable Press Coated-Tablets
The release of the drug by in-vitro dissolution test was carried out using the paddle
apparatus officially called as the USP II apparatus. The test operation was done following
the standard reference; the 3% w/v aqueous solution sodium lauryl sulfate containing the
0.5% of sodium chloride that was adjusted to pH6 with phosphoric acid was the
dissolution medium. Five ml of filtered solution was withdrawn manually using disc filter
syringe, at the specified time intervals and fives milli liter of dissolution medium was

217 | P a g e
replaced. The collected samples of solution were filtered again with 0.45µ branded filter
paper and the filtrate after making the suitable dilution was assayed by HPLC (Taylor et
al., 2010).
5.3.7 Taste Evaluation Studies
a) Participants
The taste evaluation studies were carried out with the help of five volunteers. All the
volunteers participated in the taste evaluation were requested to taste the optimised
product thrice once a day continuously for three days.
b) Methodology of Evaluation:
Each volunteer has evaluated the taste of optimized formulation thrice. Each volunteer
cleansed their palate with water and the optimized formulation were kept for 30-60
seconds over the tongue applying some pressure and then disgorged completely and
rinsed out with water. The taste, after-taste sensation and other effects were evaluated on
a scale of 1±5. The taste scale was the immediate facial expression followed by the
responses upon tasting the chewable press coated tablets was observed and score was
given. Then the responses to the queries related to the taste of the chewable product in the
study were noted (Robert Cohen et al., 2009).
5.3.8 A short term stability study of the optimized Chewable Press Coated-
Tablets:
Stability testing was carried out to determine the quality of formulation under the
influence of temperature and humidity over time. The samples of optimized formulation
were placed in a controlled temperature and humidity cabinet. An accelerated term
stability study was conducted according to the ICH stability protocol, adopting 75%
relative humidity at a temperature of 40°C with the variation of five percent for humidity
and two percent for the temperature.

218 | P a g e
In order to study the stability of the optimized formulation, the representative samples
were sealed in aluminum foil and stored at room temperature conditions (silica gel to
control moisture content) and in a controlled temperature cabinet at 40°C (75% RH)
(silica gel to control moisture content). The physicochemical properties of these samples
were evaluated after three months (Tripartite guideline of ICH, 2003).
Table-62 Stability studies, storage conditions and duration of study (Tripartite guideline
of ICH, 2003).
Study Storage conditions Minimum time Period
Long –term 25°C and 60% RH Twelve months
Intermediate 30°C and 65% RH Six months
Short term 40°C and 75% RH Six months

219 | P a g e
5.4 RESULTS AND DISCUSSION
5.4.1 Pre-Formulation Studies
5.4.1(a) Melting point (M.P):
Melting point of ORL and VNF was found to be in with the range as per literature and
readings are given in below table.
Table-63 Melting Point Reading of Drugs ORL and Venlafaxine HCl
Name of Drug Observed M.P Reference M.P
ORL 46°C 45
°C - 48
°C
VNF Hcl 215°C 215
°C - 217
°C
Melting point is an initial test performed in the purity analysis of a drug substance during
the preformulation studies. In this study the melting point of ORL and VNF was found to
be in with the range of reference.
5.4.1(b) Solubility Test:
Solubility test for the ORL and VNF was conducted in distilled water, methanol and pH
buffers 1.2 and 6.8.
Table-64 Solubility of ORL in different solvents
S.No Solvent Solubility (gm/mL)
1 Water 0.0019
2 Methanol 0.0258
3 pH 1.2 buffer 0.0152
Table-65 Solubility of VNF in different solvents
S.No Solvent Solubility (gm/mL)
1 Water 0.564

220 | P a g e
2 Methanol 1.370
3 pH 1.2 buffer 0.580
4 pH 6.8 buffer 0.620
The most widely employed experimental method for solubility determination is by direct
determination by shake flask method in aqueous suspension (Abu Serajuddin T. M, et al.,
1999). ORL is a BCS class-II and therefore shown little solubility in different solvents.
Whereas the VNF is a BCS class-I and shown the very high solubility in all the solvent it
is tested.
5.4.1(c) Drug-Excipients Compatibility studies:
In the formulation of any dosage form drug-excipients and the excipients-excipients
compatibility determination is the most important requirement in the preformulation
study. Because, without confirming the drug-excipients and the excipients-excipients
compatibility the formulation of any dosage form cannot be proceeded further. In this
project the drug and excipients compatibility study was carried out by IR spectroscopy
(Donnell and Williams 2012). The IR spectra of the pure ORL and VNF and along with
the excipients are shown in the figures below.

221 | P a g e
Fig. 73 FTIR spectrum of ORL (Pure drug)
Fig. 74 FTIR spectrum of VNF(Pure drug)
Fig. 75 FTIR spectrum of ORL and Venlafaxine HCl

222 | P a g e
Fig. 76 FTIR spectrum of ORL with Excipients
Fig. 77 FTIR spectrum of VNF with Excipients

223 | P a g e
Fig. 78 FTIR spectrum of VNF with Excipients
The FT-IR spectra of the drugs and drugs in combination with other excipients were
recorded with ABB Bomen Series spectrophotometer over the region of 400 – 4000 cm-1
by adopting Potassium bromide disc containing the samples one percent prepared prior to
IR analysis at Sipra Labs, Hyderabad. Pure drug of ORL and VNF complies with the
reference samples and the combination of API with different excipients show no
deviation from pure drug. Hence there was no compatibility problem between API and
excipients. FTIR Spectrums of samples were shown in figures 73-78.
5.4.2 Analytical Methods Results
5.4.2.1 Determination of λmax of ORL by UV Spectroscopy:
UV scan was taken for ORL solution (100µg/ml) between 200- 400 nm. The UV
spectrum given in Figure indicated that the peak (λmax) was obtained at 210 nm. In the
literature, 205-210 nm wavelengths were reported. Wavelength of 210 nm was selected
for the analytical work.

224 | P a g e
Fig. 79 UV-spectrum of ORL
5.4.2.2 Standard Graph for ORL:
Standard curve of was obtained by taking the UV reading of concentrations versus
absorbance and plotting graphically. The coefficient of regresion equation was obtained.
Bear-Lambart’s law obeyed in the range from 10 to 160µg/ml. The regression coefficient
was found to be 0.999 both in methanol and water + 3% SLS respectively. The regresion
coefficient was used for the calculation of ORL content in core tablets and in-vitro
release studies.
Table-66 Standard graph data of ORL in Methanol
S.NO Concentration(µg/ml) Absorbance Std. Deviation
1 20 0.021 ±0.0043
2 40 0.052 ±0.0054
3 60 0.093 ±0.0047
4 80 0.135 ±0.0023
5 100 0.182 ±0.0035
6 120 0.223 ±0.0012
7 140 0.256 ±0.0023
210 nm

8
9
10
*The values are presented
Fig. 80 Standard graph for ORL in Methanol at 209 nm
A
B
S
160 0.302 ±0.0043
180 0.341 ±0.0021
200 0.385 ±0.0056
are presented as the mean ± SD, n=3
Standard graph for ORL in Methanol at 209 nm
225 | P a g e
±0.0043
±0.0021
±0.0056

Table-67 Standard graph
S.NO Concentration(µg/ml)
1
2
3
4
5
6
7
8
9
10
*The values are presented
Fig. 81 Standard Graph of ORL in Water + 3% SLS
A
B
S
Standard graph data of ORL in Water + 3% SLS
Concentration(µg/ml) Absorbance Std. Deviation
20 0.024 ±0.0047
40 0.061 ±0.0058
60 0.097 ±0.0054
80 0.137 ±0.0023
100 0.184 ±0.0039
120 0.227 ±0.0021
140 0.269 ±0.0023
160 0.302 ±0.0034
180 0.347 ±0.0054
200 0.381 ±0.0054
are presented as the mean ± SD, n=3
Standard Graph of ORL in Water + 3% SLS
Conc. (µg/ml)
226 | P a g e
Std. Deviation
±0.0047
±0.0058
±0.0054
±0.0023
±0.0039
±0.0021
±0.0023
±0.0034
±0.0054
±0.0054

227 | P a g e
Analytical Method for VNF HCl
5.4.2.3 Determination of λ max of VNF by UV Spectroscopy:
UV scan was taken for VNF solution (100 µg/mL) between 200-400 nm. The UV spectrum given
in Figure 82 indicated that the peak (λ max) was obtained at 225. In the literature, 224 nm
wavelength was reported in the literature. Wavelength of 225 nm was selected for the analytical
work.
Fig. 82 UV-Spectrum of Venlafaxine HCl
5.4.2.4 Standard graph for VNF:
Standerd graph was obtaine between concentretion and absarbance (Fig. 83). Regression equation was
obtaine. Bear-Lambart’s law obeyed in the range from 5 to 25 µg/mL. The regression coefficient was
found to be 0.9994, 0.9994 and 0.9992 in methanol, pH 1.2 buffer and pH 6.8 buffer respectively. The
regression equation was used for the estimation of VNF in the mini-tablets and in vitro release studies.
The results are given in the below tables.

Table-68 Standard graph data for
S.No Conc.(µg/mL)
1 5
2 10
3 15
4 20
5 25
*The values are presented as the
Fig.
Standard graph data for VNFin methanol
Abs
0.168±0.022
0.325±0.031
0.502±0.024
0.651±0.071
0.828±0.054
as the mean ± SD, n=3
Fig. 83 Standard graph for VNF in methanol
228 | P a g e

Table-69 Standard graph data for
S.No Conc.(µg/mL)
1 5
2 10
3 15
4 20
5 25
*The values are presented as the
Fig. 84 Standard graph for
0
0.1
0.2
0.3
0.4
0.5
0.6
0.7
0.8
0.9
1
0 5
Ab
s.
VNF Std. graph in Dist. Water
Standard graph data for VNF in Dist. Water
Abs
0.17±0.016
0.334±0.022
0.53±0.041
0.701±0.036
0.872±0.054
as the mean ± SD, n=3
Standard graph for VNF in Dist. Water
10 15 20 25 30
Conc.(µg/ml)
VNF Std. graph in Dist. Water
229 | P a g e

Table-70 Standard graph data for
S.No Conc.(µg/mL)
1 5
2 10
3 15
4 20
5 25
*The values are presented
Fig.
Standard graph data for VNFin pH 6.8 buffer
(µg/mL) Abs
0.157±0.024
0.328±0.031
0.49±0.0121
0.67±0.026
0.816±0.038
are presented as the mean ± SD, n=3
Fig. 85 Standard graph for VNF in pH 6.8 buffer
230 | P a g e

231 | P a g e
5.4.2.3 HPLC Method Development for ORL and VNF
For the simultaneous estimation of ORL and VNF Hcl. HPLC method was developed and
validated. The combined Chromatograph was obtained as shown in below figure.
Fig. 86 HPLC Chromatograph of ORL and VNF
The HPLC chromatographic parameters used to develop the method by reverse phase
were by taking the HPLC Perkin Elmer system having total chrome software. The
column used was Lichrospher® 100RP-18e (5µm) and the mobile phase used was ACN
and pH 03 phosphare buffer in the ratio of 95:5 flowing rate was 1.2 ml/min. with a run
time of twelve minutes. At these parameters the developed and optimised HPLC method
for simultaneous estimation of VNF and ORL was eluting at 5.5 mins. and 9.2 mins
respectively. A very good baseline and resolution with sharp peaks without tailing was
obtained as shown in the figure 86.

232 | P a g e
5.4.2.3.1 Linearity Standard Graph of VNF HCL and ORL
Fig. 87 Linearity graph for VNF HCL and ORL
For obtaining the linerity standerd graphs of ORL and VNF Hcl. calibretion curves were
build by using thirteen series of standerd ORL solutions of 01 to 200µg/ml and thirteen
series of standerd VNF Hcl. solution betwn the conc. of 0.1-20 µg/ml. The linerity
standerd graphs of ORL and VNF Hcl. are shown in the figure 87. The linerity of the
calibretion curves was validated by the high value of the correlation coefficient.
5.4.2.3.2 Standard Graph of ORL BY HPLC:
Standard graph was plotted between concantraeion and peak size. Regresion eqation was
obtained. Linearity was found to be 20 to 200µg/ml. The R.C was (0.9998). The
regresion equation was used for the estimation of ORL in the formulation and in-vitro
release studies. The results are given in the table.
0.0 0.5 1.0 1.5 2.0 2.5 3.0 3.5 4.0 4.5 5.0 5.5 6.0 6.5 7.0 7.5 8.0 8.5 9.0 9.5 10.0 10.5 11.0 11.5 12.0 12.5 13.0 13.5 14.0 14.5
VNF HCL
ORL

Table-71 Standard graph data for ORL by HPLC
S.NO Concentration(µg/ml)
1
2
3
4
5
6
7
8
9
10
11
12
13
*The values are presented
P
E
A
K
A
R
E
A
Standard graph data for ORL by HPLC
Concentration(µg/ml) Peak Area Std. Deviation
1 1670 ±0.0034
5 8352 ±0.0058
10 13684 ±0.0042
20 31522 ±0.0034
40 62372 ±0.0054
60 97587 ±0.0034
80 130500 ±0.0053
100 162919 ±0.0051
120 195238 ±0.0058
140 227843 ±0.0054
160 257843 ±0.0033
180 292190 ±0.0042
200 322111 ±0.0054
are presented as the mean ± SD, n=3
Conc. (µg/ml)
233 | P a g e
Std. Deviation
±0.0034
±0.0058
±0.0042
±0.0034
±0.0054
±0.0034
±0.0053
±0.0051
±0.0058
±0.0054
±0.0033
±0.0042
±0.0054

Fig. 88 ORL Standard graph by HPLC
5.4.2.3.3 Standard Graph for VNF HCL BY HPLC:
Standerd graph was obtaine between concentretion and peak size.
obtained. Linerity was found to be 0.1 to 20µg/ml.
eqation was found for the estimation of VNF Hcl. The results were given in table.
Table-72 Standard graph data for VNF by HPLC
S.NO Concentration(µg/ml)
1
2
3
4
5
6
7
8
*The values are presented
ORL Standard graph by HPLC
Graph for VNF HCL BY HPLC:
obtaine between concentretion and peak size. Regresion eq
obtained. Linerity was found to be 0.1 to 20µg/ml. R.C was good (0.9999).The
was found for the estimation of VNF Hcl. The results were given in table.
Standard graph data for VNF by HPLC
Concentration(µg/ml) Peak Area Std. Deviation
10 310231 ±0.0018
20 557960 ±0.0029
30 820476 ±0.00
40 1301612 ±0.00
50 1479213 ±0.00
60 1840465 ±0.00
70 2237781 ±0.00
80 3107641 ±0.00
are presented as the mean ± SD, n=3
Fig. 89 VNFStandard Graph by HPLC
234 | P a g e
Regresion eqation was
(0.9999).The regresion
was found for the estimation of VNF Hcl. The results were given in table.
Std. Deviation
±0.0018
±0.0029
±0.0045
±0.0028
±0.0039
±0.0043
±0.0017
±0.0031

235 | P a g e
5.4.2.4 Validation of ORL and VNF HCL HPLC Method developed:
5.4.2.4 (a) Accuracy:
Accuracy it is the measure of knowing correctness of the analytical method.
Accuracy is generally detarmined by putting the known qty. of analyte to a blank and the
percent which is recovered is considered as established. The accuracy validation of ORL
and VNF is given in the table-73.
Table-73 Accuracy studies of ORL and VNF Hcl in the formulation
S.
No
Standard
concentratio
n
(µg/ml)
Formulation
concentratio
n
(µg/ml)
Standard+
formulation
Peak area
Formulation
Peak area Recovery (%)
VNFHcl ORL VNF Hcl ORL VNF
Hcl
OR
L
1. 8+80 10+100 1085338.54 293256. 605400.54 162756. 98.17 98.
2. 10+100 10+100 1210236.08 321982. 603458.08 159063. 99.85 98.
3. 12+120 10+100 1329291.84 349065. 599662.84 163827. 99.22 98.
5.4.2.4 (b) Precision:
The precision is the detarmination of how much exact is an analytical method. It is
therefore the extent of the coefficient of correlation between a series of analytical
measurements obtained from the no. of sampling of the same single sample under the
standard procedures. The precision of analytical quntification is expressed as the
variability in standerd deviation, coefficient of veriation in the series of analytical
measurements. The percision validation of ORL and VNF is given in the table-74.

236 | P a g e
5.4.2.4 (c) Intra-Day Precision – VNF HCL & ORL
Fig. 90 Precision of VNF Hcl & ORL
5.4.2.4 (d) Intra-Day Precision of ORL (120µg/ml) & VNFHcl (12µg/ml):
Fig. 91 Precision of ORL (120µg/ml) & VNFHcl (12µg/ml)
5.4.2.4 (e) System Suitability Testing.
System suitability is a set of pre determined parameters that are set to assure that the total
method of analyzing and chromatographic system are functional prior to acceptance of
0.0 0.5 1.0 1.5 2.0 2.5 3.0 3.5 4.0 4.5 5.0 5.5 6.0 6.5 7.0 7.5 8.0 8.5 9.0 9.5 10.0 10.5 11.0 11.5 12.0 12.5 13.0 13.5 14.0 14.5
0.0 0.5 1.0 1.5 2.0 2.5 3.0 3.5 4.0 4.5 5.0 5.5 6.0 6.5 7.0 7.5 8.0 8.5 9.0 9.5 10.0 10.5 11.0 11.5 12.0 12.5 13.0 13.5 14.0 14.5
VNF Hcl
ORL
VNF Hcl
ORL

237 | P a g e
any analytical result are obtained. However, system suitability test parametrs depends on
the type of procedure being validated.
The system suitability testing results are shown in the figure 92.
Fig. 92 System Suitability Parameters
5.4.2.4 (f) Robustness evaluation of the developed HPLC Method
is as the validation parameter that is accountable for the reproducibility of the analytical
method under the ambient conditions. Robustness is evaluated by detrmining percision
with two analysts on different instrarments on other days. Robustness may include
stability of solutions and evaluating the quality of columns purchased from different
vendors.
The results of Robustness of the ORL and VNF are shown in the figure 93.
-1.05
3.95
8.95
13.95
18.95
23.95
28.95
33.95
38.95
0.0 0.5 1.0 1.5 2.0 2.5 3.0 3.5 4.0 4.5 5.0 5.5 6.0 6.5 7.0 7.5 8.0 8.5 9.0 9.5 10.0 10.5 11.0 11.5 12.0 12.5 13.0 13.5 14.0 14.5
VNF HCL
ORL

238 | P a g e
Fig. 93 Robustness data peaks by varying the flow
5.4.2.5 Solubility Results of ORL-PM and ORL β-CD complex
ORL is a very low aqueus soluble drug and therefore has very low systemic availability.
But this API does not require high availability in plasmas as it shows action locally.
However, irrespective of the site of action a high solubility of drug is recommended for
the maximum and rapid libration of the drug from the dosage form or drug delivery
system. Therefore aqueous sodium chloride solution containing three percent of sodum
laryl salphate is recommended and used as the dissolution medium (A. Dolenc et al.,
2010).
ORL is hydrophobic drug with very low aqueous solubility. Therefore to enhance the
solubility different strategies are applied. Solubility study of the pure ORL and ORL+β-
CD complex was carried out. The solubility study in distilled water was carried out
following the standard shake flask method.
0.0 0.5 1.0 1.5 2.0 2.5 3.0 3.5 4.0 4.5 5.0 5.5 6.0 6.5 7.0 7.5 8.0 8.5 9.0 9.5 10.0 10.5 11.0 11.5 12.0 12.5 13.0 13.5 14.0 14.5
VNF HCL
ORL

Fig. 94 Solubility of ORL
In that study ORL-βCD complex in the ratio of (1:2M)
solubility from 1.8mg/ml to 8.9mg/ml
bulky to prepare the inner core tablet weighing
5.4.2.6 Evaluation of VNF+Eudragit EPO Microparticles:
Microspheres or microparticles of bitter drugs using the
effectively to mask the bitter taste of the active pharmaceutical ingredients in
combination with the flavoring of tablets. Based on
prepared using the eudragit
active drugs and can be incorporated in the chewable disintegrating tablets
2008, HLou et al., 2013). Therefore in this project the VNF taste masking by the
microencapsulation using the
various evaluations of VNF +
5.4.2.6 (a) FTIR Spectroscopy Analysis of the VNF Microparticles and
comparision with the pure VNF IR Spectra.
To ensure the compatibility of VNF with the
was carried and the IR spectra of VNF pure drug is compared with mixture blend of
+eudragit-EPO in the ratio of (1:1). The comparative spectra is shown in the figure 97
Solubility of ORL-Pure, ORL-βCD (PM) and ORL-βCD-Complex
βCD complex in the ratio of (1:2M) was found to increase the
solubility from 1.8mg/ml to 8.9mg/ml shown in the figure 94. In addition
r core tablet weighing.
Evaluation of VNF+Eudragit EPO Microparticles:
or microparticles of bitter drugs using the eudragit-EPO have
mask the bitter taste of the active pharmaceutical ingredients in
combination with the flavoring of tablets. Based on various results, microsp
udragit-EPO proven to satisfactorily cover the bitter taste of the
an be incorporated in the chewable disintegrating tablets
HLou et al., 2013). Therefore in this project the VNF taste masking by the
microencapsulation using the eudragit-EPO was found suitable and effective.
VNF +eudragit-EPO microparticles carried out are shown below.
FTIR Spectroscopy Analysis of the VNF Microparticles and
comparision with the pure VNF IR Spectra.
To ensure the compatibility of VNF with the eudragit-EPO FT-IR spectroscopic analysis
was carried and the IR spectra of VNF pure drug is compared with mixture blend of
EPO in the ratio of (1:1). The comparative spectra is shown in the figure 97
239 | P a g e
Complex
was found to increase the
shown in the figure 94. In addition it was less
EPO have proven
mask the bitter taste of the active pharmaceutical ingredients in
results, microsparticles
the bitter taste of the
an be incorporated in the chewable disintegrating tablets (J. Xu et al.,
HLou et al., 2013). Therefore in this project the VNF taste masking by the
found suitable and effective. And the
carried out are shown below.
FTIR Spectroscopy Analysis of the VNF Microparticles and
IR spectroscopic analysis
was carried and the IR spectra of VNF pure drug is compared with mixture blend of VNF
EPO in the ratio of (1:1). The comparative spectra is shown in the figure 97

240 | P a g e
and from the comparison spectra no change is observed and VNF with the eudragit-EPO
seem to compatibile.
Fig. 97 IR Spectra of Pure VNF and VNF Microparticles
5.4.2.6 (b) Scanning Electron Microscope (SEM) Analysis of the VNF
Microparticles
The evaluation of the VNF+Eudragit EPO (1:3) Microparticles was done by Scanning
Electron Microscope (SEM). The prepared microparticles were free flowing spherical
microspheres in the size range of 200µm to 500µm as shown in the figure 96. The
prepared and optimized microparticles by emulsification solvent evaporation have
obtained in high percentage yield with good percentage entrapment efficiency and
masking the bitter taste of VNF Hcl. satisfactorily. The VNF+Eudragit EPO SEM
morphological characteristics are depicted in the figure 96.

241 | P a g e
Fig. 96 SEM of VNF Microparticles
5.4.3 Pre-Compression Evaluations Results:
In the manufacture of any solid PDF the flow charasterics of the powders play a very
vital role. Therefore proper blend mixing of the different formulation is the perquisite for
the good manufacturing of all solid PDFs. Another critical step in the manufacture of all
solid dosage forms is the processing of blending or mixing the powder is carried out. In
assessing the quality of the mixture blend, the method of sampling is more important
(Peter Davies 2009). The pre-compression core tablet formulations powder flow
properties results is shown in the table-76.

242 | P a g e
Table-76 Pre-Compression Evaluations of lubricated blend of ORL Inner core Tablet
formulations
Formula
tion
Batch
no A.R (α) B.D(gm/ml) T.D(gm/ml) C.I(%) H.R
ORC-1 F1 36.120 0.596 0.713 16.41 1.20
ORC-2 F2 41.230 0.668 0.863 22.60 1.29
ORC-3 F3 36.210 0.664 0.832 20.19 1.25
ORC-4 F4 35.890 0.581 0.721 19.42 1.24
ORC-5 F5 31.230 0.593 0.672 11.76 1.13
OGC-6 F6 32.460 0.563 0.653 13.78 1.16
Table-77 Pre-Compression Evaluations of lubricated blend of VNF Outer coat layers
formulations
Formula
tion
Batch
no A.R (α) B.D(gm/ml) T.D(gm/ml) C.I(%) H.R
PCT1 F1 36.120 0.596 0.713 16.41 1.20
PCT 2 F2 41.230 0.668 0.863 22.60 1.29
PCT 3 F3 36.210 0.664 0.832 20.19 1.25
PCT 4 F4 35.890 0.581 0.721 19.42 1.24
PCT 5 F5 31.230 0.593 0.672 11.76 1.13
PCT 6 F6 32.460 0.563 0.653 13.78 1.16
The pre-compression core tablet and lubricated blend of VNF Outer coat layers
formulations powder flow properties results is shown in the table-76 and 77. The results
delinate that all the farmulation powder blends have the good flow properties.

243 | P a g e
5.4.4 Post-compression Evaluation of the Chewable Core tablet and the Press
Coated Tablets:
The post compression evaluation of the orodispersible ORL core tablets different
formulations was completed in the lab and the results are shown in the table-78.
Table-78 Properties of the ORL Core Tablet Formulations
Formulation Weight
Variation
(mg)
Hardness
(kg/cm2)
Thickness
(mm)
Friability
(%)
Disintegration
(Mins.)
Content
Uniformity
(%)
ORC-1 200.9±1.78 3.1±0.51 3.3±0.08 0.95±0.046 2.49±0.22 98.7±0.52
ORC-2 200.3±1.35 3.3±0.64 3.2±0.06 0.92±0.022 1.95±0.21 101.8±0.32
ORC-3 200.9±1.12 3.5±0.41 3.2±0.02 0.96±0.058 2.23±0.61 100.3±0.21
ORC-4 199.7±1.54 3.4±0.53 3.3±0.04 0.97±0.078 2.51±0.74 98.7±0.80
ORC-5 202.1±1.62 3.6±0.31 3.1±0.08 0.95±0.046 2.44±0.57 99.5±0.69
OGC-6 201.8±1.71 3.7±0.89 3.0±0.05 0.98±0.019 2.24±0.23 98.3±0.34
*The values are presented as the mean ± SD, n=3
Compressed orodispersible ORL core tablets six formulations physicochemical
properties were evaluated and have been found to be within the standard limits. The in
vitro disintigration time of core tablets was tested by applying a slight modified method
explained by Chaudhari S. P.et.al. Disintigrating time was tested in a petri dish
containing dissolution media as explained in methodology and observed visually by
taking images of the core tablets at the specific time intervals as shown in the figure 97.
Fig. 97 Disintegrating Pattern of ORL Inner core Optimized formulation (ORC-2)

244 | P a g e
In the disintigrating test of the ORC-2 innner core orodispersible tablets of ORL the
tablet seen initially wetting and as the more water penetrate inside the tablet rapid
disintegrating is observed within in two minutes. The reason for this fast disintegration of
ORC-2 innner core orodisparsible tablets could be due to ORL solubility was enhanced
by preparing and optimizing a inclusion complex with the β-cyclodextrin in (1;2M) ratio
and secondly, the incorporation of novel coprocessed super disintegrants from BASF-
Ludiflash. Thirdly the addition of two percent SLS in the dosage form. Further six
formulations of ORL innner core orodispersible tablets ORC-1-6 in-vitro dissolution
study was done in the lab and the results are shown in the table-79 and figure 99.
Table-79 Drug Release Profile of Six Formulations of ORL Inner core (ORC 1-6)
Time
(Mins)
ORC_1
(%)
ORC_2
(%)
ORC_3
(%)
ORC_4
(%)
ORC_5
(%)
ORC_6
(%)
0 0 0 0 0 0 0
2 17.37 21.23 14.36 10.68 16.67 13.56
4 32.1 35.67 16.6 17.31 26.78 27.89
6 49.67 48.89 46.89 43.24 45.64 51.62
8 67.89 54.78 63.33 55.81 55.7 71.7
10 82.67 87.89 79.09 69.92 73.62 83.72
15 90.65 96.78 94.78 76.73 84.21 89.21
30 97.34 101.65 99.65 84.65 92.65 96.65

Fig. 98 Drug Release Profile of
And based on the in-vitro dissolution study results
innner core orodispersible tablets. ORC
was disintegrating in the initial
percent of ORL within first
In one study where the β
shown to reduce the wetting time required and
another study in which
formulation of the fast disintegrating table
rapidly. And also the tablets were
hardness. Further, taking
were tried. The results obtained
are shown in the below tablets
Drug Release Profile of Six Formulations of ORL Inner core (ORC 1
vitro dissolution study results of six (ORC-1-6) formulations of ORL
innner core orodispersible tablets. ORC-2 was chosen as the optimised formulation as it
in the initial two minutes and also was releasing the nearly
first ten minutes.
In one study where the β-cyclodextrin was incorporated more than fifty percent
the wetting time required and also enhanced the rate of
in which novel coprocessed excipient of BASF was
the fast disintegrating tablet was shown to be release
tablets were of good quality having shiny surface with enough
Further, taking the dummy core tablet, six formulation trials of coating layers
obtained of all the six chewable press coated tablets
below tablets 80-81 and figures 99 and100.
245 | P a g e
nner core (ORC 1-6)
formulations of ORL
2 was chosen as the optimised formulation as it
also was releasing the nearly ninty
more than fifty percent was
disintegration. In
was utilized in the
release the drug very
quality having shiny surface with enough
, six formulation trials of coating layers
tablets formulations
246 | P a g e
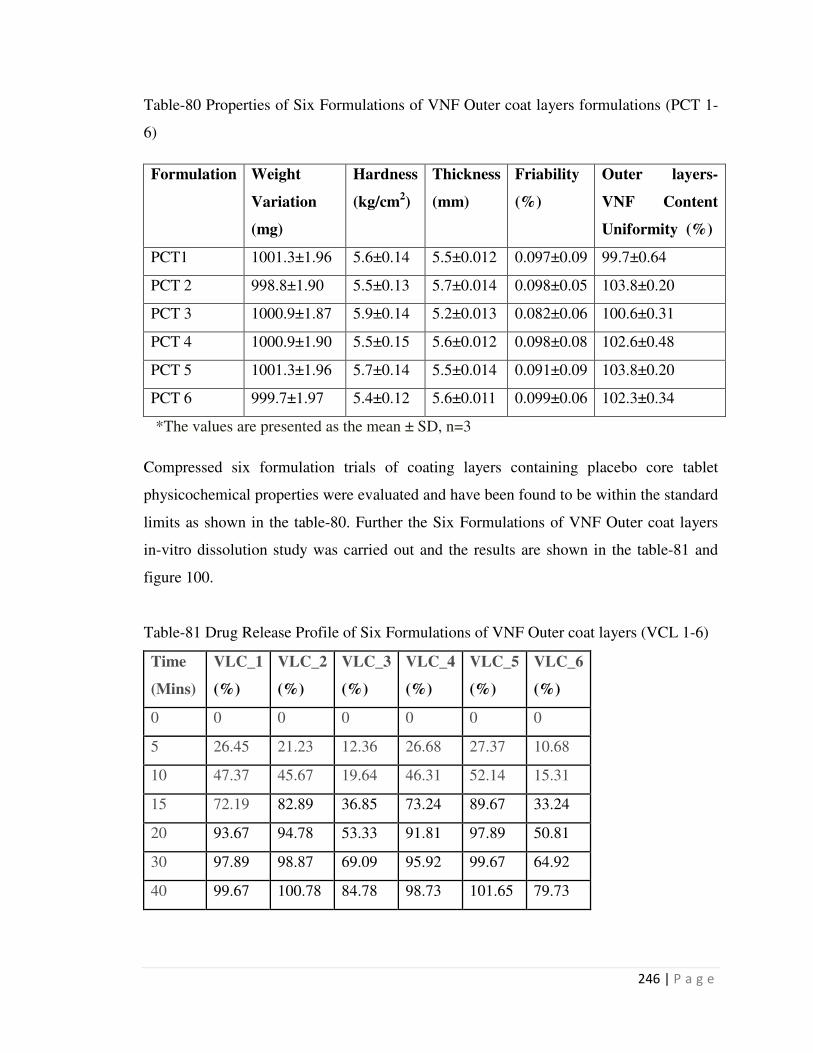
Table-80 Properties of Six Formulations of VNF Outer coat layers formulations (PCT 1-
6)
Formulation Weight
Variation
(mg)
Hardness
(kg/cm2)
Thickness
(mm)
Friability
(%)
Outer layers-
VNF Content
Uniformity (%)
PCT1 1001.3±1.96 5.6±0.14 5.5±0.012 0.097±0.09 99.7±0.64
PCT 2 998.8±1.90 5.5±0.13 5.7±0.014 0.098±0.05 103.8±0.20
PCT 3 1000.9±1.87 5.9±0.14 5.2±0.013 0.082±0.06 100.6±0.31
PCT 4 1000.9±1.90 5.5±0.15 5.6±0.012 0.098±0.08 102.6±0.48
PCT 5 1001.3±1.96 5.7±0.14 5.5±0.014 0.091±0.09 103.8±0.20
PCT 6 999.7±1.97 5.4±0.12 5.6±0.011 0.099±0.06 102.3±0.34
*The values are presented as the mean ± SD, n=3
Compressed six formulation trials of coating layers containing placebo core tablet
physicochemical properties were evaluated and have been found to be within the standard
limits as shown in the table-80. Further the Six Formulations of VNF Outer coat layers
in-vitro dissolution study was carried out and the results are shown in the table-81 and
figure 100.
Table-81 Drug Release Profile of Six Formulations of VNF Outer coat layers (VCL 1-6)
Time
(Mins)
VLC_1
(%)
VLC_2
(%)
VLC_3
(%)
VLC_4
(%)
VLC_5
(%)
VLC_6
(%)
0 0 0 0 0 0 0
5 26.45 21.23 12.36 26.68 27.37 10.68
10 47.37 45.67 19.64 46.31 52.14 15.31
15 72.19 82.89 36.85 73.24 89.67 33.24
20 93.67 94.78 53.33 91.81 97.89 50.81
30 97.89 98.87 69.09 95.92 99.67 64.92
40 99.67 100.78 84.78 98.73 101.65 79.73

Fig. 99 Drug Release Profile of
From all the results obtained
optimised formulation.
optimised formulation of
the bilayer compression equipment made by Rimek Karnavathi
evaluation of (OPCT) formulation
standard limits that are shown in the
Table-82 Properties of the optimized
Inner core and VLF-5 Outer layers
Formulation Weight
Variation
(mg)
OPCT 1001.4±1.
93
*The values are presented
Drug Release Profile of Six Formulations of VNF Outer coat layers (VCL 1
results obtained VLC-5 outer coat layer formulation was
Then, taking ORC-2 inner core and VLC-5
optimised formulation of chewable press coated tablets (OPCT) were compressed
the bilayer compression equipment made by Rimek Karnavathi. The physico
formulation was carried out and the results were w
are shown in the table-82.
Properties of the optimized chewable press coated tablets
5 Outer layers
Hardness
(kg/cm2)
Thickness
(mm)
Friability
(%)
ORL-Core
Tablet Content
Uniformity
(%)
5.7±0.16 5.6±0.016 0.097±0.0
8
99.7±0.65
are presented as the mean ± SD, n=3
247 | P a g e
uter coat layers (VCL 1-6)
formulation was delineated as the
5outer layer, the
(OPCT) were compressed using
physico-chemical
he results were within the
(OPCT); ORC-2
Core
Tablet Content
Uniformity
VNF-Outer
layers Content
Uniformity
(%)
99.7±0.65 102.7±0.23

Further the in-vitro dissolution study of the ORL and VNF o
Formulation (OPCT) was carried out and the drugs release profiles are show
table-83 and figure 100.
Table-83 Drug Release Profile of
Time
(Mins)
VLC-5
(%)
ORC
(%)
0 0 0
5 27.37 7.43
10 57.21 45.67
15 92.67 86.89
20 99.89 97.78
25 100.67 99.89
30 103.65 100.78
Fig. 100 Drug Release Profile of
ORC-2 Core press coated with
dissolution study of the ORL and VNF optimized
Formulation (OPCT) was carried out and the drugs release profiles are show
Drug Release Profile of optimized Press Coated Formulation (OPCT)
ORC-2
(%)
7.43
45.67
86.89
97.78
99.89
100.78
Drug Release Profile of Optimized Press Coated tablets Formulation (OPCT);
press coated with VLC-5 Outer layers
248 | P a g e
ptimized Press Coated
Formulation (OPCT) was carried out and the drugs release profiles are shown in the
ptimized Press Coated Formulation (OPCT)
Formulation (OPCT);

The optimized chewable press coated tablets of ORL and VNF
release study was done and the result found that the both the drugs
releasing very rapidly within first fifteen minutes nearly ninty percent as show
83 and figure-100 respectively. When we compare the release of both drugs from the
optimized (OPCT) formulation it seems that the ORL will have a lag period of around
five to ten minutes. This delay in the release of ORL from the
(OPCT) is surely due to the outer coating layers of VNF.
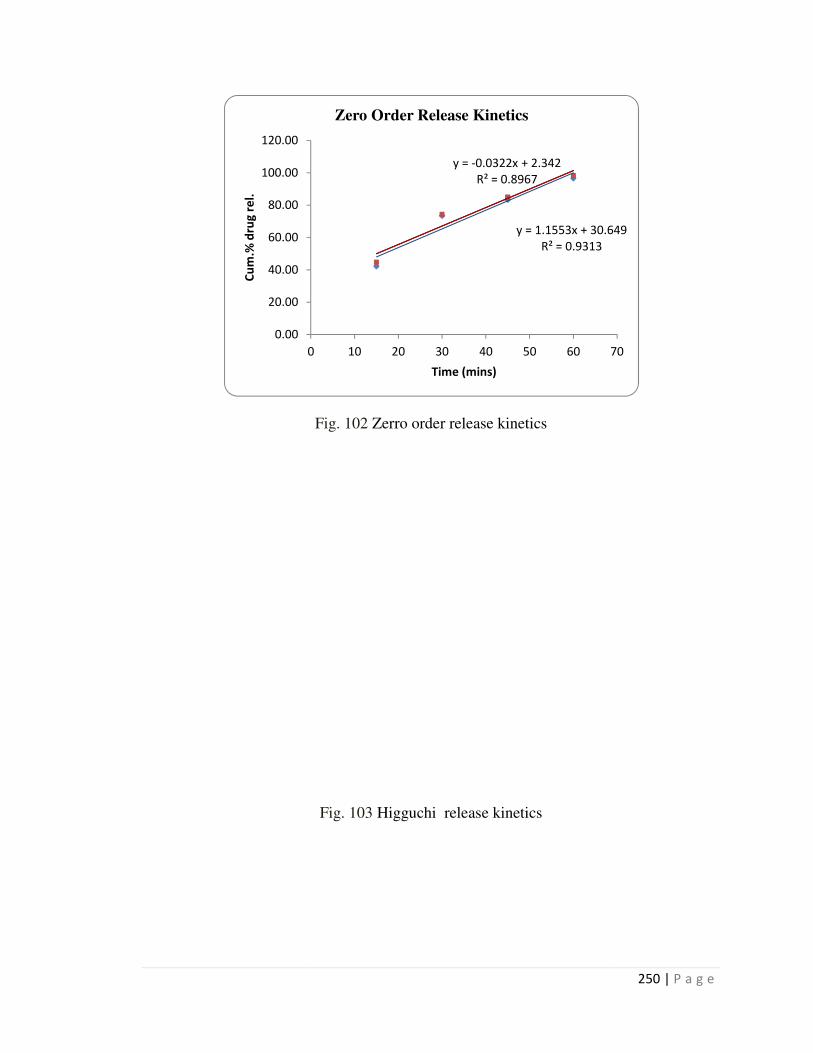
5.4.5 Application of Different Kinetic Models to the In
Optimized Press Coated Tablet
The optimized chewable press coated tablets of ORL and VNF (OPCT), in the lab drug
release study was done and the result found that the both the drugs ORL and
releasing very rapidly within first fifteen minutes nearly ninty percent as show
100 respectively. When we compare the release of both drugs from the
(OPCT) formulation it seems that the ORL will have a lag period of around
five to ten minutes. This delay in the release of ORL from the optimized chew
(OPCT) is surely due to the outer coating layers of VNF.
Application of Different Kinetic Models to the In-Vitro Drug Release of
Tablet Formulation (OPCT):
Fig. 101 Firrst order release kinetics
249 | P a g e
(OPCT), in the lab drug
ORL and VNF were
releasing very rapidly within first fifteen minutes nearly ninty percent as shown in tablet-
100 respectively. When we compare the release of both drugs from the
(OPCT) formulation it seems that the ORL will have a lag period of around
optimized chewable
Vitro Drug Release of
0.00
20.00
40.00
60.00
80.00
100.00
120.00
Cu
m.%
dru
g r
el.
Fig. 102 Zerro order release kinetics
Fig. 103 Higguchi release kinetics
y = 1.1553x + 30.649
R² = 0.9313
y = -0.0322x + 2.342
R² = 0.8967
0 10 20 30 40 50 60
Time (mins)
Zero Order Release Kinetics
250 | P a g e
y = 1.1553x + 30.649
70

5.4.6 Taste Evaluation of Optimized
ORL and VNF
Taste masking of an active pharmaceutical ingredient is an art and science,
development of any chewable tablet dosage form. There are many techniques to mask the
bitter or bad taste of the drug in the chewable oral products like, microencapsulation,
solid dispersion, inclusion Complexation, ion
binders, addition of bitterness inhibitors and prodrug approaches etc.
Khar, 2004).
ORL is has not having a bad taste, but it is very hygroscopic and slight waxy
hydrophobic drug. Therefore to reduce the stickiness and enhance
complexation with β-cyclodextrins
CD (1;2M) ratio was found to be more feasible in enhancing both the stability and
reducing the stickiness of the ORL.
Fig. 104 Taste Evaluation of
But, VNF is a very bitter tasting drug therefore different strategies of taste masking like
solid dispersion using Mannitol in different ratios and microencapsulation
EPO in different molar ratio were tried.
the microencapsulation technique using the
Taste Evaluation of Optimized Chewable Press Coated Tablets Formulation
Taste masking of an active pharmaceutical ingredient is an art and science,
development of any chewable tablet dosage form. There are many techniques to mask the
bitter or bad taste of the drug in the chewable oral products like, microencapsulation,
solid dispersion, inclusion Complexation, ion-exchange, granulation using t
binders, addition of bitterness inhibitors and prodrug approaches etc. (Sohi, Sultana, and
ORL is has not having a bad taste, but it is very hygroscopic and slight waxy
hydrophobic drug. Therefore to reduce the stickiness and enhance
cyclodextrins in different molar ratios was tried and the ORL and
was found to be more feasible in enhancing both the stability and
reducing the stickiness of the ORL.
Taste Evaluation of Optimized Formulation (OPCT), on a scale of five
But, VNF is a very bitter tasting drug therefore different strategies of taste masking like
solid dispersion using Mannitol in different ratios and microencapsulation
ratio were tried. Among these methods the VNF taste masking by
the microencapsulation technique using the eudragit-EPO in the one is to three
251 | P a g e
Press Coated Tablets Formulation of
Taste masking of an active pharmaceutical ingredient is an art and science, in the
development of any chewable tablet dosage form. There are many techniques to mask the
bitter or bad taste of the drug in the chewable oral products like, microencapsulation,
exchange, granulation using the inert
(Sohi, Sultana, and
ORL is has not having a bad taste, but it is very hygroscopic and slight waxy
hydrophobic drug. Therefore to reduce the stickiness and enhance the stability
in different molar ratios was tried and the ORL and β-
was found to be more feasible in enhancing both the stability and
Optimized Formulation (OPCT), on a scale of five
But, VNF is a very bitter tasting drug therefore different strategies of taste masking like
solid dispersion using Mannitol in different ratios and microencapsulation using eudragit
VNF taste masking by
one is to three molar

252 | P a g e
ratio has been proven to be appreciably masking the bad taste. The taste evaluation
results of the optimized (OPCT) are shown in the figure 104.
The taste evaluation studies were carried out with the help of five volunteers. All the
volunteers participated in the taste evaluation were requested to taste the optimised
product thrice once a day continuously for three days. The optimized chewable press
coated tablets of ORL and VNF (OPCT), were kept for sixty seconds over the tongue
applying some pressure and then disgorged completely and rinsed out with water. The
taste, after-taste sensation and other effects were evaluated on a scale of 1±5 (Robert
Cohen et al., 2009).

253 | P a g e
5.4.7 Stability Results of the Optimized Chewable Press Coated Tablets Formulation of
ORL and VNF
Table-84 Stability Study of the Optimized Chewable Optimized Press Coated
Formulation (OPCT)
Parameters 30 days After 60 days After 90 days After
Physical
Appearance
No Change No Change No Change
Weight Variation
(mg)
1002±0.39 1004±0.76 1006±0.94
Hardness
(Kg/cm2)
5.7±0.25 5.6±0.51 5.5±0.36
Friability (%) 0.19±0.43 0.37±0.52 0.41±0.51
Drug Content
(%)
99.37±0.46 (ORL)
101.5±0.61 (VNF)
98.47±0.34 (ORL)
100.9±0.83 (VNF)
97.45±0.66 (ORL)
100.2±0.79 (VNF)
The Stability study of the optimised formulation (OPCT) was carried out for 90 days,
following the short term accelerated stability testing ICH guidelines. The short term
stability study protocol, 40°C±2°C/75%RH±5% RH was followed. The optimised
formulation (OPCT) has shown no changes in the physical appearance and physical and
chemical characteristics. There were very slight changes in all the parameters evaluated
more importantly the uniformity of drug content and disintigration test performed during
the stability study evaluated at an intarvel of thirty days. The results of short term
accelerated stability study all the results shown in the table above were within the
acceptable limits.

254 | P a g e
5.5 CONCLUSION:
Obesity the fast growing epidemic is caused due to increased calorie intake without doing
enough physical activity (B. Rospond et al., 2015). Once obesity develops in a person, it
causes a lot of physical, medical and psychological problems. Especially the parvalence
of psychological distress or depression is seen among obese individuals. And the obese
patients with depression are usually accompanied by bing eting disorder (JA Linde et al.,
2004, F.S. Luppino et al., 2010). It is proven clinically that the bing eting is triggered by
psychological distress. Many studies have showed that the food carving is correlated to
excessive eating in BED and it is not because of hunger or deficiency of calories
(Longena Ng and C. Davis 2013). Therefore, it is necessary to emphasis on the
management of bing eting disorder as part of weight management strategy. Because,
treating the psychological distress in obese patients will not only helps in controlling the
binge or excessive eating pattern but, also controls and reduces the weight (Michael J.
Devlin, 2001, Pokrajac-Bulian et al., 2013). The parpose was to prepare a chewable press
coated tablets of ORL an anti-obesity drug and VNF an antidepressant drug also
prescribed for bing eting disorder. The parposed chewable dosage form was aimed at
improving patient compliance treatment of obese bing eaters with psychological distress.
In this PDF development ORL complexed with β-CD in one is to two molar ration
complex containing equivalent to 60mg ORL is taken and dispersible core tablets is
prepared and optimized as kept aside for using in the compressed coating. Next the VNF
a bitter antidepressant drug is turned into palatable microparticles with Eudragit EPO in
the ratio of one is to three, which was found to covering the bad taste of VNF quite
satisfactorily. Then taking the dispersible core tablet of ORL 60mg prepared earlier they
are press coated with VNF microparticles containing the VNF equivalent to 75mg. To
achieve the optimized formulation six formulation tarils of each ORL dispersible core
tablet and the VNF coating layers were done in the lab. Further, to evaluate the
combination of ORL and VNF in the chewable PDF a liquid charomatogrphic method is
devlaped and validated utilizing the reverse phase mobile liquid running at flow of 1.5ml
for twelve minutes. There was no compatibility contradiction between the active and
nonactive substances in the PDF. Then both the farmulations were tested and based upon
the results obtained the core tablet formulation ORC-2, was chosen as optimised inner

255 | P a g e
ORL dispersible core tablet formula. Then, taking a dummy placebo core tablet, six trials
of outer coating layers of VNF microparticles were tried. And based on the responses of
the tasting volunteers the outer layers formulation VLC-5 was chosen as the optimized
coating layer formula.
Once the ORL core dispersible tablets and the VNF coating layers are prepared optimized
and were ready for the chewable compression coated tablets. This was done by direct
compression method using the Minipress II DL bilayer tablet compression machine of
Karnavathi’s. By taking optimized ORL dispersible core tablet ORC-2, and the outer
coating layers optimised formula VLC-5 chewable press coated tablets (OPCT) were
compressed. The (OPCT) was led to a series of physical and chemical evaluations and all
the findings were not out of the specified limits. And in the in-lab drug libration study the
release of both drugs, ORL and VNF at the end of one fourth hour was found to be
librating nearly ninety percent. More importantly the optimized (OPCT) formulation in
the taste evaluation and stability studies was found to be satisfactory. When the optimized
(OPCT) drug release profile was tried to fit in different models of kinetics both ORL and
VNF from the (OPCT) were best fitting with the first order kinetics indicating the good
immediate release chewable dosage form. Hence, the developed chewable press coated
tablets of ORL and VNF can be an excellent chewable dosage form for treating obese
bing eaters suffering from depression. The optimised formulation is palatable and can be
happily chewed without water. But ultimately the clinical finding in humans only can
make it ready for applying as generic dosage form and hence are recommended.