chap_1
DESCRIPTION
finances of state govtTRANSCRIPT

Chapter - I
Finances of the State Government

1
Profile of the State
The State of Karnataka is the eighth largest State in terms of geographical area (1,91,791 Sq. Km.) and the ninth largest by population. As indicated in Appendix 1.1, the State’s population increased from 5.29 crore in 2001 to 6.11 crore in 2011 recording a decadal growth of about 16 per cent. The percentage of population below the poverty line was 20.91 compared to the All India Average of 21.92. The State’s Gross State Domestic Product (GSDP) in 2012-13 at current prices was ` 5,25,444 crore. The State’s literacy rate increased from 66.64 per cent in 2001 to 75.6 per cent in 2011. The per-capita income of the State stands at ` 87,359 against the country average of ` 45,483. General data relating to the State is given in Appendix 1.1.
Gross State Domestic Product (GSDP) GSDP is the market value of all officially recognized final goods and services produced within the State in a given period of time. The growth of GSDP of the State is an important indicator of the State’s economy, as it indicates the standard of living of the State’s population. The trends in the annual growth of India’s Gross Domestic Product (GDP) and that of the State, at current prices, are indicated in Table 1.1 below.
Table 1.1: Annual Growth Rate of GDP and GSDP at current prices
Year 2008-09 2009-10 2010-11 (QE)*
2011-12 (AE)*
2012-13 (P)*
India’s GDP (` in crore) 53,03,567 61,08,903 72,66,967 83,53,495 94,61,013
Growth rate of GDP (percentage) 15.7 15.2 19.0 15.0 13.3
State’s GSDP (` in crore) 3,10,312 3,37,516 3,98,893 4,58,903 5,25,444
Growth rate of GSDP (percentage) 14.7 8.8 18.2 15.0 14.5
Source: Karnataka Economic Survey 2012-13/MTFP-2013-17 *QE-Quick Estimates, AE-Advance Estimates, P-Projected
In the year 2012-13, Karnataka’s GSDP growth rate at current prices was above that of the nation’s average growth rate.
The GSDP amount conveyed by the Ministry of Finance, Government of India (GOI) with respect to the State for the years 2010-13 and accepted by the Government was ` 3,98,893 crore, ` 4,58,903 crore and ` 5,25,444 crore respectively. However, these amounts varied from the figures released by Directorate of Economics and Statistics and adopted in the Karnataka Economic Survey - 2012-13.
2
1.1 Introduction
This chapter provides a broad perspective of the finances of the Government of Karnataka during 2012-13. It analyses important changes in the major fiscal indicators compared to the previous year and keeping in view the overall trends during the last five years. The analysis is based on the Finance Accounts and information obtained from the State Government. The structure of the Government Accounts and the layout of the Finance Accounts have been explained in Appendix 1.2.
1.1.1 Summary of fiscal transactions in 2012-13
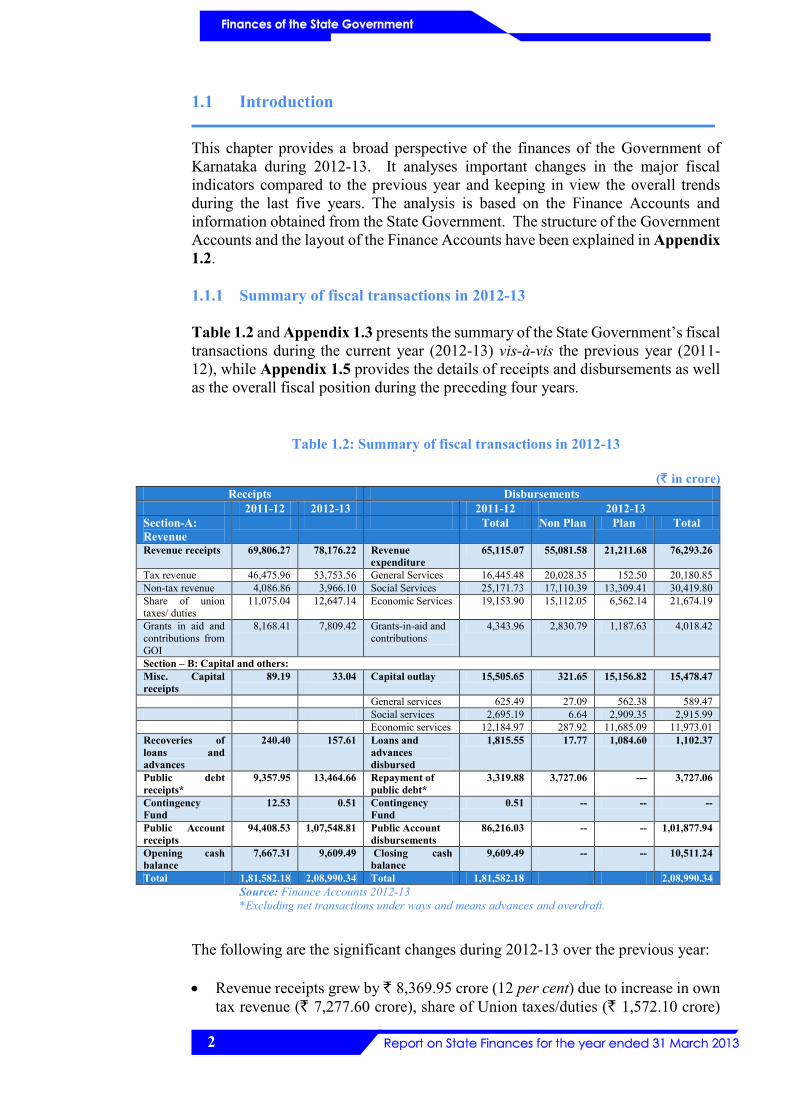
Table 1.2 and Appendix 1.3 presents the summary of the State Government’s fiscal transactions during the current year (2012-13) vis-à-vis the previous year (2011-12), while Appendix 1.5 provides the details of receipts and disbursements as well as the overall fiscal position during the preceding four years.
Table 1.2: Summary of fiscal transactions in 2012-13
(` in crore) Receipts Disbursements
2011-12 2012-13 2011-12 2012-13 Section-A: Revenue
Total Non Plan Plan Total
Revenue receipts 69,806.27
78,176.22 Revenue expenditure
65,115.07 55,081.58 21,211.68 76,293.26
Tax revenue 46,475.96 53,753.56 General Services 16,445.48 20,028.35 152.50 20,180.85 Non-tax revenue 4,086.86 3,966.10 Social Services 25,171.73 17,110.39 13,309.41 30,419.80 Share of union taxes/ duties
11,075.04 12,647.14 Economic Services 19,153.90 15,112.05 6,562.14 21,674.19
Grants in aid and contributions from GOI
8,168.41 7,809.42 Grants-in-aid and contributions
4,343.96 2,830.79 1,187.63 4,018.42
Section – B: Capital and others: Misc. Capital receipts
89.19 33.04 Capital outlay 15,505.65 321.65 15,156.82 15,478.47
General services 625.49 27.09 562.38 589.47 Social services 2,695.19 6.64 2,909.35 2,915.99 Economic services 12,184.97 287.92 11,685.09 11,973.01 Recoveries of loans and advances
240.40 157.61 Loans and advances disbursed
1,815.55 17.77 1,084.60 1,102.37
Public debt receipts*
9,357.95 13,464.66 Repayment of public debt*
3,319.88 3,727.06 --- 3,727.06
Contingency Fund
12.53 0.51 Contingency Fund
0.51 -- -- --
Public Account receipts
94,408.53 1,07,548.81 Public Account disbursements
86,216.03 -- -- 1,01,877.94
Opening cash balance
7,667.31 9,609.49 Closing cash balance
9,609.49 -- -- 10,511.24
Total 1,81,582.18 2,08,990.34 Total 1,81,582.18 2,08,990.34 Source: Finance Accounts 2012-13 *Excluding net transactions under ways and means advances and overdraft.
The following are the significant changes during 2012-13 over the previous year:
• Revenue receipts grew by ` 8,369.95 crore (12 per cent) due to increase in own tax revenue (` 7,277.60 crore), share of Union taxes/duties (` 1,572.10 crore)

3
offset by decrease under grants-in-aid and contributions from GOI (` 358.99 crore) and non-tax revenue (` 120.76 crore). The revenue receipts for the year 2012-13 exceeded the projection made in the Medium Term Fiscal Plan (MTFP) 2011-15 by ` 1,818 crore.
• Revenue expenditure increased by ` 11,178.19 crore (17 per cent). Increase was under economic services sector (` 2,520.29 crore), social services sector (` 5,248.07 crore), general services sector (` 3,735.37 crore) offset by decrease under grants-in-aid and contributions (` 325.54 crore). It exceeded the MTFP 2011-15 projections for the year by ` 1,405 crore.
• Capital outlay decreased by ` 27.18 crore (less than one per cent). Increase was mainly under social services sector (` 220.80 crore) offset by decreases under economic services sector (` 211.96 crore) and general services sector (` 36.02 crore), respectively.
• Public debt receipts (excluding ways and means advances) increased by ` 4,106.71 crore (44 per cent) while repayment by ` 407.18 crore (12 per cent).
• Public Account receipts and disbursements increased by ` 13,140.28 crore (14 per cent) and ` 15,661.91 crore (18 per cent), respectively.
• Cash balance of the State Government increased by ` 901.75 crore (nine per cent).
1.1.2 Review of Fiscal situation
In Karnataka, fiscal reforms and consolidation were brought to the forefront with the State Government formulating the first MTFP for the period 2000-05 on the basis of broad parameters of fiscal correction path as laid down by the Eleventh Finance Commission (EFC) and enacted (September 2002), The Fiscal Responsibility Act (FRA), which became operational from April 1, 2003 and provided statutory backup to MTFP.
The State Government has been on a fiscal consolidation path since passing of the FRA and had maintained the guarantees within the limits prescribed under the Karnataka Ceiling on Government Guarantees Act, 1999. It has recorded revenue surplus since 2004-05 and the fiscal deficit was within the limit of three per cent of GSDP as prescribed under the Act. However, during 2008-09 and 2009-10, as per the directives of GOI, the State deviated from the fiscal consolidation path and borrowed more money for public spending to tide over economic slowdown, by amending the Act. The XIII FC had suggested a roadmap for medium term fiscal correction to the State Government and assigned a new set of ceilings relating to fiscal deficit and outstanding debt as percentage of GSDP for the years 2010-15.
In accordance with the XIII FC recommendations the State Government, with an amendment to the FRA (May 2011), laid down the following fiscal targets:
• Ensuring that the outstanding debt (including off-budget borrowings) is gradually reduced, and at the end of 2014-15, be at 25.20 per cent of the estimated GSDP for the year. During 2012-13 the outstanding debt was to be at 25.7 per cent.
• Fiscal deficit during 2012-13 not to exceed more than three per cent of GSDP and
• Constituting Fiscal Management Review Committee (FMRC) which shall meet at least twice a year, to review fiscal and debt position of the State.
4
The ratio of outstanding debt and fiscal deficit to GSDP during 2012-13 were 22.22 per cent and 2.76 per cent, respectively, which were well within the prescribed limit. However, inclusive of off-budget borrowings, the ratio of debt to GSDP stood at 22.70 per cent.
The FMRC, headed by Chief Secretary to Government, was constituted in July 2011. The committee met twice during the year to review fiscal and debt position of the State, progress on the fiscal correction path and corrective measures to be undertaken. The FMRC during mid-term review of the fiscal 2012-13, focused broadly on the challenges during the year, resources and expenditure, prudent fiscal management and adherence to Karnataka Fiscal Responsibility Act amongst others. Some of the measures recommended by the committee are detailed below.
• Co-ordinate with neighboring States in evolving non-competitive fiscal incentive policy as per the decision arrived at in the meeting of South Zone Council.
• Relook into the issue of granting exemptions to State Road Transport Corporations (SRTCs) keeping in view its impact on State’s tax base.
• Avoid and moderate inclusion of large expenditure commitments in supplementary estimates.
• Re-visit and control the preference for implementation of schemes and programmes through Society and SPV modes and managing funds through bank and Personal Deposit Accounts outside the Consolidated Fund.
Scrutiny showed that the North East Karnataka Road Corporation (formed with effect from 15-08-2000) continued to enjoy the benefit of tax concessions on motor vehicles to the extent of ` 351.12 crore in 2012-13.
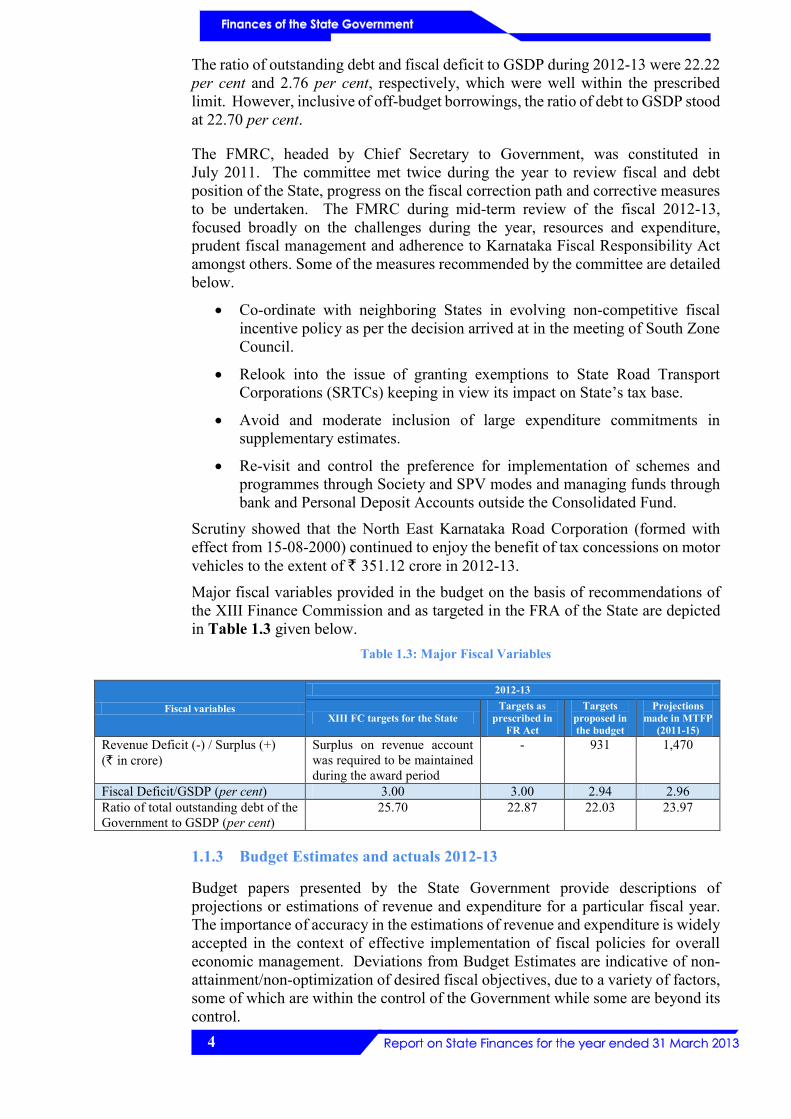
Major fiscal variables provided in the budget on the basis of recommendations of the XIII Finance Commission and as targeted in the FRA of the State are depicted in Table 1.3 given below.
Table 1.3: Major Fiscal Variables
Fiscal variables
2012-13
XIII FC targets for the State Targets as
prescribed in FR Act
Targets proposed in the budget
Projections made in MTFP
(2011-15) Revenue Deficit (-) / Surplus (+) (` in crore)
Surplus on revenue account was required to be maintained during the award period
- 931 1,470
Fiscal Deficit/GSDP (per cent) 3.00 3.00 2.94 2.96 Ratio of total outstanding debt of the Government to GSDP (per cent)
25.70 22.87 22.03 23.97
1.1.3 Budget Estimates and actuals 2012-13
Budget papers presented by the State Government provide descriptions of projections or estimations of revenue and expenditure for a particular fiscal year. The importance of accuracy in the estimations of revenue and expenditure is widely accepted in the context of effective implementation of fiscal policies for overall economic management. Deviations from Budget Estimates are indicative of non-attainment/non-optimization of desired fiscal objectives, due to a variety of factors, some of which are within the control of the Government while some are beyond its control.
5
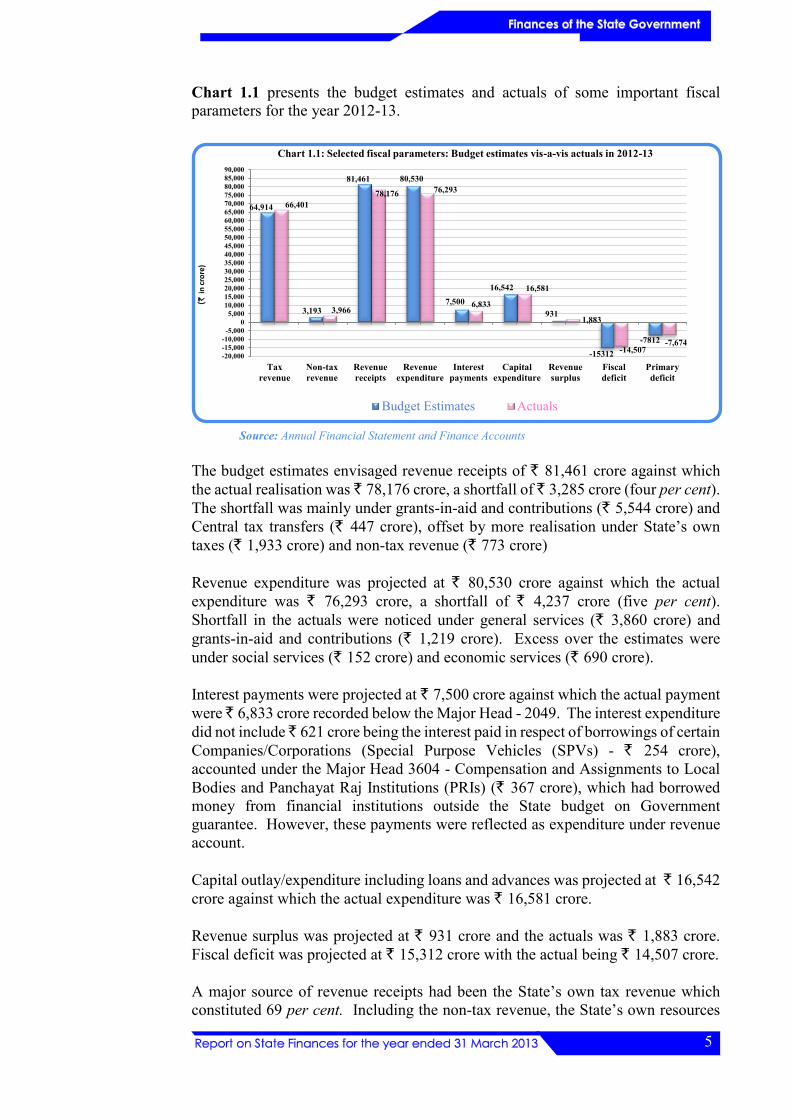
Chart 1.1 presents the budget estimates and actuals of some important fiscal parameters for the year 2012-13.
Source: Annual Financial Statement and Finance Accounts
The budget estimates envisaged revenue receipts of ` 81,461 crore against which the actual realisation was ` 78,176 crore, a shortfall of ̀ 3,285 crore (four per cent). The shortfall was mainly under grants-in-aid and contributions (` 5,544 crore) and Central tax transfers (` 447 crore), offset by more realisation under State’s own taxes (` 1,933 crore) and non-tax revenue (` 773 crore)
Revenue expenditure was projected at ` 80,530 crore against which the actual expenditure was ` 76,293 crore, a shortfall of ` 4,237 crore (five per cent). Shortfall in the actuals were noticed under general services (` 3,860 crore) and grants-in-aid and contributions (` 1,219 crore). Excess over the estimates were under social services (` 152 crore) and economic services (` 690 crore).
Interest payments were projected at ` 7,500 crore against which the actual payment were ̀ 6,833 crore recorded below the Major Head - 2049. The interest expenditure did not include ̀ 621 crore being the interest paid in respect of borrowings of certain Companies/Corporations (Special Purpose Vehicles (SPVs) - ` 254 crore), accounted under the Major Head 3604 - Compensation and Assignments to Local Bodies and Panchayat Raj Institutions (PRIs) (` 367 crore), which had borrowed money from financial institutions outside the State budget on Government guarantee. However, these payments were reflected as expenditure under revenue account.
Capital outlay/expenditure including loans and advances was projected at ` 16,542 crore against which the actual expenditure was ` 16,581 crore.
Revenue surplus was projected at ` 931 crore and the actuals was ` 1,883 crore. Fiscal deficit was projected at ` 15,312 crore with the actual being ` 14,507 crore.
A major source of revenue receipts had been the State’s own tax revenue which constituted 69 per cent. Including the non-tax revenue, the State’s own resources
64,914
3,193
81,461 80,530
7,500
16,542
931
-15312-7812
66,401
3,966
78,176 76,293
6,833
16,581
1,883
-14,507-7,674
-20,000-15,000-10,000
-5,0000
5,00010,00015,00020,00025,00030,00035,00040,00045,00050,00055,00060,00065,00070,00075,00080,00085,00090,000
Taxrevenue
Non-taxrevenue
Revenuereceipts
Revenueexpenditure
Interestpayments
Capitalexpenditure
Revenuesurplus
Fiscaldeficit
Primarydeficit
(`in
cro
re)
Chart 1.1: Selected fiscal parameters: Budget estimates vis-a-vis actuals in 2012-13
Budget Estimates Actuals
6
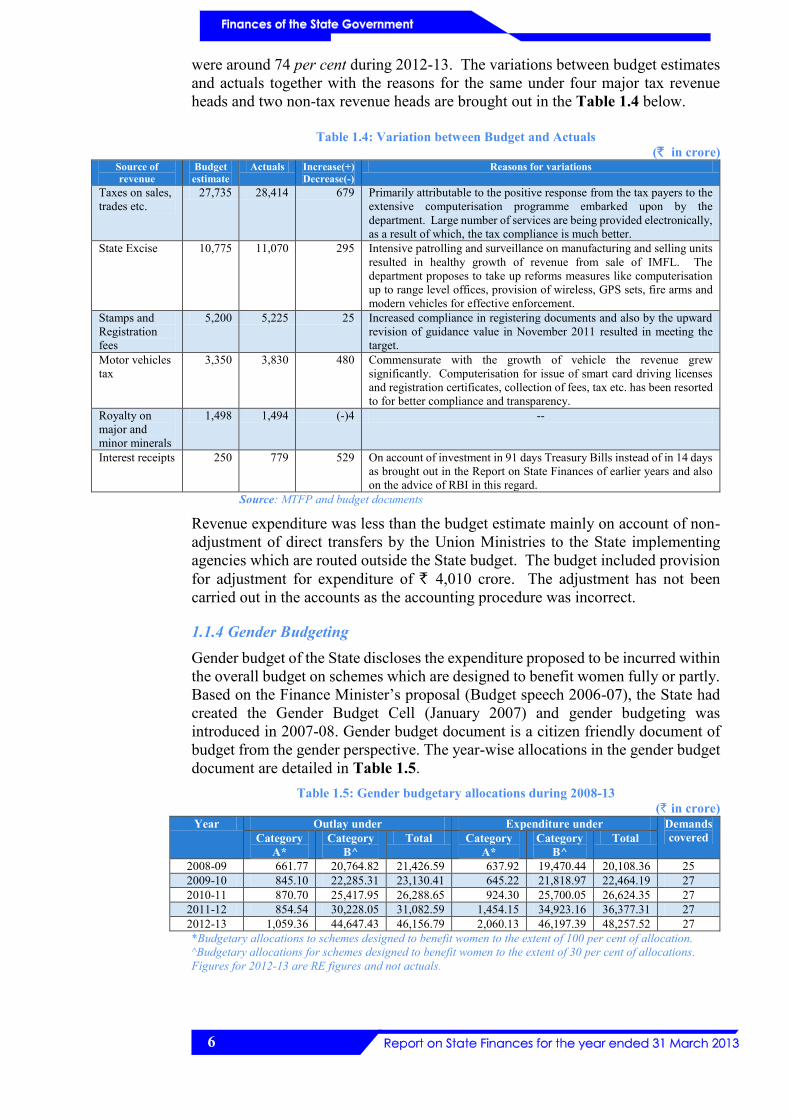
were around 74 per cent during 2012-13. The variations between budget estimates and actuals together with the reasons for the same under four major tax revenue heads and two non-tax revenue heads are brought out in the Table 1.4 below.
Table 1.4: Variation between Budget and Actuals (` in crore)
Source of revenue
Budget estimate
Actuals Increase(+) Decrease(-)
Reasons for variations
Taxes on sales, trades etc.
27,735 28,414 679 Primarily attributable to the positive response from the tax payers to the extensive computerisation programme embarked upon by the department. Large number of services are being provided electronically, as a result of which, the tax compliance is much better.
State Excise 10,775 11,070 295 Intensive patrolling and surveillance on manufacturing and selling units resulted in healthy growth of revenue from sale of IMFL. The department proposes to take up reforms measures like computerisation up to range level offices, provision of wireless, GPS sets, fire arms and modern vehicles for effective enforcement.
Stamps and Registration fees
5,200 5,225 25 Increased compliance in registering documents and also by the upward revision of guidance value in November 2011 resulted in meeting the target.
Motor vehicles tax
3,350 3,830 480 Commensurate with the growth of vehicle the revenue grew significantly. Computerisation for issue of smart card driving licenses and registration certificates, collection of fees, tax etc. has been resorted to for better compliance and transparency.
Royalty on major and minor minerals
1,498 1,494 (-)4 --
Interest receipts 250 779 529 On account of investment in 91 days Treasury Bills instead of in 14 days as brought out in the Report on State Finances of earlier years and also on the advice of RBI in this regard.
Source: MTFP and budget documents Revenue expenditure was less than the budget estimate mainly on account of non-adjustment of direct transfers by the Union Ministries to the State implementing agencies which are routed outside the State budget. The budget included provision for adjustment for expenditure of ` 4,010 crore. The adjustment has not been carried out in the accounts as the accounting procedure was incorrect.
1.1.4 Gender Budgeting Gender budget of the State discloses the expenditure proposed to be incurred within the overall budget on schemes which are designed to benefit women fully or partly. Based on the Finance Minister’s proposal (Budget speech 2006-07), the State had created the Gender Budget Cell (January 2007) and gender budgeting was introduced in 2007-08. Gender budget document is a citizen friendly document of budget from the gender perspective. The year-wise allocations in the gender budget document are detailed in Table 1.5.
Table 1.5: Gender budgetary allocations during 2008-13 (` in crore)
Year Outlay under Expenditure under Demands covered Category
A* Category
B^ Total Category
A* Category
B^ Total
2008-09 661.77 20,764.82 21,426.59 637.92 19,470.44 20,108.36 25 2009-10 845.10 22,285.31 23,130.41 645.22 21,818.97 22,464.19 27 2010-11 870.70 25,417.95 26,288.65 924.30 25,700.05 26,624.35 27 2011-12 854.54 30,228.05 31,082.59 1,454.15 34,923.16 36,377.31 27 2012-13 1,059.36 44,647.43 46,156.79 2,060.13 46,197.39 48,257.52 27 *Budgetary allocations to schemes designed to benefit women to the extent of 100 per cent of allocation. ^Budgetary allocations for schemes designed to benefit women to the extent of 30 per cent of allocations. Figures for 2012-13 are RE figures and not actuals.

7
During 2012-13, three new schemes were included under category A and 36 new schemes under category B.
The Gender Budget Cell has been entrusted with implementation of the gender budget by coordinating between various departments, while the Department of Women and Child Development has been entrusted with the monitoring of the impact analysis. Study of the functioning of the above during 2008-13 had showed that while the Gender Budget Cell was not involved in assessing and working out budgetary requirement of category A and B, the Fiscal Policy Institute (FPI) in Finance Department was involved in the projection of budget requirements of user departments. One scheme was chosen (Santhwana Scheme) for evaluation during 2013-14 through Karnataka Evaluation Authority, the study report of which is awaited. The Planning Board has entrusted a study on status of women in Karnataka to the Institute for Social and Economic Change (ISEC), which has chosen seven districts for collection of primary data. The study involves 23 schemes being implemented by ten departments. This report is also awaited.
State Government had stated (July 2011) that the Gender Budget Cell, in order to strengthen analysis and analytical inputs, had improved the format of the Monthly Programme Implementation Calendar (MPIC) and a circular was issued to validate the categorization of schemes, assess the impact and analyse the allocation. The MPIC formats prepared for documentation of categorization of schemes / impact analysis were not found to be useful on account of there being no provision for the disaggregated data regarding male / female beneficiaries. Further, a study viz., ‘Monograph on the Status of Women in Karnataka’ had been commissioned (May 2011), which was to be carried out jointly by ISEC, Bangalore and Institute of Social Studies Trust, Bangalore. The Department of Women and Child Development stated (June 2013) that the study report was yet to be received.
The Public Accounts Committee in its 13th report on CAG’s Report on State Finances 2009-10, (December 2011) placed before the Legislative Assembly had recommended proper identification of schemes to be undertaken under both category A and B of the Gender Budget. As a sequel to the recommendations a task force was constituted (June 2013) under the Chairpersonship of Chief Secretary to review the process of identification of schemes under gender budgeting. The task force is set up sub committees as required, and co-opts members in order to complete the tasks within a period of six months from the date of its first meeting.
Gender Budget document (2012-13) stated that categorization was being fine- tuned every year in consultation with departments. The State Government introduced Result Framework Document (RFD) during 2011-12 on the guidelines issued by the Planning Department with the objective of measuring results in a structured format and in a transparent manner. However, the results flowing from the implementation of RFD were not brought out.
A performance audit on the working of the Sericulture Department covering the period 2008-13 was conducted by the office of Principal Accountant General (E&RSA) Report No.2 (para 2.1.6.5) of the year 2014, inter-alia highlighting the absence of mechanism to assess the actual number of women beneficiaries to be covered / actually covered, under the schemes oriented towards women.

8
1.1.5 Major policy initiatives of Budget 2012-13
During the year 2012-13, an exclusive agriculture budget was presented for the second year in succession, to the Legislature along with the general budget. Agriculture and the related irrigation sectors were allocated ` 19,660 crore and the allocation for other sectors amounted to ` 67,595 crore. Major policy initiatives of Budget 2012-13 together with the action taken thereon are brought out in Appendix 1.4. Scrutiny of records of certain schemes which were proposed for implementation / the action taken on such proposals in the departments of Health and Family Welfare and Social Welfare Department are brought out in Table 1.6 below.
Table 1.6: Budget assurances and audit analysis thereon
Budget Assurance Action taken as per Action Taken Report
Audit observations
In order to mitigate the problem of iron and iodine deficiency, pregnant women and lactating mothers would be provided with free supply of double fortified salt through the Public Distribution System. In all Food and Nutrition programmes of the State Government like ICDS, Mid-day meals in schools etc., double fortified salt will be used.
Action has been taken to provide free supply of double fortified salt through the Public Distribution System in consultation with Food and Civil Supplies Department and Report from that Department is awaited.
The budgetary assurance was not implemented as stated by the Department of Health and Family Welfare without citing specific reasons.
Total outlay for Special Component Plan and Tribal Sub-Plan has been increased to ` 7,200 crore. Within this outlay, pooled Funds placed at the disposal of Social Welfare Department have been increased to ` 1,250 crore.
Pooled amount of ` 1,250 crore has been allocated under SCP/TSP.
As at the end of March 2013, a total of ` 1,250 crore placed at the disposal of the Department of Social Welfare, out of which ` 875 crore was earmarked for SCP and ` 375 crore for TSP. It was seen that an amount of ` 300.60 crore (34.37%) was lying unutilised in the PD account of the Commissioner, Social Welfare Department under SCP funds.
Eight Atal Bihari Vajapayee Model Schools, two each in a revenue division, will be started at a cost of ` 10 crore per school for education of students belonging to Scheduled Castes and Scheduled Tribes.
Approval has been given for establishing 10 additional Atal Bihari Vajapayee Schools. As regards establishment of schools in every Revenue Division, the same is under consideration.
Only ` 2 crore was allocated for the purpose and the schools were not started in the academic year 2012-13. It was proposed to start the schools from the academic year 2013-14.
For comprehensive development of Safai Karamcharis a Safai Karamchari Commission will be constituted.
Notification has been issued constituting Karnataka State Safai Karamchari Commission.
The Commission was constituted. On an analysis of the Personal Deposit account of the Commissioner, Social Welfare Department, it was seen that an amount of ` 50 lakh released for the constitution of the Committee was lying unutilised.
Rehabilitation of families in Forest Ares: To protect families located in national Parks, Sanctuaries and other forest areas from wildlife attack, such families need to be relocated voluntarily. For implementing this program, a grant of ` 10 crore will be provided from the pooled fund of the Social Welfare Department. In this year it is proposed to take up this work in Hassan and Sakleshpur.
The proposal received from Forest department in this regard is under consideration.
Only ` 4.70 lakh has been disbursed to DC Mysore & DC Kodagu for implementing the programme, on the last working day of the financial year.

9
1.2 Resources of the State
1.2.1 Resources of the State as per the Annual Finance Accounts Revenue and Capital are the two streams of receipts that constitute the resources of the State Government. Revenue Receipts consist of tax revenues, non-tax revenues, States’ share of Union Taxes and Duties and grants-in-aid and contributions from the Government of India (GOI). Capital receipts comprise miscellaneous capital receipts such as proceeds from disinvestment, recoveries of loans and advances, debt receipts from internal sources (market loans, borrowings from financial institutions/commercial banks) and loans and advances from GOI. Besides, the funds available in the Public Account after disbursement are also utilised by the Government to finance its deficits. Table 1.2 presents the receipts and disbursements of the State during the current year as recorded in its Annual Finance Accounts while Chart 1.1 depicts the actuals against the budget in various components of the fiscal variables of the State during 2012-13. Further, the Chart 1.2 depicts the composition of resources of the State during the current year.
Chart 1.2: Components and sub-components of Resources
Chart 1.3 depicts the trends in various components of receipts during 2008-13, while Chart 1.4 depicts the composition of resources of the State during the year 2012-13.
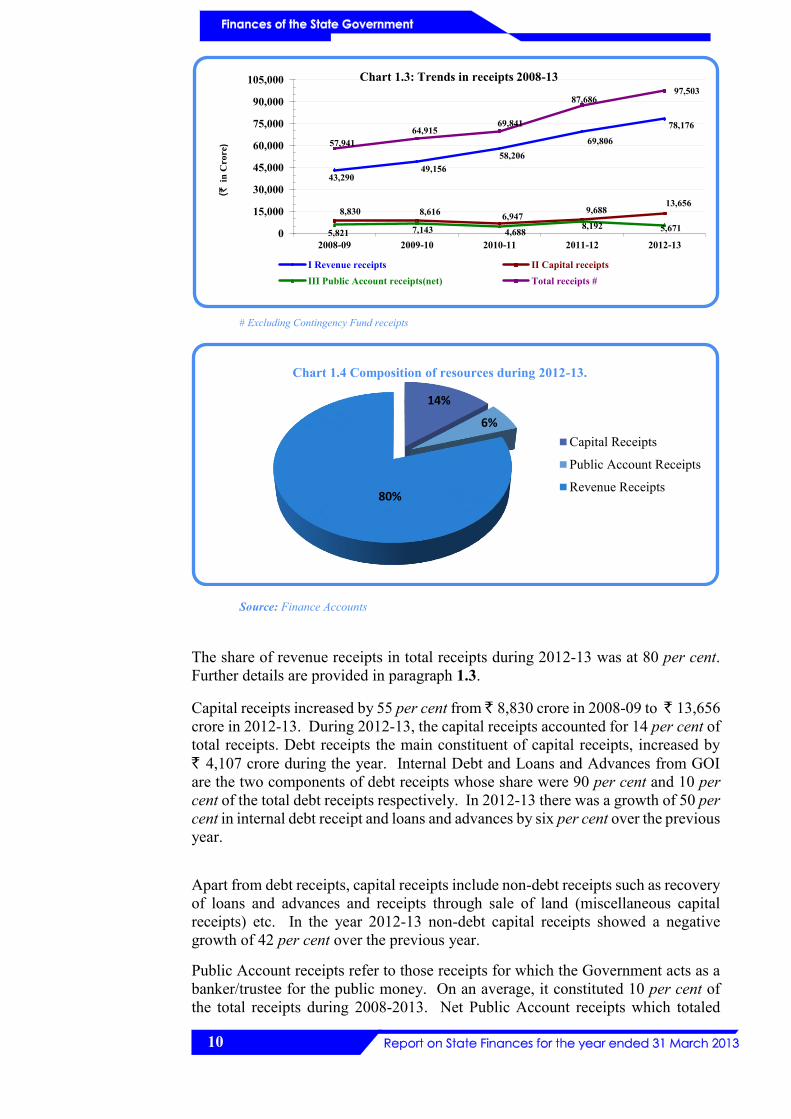
Total receipts (excluding contingency fund receipts) increased by 68 per cent from ` 57,941 crore in 2008-09 to ` 97,503 crore in 2012-13. Compared to the previous year, there was an increase by ` 9,817 crore (11 per cent).
Total Receipts( ` 97,503 crore)
Revenue Receipts( ` 78,176 crore )
Tax Revenue(` 53,754
crore)
1. Taxes on sales, trade etc.2. State excise3. Stamps and registration fees 4. Taxes on vehicles etc.
Non Tax Revenue(` 3,966 crore)
State's share of Union
Taxes & duties
(` 12,647 crore)
Grants -in-aid from
GOI(` 7,809 crore)
Capital Receipts( ` 13,656 crore)
DebtReceipts
( ` 13,465 crore)
-Market loan- Borrowings-Loans and advances from GOI
Non-debt Receipts
(` 191 crore)
- Proceeds from disinvestment and sale of land-Recoveries of loans and advances.
Public Accounts Receipts (Net)( ` 5,671 crore)
(i.e. funds available with Govt. for use)
- Small Saving, PF- Reserve Funds-Deposits/Advances- Suspense / Miscellenous - Remittances
10
# Excluding Contingency Fund receipts
Source: Finance Accounts
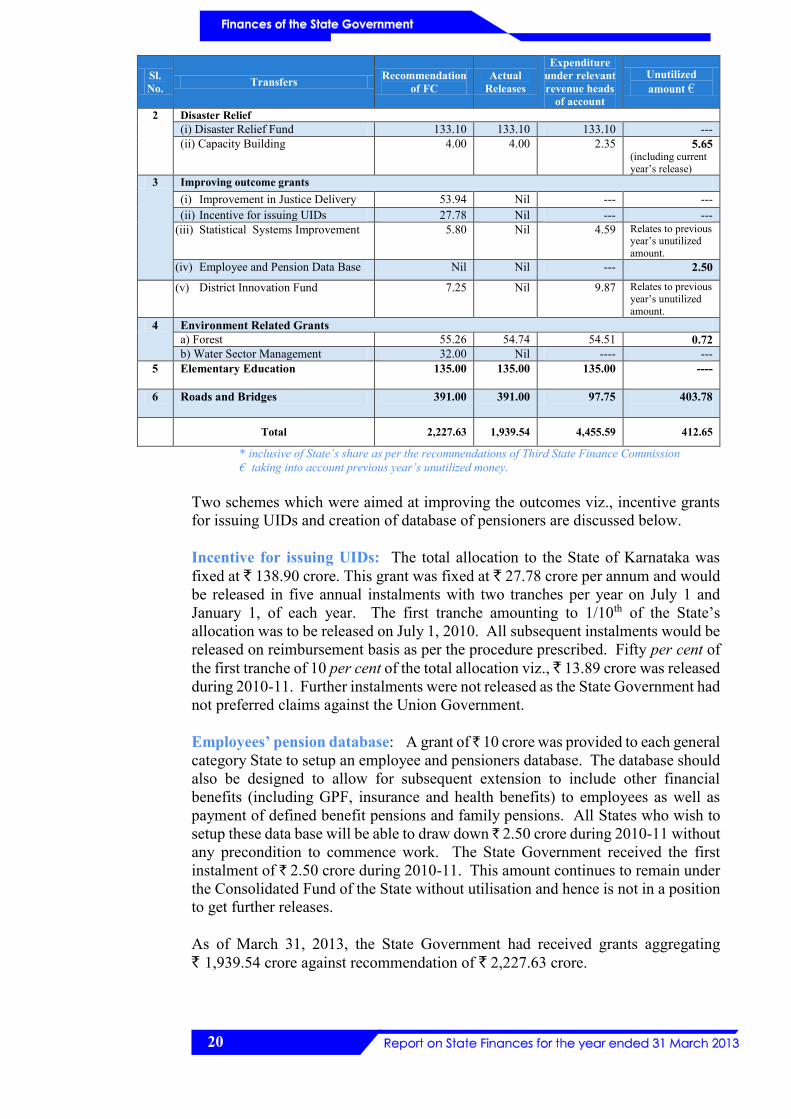
The share of revenue receipts in total receipts during 2012-13 was at 80 per cent. Further details are provided in paragraph 1.3. Capital receipts increased by 55 per cent from ̀ 8,830 crore in 2008-09 to ̀ 13,656 crore in 2012-13. During 2012-13, the capital receipts accounted for 14 per cent of total receipts. Debt receipts the main constituent of capital receipts, increased by ` 4,107 crore during the year. Internal Debt and Loans and Advances from GOI are the two components of debt receipts whose share were 90 per cent and 10 per cent of the total debt receipts respectively. In 2012-13 there was a growth of 50 per cent in internal debt receipt and loans and advances by six per cent over the previous year.
Apart from debt receipts, capital receipts include non-debt receipts such as recovery of loans and advances and receipts through sale of land (miscellaneous capital receipts) etc. In the year 2012-13 non-debt capital receipts showed a negative growth of 42 per cent over the previous year. Public Account receipts refer to those receipts for which the Government acts as a banker/trustee for the public money. On an average, it constituted 10 per cent of the total receipts during 2008-2013. Net Public Account receipts which totaled
43,29049,156
58,20669,806
78,176
8,830 8,616 6,9479,688
13,656
5,821 7,143 4,6888,192 5,671
57,94164,915
69,841
87,68697,503
0
15,000
30,000
45,000
60,000
75,000
90,000
105,000
2008-09 2009-10 2010-11 2011-12 2012-13
(`
in C
rore
)
Chart 1.3: Trends in receipts 2008-13
I Revenue receipts II Capital receiptsIII Public Account receipts(net) Total receipts #
14%
6%
80%
Capital Receipts
Public Account Receipts
Revenue Receipts
Chart 1.4 Composition of resources during 2012-13.

11
` 5,821 crore in 2008-09 decreased to ` 5,671 crore in 2012-13 with negative growth of 31 per cent during the year compared to 2011-12.
1.2.2 Funds transferred to State implementing agencies outside the State budget
The Central Government has been transferring sizable quantum of funds directly to the State implementing agencies1 for implementation of various schemes/programmes in social and economic sectors, which are recognized as critical. In the present system these funds are not routed through the State Budget/State Treasury system and hence do not find mention in the Finance Accounts of the State. As such, the Annual Finance Accounts of the State does not provide a complete picture of the resources under the control of the State Government. To present the holistic picture on the availability of aggregate resources, funds directly transferred to State implementing agencies, implementing four major Centrally Sponsored Scheme, are presented in Table 1.7. During the year 2012-13 Central funds amounting to ` 6,649.14 crore were transferred directly to the State implementing agencies. There was an increase in transfer of such funds compared to the previous year (22 per cent). An Appendix giving details of funds transferred directly to State implementing agencies outside State budget is included in Finance Accounts by capturing data from CGA website (unaudited figures).
Table 1.7: Funds transferred directly to the State implementing agencies for major plan schemes
(` in crore)
Source: Information furnished by CPMS, Finance Accounts.
Unless uniform accounting practices are followed by all these agencies with proper documentation and timely reporting of expenditure, it would be difficult to monitor the end use of these direct transfers.
1 State Implementing Agency is any organization/institution including non-Governmental organization which is authorised by the State Government to receive funds from GOI for implementing specific programmes in the State e.g. State implementation Society for Sarva Shiksha Abhiyan.
Programme / scheme Scheme Objective Implementing agency in the State
Funds transferred directly by GOI during
2010-11 2011-12 2012-13 Mahatma Gandhi National Rural Employment Guarantee Scheme
Aims at enhancing livelihood security by providing guaranteed 100 days’ unskilled employment in a financial year to every rural household.
Zilla Panchayats 1,573.05 662.57 1,481.94
Sarva Shiksha Abhiyan (SSA) Seeks universalization of elementary education, provides right of useful and relevant elementary education for all children in the age group of 6-14 years
Sarva Shiksha Abhiyan Samithi
669.03 627.88 684.51
Rural Housing (IAY) Provides financial assistance to the rural poor for construction of houses and up-gradation of unserviceable kutcha houses to pucca/semi pucca houses
Zilla Panchayats 448.80 294.03 217.46
National Food Security Mission
Provides a balanced and nutritious diet to primary and upper primary school children.
State Agriculture Management Agency and Karnataka State Seeds Corporation Limited
72.64 73.31 110.20
Pradhan Mantri Gram Sadak Yojana (PMGSY)
Aimed at connecting all rural habitations with good quality all-weather roads and systematic up-gradation of the existing rural road networks.
Karnataka Rural Roads Development Agency
927.67 ---- 24.60

12
1.3 Revenue receipts
Statement - 11 of the Finance Accounts details the revenue receipts of the Government. The trends and composition of revenue receipts over the period 2008-13 are presented in Appendix 1.5 and are also depicted in Chart 1.5.
Revenue receipts showed progressive increase from ` 43,290 crore in 2008-09 to ` 78,176 crore in 2012-13. On an average, 72 per cent of the revenue came from State’s own resources during the period. The balance was transfers from GOI in the form of State’s share of taxes and duties and grants-in-aid and contributions.
State’s own resources consist of tax revenue and non-tax revenue. The share of tax revenue in revenue receipts was between 62 and 69 per cent during 2008-13. The tax to GSDP ratio during the period was between 8.91 per cent and 10.23 per cent. Non-tax revenue as a per cent of revenue receipts was between 5.10 to 7.30 per cent in 2008-13. It was between 0.84 and 1.02 per cent of GSDP during the period.
Source: Finance Account
The trends in revenue receipts relative to GSDP are presented in Table 1.8 below:
Table 1.8: Trends in revenue receipts relative to GSDP
2008-09 2009-10 2010-11 2011-12 2012-13
Revenue receipts (RR) (` in crore) 43,290 49,156 58,206 69,806 78,176 Rate of growth of RR (per cent) 5.2 13.6 18.4 19.9 12.00 Rate of growth of State’s own tax (per cent) 6.4 10.6 25.8 20.8 15.66 R R/GSDP (per cent) 13.95 14.56 14.59 15.21 14.88 Buoyancy ratios2 Revenue buoyancy w.r.t GSDP 0.4 1.5 1.0 1.3 0.8 State’s own tax buoyancy w.r.t GSDP 0.4 1.2 1.4 1.4 1.1 Revenue buoyancy with reference to 0.8 1.3 0.7 0.9 0.8
2 Buoyancy ratio indicates the elasticity or degree of responsiveness of a fiscal variable with respect to a given change in the base variable. For instance, revenue buoyancy at 0.4 implies that revenue receipts tend to increase by 0.4 percentage points, if the GSDP increases by one per cent.
43,29049,156
58,206
69,80678,176
30,80433,913
41,831
50,563
57,720
7,154 7,360 9,506 11,075 12,647
5,332 7,883 6,869 8,168 7,8090
5,00010,00015,00020,00025,00030,00035,00040,00045,00050,00055,00060,00065,00070,00075,00080,000
2008-09 2009-10 2010-11 2011-12 2012-13
(`in
Cro
re)
Chart 1.5: Trends in revenue receipts
Revenue receipts State's own revenue Central tax transfers Grants-in-aid

13
2008-09 2009-10 2010-11 2011-12 2012-13
State’s own taxes GSDP (` in crore) 3,10,312 3,37,516 3,98,893 4,58,903 5,25,444 Rate of growth of GSDP 14.6 8.8 18.2 15.0 14.5
Source: Finance Accounts, GSDP: MTFP 2013-17
Revenue buoyancy, which is directly proportional to growth rate of revenue receipts and GSDP growth rate, widely fluctuated during the period due to fluctuations in the growth rate of revenue receipts. During 2009-12 the higher growth rate of revenue receipts relative to GSDP pushed the revenue buoyancy ratio up. Revenue buoyancy ratio, which was lowest at 0.4 in 2008-09, increased to 1.5 in 2009-10 due to significant increase in the growth rate of revenue receipts.
During 2008-13, the State’s own tax revenue was the largest component of the revenue receipts and its growth trend influenced the trends in revenue receipts. During the period rate of growth of own tax revenue was lowest in 2008-09 as also its buoyancy. In 2012-13 there was a moderate growth of own tax revenue. However, due to decrease in growth rate of GSDP, the buoyancy ratio fell to 0.8.
1.3.1 State’s own resources As the State’s share in Central taxes and grants-in-aid are determined on the basis of recommendations of the Finance Commission, the State’s performance in mobilization of resources was assessed in terms of its resources comprising own tax and non-tax sources.
The tax revenue of the State in 2012-13 was close to the projection made in the XIII FC Report. It exceeded the MTFP projection by ` 2,839 crore and budget estimates by ` 1,933 crore. Non-tax revenue was significantly less than the XIII FC projection by ` 1,954 crore and also the MTFP projections (` 304 crore). It was however more than the budget estimates by ` 773 crore, as detailed in Table 1.9 below.
Table 1.9: Projections of Tax and Non-tax Revenue (` in crore)
XIII FC projections
Budget estimates
MTFP projections Actual
Tax revenue 53,785 51,821 50,915 53,754
Non-tax revenue 5,920 3,193 4,270 3,966
1.3.1.1 Tax revenue Taxes on sales, trade, etc. were the main source of the State’s tax revenue with a contribution of 53 per cent followed by State excise (21 per cent), stamps and registration fees (10 per cent) and taxes on vehicles (seven per cent) during the year. Tax revenues included ` 971.96 crore made through book adjustments. These adjustments were in the nature of adjustment of electricity tax payable by ESCOMs treated as subsidy to the entities; adjustment of Motor Vehicles Tax due treated as subsidy to road transport corporations etc. It also included ` 109 crore being the permit fee collected by GOI and assigned to State. The trends in the major constituents of tax revenue during the period 2008-13 are shown in Table1.10 and Chart 1.6 below.

14
Table 1.10: Components of State’s own tax revenue
(` in crore and growth rate in per cent) Revenue head 2008-09 2009-10 2010-11 2011-12 2012-13
Taxes on sales, trade, etc. 14,623 15,833 20,235 25,020 28,414 Rate of growth 5.25 8.27 27.80 23.65 13.57 State excise 5,749 6,946 8,285 9,776 11,070 Rate of growth 20.60 20.82 19.28 18 13.24 Stamp duty and registration fees 2,927 2,628 3,531 4,623 5,225 Rate of growth (-)14.14 (-)10.21 34.36 30.93 13.02 Taxes on vehicles 1,681 1,962 2,550 2,957 3,830 Rate of growth 1.88 16.72 29.97 15.96 29.52 Land revenue 256 128 177 215 205 Rate of growth 76.55 (-)50 36.06 20.79 (-)4.65 Taxes on goods and passengers 1,085 1,291 1,526 1,690 2,181 Rate of growth 29.63 18.99 18.20 10.75 29.05 Other taxes3 1,324 1,791 2,169 2,195 2,829 Rate of growth 3.04 35.27 21.11 1.2 28.88 Total 27,645 30,579 38,473 46,476 53,754
Source: Finance Accounts for the respective years
During the period 2008-13, the rate of growth of taxes on sales, trade, etc., was between 5.25 and 27.80 per cent. As brought in MTFP 2013-17, the good growth rate in revenue in the past four years was attributable to the positive response of the tax payers to the extensive computerisation programmes embarked upon by the department. All the dealers have been filing returns online and more than 80 per cent of revenue has been coming through electronic form. A large number of services are being provided electronically at the doorsteps of the taxpayers. As a result the tax compliance is much better. In the current year, the growth rate decreased to 13.55 per cent mainly due to slowdown in the general economic activity. Despite the moderate growth, the actuals have exceeded the target (budgeted figure) by ` 679 crore. A number of reliefs under the VAT were given during the year. Further, instead of increasing the tax rate to raise resources to meet developmental expenditure, proposal to increase the revenue collection by ensuring better tax compliance through more efficient tax administration was contemplated. It was also proposed to increase and levy tax on a few commodities whose
3Other taxes include taxes on immovable property other than agricultural land, taxes and duties on electricity and agricultural income.
14,623 15,833
20,235
25,02028,414
5,749 6,9468,285
9,776 11,070
2,927 2,628 3,531 4,623 5,225
1,681 1,962 2,550 2,957 3,8300
5,000
10,000
15,000
20,000
25,000
30,000
2008-09 2009-10 2010-11 2011-12 2012-13
(`in
Cro
re)
Chart 1.6: Growth trends of major tax revenue
Taxes on sales, trade etc State exciseStamp duty and registration Taxes on vehicles

15
consumption was required to be curbed in the larger interests of the society as well as to curb tax evasion taking advantage of current tax exemption. A number of rationalization and simplification measures were also taken for better tax administration.
State excise has shown a steady increase since 2008-09. It is the second largest contributor amongst State’s own revenue. The department has taken more enforcement measures to ensure strict compliance. Intensive patrolling and surveillance on manufacturing and selling units was undertaken. As a result of these measures there was a healthy growth of revenue from sale of Indian Made Foreign Liquor (IMFL). The growth rate was between 13.24 to 20.82 per cent during 2008-13.
The growth rate of revenue from stamps and registration fees was between (-) 14.14 and 34.36 per cent during the period 2008-13. As brought out in MTFP 2013-17, under the JNNURM reforms, there was a commitment by the State to decrease the stamp duty to five per cent. The department has proposed a dedicated cell on the lines existing in Maharashtra to advise regularly on guidance value revision. Consequently a Permanent Valuation Cell (PVC) has been constituted with 11 members in the panel to keep tabs on real estate market, provide inputs and advice to central valuation committee on guidance value revision. The rules on functioning of the valuation cell are to be framed soon. A system of periodic and automatic revision of guidance value indexed to average market rates was desirable.
The budget estimate for taxes on vehicles was at ` 3,350 crore against which the actual realisation was ` 3,830 crore. The major share of tax is collected from cars and two wheelers which constitute more than 75 per cent of the total strength of motor vehicles in the State. The growth rate of revenue under the head was between 1.88 and 29.97 per cent during the period 2008-13.
Cost of collection
The gross collection of taxes on motor vehicles, taxes on sales, trade etc., stamp duty and registration fees and State excise, expenditure incurred on their collection and its percentage to gross collection during the years 2010-13 along with their all-India average cost of collection for the respective previous years are indicated in the Table 1.11 below:
Table 1.11: Cost of collection
Receipt Year Gross
collection
Expenditure on collection
@ Percentage of cost of
collection to gross collection
All India average percentage for the preceding
year (` in crore) Motor vehicles 2010-11 2,551.40 48.44 1.90 3.07
2011-12 2,958.43 57.64 1.95 3.71 2012-13 3,832.78 98.48 2.57 2.96
Taxes on sales, trade etc.
2010-11 21,252.97 165.43 0.78 0.96 2011-12 26,203.81 192.76 0.74 0.75 2012-13 29,848.75 248.14 0.83 0.83
Stamp duty and registration fees
2010-11 3,554.48 53.52 1.51 2.47 2011-12 4,644.46 58.70 1.26 1.60 2012-13 5.288.12 94.07 1.78 1.89
State Excise 2010-11 8,286.83 68.35 0.82 3.64 2011-12 9,778.38 79.77 0.82 3.05 2012-13 11,074.38 106.29 0.96 1.89
@ The figures in this column vary from those mentioned in the earlier reports. In the earlier reports expenditure booked under the minor hear, 101-collection charges only was considered for arriving at the cost of collection. However, this year, the expenditure booked under 001-direction and administration also has been considered as cost of collection.

16
The percentage of cost of collection to the gross collection was significantly less than the all India average for the period 2010-13.
1.3.1.2 Non-tax revenue Non tax receipts (fees, cess, user charges, interest receipts, etc.) are generally raised through non-statutory mandates and usually a reciprocal benefit accrues to the citizens from whom such receipts are collected. The sources of non-tax receipts have been heterogeneous. These included receipts from fiscal services like interest receipts from the outstanding advances, dividends and profits from the equity investments, royalty fees for allowing use of assets held as custodian like minerals, forests and wild life, or other such services and user charges for various social and economic services provided through the apparatus of the Government.
The non-tax revenue (NTR) collected during 2008-13 ranged between 5.70 and 7.30 per cent of revenue receipts. In view of the fact that these receipts were insignificant in total receipts of the State, in MTFP 2013-17, it was stated that ‘in order to balance the requirement of providing adequate funds to critical sectors of the economy while adhering to fiscal prudent norms, special emphasis needed to be given for mobilising non-tax revenue during the coming years by rationalizing user charges and reviewing the same regularly’. Audit is of the view that the user charges are required to be revised at regular intervals for more revenue generation.
Non tax revenues included ̀ 280.72 crore adjusted through book adjustment. These receipts comprise interest / guarantee receipts from Electricity Supply Companies (ESCOMS)/Special Purpose Vehicles (SPVs)/Government Corporations/ Companies treated as revenue / capital expenditure. The trend in collection of non-tax revenue under certain important heads of accounts is given in the Table 1.12 and Chart 1.7 below:
Table 1.12: Trends in collections of non-tax revenues.
(` in crore) Revenue head 2008-09 2009-10 2010-11 2011-12 2012-13
% (+) increase/ (-) decrease over
previous year Interest receipts 337.16 383.86 575.07 434.23 778.55 79.30 Dividend and profits
40.14 29.48 43.44 60.56 56.29 (-)7.05
Other non-tax receipts
2,781.69 2,920.45 2,739.77 3,592.07 3,131.26 (-)12.83
Total 3,158.99 3,333.79 3,358.28 4,086.86 3,966.10 (-)2.95
337 384 575 43477940 29 43 61
56
2,782 2,920 2,7403,592 3,131
0500
1,0001,5002,0002,5003,0003,5004,0004,500
2008-09 2009-10 2010-11 2011-12 2012-13
Other non-tax receipts
Dividendsand Profits
InterestReceipts
Chart 1.7: Growth trends of major non-tax revenue
(` in
cro
re)

17
Interest receipts
Apart from the regular source of interest receipts on account of loans and advances given by the Government to its Companies/Corporations etc., the other major source of interest proceeds is out of investment of surplus cash balance of the State held in RBI. As per the RBI’s regulations, the cash balance maintained by the State Government is invested in 14 day Treasury Bills (T-Bills). However, the average interest rate is around five to six per cent. After being pointed out in the Report on State Finances in earlier years and also on the advice of the RBI, in order to improve the cash management, the State Government decided to invest its surplus cash in 91 day T-Bills. In view of this, there was an increase in interest receipts on account of such investment.
The return on investment in the form of dividends declared by the companies and credited to Government account during the year was ` 56.29 crore. Considering the magnitude of Government investment (` 49,464 crore), the return works out to meagre 0.11 per cent. Similarly, the interest realized on loans and advances given by the Government to its Companies/Corporations stood at ` 246.63 crore working out to 2.03 per cent of the outstanding balances of loans at the end of the year.
Other non-tax receipts
During the years 2008-13, 77 per cent of the non-tax revenue on an average was on account of interest receipts, dividends, fees and fines and user charges for socio-economic services. The balance 23 per cent on an average represented the amounts received from GOI under the scheme of Debt Consolidation Relief Facility (DCRF), amounts written back from Public Account and pooling of cess collection under the head 1475 - Other General Economic Services. These transactions had no cash realisation and also did not account for any services provided /user charges and fees levied by the State Government but only represented inter account adjustment. Thus non-tax revenue reflected in Finance Accounts stood inflated by 23 per cent as revealed by the details of composition of non-tax revenue shown in Table 1.13.
Table 1.13: Details of non-cash adjustments under non-tax revenue
(` in crore) Particulars 2008-09 2009-10 2010-11 2011-12 2012-13
Relief under DCRF/Debt waiver 358 358 -- 170 -- Write back from Public Account 484 2 -- 2 -- Pooling of cess collection 365 386 516 634 -- Others 37 411 541 391 281 Total 1,244 1,157 1,057 1,197 281 Non-tax revenue 3,159 3,334 3,358 4,087 3,966 Percentage of non-cash transactions to non-tax revenue
39.38 34.70 31.48 29.29 7.09
The percentage of non-cash adjustments have decreased drastically from 39 per cent in 2008-09 to seven per cent in 2012-13. This was mainly on account of adjustments relating to the pooling of cess being avoided during the year.
During the year 2012-13 seven per cent of the non-tax revenue was inflated on account of adjustment relating to write-back of deposits lying in Public Account being taken as receipts under the Consolidated Fund (` 50 crore) and treatment of guarantee commission etc. payable by Companies/Corporations as book adjustment

18
by treating them as non-tax revenue.
The non-tax revenue was also deflated to the extent of ` 7.12 crore on account of non-remittance of the compensation amount to government account which is discussed at length in para 3.11.1.
In this regard the PAC in its 13th report submitted in December 2011, has recommended the following:
• To identify and bring out the non-cash transactions separately for the purpose of transparency.
• Elimination of all non-cash transactions for working out the fiscal indicators.
• Representatives of State Accountant’s General and Finance Department to work towards strengthening the system.
It may be mentioned here that the XIII FC had opined that accounting of debt waiver as non-tax revenue was not desirable as it artificially overstated the non-tax revenue of the State. Further, accounting of debt-waiver as non-tax revenue allowed the State to spend more within the same fiscal deficit cap, artificially reducing the intended impact on the debt stock of the State. Hence the XIII FC had recommended accounting of such transactions in such a manner that these did not artificially affect the revenue/fiscal deficit of the State.
Finance Department in its reply (December 2013) stated that these adjustments are authorised and are in line with generally accepted accounting principles. These adjustments although not in cash, do contribute to the non-tax revenue and hence are accounted as such. There is no standard fixed either by C&AG of India or by GOI to eliminate non-cash transactions for working out fiscal indicators. The PAC’s recommendations towards strengthening the system could be followed under the existing accounting procedures prescribed by the C&AG under Article 150 of the Constitution.
It may be mentioned here that the accounts of the Government are maintained on cash basis. The transactions are recognized when the cash is paid out or received in. In the books of accounts, expenditures are recorded at the time of payment, i.e. when a cheque is issued and receipts are recorded when these are reported by the collecting bank. Movements in the Government cash balance kept with RBI as a result of such payments and receipts are also simultaneously recorded in the account books. Thus, Government accounts are a record of cash flows into and out of the Consolidated Fund and Public Account and effect of these cash flows reflect on the Government’s liquidity position. As enunciated earlier and accepted by the State Government, the above transactions were non-cash ones. Therefore, a system is required to be put in place for filtering out such transactions for working out the fiscal indicators.
According to FRA, the State Government had to pursue non-tax revenue policies with due regard to cost recovery and equity. In MTFP 2011-15 as well as MTFP 2012-16, State Government has stated that ‘apart from enforcement and monitoring of own tax efforts, special emphasis was required to be given on mobilizing non-tax revenues in the coming years’. State Government further stated that it was committed to rationalizing user charges and review the same regularly.

19
1.3.2 Grants-in-aid from GOI
Grants-in-aid and contributions from GOI increased from ` 5,332 crore in 2008-09 to ` 7,809 crore in 2012-13 as shown in Table 1.14. However, compared to the previous year, there was a shortfall of ` 359 crore during the year. This was on account of decrease of ` 717 crore under grants for State Plan Schemes and ` 16 crore under grants for Centrally Sponsored Schemes offset by increased receipts (` 326 crore) under Non-plan grants and grants for Central Plan Schemes (` 48 crore).
Table 1.14: Grant-in-aid from GOI (` in crore)
Particulars 2008-09 2009-10 2010-11 2011-12 2012-13 Non-plan grants 1,693.59 3,429.68 2,256.86 2,129.42 2,455.43 Grants for State plan schemes 2,020.37 2,972.78 2,838.81 3,626.00 2,908.74 Grants for Central plan schemes 94.60 61.09 144.43 76.14 124.59 Grants for Centrally sponsored scheme 1,523.70 1,419.76 1,628.41 2,336.85 2,320.66 Grants for special plan schemes ----- --- --- --- ---
Total 5,332.26 7,883.31 6,868.51 8,168.41 7,809.42 % of increase/decrease over previous year
6.07 47.84 (-)12.87 18.93 (-)4.39
Total grants as % of revenue receipts 12.32 16.04 11.80 11.70 10.00 Source: Finance Accounts.
1.3.3 Central tax transfers
The XIII FC had recommended that the State’s share of Central Taxes be increased to 32 per cent from 30.50 per cent as recommended by Twelfth Finance Commission. The State’s share in the net proceeds of Central Taxes (excluding Service Tax) and net proceeds of Service Tax has been fixed at 4.33 and 4.40 per cent, respectively. The share of Union Taxes received during 2012-13 (` 12,647 crore) fell short of the estimate by ` 447 crore.
Increase of the State’s share of Union taxes and duties by ` 1,572 crore over the previous year was under Service Tax (` 525 crore), Corporation Tax (` 184 crore), Taxes on Income other than Corporation Tax (` 505 crore), Customs Duty (` 181 crore) and Union Excise Duties (` 186 crore) offset by decrease under Wealth Tax (` 9 crore).
1.3.4 Utilization of XIII FC grants
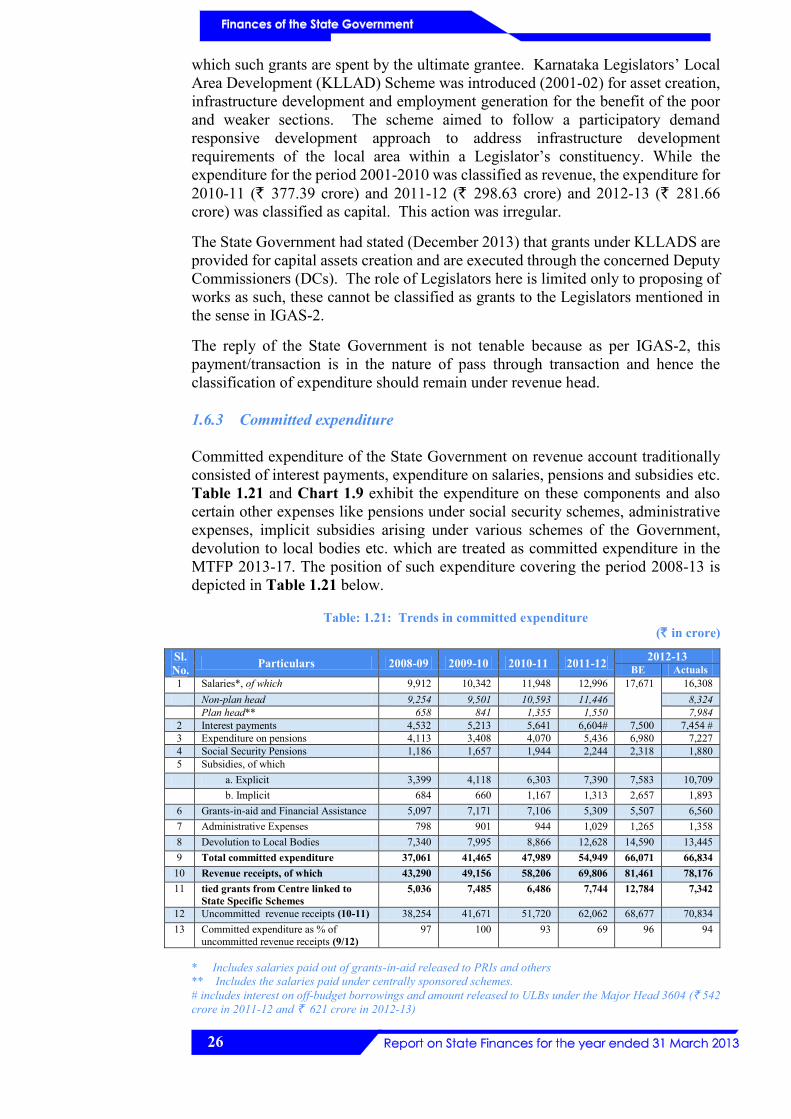
The Commission had recommended ` 2,227.62 crore as transfer to the State (excluding State specific grants) in the areas indicated in Table1.15 during 2012-13.
Table 1.15: Transfers recommended and actual release of Grants-in-aid (` in crore)
Sl. No. Transfers Recommendation
of FC Actual
Releases
Expenditure under relevant revenue heads
of account
Unutilized amount €
1 Local Bodies (a) Grants to PRIs 568.49 940.27
4,018.42*
---- (b) General Performance Grant to PRIs 390.10 (c) Grants to ULBs 251.41 281.43 (d) General Performance Grant to
ULBs 172.50
20
Sl. No. Transfers Recommendation
of FC Actual
Releases
Expenditure under relevant revenue heads
of account
Unutilized amount €
2 Disaster Relief (i) Disaster Relief Fund 133.10 133.10 133.10 --- (ii) Capacity Building 4.00 4.00 2.35 5.65
(including current year’s release)
3 Improving outcome grants (i) Improvement in Justice Delivery 53.94 Nil --- --- (ii) Incentive for issuing UIDs 27.78 Nil --- ---
(iii) Statistical Systems Improvement 5.80 Nil 4.59 Relates to previous year’s unutilized amount.
(iv) Employee and Pension Data Base Nil Nil --- 2.50
(v) District Innovation Fund 7.25 Nil 9.87 Relates to previous year’s unutilized amount.
4 Environment Related Grants a) Forest 55.26 54.74 54.51 0.72 b) Water Sector Management 32.00 Nil ---- ---
5 Elementary Education
135.00 135.00 135.00 ----
6 Roads and Bridges 391.00 391.00 97.75 403.78
Total 2,227.63 1,939.54 4,455.59 412.65
* inclusive of State’s share as per the recommendations of Third State Finance Commission € taking into account previous year’s unutilized money.
Two schemes which were aimed at improving the outcomes viz., incentive grants for issuing UIDs and creation of database of pensioners are discussed below.
Incentive for issuing UIDs: The total allocation to the State of Karnataka was fixed at ` 138.90 crore. This grant was fixed at ` 27.78 crore per annum and would be released in five annual instalments with two tranches per year on July 1 and January 1, of each year. The first tranche amounting to 1/10th of the State’s allocation was to be released on July 1, 2010. All subsequent instalments would be released on reimbursement basis as per the procedure prescribed. Fifty per cent of the first tranche of 10 per cent of the total allocation viz., ` 13.89 crore was released during 2010-11. Further instalments were not released as the State Government had not preferred claims against the Union Government.
Employees’ pension database: A grant of ̀ 10 crore was provided to each general category State to setup an employee and pensioners database. The database should also be designed to allow for subsequent extension to include other financial benefits (including GPF, insurance and health benefits) to employees as well as payment of defined benefit pensions and family pensions. All States who wish to setup these data base will be able to draw down ` 2.50 crore during 2010-11 without any precondition to commence work. The State Government received the first instalment of ` 2.50 crore during 2010-11. This amount continues to remain under the Consolidated Fund of the State without utilisation and hence is not in a position to get further releases.
As of March 31, 2013, the State Government had received grants aggregating ` 1,939.54 crore against recommendation of ` 2,227.63 crore.

21
State specific grants
The release of State specific grants was to be made only if the States enacted/ amended their FRA by incorporating the targets of fiscal consolidation path. The State of Karnataka adhered to the conditionality prescribed for release of such grants by amending the Act accordingly.
The State was entitled to receive grants towards State specific needs amounting to ` 325 crore against which the actual amount received was ` 100 crore only. The details of the funds earmarked vis-à-vis the actual amount received during the year are indicated in the Table 1.16 below.
Table 1.16: Details of receipt of State specific grants
(` in crore) Scheme head Amount earmarked
by XIII FC Actual receipt
Restoration of tanks and traditional bodies 87.50 Nil Drinking water 75.00 75.00 Infrastructure in Bangalore 100.00 Nil Heritage 25.00 25.00 Police training 37.50 Nil
Total 325.00 100.00
1.3.5 Foregone revenue
As per the requirements under Section 5(2)(c) of the FRA additional statements are brought out in the MTFP 2013-17 detailing the tax expenditure/revenue foregone by exemption or deferment of VAT, CST and Entry Tax. The details of such exemptions/revenue foregone during the years 2011-13 are indicated in Table 1.17.
Table 1.17: Details of exemptions/revenue foregone (` in crore)
Particulars 2011-12 2012-13
Value of exemption/concession – interest free loan 24.49 37.80
Value of exemption under CST/VAT/Entry Tax -- 902.82
Tax waivers through reimbursement/loan route 3.30 14.44
Interest free VAT loan 14.92 18.66
Total 42.71 973.72
Source: MTFP 2013-17
PAC in its 13th report, while recommending a system to oversee the collection of revenue had suggested to the State Government to discontinue the practice of giving discounts, waivers and exemptions while collecting taxes. However, the revenue foregone during 2012-13 by way of stamp duty and entry tax exemptions, re-imbursement of CST etc., was ` 973.72 crore.
Finance Department (December-2013) replied that the tax concessions in the form of waiver/discount/exemptions are conscious decisions taken by the State as a matter of policy for promoting certain sectors of the economy. Such concessions are provided with the objective of enabling a conducive environment to attract more

22
industries to the State. It has other benefits of providing employment to locals and boosting the economy. It is expected that it will ultimately compensate the revenue foregone by way of improvements in overall tax collection and faster growth of GSDP.
In this connection it may be stated that the State Government is yet to place the Action Taken Report on the recommendations of PAC. No exclusive studies have been conducted to justify the reply of the Government that the revenue foregone by way of tax concessions is being compensated with better compliance.
1.4 Capital Receipts
Capital receipts of the State Government include non-debt and debt receipts. The non-debt receipts include largely the sale of assets, issue of bonus shares, disinvestment proceeds and recoveries of loans and advances. As brought out in the MTFP 2013-17, in the recent past the State has been unable to realize the monetary potential out of the land available with it. Also due to sluggish real estate and various administrative hurdles, no additional revenue from such land sale had been possible during 2012-13.
The debt receipts include the public debt, which is further broken down into internal-debt and Loans and Advances from GOI. Internal debt is further divided into market borrowings, loans from financial institutions and special securities issued to National Small Savings Fund (NSSF) of the Central Government. The Public Debt receipts during the year (` 13,465 crore) comprised internal debt of ` 12,116 crore (90 per cent) and Loans and Advances from GOI ` 1,349 crore (10 per cent). Market borrowings had a predominant share under internal debt, comprising (89 per cent) followed by NSSF loans (four per cent) and negotiated loans (seven per cent). Loans from GOI comprised Plan loans only. The trends in composition of capital receipts during the period 2008-13 are indicated in Table 1.18.
Table 1.18: Trends in growth and composition of capital receipts
(` in crore and growth rate in per cent)
Overall, capital receipts increased from ` 8,830 crore in 2008-09 to ` 13,656 crore in 2012-13. Debt receipts had a predominant share in capital receipts and were between 93 and 99 per cent during 2008-13. The recovery towards loans and advances was very meagre during the period and amounted to 1.3 per cent of the outstanding loans and advances as at the end of 2012-13. It also included conversion of outstanding loans into grant/equity amounting to ` 16.13 crore during the year through book adjustment not involving cash transactions.
Sources of State’s capital receipts 2008-09 2009-10 2010-11 2011-12 2012-13
Capital Receipts (CR) 8,830 8,616 6,947 9,688 13,656 Misc. Capital Receipts 181 70 72 89 33 Recovery of Loans and Advances. 57 555 161 241 158 Public Debt receipts 8,592 7,991 6,714 9,358 13,465 Rate of growth of debt capital receipts 277 (-)6.99 (-)15.98 39.38 43.89 Rate of growth of non-debt capital receipts (-)20.13 162.61 (-)62.72 41.63 (-)42.12 Rate of growth of GSDP 14.7 8.8 18.2 15.0 14.5 Rate of growth of capital receipts (%) 242.65 (-)2.42 (-)19.37 39.46 40.96

23
1.5 Public Account Receipts
Receipts and disbursements in respect of certain transactions, such as small savings, Provident Fund, Reserve Funds, Deposits, Suspense, Remittances etc. which do not form part of the Consolidated Fund are kept in the Public Account set up under Article 266(2) of the Constitution and are not subject to vote by the State Legislature. Here, the Government acts as a banker trustee for custody of public money. The net transactions under public account covering the period 2008-13 are indicated in Table 1.19 below.
Table 1.19: Net transactions under Public Account (` in crore)
Resources under sectors of Public Account (Net) 2008-09 2009-10 2010-11 2011-12 2012-13
I. Small Savings, PF etc. 1,176 1,467 1,607 1,398 1,732 J. Reserve Funds 2,174 3,201 1,374 2,761 1,362 K. Deposits and Advances 1,554 1,909 2,037 1,410 2,511 L. Suspense and Misc. 968 602 (-)296 2,634 98 M. Remittances (-)51 (-)36 (-)34 (-)11 (-)32 Total 5,821 7,143 4,688 8,192 5,671
The net receipts from Public Account decreased from ` 5,821 crore in 2008-09 to ` 5,671 crore in 2012-13. The net availability of funds under Small Savings, PF, Reserve Funds and Deposits and Advances had a predominant share in financing the deficit.
1.6 Application of resources
Analysis of the allocation of expenditure at the State Government level assumes significance since major expenditure responsibilities are entrusted with them. Within the framework of fiscal responsibility legislations, there are budgetary constraints in raising public expenditure financed by deficit or borrowings. It is therefore important to ensure that the ongoing fiscal correction and consolidation process at the State level is not at the cost of expenditure, especially the expenditure directed towards development of social and economic sectors.
1.6.1 Growth and composition of expenditure
The basic parameters of total expenditure, growth rate and comparison with GSDP etc. are furnished in the Table 1.20.
Table 1.20: Total expenditure – Basic parameters (` in crore, rate & ratio in per cent)
2008-09 2009-10 2010-11 2011-12 2012-13
Total expenditure (TE)* 52,260 60,656 69,127 82,436 92,874
Rate of growth 11.7 16.1 14.0 19.2 12.7
GSDP 3,10,312 3,37,516 3,98,893 4,58,903 5,25,444
Rate of growth 14.7 8.8 18.2 15.0 14.5
TE/GSDP 16.8 18.0 17.3 18.0 17.7

24
Revenue receipts/ TE 82.8 81.0 84.2 84.7 84.2
Revenue expenditure 41,655 47,527 54,034 65,115 76,293
Rate of growth 11.5 14.1 13.7 20.5 17.2
Capital expenditure (including loans and advances)
10,605 13,129 15,093 17,321 16,581
Rate of growth 12.7 23.8 14.9 14.8 (-)4.3
Buoyancy of total expenditure with
GSDP 0.8 1.8 0.8 1.3 0.9
Revenue receipts 2.2 1.2 0.8 1.0 1.1
Buoyancy of revenue expenditure with
GSDP 0.8 1.6 0.8 1.4 1.2
Revenue receipts 2.2 1.0 0.7 1.0 1.4
*Total expenditure includes revenue expenditure, capital expenditure including loans and advances Source: Finances Accounts.
Chart 1.8 presents the trends in total expenditure over a period of five years (2008-13) and its composition under revenue, capital and loans and advances.
Source: Finance Accounts
Total expenditure increased by 78 per cent from ` 52,260 crore in 2008-09 to ` 92,874 crore in 2012-13 due to increase in revenue expenditure (` 34,638 crore), capital outlay (` 5,605 crore) and disbursement of loans and advances (` 371 crore).
During the period 2008-13, on an average, 79 per cent of the total expenditure was revenue expenditure. The share of revenue expenditure in the total expenditure, which had decreased from 80 per cent in 2008-09 to 78 per cent in 2009-11, increased to 79 per cent in 2011-12 and further increased to 82 per cent during the current year mainly on account of implementation of the recommendations of Sixth Pay Commission (SPC). However, the share of capital expenditure (including loans and advances) which had increased from 20 per cent in 2008-09 to 22 per cent in 2009-11, decreased marginally and was 21 per cent in 2011-12 and further decreased to 18 per cent during the year on account of reduced expenditure on capital account (` 27 crore) and loans and advances (` 713 crore). The Expenditure Reforms Commission (ERC) in their first report (February 2010) had recommended capital investments to be stepped up and protected from fiscal uncertainties through
52,260
60,65669,127
82,43692,874
41,65547,527
54,034
65,11576,293
31,12935,234 38,846
46,548
55,081
9,874 12,147 13,355 15,506 15,479
731 982 1,738 1,815 1,1020
5,00010,00015,00020,00025,00030,00035,00040,00045,00050,00055,00060,00065,00070,00075,00080,00085,00090,00095,000
2008-09 2009-10 2010-11 2011-12 2012-13
(`in
Cro
re)
Chart 1.8: Total expenditure :Trends and composition
Total expenditure Revenue expenditureNon-plan revenue expenditure Capital expenditureLoans and advances

25
prudent allocations. It had also recommended maintaining the capital expenditure (excluding debt servicing) at five per cent of GSDP. The ratio of capital expenditure to GSDP which was at four per cent during 2010-11, however, dropped to three per cent during the remaining period 2011-13.
The revenue expenditure during 2012-13 included ̀ 14.69 crore provided to cashew nut, areca nut growers and utensil dealers being the adjustment of waiver of tax (` 7.84 crore) and interest (` 6.45 crore), waiver of VAT and penalty (` 0.40 crore) and treating the amount as tax revenues through book adjustments.
The State Government took the approval of legislature stating that neither the Karnataka Value Added Tax Act nor the Central Sales Tax Act had any provision for re-imbursement / waiver of tax. State Government stated (November 2012/ December 2013) that once the Legislature’s approval was obtained for any taxation provision, Executive had no authority to refund the tax collected in the absence of enabling provision. Therefore, the payments were made under the prevailing development policies.
The accounting treatment is technically incorrect. Suitable legislation under the relevant Act should have been brought before the Legislature for granting concession/exemption. In the absence of relevant provision for exemption/waiver under VAT/CST, the State Government is resorting to seeking approval of the Legislature to treat the tax expenditure as revenue expenditure, which is irregular.
1.6.2 Revenue expenditure Revenue expenditures comprise of day-to-day expenditures of the Government, wages and salaries, pensions, interest payments, expenditure on operation and maintenance of capital works, subsidies and transfers to local bodies, co-operatives, NGOs and others. Expenditure can also be classified into various functional categories such as administrative services, social services and economic services. Expenditure on social and economic services is incurred to create physical infrastructure and human resource development and, therefore, is considered productive, whereas expenditure on general administration and debt servicing are considered unproductive.
Prudent fiscal management should aim at creating savings by raising revenue receipts in excess of revenue expenditures. The revenue balance is called Government’s savings, which is used to finance capital expenditure. Use of borrowed funds for either directly revenue yielding activities or indirectly productive uses creates returns by way of tax or non-tax revenues which can be used for debt servicing and repayment of loans.
Revenue expenditure increased from ` 41,655 crore in 2008-09 to ` 76,293 crore in 2012-13, an increase of 83 per cent. The revenue expenditure buoyancy during the year was 1.2 times compared to GSDP. Compared to previous year, the increase was by 17 per cent, due to implementation of the recommendations of Sixth Pay Commission. It included ` 1,217.03 crore made through book adjustments. The transaction was in the nature of treating the dues of ESCOMs / Transport Corporations / guarantee dues as revenues and treating the same as expenditure on the Consolidated Fund involving subsidy, financial assistance / relief etc.
According to Indian Government Accounting Standards (IGAS)-2, which came into force with effect from April 1, 2011, all grants-in-aid are in the nature of pass through grants and shall be classified and accounted as revenue expenditure in financial statements of Union/State Governments irrespective of the purpose for
26
which such grants are spent by the ultimate grantee. Karnataka Legislators’ Local Area Development (KLLAD) Scheme was introduced (2001-02) for asset creation, infrastructure development and employment generation for the benefit of the poor and weaker sections. The scheme aimed to follow a participatory demand responsive development approach to address infrastructure development requirements of the local area within a Legislator’s constituency. While the expenditure for the period 2001-2010 was classified as revenue, the expenditure for 2010-11 (` 377.39 crore) and 2011-12 (` 298.63 crore) and 2012-13 (` 281.66 crore) was classified as capital. This action was irregular.
The State Government had stated (December 2013) that grants under KLLADS are provided for capital assets creation and are executed through the concerned Deputy Commissioners (DCs). The role of Legislators here is limited only to proposing of works as such, these cannot be classified as grants to the Legislators mentioned in the sense in IGAS-2.
The reply of the State Government is not tenable because as per IGAS-2, this payment/transaction is in the nature of pass through transaction and hence the classification of expenditure should remain under revenue head.
1.6.3 Committed expenditure
Committed expenditure of the State Government on revenue account traditionally consisted of interest payments, expenditure on salaries, pensions and subsidies etc. Table 1.21 and Chart 1.9 exhibit the expenditure on these components and also certain other expenses like pensions under social security schemes, administrative expenses, implicit subsidies arising under various schemes of the Government, devolution to local bodies etc. which are treated as committed expenditure in the MTFP 2013-17. The position of such expenditure covering the period 2008-13 is depicted in Table 1.21 below.
Table: 1.21: Trends in committed expenditure (` in crore)
* Includes salaries paid out of grants-in-aid released to PRIs and others ** Includes the salaries paid under centrally sponsored schemes. # includes interest on off-budget borrowings and amount released to ULBs under the Major Head 3604 (` 542 crore in 2011-12 and ` 621 crore in 2012-13)
Sl. No. Particulars 2008-09 2009-10 2010-11 2011-12 2012-13
BE Actuals 1 Salaries*, of which 9,912 10,342 11,948 12,996 17,671 16,308 Non-plan head 9,254 9,501 10,593 11,446 8,324 Plan head** 658 841 1,355 1,550 7,984 2 Interest payments 4,532 5,213 5,641 6,604# 7,500 7,454 # 3 Expenditure on pensions 4,113 3,408 4,070 5,436 6,980 7,227 4 Social Security Pensions 1,186 1,657 1,944 2,244 2,318 1,880 5 Subsidies, of which
a. Explicit 3,399 4,118 6,303 7,390 7,583 10,709 b. Implicit 684 660 1,167 1,313 2,657 1,893
6 Grants-in-aid and Financial Assistance 5,097 7,171 7,106 5,309 5,507 6,560 7 Administrative Expenses 798 901 944 1,029 1,265 1,358 8 Devolution to Local Bodies 7,340 7,995 8,866 12,628 14,590 13,445 9 Total committed expenditure 37,061 41,465 47,989 54,949 66,071 66,834
10 Revenue receipts, of which 43,290 49,156 58,206 69,806 81,461 78,176 11 tied grants from Centre linked to
State Specific Schemes 5,036 7,485 6,486 7,744 12,784 7,342
12 Uncommitted revenue receipts (10-11) 38,254 41,671 51,720 62,062 68,677 70,834 13 Committed expenditure as % of
uncommitted revenue receipts (9/12) 97 100 93 69 96 94

27
Source: Finance Accounts
The State’s revenue expenditure growth is characterized by a large portion of it being committed expenditure, thereby leaving little room for maneuverability for furthering other capital investments to meet the growing needs of social and economic infrastructure. As brought out in MTFP-2013-17, the State has been increasingly relying on Public Private Partnership to fill these investment gaps. However, these infrastructure challenges remain large and require public investment to encourage private investment to supplement. There is also increasing demand on the public resources in the light of statutory legislations like Right to Education, Food Security Act and Employment Guarantee measures etc. These emerging concerns necessitate a review of public resources as a whole to access their allocative and technical efficiency. As brought out in the table above, the ratio of uncommitted revenue receipts to the committed expenditure has been steadily increasing. Medium term correction on the expenditure side is required to moderate such committed expenditure as a percentage of uncommitted revenue receipts.
Expenditure on salaries
Expenditure on salaries increased from ` 9,912 crore in 2008-09 to ` 16,308 crore during the year. The expenditure also included the salary expenditure relating to the employees of Panchayat Raj Institutions (PRIs) also (` 9,106 crore). The increase of ̀ 3,312 crore during the year compared to previous year was on account of implementation of Sixth Pay Commission award. The salary expenditure in the Finance Accounts captured data in respect of State sector only. The salaries in respect of district sector (Employees of PRIs) are released as grants-in-aid to those bodies. Thus, the total salary expenditure is not captured in accounts. The salary expenditure excluding the salary grant relating to Urban Local Bodies (ULBs) of the State was 26 per cent of revenue expenditure net of interest payment and pensions, within the norms of 35 per cent fixed by TFC.
The Finance Department in its reply (December 2013) stated that salaries of district sector employees (both ZP and TP) are drawn based on head of account in the link document. Though salary of district sector is exclusively released from State sector, it is credited to Panchayat Body Fund in Public Account for drawal. The salaries under district sector are compiled ZP/TP wise. These are not being consolidated
0
5000
10000
15000
20000
25000
2008-09 2009-10 2010-11 2011-12 2012-13
Salaries
InterestPayments
Pensions
ExplicitSubsidies
ImplicitSubsidies
Others
Chart 1.9: Committed expenditure during 2008-13
(` in
Cro
re)
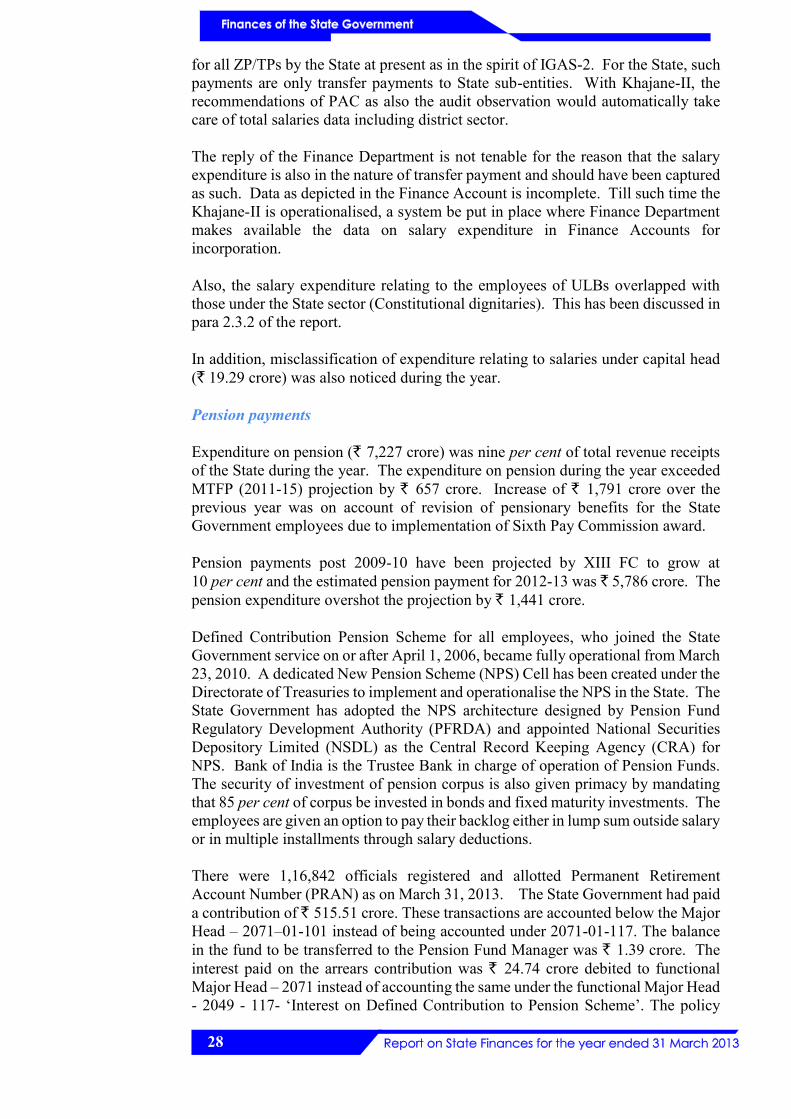
28
for all ZP/TPs by the State at present as in the spirit of IGAS-2. For the State, such payments are only transfer payments to State sub-entities. With Khajane-II, the recommendations of PAC as also the audit observation would automatically take care of total salaries data including district sector.
The reply of the Finance Department is not tenable for the reason that the salary expenditure is also in the nature of transfer payment and should have been captured as such. Data as depicted in the Finance Account is incomplete. Till such time the Khajane-II is operationalised, a system be put in place where Finance Department makes available the data on salary expenditure in Finance Accounts for incorporation.
Also, the salary expenditure relating to the employees of ULBs overlapped with those under the State sector (Constitutional dignitaries). This has been discussed in para 2.3.2 of the report.
In addition, misclassification of expenditure relating to salaries under capital head (` 19.29 crore) was also noticed during the year.
Pension payments
Expenditure on pension (` 7,227 crore) was nine per cent of total revenue receipts of the State during the year. The expenditure on pension during the year exceeded MTFP (2011-15) projection by ` 657 crore. Increase of ` 1,791 crore over the previous year was on account of revision of pensionary benefits for the State Government employees due to implementation of Sixth Pay Commission award.
Pension payments post 2009-10 have been projected by XIII FC to grow at 10 per cent and the estimated pension payment for 2012-13 was ` 5,786 crore. The pension expenditure overshot the projection by ` 1,441 crore.
Defined Contribution Pension Scheme for all employees, who joined the State Government service on or after April 1, 2006, became fully operational from March 23, 2010. A dedicated New Pension Scheme (NPS) Cell has been created under the Directorate of Treasuries to implement and operationalise the NPS in the State. The State Government has adopted the NPS architecture designed by Pension Fund Regulatory Development Authority (PFRDA) and appointed National Securities Depository Limited (NSDL) as the Central Record Keeping Agency (CRA) for NPS. Bank of India is the Trustee Bank in charge of operation of Pension Funds. The security of investment of pension corpus is also given primacy by mandating that 85 per cent of corpus be invested in bonds and fixed maturity investments. The employees are given an option to pay their backlog either in lump sum outside salary or in multiple installments through salary deductions.
There were 1,16,842 officials registered and allotted Permanent Retirement Account Number (PRAN) as on March 31, 2013. The State Government had paid a contribution of ` 515.51 crore. These transactions are accounted below the Major Head – 2071–01-101 instead of being accounted under 2071-01-117. The balance in the fund to be transferred to the Pension Fund Manager was ` 1.39 crore. The interest paid on the arrears contribution was ` 24.74 crore debited to functional Major Head – 2071 instead of accounting the same under the functional Major Head - 2049 - 117- ‘Interest on Defined Contribution to Pension Scheme’. The policy

29
decision on the operationalisation of scheme in respect of those drawing their salary through Boards/Corporations is yet to be finalised. The amounts held in treasuries which are yet to be transferred to the Trustee Banks was ` 1.39 crore. Thus accounting of transactions under heads not specified for the purpose inflated the expenditure under those heads. Further, the interest expenditure of the State Government was understated to the extent of ` 24.74 crore.
The transactions relating to NPS are required to be accounted under Minor Head- 117 below the Major Head 8342 – Other deposits for the said scheme as per the correction slip issued to List of Major and Minor Heads of account. However, the Public Account in Finance Accounts has reflected the scheme transactions under Minor Head - 120 with three tiers for Employee’s contribution, Government’s contribution and Interest on Government contribution respectively.
The payment of pension and other retirement benefits to All India Service officers prior to April 1, 2008 was a liability which was to be borne by the State Government. As per the new procedure introduced from April 1, 2008, the liability on account of pension payments are to be borne by GOI and these liabilities are to be booked under suspense head - 8658 and a demand raised for reimbursement from GOI. A sum of ` 9.56 crore was outstanding settlement, being the pensionary benefits disbursed to All India Service officers. However, as the amount authorized for the years 2008-10, which was part of revenue expenditure in those years, were yet to be assessed, the suspense head - 8568 was understated to that extent.
Social Security Pension
Expenditure under this category comprises financial assistance to the elderly, destitute widows, physically challenged who are given assistance/relief on a monthly basis. The expenditure on this count has risen from ` 1,186 crore in 2008-09 to ` 1,880 crore during the year. There was a decrease of ` 364 crore compared to previous year. The salient features of the schemes are as under.
Maintenance allowance to the disabled: Persons with disability range of 40 per cent to 75 per cent and above 75 per cent are paid a monthly maintenance allowance of ` 400 and ` 1,000 per month respectively.
Sandhya Suraksha: Persons aged above 65 years and having income less than ` 20,000 per annum are paid ` 400 per month as pension. The intended beneficiary should be from the occupational groups of small farmers, marginal farmers, agricultural labourers, weavers, fishermen, labourers from unorganized sector.
Destitute Widow Pension: A financial assistance at ` 400 per month is provided to any woman aged above 18 years on the demise of her husband and whose income is less than ` 6,000 per annum.
Interest payments
Interest payments increased by ` 2,922 crore from ` 4,532 crore in 2008-09 to ` 7,454 crore in 2012-13. Interest payments during 2012-13 constituted interest on internal debt (` 4,823 crore), interest on small savings, provident fund etc., (` 1,246 crore), interest on loans and advances from Central Government (` 761 crore) and interest on off-budget borrowings (` 621 crore).

30
The interest on internal debt increased by 15 per cent from ` 4,186 crore in 2011-12 to ` 4,823 crore in 2012-13 on account of increase in payment of interest on market loans by ` 704 crore (38 per cent), partly offset by decrease in interest on special securities by ` 83 crore (four per cent) issued to NSSF of the Central Government by the State Government. This is on account of the recommendations of XIII FC, which stated that all loans contracted till 2006-07 and outstanding at the end of 2009-10 be re-set at a common rate of interest of nine per cent per annum in place of 10.5 or 9.5 per cent. While the XIII FC had projected interest relief of ` 118 crore, the actual relief was ` 83 crore.
The interest on small savings, provident funds etc. increased by ` 145 crore (13 per cent) from ` 1,100 crore during 2011-12 to ` 1,246 crore in 2012-13, mainly on account of increase in interest on State provident funds and insurance and pension funds by 14 and 18 per cent, respectively, relative to the previous year.
The interest payment of ` 621 crore towards off-budget borrowings/others, which was being classified under capital account till 2010-11, was classified as revenue expenditure from 2011-12 in terms of section 2(f) of FRA. The PAC in its report had observed that borrowings based on availability rather than necessity, also contributed to the increase in the interest payments.
The ratio of interest payments to revenue receipts determines the debt sustainability of the State. During the year the ratio of interest payments to total revenue receipts of the State was 10 per cent, which was well within the TFC norm of 15 per cent.
Subsidies
In any welfare State it is not uncommon to provide subsidies/subventions to disadvantaged sections of the society. Subsidies are dispensed not only explicitly but also implicitly by providing subsidised public services to the people. Budgetary support to financial institutions, inadequate returns on investments and poor recovery of user charges from social and economic services provided by the Government fall in the category of implicit subsidies.
Finance Accounts (Appendix 3) showed an explicit subsidy of ` 10,709 crore during the year which was ` 3,319 crore more than the previous year. The increase in its growth rate was 45 per cent. Subsidy payments during the year were mainly in the areas of power (` 7,050 crore), food (` 991 crore), transport (` 385 crore), co-operation (` 1,323 crore), housing (` 280 crore) and urban development (` 86 crore). The details are given in Box 1.1.
In MTFP (2013-17) Government has stated that subsidies provided by the State could be of two kinds, one where State explicitly provides for expenditure in nature of subsidy or interest subvention for certain schemes of the Government. The three largest explicit subsidy outgoes for the State is power subsidy provided for supply of free electricity to farmers for usage of agricultural pump sets, food subsidy and interest subsidy for crop loans. It was also stressed that the challenge lies in ensuring that these subsidies do not become a permanent source of additional support and thereby deter these sectors from undertaking reforms.

31
Implicit subsidies:
Implicit subsidies inter-alia arise when the Government is unable to recover the costs it incurs in the provision of social and economic goods/services, which are mainly private goods/services in nature, even though sometimes these may have extended benefits. It can be indirect, can also be in kind or take the shape of tax concessions. Some of the implicit subsidies extended during 2012-13 are detailed in Appendix 1.7.
Major subsidies
Power
During the year, subsidy to power sector (` 7,050 crore) accounted for 66 per cent of the total subsidy (` 10,709 crore). It included financial assistance to electricity supply companies to cover loss due to rural electrification (` 6,500 crore) and contribution towards pension (` 550 crore).
Subsidy on rural electrification during the year, however, did not include subsidy of ` 9 crore (net) given to the Karnataka Power Transmission Corporation Limited (KPTCL) for meeting its debt servicing obligations to Power Finance Corporation (PFC) and Rural Electrification Corporation (REC). Finance Accounts did not show this liability as these loans were not taken over by the Government. The State Government had also paid subsidy of ` 438 crore in 2007-12. Though the Government had stated (November 2007) that borrowings would be included on off-budget side in 2008-09, neither did MTFPs 2007-11 to 2013-17 nor overview of budget 2009-10 to 2013-14 exhibited this liability on off-budget side. In the MTFP 2013-17 it is stated that the long term borrowing of KPTCL amounting to ` 1,050 crore has been taken over by the Government of which PFC loan was ` 750 crore and REC loan was ` 271 crore and that the State is expected to repay all dues by 2016-17.
Food
Food subsidy to meet the differential cost of food grains under Public Distribution System (PDS), had increased to ` 991 crore in 2012-13 from ` 791 crore in 2011-12.
Co-operation
Subsidy in the co-operative sector predominantly represented waiver of overdue loans (principal as well as interest) given to farmers. Such waiver of loans and interest aggregated ` 4,208 crore in 2007-08 (` 1,793 crore), 2008-09 (` 186 crore), 2009-10 (` 124 crore), 2010-11 (` 335 crore), 2011-12 (` 447 crore) and 2012-13 (` 1,323 crore).
According to Vaidyanathan Committee Report (March 2008), and as reiterated by the PAC, the Governments both at the Centre and in the States should desist from the practice of waiver of recovery of loans and interest to prevent deterioration of co-operative credit system.
Transport
Transport subsidy had increased from ` 309 crore in 2011-12 to ` 385 crore in 2012-13. This was towards fare concession extended to students, freedom fighters, physically challenged, etc.
The State Government in its reply (August 2012) stated that Transport Corporations were incurring heavy expenditure on account of the above bus passes and also stated that if the Corporations had to bear the entire subsidy expenditure, then they would incur heavy losses.
The PAC in its 13th report (December 2011) had recommended that the said subsidy be borne by the corporations with-in their resources as these were earning profits and were working on commercial lines.
Box – 1.1
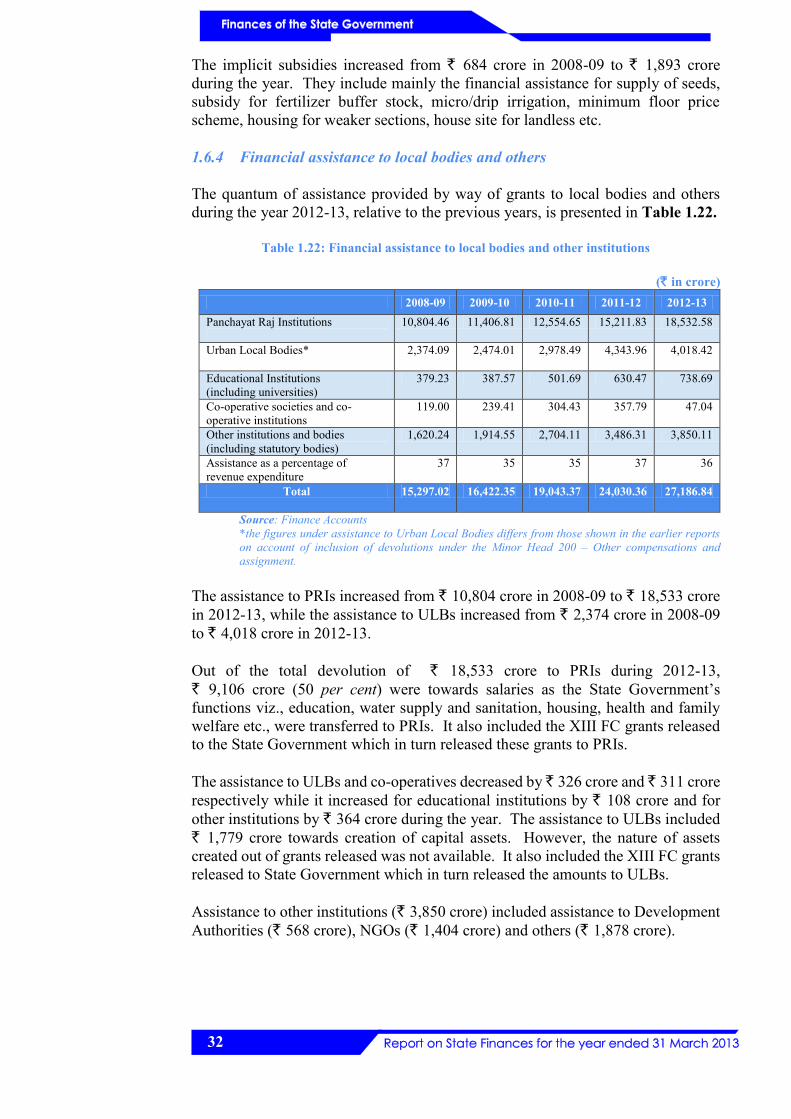
32
The implicit subsidies increased from ` 684 crore in 2008-09 to ` 1,893 crore during the year. They include mainly the financial assistance for supply of seeds, subsidy for fertilizer buffer stock, micro/drip irrigation, minimum floor price scheme, housing for weaker sections, house site for landless etc.
1.6.4 Financial assistance to local bodies and others
The quantum of assistance provided by way of grants to local bodies and others during the year 2012-13, relative to the previous years, is presented in Table 1.22.
Table 1.22: Financial assistance to local bodies and other institutions
(` in crore) 2008-09 2009-10 2010-11 2011-12 2012-13 Panchayat Raj Institutions
10,804.46 11,406.81 12,554.65 15,211.83 18,532.58
Urban Local Bodies*
2,374.09 2,474.01 2,978.49 4,343.96 4,018.42
Educational Institutions (including universities)
379.23 387.57 501.69 630.47 738.69
Co-operative societies and co-operative institutions
119.00 239.41 304.43 357.79 47.04
Other institutions and bodies (including statutory bodies)
1,620.24 1,914.55 2,704.11 3,486.31 3,850.11
Assistance as a percentage of revenue expenditure
37 35 35 37 36
Total 15,297.02 16,422.35 19,043.37 24,030.36 27,186.84
Source: Finance Accounts *the figures under assistance to Urban Local Bodies differs from those shown in the earlier reports on account of inclusion of devolutions under the Minor Head 200 – Other compensations and assignment.
The assistance to PRIs increased from ` 10,804 crore in 2008-09 to ` 18,533 crore in 2012-13, while the assistance to ULBs increased from ` 2,374 crore in 2008-09 to ` 4,018 crore in 2012-13.
Out of the total devolution of ` 18,533 crore to PRIs during 2012-13, ` 9,106 crore (50 per cent) were towards salaries as the State Government’s functions viz., education, water supply and sanitation, housing, health and family welfare etc., were transferred to PRIs. It also included the XIII FC grants released to the State Government which in turn released these grants to PRIs.
The assistance to ULBs and co-operatives decreased by ` 326 crore and ̀ 311 crore respectively while it increased for educational institutions by ` 108 crore and for other institutions by ` 364 crore during the year. The assistance to ULBs included ` 1,779 crore towards creation of capital assets. However, the nature of assets created out of grants released was not available. It also included the XIII FC grants released to State Government which in turn released the amounts to ULBs.
Assistance to other institutions (` 3,850 crore) included assistance to Development Authorities (` 568 crore), NGOs (` 1,404 crore) and others (` 1,878 crore).

33
1.7 Quality of expenditure
The availability of better social and physical infrastructure in the State generally reflects the quality of its expenditure. The improvement in the quality of expenditure basically involves three aspects, viz., adequacy of the expenditure (i.e. adequate provisions for providing public services), efficiency of expenditure and its effectiveness.
1.7.1 Adequacy of public expenditure
The expenditure responsibilities relating to social sector and economic infrastructure, assigned to the State Governments, are largely State subjects. Enhancing human development levels requires the States to step up their expenditure on key social services like education, health, etc. Low fiscal priority (ratio of expenditure category to aggregate expenditure) can be stated to have been attached to a particular sector if the priority given to that particular head of expenditure is below the General Category States’ average for that year.
Table 1.23 analyses the fiscal priority of the State Government with regard to development expenditure, social expenditure and capital expenditure relative to General Category States in 2009-10 and the current year 2012-13.
Table 1.23: Fiscal priority of the State in 2009-10 and 2012-13 (` in crore)
Fiscal Priority by the State AE/ GSDP
DE#/ AE
SSE/ AE
CE/ AE
Education/ AE
Health/ AE
*General Category States Average (Ratio) 2009-10
17.06 66.05 35.73 14.96 16.19 4.24
Karnataka State’s Average (Ratio) 2009-10
17.97 74.06 37.22 21.64 14.49 3.71
*General Category States Average (Ratio) 2012-13
15.93 65.79 32.77 13.23 17.23 4.47
Karnataka State’s Average (Ratio) 2012-13
17.67 73.29 36.77 17.85 16.13 4.23
AE: Aggregate Expenditure, DE: Development Expenditure, SSE: Social Sector Expenditure CE: Capital Expenditure # Development expenditure includes Development Revenue Expenditure, Development Capital Expenditure and Loans and Advances disbursed. Source: For GSDP, the information was collected from the State’s Directorate of Economics and Statistics. *General category States excludes three States i.e., Delhi, Goa and Puducherry
Comparative analysis reveals the following:
The State’s spending ratio of aggregate expenditure to GSDP decreased marginally during 2012-13 compared to 2009-10.
Development expenditure as a proportion of aggregate expenditure in the State has also been higher than the General Category States’ average. Development expenditure consists of both economic and social service sector expenditure. The social sector expenditure as a proportion of aggregate expenditure in the State, which was higher than that of the General Category States in 2009-10, has decreased marginally in 2012-13. As observed from the Table 1.23, adequate priority needs to be given to both education and health sectors as the ratio under both these sectors are well below the General Category States’ average during 2012-13.

34
Priority has been given by the State Government to capital expenditure in 2009-10 and 2012-13, as the ratio of capital expenditure to aggregate expenditure has been higher than the average ratio of General Category States.
1.7.2 Efficiency of expenditure
In view of the importance of public expenditure on social and economic development, it is imperative for the State Governments to take appropriate expenditure rationalization measures and lay emphasis on provision of core public and merit goods4. Apart from improving the allocation towards development expenditure5, the efficiency of expenditure use is also reflected by the ratio of capital expenditure to total expenditure and proportion of revenue expenditure being spent on operation and maintenance of the existing social and economic services. The higher the ratio of these components to total expenditure, the better would be the quality of expenditure. While Table 1.24 presents the trends in development expenditure relative to the aggregate expenditure of the State during the year 2012-13 vis-à-vis that of previous years, Table 1.25 provides the details of capital expenditure and the components of revenue expenditure incurred on the maintenance of the selected social and economic services.
Table 1.24: Development expenditure (` in crore)
2008-09 2009-10 2010-11 2011-12 2012-13
Development expenditure (DE) 37,134 44,925 51,626 60,930 68,067 Percentage of DE to total expenditure 71 74 75 74 73 Components of DE Revenue 27,006 32,291 37,000 44,326 52,094
(73) (72) (72) (73) (76) Capital 9,399 11,657 12,890 14,880 14,889
(25) (26) (25) (24) (22) Loans and advances 729 977 1,738 1,724 1,084
(2) (2) (3) (3) (2) Source: Finance Accounts. Figures in brackets indicate percentage to development expenditure.
Development expenditure increased from ` 37,134 crore in 2008-09 to ` 68,067 crore in 2012-13. As a percentage of total expenditure, it increased from 71 in 2008-09 to 75 in 2010-11 and thereafter decreased further to 74 per cent in 2011-12 and further by a percentage point to 73 in 2012-13. On an average, 73 per cent of the development expenditure was on revenue account while capital expenditure including loans and advances accounted for the balance during 2008-13.
4Core public goods are those which all citizens enjoy in common in the sense that each individual's consumption of such goods leads to no subtractions from any other individual's consumption of those goods, e.g. enforcement of law and order, security and protection of citizen’s rights; pollution free air and other environmental goods and road infrastructure etc. Merit goods are commodities that the public sector provides free or at subsidized rates because an individual or society should have them on the basis of some concept of need, rather than ability and willingness to pay the Government and therefore wishes to encourage their consumption. Examples of such goods include the provision of free or subsidized food for the poor to support nutrition, delivery of health services to improve quality of life and reduce morbidity, providing basic education to all, drinking water and sanitation etc. 5The analysis of expenditure data is segregated into development and non-development expenditure. All expenditure relating to revenue account, capital outlay and loans and advances is categorized into social, economic and general services. Broadly, the social and economic services constitute development expenditure, while expenditure on general services is treated as non-development expenditure.
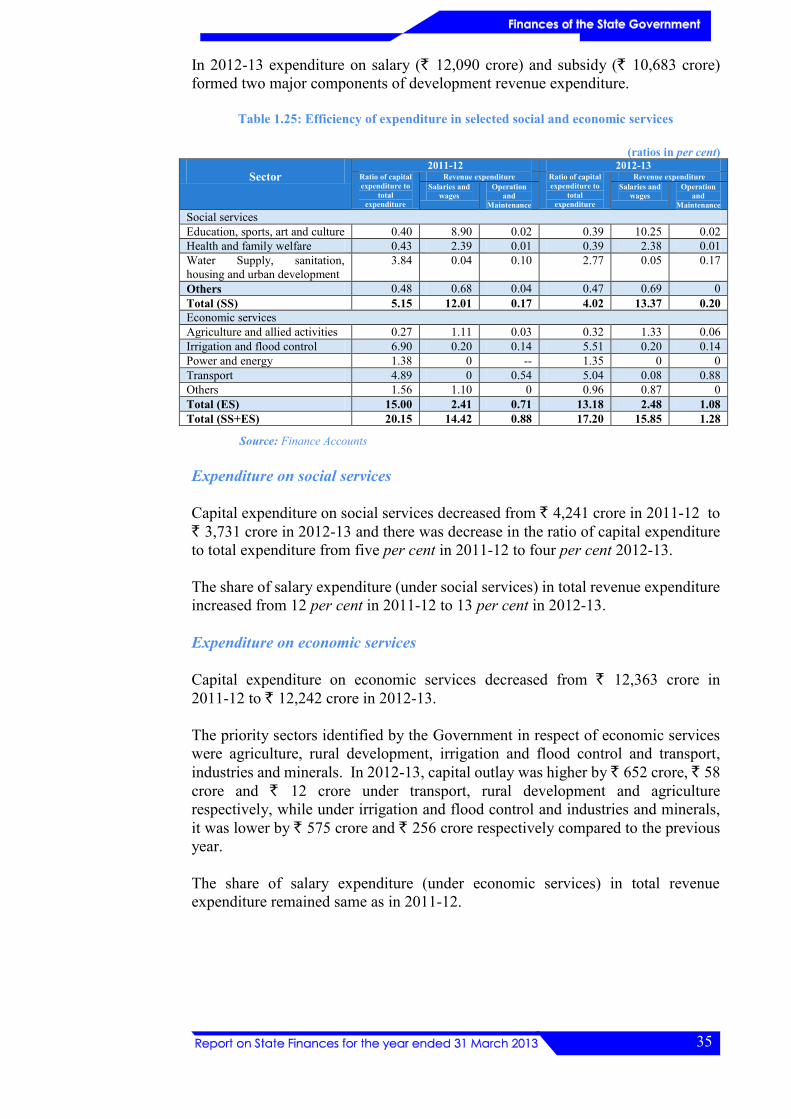
35
In 2012-13 expenditure on salary (` 12,090 crore) and subsidy (` 10,683 crore) formed two major components of development revenue expenditure.
Table 1.25: Efficiency of expenditure in selected social and economic services
(ratios in per cent)
Sector 2011-12 2012-13
Ratio of capital expenditure to
total expenditure
Revenue expenditure Ratio of capital expenditure to
total expenditure
Revenue expenditure Salaries and
wages Operation
and Maintenance
Salaries and wages
Operation and
Maintenance
Social services Education, sports, art and culture 0.40 8.90 0.02 0.39 10.25 0.02 Health and family welfare 0.43 2.39 0.01 0.39 2.38 0.01 Water Supply, sanitation, housing and urban development
3.84 0.04 0.10 2.77 0.05 0.17
Others 0.48 0.68 0.04 0.47 0.69 0 Total (SS) 5.15 12.01 0.17 4.02 13.37 0.20 Economic services Agriculture and allied activities 0.27 1.11 0.03 0.32 1.33 0.06 Irrigation and flood control 6.90 0.20 0.14 5.51 0.20 0.14 Power and energy 1.38 0 -- 1.35 0 0 Transport 4.89 0 0.54 5.04 0.08 0.88 Others 1.56 1.10 0 0.96 0.87 0 Total (ES) 15.00 2.41 0.71 13.18 2.48 1.08 Total (SS+ES) 20.15 14.42 0.88 17.20 15.85 1.28
Source: Finance Accounts
Expenditure on social services
Capital expenditure on social services decreased from ` 4,241 crore in 2011-12 to ` 3,731 crore in 2012-13 and there was decrease in the ratio of capital expenditure to total expenditure from five per cent in 2011-12 to four per cent 2012-13.
The share of salary expenditure (under social services) in total revenue expenditure increased from 12 per cent in 2011-12 to 13 per cent in 2012-13.
Expenditure on economic services
Capital expenditure on economic services decreased from ` 12,363 crore in 2011-12 to ` 12,242 crore in 2012-13.
The priority sectors identified by the Government in respect of economic services were agriculture, rural development, irrigation and flood control and transport, industries and minerals. In 2012-13, capital outlay was higher by ` 652 crore, ` 58 crore and ` 12 crore under transport, rural development and agriculture respectively, while under irrigation and flood control and industries and minerals, it was lower by ` 575 crore and ` 256 crore respectively compared to the previous year.
The share of salary expenditure (under economic services) in total revenue expenditure remained same as in 2011-12.

36
1.8 Financial Analysis of Government expenditure and investments
In the post-FRA framework, the Government is expected to keep its fiscal deficit (borrowing) not only at low levels but also meet its capital expenditure/investment (including loans and advances) requirements. In addition, the State Government needs to initiate measures to earn adequate return on its investments and recover cost of borrowed funds rather than bearing the same in the form of implicit subsidy and take requisite steps to infuse transparency in financial operations. This section presents the broad financial analysis of investments and other capital expenditure undertaken by the Government during the 2012-13 vis-à-vis previous years.
1.8.1 Incomplete projects Locking up of funds on incomplete works include works stopped due to reasons like litigation, etc., impinge negatively on the quality of expenditure. The department-wise information pertaining to incomplete projects as of March 31, 2013 is given in Table 1.26.
Table 1.26: Incomplete projects (` in crore)
Department
Incomplete projects Cumulative expenditure as of March
2013 Number Budgeted
cost
Cost over run
Number Amount
Public works
Buildings 88 267.78 10 18.75 217.66
Roads & bridges 211 656.53 30 7.11 476.28
Irrigation 49 89.86 7 2.53 78.64
Total 348 1,014.17 47 28.39 772.58
Source: Finance Accounts
Against the initial budgeted cost of ` 1,014 crore in respect of 348 works, stipulated to be completed on or before March 2013, the progressive expenditure was ` 773 crore as of March 31, 2013, out of which, in 47 cases, the cost overrun aggregated ` 28 crore.
No reasons for delay in completion of the works were given by the Public Works and Irrigation Departments.
The ERC in its report (2010) has recommended that infrastructure projects above ` 10 crore should be subjected to detailed social cost benefit analysis. Further, it recommended that projects in progress required to be subjected to effective monitoring and evaluation for timely course correction. It also proposed to introduce investment appraisal mechanism for all large projects in a phased manner.

37
1.8.2 Investment and returns
Sick/non-working PSEs/Departmentally managed organizations.
As of March 31, 2013, Government had invested ` 49,464 crore in 86 Government companies (` 45,369 crore) including investment of ` 63 crore in 17 non-working Government companies, nine statutory corporations (` 2,154 crore), 43 joint stock companies (` 1,562 crore) and co-operative institutions, local bodies and regional rural banks (` 379 crore). The return from investment was negligible (Table 1.27).
Table 1.27: Return on investment
2008-09 2009-10 2010-11 2011-12 2012-13 Investment at the end of the year (` in crore) 26,672.11 32,483.28 38,420.70 44,294.86 49,463.80
Return (` in crore) 40.2 29.48 43.47 60.56 56.29
Return (per cent) 0.1 0.1 0.1 0.1 0.1
Average rate of interest on Government borrowings (per cent)
6.9 6.7 6.4 6.8 6.8
Difference between interest rate and return (per cent)
6.8 6.6 6.3 6.7 6.7
Source: Finance Accounts.
The State Government in MTFP (2012-16) has accepted the fact that the return on these investments was negligible. It was also stated that though the efforts of Government to get due returns out of its investments did not yield satisfactory results, it could not shy away from investing in social infrastructure involving long gestation and pay back periods. It further stated that Government would continue to make efforts to ensure due returns. However, the MTFP 2013-17 had no mention regarding the efforts made to ensure proper return on investments.
In addition, investment of ` 333.53 crore in respect of two6 Companies/ Corporations has been lying in Public Account as at the end of March 2013 without actual release to the institutions. This has resulted in locking up of funds in the Public Account.
Out of the total investment of ` 49,464 crore up to the end of March 2013, investment of ` 47,370 crore (96 per cent) was in 60 Government companies and statutory corporations under irrigation sector (` 28,098 crore), transport sector (` 4,892 crore), infrastructure sector (` 2,186 crore), power sector (` 7,273 crore), industries sector (` 577 crore), housing sector (` 1,327 crore), financing sector (` 2,423 crore), construction sector (` 2 crore) and social sector (` 592 crore).
The investment included ` 20,110 crore (41 per cent) included following Companies/Corporations, which were having / running perennial loss where the investments were substantial (Table 1.28).
6 Krishna Bhagya Jala Nigam (` 128.78 crore), Karnataka Infrastructure Development and Finance Corporation (` 204.75 crore).

38
Table 1.28: Investment in Companies/Corporations under perennial loss (` in crore)
Company/Corporation Investment
Up to 2012-13
Cumulative loss
Cumulative loss to the
end of North Western Karnataka Road Transport Corporation 237 355.78 2011-12 North Eastern Karnataka Road Transport Corporation 154 356.97 2011-12 The Karnataka Minorities Development Corporation Limited, Bangalore 234 31.04 2011-12
Rajiv Gandhi Rural Housing Corporation Limited 130 58.33 2011-12 Krishna Bhagya Jala Nigam Limited 19,137 277.45 2011-12 The Mysore Sugar Company Limited, Bangalore 206 344.96 2010-11
Total 20,098 1,424.53 Source: Finance Accounts.
Krishna Bhagya Jala Nigam was established (in 1994) as a wholly owned Government Company under the provisions of Companies Act, 1956, mainly for execution, operation and maintenance of Upper Krishna Project, works in the Krishna River Basin and such other projects allocated to it by the Government from time to time. The cumulative loss of the company to the end of 2011-12 was ` 277 crore.
During the year, Government invested ` 122 crore in statutory corporations and ` 5,045 crore in Government companies (working). The investment included
• ` 11.22 crore loan amount converted as equity and details of the same is discussed in paragraph 1.8.5.
• Adjustment of Guarantee Commission dues of ` 8.06 crore payable by Mysore Sugar Company Limited (` 5.88 crore) and by Mysore Paper Mills Ltd. (` 2.18 crore), treated as investment in the said Companies.
• ` 62.21 crore provided as support to Karnataka State Finance Corporation in order to facilitate refinance from SIDBI (` 50 crore) and ` 12.21 crore provided as equity towards payments of loans by small and tiny units closed under revised One Time Settlement (OTS) scheme.
The trends of conversion of loans into equity during the last four years are detailed in Table 1.29.
Table 1.29: Conversion details
(` in crore)
Type of conversion 2009-10 2010-11 2011-12 2012-13
Loan to equity 516 Nil 144 11
Equity to loan Nil 31 Nil Nil
Source: Finance Accounts
XIII FC, while reviewing the performance of State Public Sector Undertakings with respect to Government investments, had recommended that the State Government should draw up a road map by March 2011 for closure of non-working companies in consultation with the Accountant General. Action taken by the Government in this regard is awaited.

39
1.8.3 Investment in Public Private Partnership (PPP) Projects
Recourse to the PPP mode for project financing is encouraged because it frees valuable fiscal space for the provision of public goods in areas where such financing may not be forthcoming. PPP projects are in the sectors of transport, agro-infrastructure, education, health, tourism, urban and municipal infrastructure and energy. Infrastructure Development Department was established to play a significant role in the areas of developing air, train and maritime connectivity for the State and in promoting increased private investment in public infrastructure through PPP.
The summary of PPP projects in the pipeline, under implementation and operation are detailed in Table 1.30.
Table 1.30: Sector and stage-wise status of PPP projects in the State
(` in crore)
Sector Completed Under
implementation / construction
Under planning / pipeline Grand Total
No Cost No Cost No Cost No Cost Agri Infrastructure 0 0.00 1 105.90 0 0.00 1 105.90 Education 1 2.50 0 0.00 5 1,450.00 6 1,452.50 Energy 0 0.00 0 0.00 8 12,131.00 8 12,131.00 Healthcare 1 40.80 3 3.27 17 70.44 21 114.51 Industrial Infrastructure 0 0.00 0 0.00 11 41,643.00 11 41,643.00 Tourism 1 32.00 1 108.00 28 618.98 30 758.98 Transportation & Logistics
8 3,744.47 10 965.58 86 95,532.18 104 1,00,242.23
Urban and Municipal Infrastructure
7 276.50 3 56.00 36 5,257.44 46 5,589.94
Total 18 4,096.27 18 1,238.75 191 1,56,703.04 227 1,62,038.06
Source: Department of Infrastructure Development
From the table it could be seen that 18 projects worth ` 4,096 crore have been completed while another 18 projects worth ` 1,239 crore are under implementation and 191 projects ` 1,56,703 crore were under planning/pipeline.
1.8.4 Departmental undertakings
Nineteen undertakings of certain Government departments performed activities of quasi-commercial nature. According to the latest accounts furnished by six undertakings, the State Government’s investment was ` 7.65 crore. The total loss incurred by these undertakings was ` 7.41 crore. Details are furnished in Appendix 1.8.
In view of the continued losses sustained by these undertakings, there is a need for reviewing their working so as to wipe out their losses in the short term and make them self-sustaining in the medium to long term.
State Government in its reply to PAC (July 2011) had stated that the Department of Commerce and Industries would be advised to conduct a review of the working of the said undertakings. The outcome of the review is yet to be received.
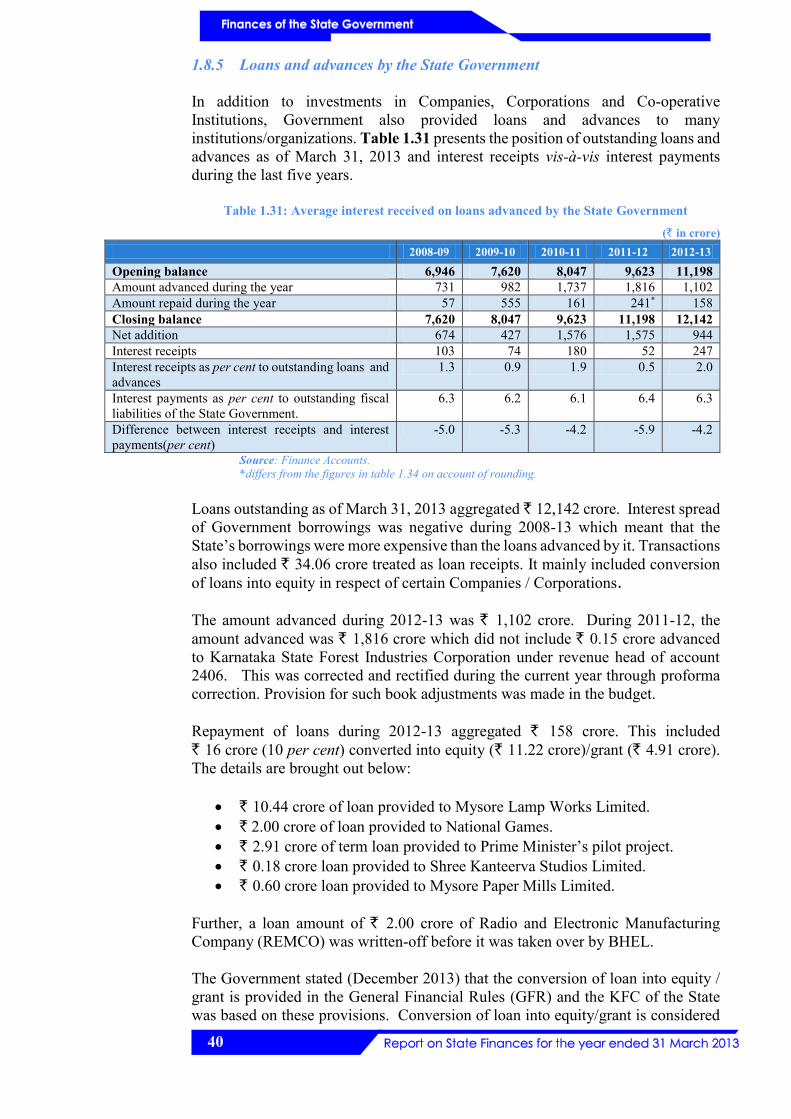
40
1.8.5 Loans and advances by the State Government
In addition to investments in Companies, Corporations and Co-operative Institutions, Government also provided loans and advances to many institutions/organizations. Table 1.31 presents the position of outstanding loans and advances as of March 31, 2013 and interest receipts vis-à-vis interest payments during the last five years.
Table 1.31: Average interest received on loans advanced by the State Government
(` in crore) 2008-09 2009-10 2010-11 2011-12 2012-13
Opening balance 6,946 7,620 8,047 9,623 11,198 Amount advanced during the year 731 982 1,737 1,816 1,102 Amount repaid during the year 57 555 161 241* 158 Closing balance 7,620 8,047 9,623 11,198 12,142 Net addition 674 427 1,576 1,575 944 Interest receipts 103 74 180 52 247 Interest receipts as per cent to outstanding loans and advances
1.3 0.9 1.9 0.5 2.0
Interest payments as per cent to outstanding fiscal liabilities of the State Government.
6.3 6.2 6.1 6.4 6.3
Difference between interest receipts and interest payments(per cent)
-5.0 -5.3 -4.2 -5.9 -4.2
Source: Finance Accounts. *differs from the figures in table 1.34 on account of rounding.
Loans outstanding as of March 31, 2013 aggregated ` 12,142 crore. Interest spread of Government borrowings was negative during 2008-13 which meant that the State’s borrowings were more expensive than the loans advanced by it. Transactions also included ` 34.06 crore treated as loan receipts. It mainly included conversion of loans into equity in respect of certain Companies / Corporations.
The amount advanced during 2012-13 was ` 1,102 crore. During 2011-12, the amount advanced was ` 1,816 crore which did not include ` 0.15 crore advanced to Karnataka State Forest Industries Corporation under revenue head of account 2406. This was corrected and rectified during the current year through proforma correction. Provision for such book adjustments was made in the budget.
Repayment of loans during 2012-13 aggregated ` 158 crore. This included ` 16 crore (10 per cent) converted into equity (` 11.22 crore)/grant (` 4.91 crore). The details are brought out below:
• ` 10.44 crore of loan provided to Mysore Lamp Works Limited. • ` 2.00 crore of loan provided to National Games. • ` 2.91 crore of term loan provided to Prime Minister’s pilot project. • ` 0.18 crore loan provided to Shree Kanteerva Studios Limited. • ` 0.60 crore loan provided to Mysore Paper Mills Limited.
Further, a loan amount of ` 2.00 crore of Radio and Electronic Manufacturing Company (REMCO) was written-off before it was taken over by BHEL.
The Government stated (December 2013) that the conversion of loan into equity / grant is provided in the General Financial Rules (GFR) and the KFC of the State was based on these provisions. Conversion of loan into equity/grant is considered

41
decision of the Government with the view to support the borrower. Circumstances of each case and such conversions had the assent of the legislature and suitable provision was also made to take care of such conversions.
However, the instructions below GFR 292 make it clear that in such situations only a token provision would suffice and that the progressive expenditure is required to be corrected proforma without affecting the transactions of the current year. In the cases mentioned above, complete provision (and not token provision) for such conversions were made and the transactions were brought to account in the current year, giving the benefit of utilization of expenditure of earlier years during the year. Further, it was observed in one case (M/s. Mysore Lamp Works, Limited), that the conversion of grant into loan was made proforma without bringing the transaction to the current year.
The Government order of July 2003 indicated the revised interest rate on all the loans sanctioned by the Government on or after April 1, 2003. It stated that all sanction orders should invariably be accompanied by the essential details and the standard terms and conditions of loans appended to the said order. The PAC in its recommendation (December 2011) had emphasized the need for issue of terms and conditions while granting loans. During 2012-13, terms and conditions of repayment were not received from the administrative departments for loans amounting to ` 746 crore.
Detailed accounts of recovery of loans which are maintained in the office of PAG (A&E) indicated arrears in recovery of loans and advances aggregating ` 3,790 (principal: ` 2,431 crore and interest: ` 1,359 crore) was overdue as of March 31, 2013 from 22 institutions7 (Appendix 1.9).
In respect of loan accounts the details of which are maintained by the State Government, recovery of ` 297.56 crore (principal) and ` 274.40 crore (interest) was in arrears of recovery. These cases are the ones which are reported to the PAG (A&E).
It was further seen that in respect of certain Boards/Corporations, where State Government had sanctioned/disbursed loans, the entities were not in a position to repay the loans on account of their poor fiscal health (BWS&SB). In respect of Power Company of Karnataka, the amount released for acquisition of land in 2010-11 (` 142.12 crore) had remained with the Deputy Commissioner of the district (Gulbarga) without utilisation, thus indicating poor oversight of funds released.
The controlling officers maintaining loans are required to furnish details of arrears in recovery of loan installments and interest to the Principal Accountant General (A & E) every year. However, the statements were received from respective bodies / organizations instead of controlling officers. Out of 928 statements due from 842 bodies/organizations only 70 statements with 27 nil statements were received. Further, recovery of loans and advances aggregating ` 567 crore (principal: ` 283 crore and interest: ` 284 crore) was overdue as of March 31, 2013 from 43 institutions8.
7 Source: Finance Accounts 2012-13. 8 Detailed accounts kept by State Government.

42
1.8.6 Cash balances and investment of cash balances
Table 1.32 depicts the cash balances and investments made there from by the State Government during the year.
Table 1.32: Cash balances and their investments (` in crore)
Opening Balance on 01.04.2012
Closing Balance on 31.03.2013
a) General cash balance Cash in treasuries - - Deposits with RBI 3.00 67.94 Deposits with other banks - - Remittance in transit-Local 0.01 0.01 Sub Total 3.01 67.95 Investments held in cash balance Investment account 7,640.61 6,872.36 Total (a) 7,643.62 6,940.31 (b) other cash balances and investments Cash with departmental officers viz. PWD officers, Forest Department, DCs 2.26 2.11 Permanent Advances for contingent expenditure with departmental officers 1.63 1.65 Investment of earmarked funds 1,961.98 3,567.17 Total (b) 1,965.87 3,570.93 Grand Total (a+b) 9,609.49 10,511.24
Source: Finance Accounts.
Claims against Government are settled by preferring bills at treasuries, against which cheques are issued (by debit to the Consolidated Fund), to the claimants and with this the Government relinquishes the claims. The Major Head 8670 – Cheques and Bills is credited with the amount of each of the cheque and paired off with its encashment at the Agency Banks. Thus, the credit balances under this head indicate the value of cheques that remained un-encashed. Article 75(1) of Karnataka Financial Code 1958 prescribes that the Treasury Officer should propose an Alteration Memorandum for the value of cheques outstanding for more than 12 months from the date of issue on the 15th of May each year. Due to non-compliance with these instructions by the treasury officers, the credit balance under this head increased from ` 6,782 crore in 2011-12 to ` 6,812 crore during the year.
Finance Department (December 2013) stated that, the Director of Treasuries will be directed to take appropriate action after ascertaining with regard to the validity of the same. Further, the balances at the end of 2011-12 amounting to ` 6,782 crore spread over different year and various treasuries. Since the validity of the same may have already expired, the Director of Treasuries would be asked to initiate appropriate action to close the rest as “not claimed”.
The cash balance of the State at the end of the year was ` 10,511.24 crore. The increase in cash balances was 9 per cent over the previous year.
Surplus cash balance was mainly due to market borrowings of ` 10,760 crore raised during 2012-13. There was a reduction of ` 768 crore in the investments held in cash balance investment account with RBI as at the end of the year.
The surplus cash balance was invested partly in 14 day intermediate treasury bills of RBI with an average interest rate of five per cent per annum and partly in 91 day intermediate treasury bills of RBI with an average interest rate of 8.3 per cent against an average rate of 8.7 per cent per annum at which the borrowings were made. The interest received from investment in 91 day Treasury bill during the current year was ` 320.35 crore.

43
In MTFP (2013-2017), the State Government has stated that cash surpluses above the minimum prescribed limit by RBI are automatically invested in Government of India 14 day Treasury Bills. However, these have very low yields varying from five to six per cent. Hence, as advised by RBI and recommended by XIII Finance Commission and the C&AG of India, additional cash balance available over and above anticipated requirement, is not kept idle and is being invested in 91 day Government of India Treasury Bills. It further stated that efforts are to be made for better forecasting of exact requirement of funds and timely release of funds so as to maintain prudent level of cash balance. Also, State Government stated that it would work towards having in place a real time cash flow estimation model based on the advice and guidance of RBI. It was also admitted that efforts needs to go in for better forecasting of exact requirement of funds and timely release of funds so as to maintain prudent level of cash balance. 1.9 Assets and liabilities
1.9.1 Growth and composition of assets and liabilities
In the existing Government accounting system, comprehensive accounting of fixed assets like lands and buildings owned by the Government is not done. However, the Government accounts do capture the financial liabilities of the Government and the assets created out of the expenditure incurred. Appendix 1.6 gives an abstract of such liabilities and assets as on March 31, 2013 compared with the corresponding position as on March 31, 2012.
Total liabilities, as defined in the Karnataka Fiscal Responsibility Act, 2002 are the liabilities under the Consolidated Fund and the Public Account of the State. Consolidated Fund liabilities consist of Internal Debt and Loans and Advances from GOI. It also includes borrowings by Public Sector Undertakings and Special Purpose Vehicles and other equivalent instruments where liability for repayment is of the State Government.
Further, the internal debt includes market loans, special securities issued to RBI and other negotiated loans. The Public Account liability includes small savings, provident funds, etc., reserve funds and other deposits. The liabilities of the State as depicted in Finance Accounts, however, did not include pension, other retirement benefits payable to retired/retiring State Government employees/guarantees/letters of comfort issued by the State Government and borrowings through special purpose vehicles, termed off-budget borrowings.
Assets comprise assets under Consolidated Fund and cash. The assets under Consolidated Fund consist of capital outlay on fixed assets – investments in shares of companies and corporations and loans and advances which in turn consist of loans for power projects and other development loans.
The growth rate of components of assets and liabilities are summarized in the Table 1.33.

44
Table 1.33: Summarised position of Assets and Liabilities (` in crore)
Liabilities Assets
2011-12 2012-13 (per cent) 2011-12 2012-13 (per
cent) Consolidated Fund 65,315 75,052 15 Consolidated
Fund 1,15,23
3 1,31,656 14
a. Internal Debt 54,333 63,418 17 i. Capital outlay 1,04,035
1,19,513 15
b. Loans and advances from GOI
10,982 11,634 6 ii. Loans and advances
11,198 12,143 8
Public Account* 37,715 41,715 11 Cash 9,609 10,511 9 a. Small savings,
Provident funds, etc. 14,182 15,914 12
b. Reserve Funds 12,427 12,184 -2 c. Deposits 11,106 13,617 23
*The liabilities are on net basis. It does not include investments from out of ear marked funds of ` 1,962 crore (2011-12) and ` 3,567 crore (2012-13).
The growth rate of assets, which was 18 per cent during 2011-12, decreased to 14 per cent during 2012-13, while that of liabilities increased from 12 per cent in 2011-12 to 13 per cent in 2012-13.
The Finance Accounts reflected an amount of ` 63,418 crore as internal debt outstanding as at the end of 2012-13 after taking into account the difference of ` 359.87 crore in the accounts of LIC, GIC, NABARD, NCDC etc. Further, Reserve Bank of India in its quarterly statement of outstanding balances of Government of Karnataka as on March 31, 2013 reflected closing balance of Market Loans – not bearing interest as ` 0.15 crore. However, the Finance Accounts reflected an amount of ` 0.75 crore, indicating that reconciliation of loan balances (capital account) was required. Further, as per the communication from the Reserve Bank, there still exists a balance of ` 0.40 crore to be discharged in respect of Compensation bonds, the transactions of which are accounted under the minor head 106. However, in the Finance Accounts, these loans do not figure in the outstanding balances. The loans and advances from GOI reflected an amount of ` 11,634 crore as at the end of 2012-13.
Loans amounting to ` 170.14 crore outstanding as per Finance Accounts under Central plan schemes and Centrally sponsored schemes with respect to all Ministries other than Finance Department has been written off on the basis of recommendation of XIII FC. However, as per the Ministries’ records, the outstanding balances worked out to ` 144.89 crore and the difference of ` 25.25 crore required reconciliation. Further, the adverse balance (excess amount paid to the Ministries during the period 2010-12) of ` 6.04 crore has been cleared during the year relating to the Ministries of commerce and textiles, power, road, transport and highways and agriculture. Excess amount paid to these Ministries amounting to ` 11.27 crore has also been adjusted during the year.
1.9.2 Fiscal liabilities
The trends in outstanding fiscal liabilities of the State are presented in Appendix 1.5. The composition of fiscal liabilities during the year 2012-13 vis-à-vis the previous year is presented in Chart 1.10.
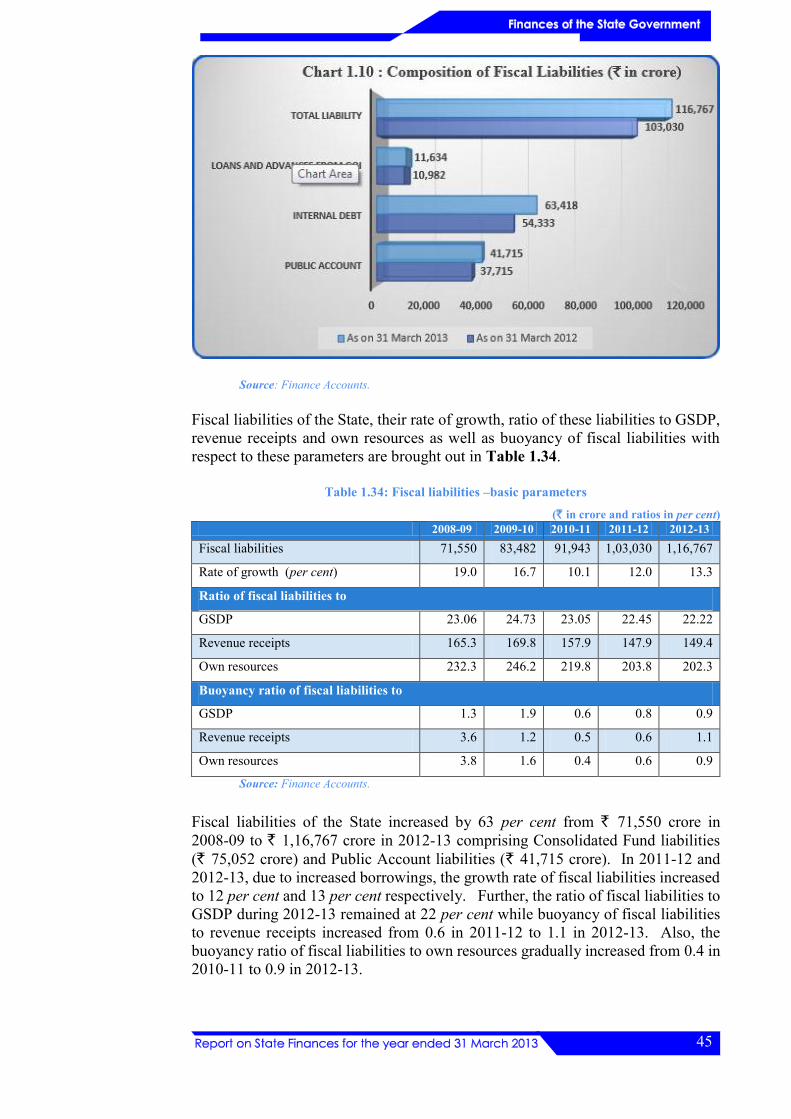
45
Source: Finance Accounts.
Fiscal liabilities of the State, their rate of growth, ratio of these liabilities to GSDP, revenue receipts and own resources as well as buoyancy of fiscal liabilities with respect to these parameters are brought out in Table 1.34.
Table 1.34: Fiscal liabilities –basic parameters
(` in crore and ratios in per cent) 2008-09 2009-10 2010-11 2011-12 2012-13
Fiscal liabilities 71,550 83,482 91,943 1,03,030 1,16,767
Rate of growth (per cent) 19.0 16.7 10.1 12.0 13.3
Ratio of fiscal liabilities to
GSDP 23.06 24.73 23.05 22.45 22.22
Revenue receipts 165.3 169.8 157.9 147.9 149.4
Own resources 232.3 246.2 219.8 203.8 202.3
Buoyancy ratio of fiscal liabilities to
GSDP 1.3 1.9 0.6 0.8 0.9
Revenue receipts 3.6 1.2 0.5 0.6 1.1
Own resources 3.8 1.6 0.4 0.6 0.9
Source: Finance Accounts.
Fiscal liabilities of the State increased by 63 per cent from ` 71,550 crore in 2008-09 to ` 1,16,767 crore in 2012-13 comprising Consolidated Fund liabilities (` 75,052 crore) and Public Account liabilities (` 41,715 crore). In 2011-12 and 2012-13, due to increased borrowings, the growth rate of fiscal liabilities increased to 12 per cent and 13 per cent respectively. Further, the ratio of fiscal liabilities to GSDP during 2012-13 remained at 22 per cent while buoyancy of fiscal liabilities to revenue receipts increased from 0.6 in 2011-12 to 1.1 in 2012-13. Also, the buoyancy ratio of fiscal liabilities to own resources gradually increased from 0.4 in 2010-11 to 0.9 in 2012-13.

46
1.9.3 Transactions under Reserve Fund
Reserves and Reserve Funds are created for specific and well defined purposes under the Sector ‘J’ in the accounts of the State Government (Public Account). These funds are fed by contributions or grants from the Consolidated Fund of India or State or from outside agencies. The contributions are treated as expenditure under the Consolidated Fund. These form debits to the Consolidated Fund. The expenditure relating to the fund is initially accounted under the Consolidated Fund itself for which the vote of the legislature is obtained. At the end of the year, at the time of closure of accounts, the expenditure relating to the fund is transferred to Public Account under the concept of gross budgeting through an operation of deduct entry in accounts. This forms credit to the Fund. The funds may be further classified as ‘Funds carrying interest’ and ‘Funds not carrying interest’. Generally, the Reserve Funds are classified under the following three categories based on the sources from which they are fed.
Funds accumulated from grants made by another Government and at times aided by public subscriptions, e.g. Fund formed from subventions from the Central Road Fund.
Funds accumulated from sums set aside by the Union/State from the Consolidated Fund of India or Consolidated Fund of State, as the case may be, to provide reserves for expenditure to be incurred by them for particular purposes, e.g., Depreciation Fund.
Funds accumulated from contributions made by outside agencies to the State Government.
As brought out in ‘Notes to Accounts’ for the year, there were 44 reserve funds, of which nine were active and 33 have been dormant for over 30 years. In addition, PAG (A&E) had requested (June 2011) the State Government to review the necessity to continue two reserve funds, namely;
(i) State Renewable Fund which has not recorded any transaction under it since 1999-2000.
(ii) Guarantee Reserve Fund which needs to be replaced by Guarantee Redemption Fund in the light of recommendations of the TFC.
Funds which have remained dormant/inoperative under the major heads 8115 – depreciation / renewal reserve funds and 8229 - development and welfare funds with balances (credit) are indicated in Appendix 1.10. Action is needed to be initiated for examination for the required continuation or otherwise of these funds so as to clean up the balances.
The transactions relating to certain funds are discussed in the following paragraphs.
Consolidated Sinking Fund (CSF)
The working group of RBI recommended that there is a necessity for States to build up a minimum CSF corpus of three to five per cent of State liabilities within the next five years and thereafter maintain it on a rolling basis. Karnataka’s Total Outstanding Liabilities (TOL) had exceeded ` 1,00,000 crore in financial year 2011-12. Hence, the State decided to set up a Consolidated Sinking Fund and contribute one per cent of the total i.e., ` 1,000 crore to the fund during the year.

47
Based on RBI guidelines, a Sinking Fund has been created in Public Account under 8222 – Sinking Funds –101- Sinking Fund for amortization of loans to take care of the liabilities. A sum of ` 1,000 crore was appropriated to the fund through provision under major head 2048 – Appropriation for reduction / avoidance of debt. However, by operating the minor head 902, the deduct entry adjustment was also made and the debit was made to the Fiscal Management Fund where there was a credit balance of ` 1,057 crore. However, the latter adjustment was not in order, as the rules governing the Fiscal Management Fund had not been framed and the accounting adjustment does not support the stand of the Government. The withdrawal of debit ` 1,000 crore under Consolidated Fund and an equivalent withdrawal of credit balance of ` 1,000 crore under Public Account had made the entire transaction revenue neutral.
Consumer Welfare Fund
The Consumer Welfare Fund (CWF), created for the welfare of the consumers during September 2006, was credited with the following:
• Seed money from Central Consumer Welfare Fund from GOI. • Assistance provided by Central Government for strengthening consumer
movement in the State. • Matching grants or any assistance by the State Government and court fee
accrued with the district and State consumer forum. • Penalty paid by manufacturers of consumer products or service providers. • Returns from the investment out of the accumulation in the fund. • Any amount received by the State Government for the purpose of the fund.
The expenditures of ` 0.93 crore and ` 1.33 crore incurred towards consumer welfare activities during 2009-10 and 2010-11, respectively, were allowed to remain in the Consolidated Fund and have not been shown as met out of the Consumer Welfare Fund Account.
A revised Central Consumer Welfare Fund Guidelines was notified in 2007-08, establishing a corpus of ` 10.00 crore as State Consumer Welfare Fund, supported by the Central Government with 75 per cent of the corpus. Though the State Government made a provision of ` 2.50 crore towards the establishment of Corpus Fund in 2010-11, the fund was not established. Thus, the State had to forego ` 7.50 crore, the Central share of the Corpus Fund.
During 2011-12 ` 2.50 crore being the State’s contribution to the fund could not be shown as credit to the fund, as the same was taken to the deposit account under Sector – K – Deposits and Advances.
During 2012-13 provision of ` 2.50 crore was also made to account for the transfer of States’ matching contribution to the fund. This amount was surrendered citing non-drawal of Central grants. The fund transactions were not put through during the year.
Financial assistance of ̀ 2.63 crore was received from Government of India relating to the fund during the year. This amount related to the consumer welfare activities. On account of non-transfer of the GOI grant, the amount remained under the Consolidated Fund of the State only. However, during the year an amount of ` 1.09

48
crore was credited to the fund being the application fees and penalties received at district / State Consumer Courts since 2006. An expenditure of ` 0.49 crore incurred towards consumer welfare activities was shown as met out of the fund. The balance in the fund as at March 31, 2013 was ` 1.43 crore.
Finance Department replied (December 2013) that, the GOI instructions are for opening the account under the interest bearing section of deposit account, on account of which the transfers to fund head under the sector ‘J’ Reserve Funds was not carried out. The State share as well as the Central share is being transferred to deposit account in 2013-14.
On account of non-observance of the procedure for fund transaction, the amount could not be reflected in the fund.
State Disaster Response Fund
The State Disaster Response Fund (SDRF), constituted under Disaster Management Act, 2005, is operative from 2010-11, in Public Account under the sector ‘Reserve Fund bearing interest’. As per the guidelines, the accretions to the SDRF together with the income earned on the investment of the SDRF are to be invested in one or more of instruments viz., Central Government dated securities, auctioned treasury bills and interest earning deposits and certificates of deposits with Scheduled Commercial Banks. Further, the State Government had to pay interest to the SDRF at the rate applicable to overdrafts and credit the same on a half yearly basis. While 75 per cent of the contribution was to be from GOI, the balance 25 per cent was to come from the State Government. However, no interest was credited to the SDRF.
The contributions to the fund for the year 2012-13 included GOI contribution of ` 133.10 crore and State’s contribution of ` 44.36 crore. It also included GOI contribution of ` 679.54 crore from National Disaster Relief Fund. An amount of ` 927.23 crore, released to Deputy Commissioners for relief expenditure to deal with natural calamities was shown as met out of the SDRF. This included ` 70.23 crore relating to 2011-12 which was received during the month of March 2012.
The amounts released to Deputy Commissioners were kept in Personal Deposit (PD) accounts which were in violation of the Act/guidelines governing the administration of the fund. These unspent balances in the PD Account resulted in understatement of the fund balance in Public Account to that extent (Sector – J). Under Sector-K – Deposits, where the transactions are recorded, the balances are with the Deputy Commissioner resulting in overstatement of expenditure towards calamity relief in the Consolidated Fund. The balance in the Fund as at March 31, 2013 was ` 3.24 crore.
Forest Development Fund
The revenue realized from Forest Development Tax and money recovered for raising Compensatory Plantations in lieu of the Forest Areas converted for non-forestry purposes are credited as revenue of the Government and an equal amount is transferred to this Fund Account.

49
The actual expenditure incurred on certain works of Forest Conservation and Development initially accounted for under this grant is transferred to the Fund Account.
There was a balance of ` 964.03 crore as on April 1, 2012. During the year 2012-13 an amount of ` 894.03 crore including ` 284.52 crore (relating to 2011-12) which remained in the departmental receipts of the Commercial Department was credited to the Fund. An expenditure of ` 184.20 crore was met out of the Fund leaving a balance of ` 1,673.86 crore as on March 31, 2013. The transfer of ` 284.52 crore during the year had resulted in the overstatement of revenue expenditure for the current year on account of poor reconciliation of receipt figures of 2011-12.
Karnataka Silk Worm Cocoon and Silk Yarn Development and Price Stabilisation Fund
The Fund was created in the year 1979 for the purpose of stabilizing the prices of cocoons and silk yarn and for the development of rearing of silk worm seed, reeling and twisting of silk yarn and matters connected therewith. The fund is credited with all moneys received by way of market fees, license fees and contribution made by the Government. The amount at the credit of Fund is particularly utilized for
a) The construction of buildings required to locate cocoon markets and silk exchanges;
b) For providing of necessary facilities in the cocoon markets and silk exchanges;
c) Fixation of the floor price of silk yarn by the Fund authority from time to time, and
d) Providing of testing and grading of silkworm seed, cocoon and silk yarn.
During the year 2012-13 an amount of ` 26.63 crore was realized from Market Fees and License Fees required to be transferred as resources to this Fund and an amount of ` 7.40 crore was expenditure on Sericulture Development Programmes required to be met out of this Fund. Due to non-existence of Budget provision under this grant, no amounts were transferred to this Fund. The balance in the Fund as on March 31, 2013 was ` 127.46 crore. The non-adjustment of receipt / expenditure to the fund has resulted in the retention of the receipt and expenditure in Consolidated Fund resulting in distortion of fiscal indicators.
1.9.4 Contingent liabilities
Status of guarantees
Guarantees are contingent liabilities on the Consolidated Fund of the State in case of default by the borrower for whom the guarantee was extended. The details of last five years are given in Table 1.35.

50
Table 1.35: Guarantees given by the State Government (` in crore)
2008-09 2009-10 2010-11 2011-12 2012-13 Maximum amount guaranteed 18,732 18,420 19,150 13,262 14,306 Outstanding amount of guarantees (including interest)
8,693 7,203 6,618 6,515 @ 6,688
Percentage of outstanding amount guaranteed to total revenue receipts of the second preceding year
23 18 15 13 10
Source: Finance Accounts. @ differs from the figure shown in previous year (` 6,640 crore) due to reconciliation.
The Karnataka Ceiling on Government Guarantees Act, 1999 provides for a cap on outstanding guarantees extended by the Government at the end of any year at 80 per cent of the State’s revenue receipts of the second preceding year. The outstanding guarantees at the end of the years 2008-13 were within the prescribed limit.
The outstanding guarantees amounting to ` 6,688 crore at the end of the year 2012-13 included guarantees extended to 54 institutions/companies under irrigation (` 774 crore), co-operative (` 2,409 crore), finance (` 1,190 crore), power (` 280 crore), housing (` 948 crore), transport (` 180 crore), infrastructure (` 34 crore) and other sectors (` 751 crore).
Further, at the beginning of 2012-13, the guarantee commission receivable was ` 360.35 crore and during the current fiscal year the guarantee commission received was ̀ 148.93 crore and the balance receivable at the year end is ` 211.42 crore. The difference in the amount of guarantee commission receivable and received was under reconciliation.
As per MTFP (2013-17) since guarantees result in increase in contingent liability they should be examined in the same manner as a proposal for a loan, taking into account, the credit-worthiness of the borrower, the amount and risks sought to be covered by a sovereign guarantee, the terms of the borrowing, the justification and public purpose to be served, probabilities that various commitments will become due and possible costs of such liabilities, etc.. Presently, there is no Government Guarantee Policy in place to guide departments while recommending for such guarantees. Hence it is desirable to evolve a State Government Guarantee Policy on the lines of that brought out by Government of India.
Finance Department (December 2013) stated that, the GOI policy would be examined and attempts made to formulate State specific guarantee policy with assistance from Asset and Liability Management department and Fiscal Policy Institute.
The Act further provides for a levy of one per cent as guarantee commission which is not to be waived under any circumstances. However, two9 societies have been exempted from paying the guarantee commission in contradiction of the Act.
To provide for sudden discharge of States’ obligations on guarantees, TFC had recommended that States should set up Guarantee Redemption Fund through
9 The Coorg Orange Growers Co-operative Society, Hukkeri Taluk Co-operative Rural Electrical Society Limited.

51
earmarked guarantee fees. The State had set up a Guarantee Reserve Fund in 1999-2000 with a corpus of ` one crore. However, there was no transaction though there were guarantee commission receipts and expenditures on account of discharge of guarantee obligation. The guarantee fees of ` 713.86 crore received since 2000 have not been transferred to the fund out of which, in 2012-13, the commission/ fees of ` 124.05 crore, received from nine institutions, have been utilised for revenue/capital expenses such as payment of financial assistance/ relief, building expenses, other expenses and investments instead of transferring the amount to the guarantee redemption fund.
Off - budget borrowings
The borrowings of the State Government are governed by Article 293 (1) of the Constitution of India. In addition to the contingent liabilities shown in Table 1.35, the State guaranteed loans availed of by Government Companies/Corporations. These Companies/Corporations borrowed funds from the market/financial institutions for implementation of various State plan programmes projected outside the State budget. Funds for these programmes were to be met out of resources mobilized by these Companies/Corporations outside the State budget but in reality the borrowings of these concerns ultimately turn out to be the liabilities of the State Government termed ‘off-budget borrowings’ and the Government hitherto had been repaying the loans availed of by these Companies/Corporations including interest through regular budget provision under capital account. Thus, the capital expenditure of the State till 2010-11 included interest expenditure on off-budget borrowings, even though there was no corresponding build-up of assets in Accounts. This had resulted in understatement of interest expenditure and overstatement of capital expenditure / revenue surplus. State Government in its reply to PAC (July 2011) had stated that the interest expenditure on off-budget borrowings would be treated as revenue expenditure from 2011-12 onwards. This compliance has been adhered to.
During 2012-13 the revenue expenditure included interest payment of ` 620.93 crore towards off-budget borrowings including releases made to ULBs for servicing of debt.
Table 1.36 captures the trend in the off-budget borrowings of the State during 2008-13 while Table 1.37 gives the entity-wise position of borrowings to the end of 2012-13.
Table 1.36: Trend in off-budget borrowings (` in crore)
Year 2008-09 2009-10 2010-11 2011-12 2012-13
Amount as furnished by entity♠ Nil Nil Nil 512 18.16
Source: As reported by the concerned entities ♠ Figures are yet to be reconciled with those indicated in Budget overview.
Table 1.37: Entity-wise position of off-budget borrowings (` in crore)
Company/Corporation/Board Outstanding Off-budget borrowings
Borrowings during the
year
Repayment during the year
Principal Interest Krishna Bhagya Jala Nigam Limited 733.09 --- 16.69 65.83
Karnataka Neeravari Nigam Limited 125.00 --- 125.00 4.49
Karnataka Road Development Corporation 216.44 18.16 54.45 23.48

52
Company/Corporation/Board Outstanding Off-budget borrowings
Borrowings during the
year
Repayment during the year
Principal Interest Rajiv Gandhi Rural Housing Corporation 328.51 --- 59.46 28.73
Karnataka Slum Development Board 39.43 --- 8.85 3.62
Karnataka Rural Infrastructure Development Corporation Ltd.
46.40 --- 12.55 4.26
Karnataka State Police Housing Corporation 142.50 --- 24.81 14.80
Karnataka Housing Board, NGV 6.56 --- 6.51 1.19
Cauvery Neeravari Nigam Limited 202.50 --- 145.00 13.48
Karnataka Residential Education Institution Society
20.17 --- 5.45 1.86
Karnataka State Industrial Infrastructure Development Corporation Limited
38.25 --- 10.90 2.81
Sarva Shiksha Abhiyan Samithi 4.03 --- 2.22 0.40
Karnataka Power Transmission Corporation Limited^
14.53 --- 7.86 1.04
Total 1,917.41 18.16 479.75 165.99 Source: As reported by the concerned entities. ^the entity does not find a place in overview of budget 2013-14.
In compliance with the commitment made in MTFP 2009-13, off-budget borrowings were eliminated from 2008-09 to ensure transparency in fiscal performance. In MTFP 2011-15 it has been stated that as the State Government was well advanced on the fiscal consolidation road map set in the FRA and, as recommended by XIII FC, the Government has decided in future to allow off-budget borrowings in a limited manner. Further, it has been stated that the quantum of the borrowing would be limited to the repayments of the previous off budget borrowings i.e., stock of off-budget borrowings would be maintained at the same level as it was at the end of financial year 2009-10. The limit projected as per MTFP 2012-16 is ` 3,249 crore.
Taking into account the off-budget borrowings of the State, the total liabilities at the end of March 2013 worked out to ` 1,19,273 crore10 against ` 1,16,767 crore shown in Table 1.34. The ratio of fiscal liabilities (inclusive of off-budget borrowings) to GSDP thus worked out to 22.70 per cent at the end of the year. In the MTFP 2013-2017 it was stated that the State has taken over the long term debt of ` 1,050 crore from KPTCL on to its account and was expected to repay all the dues by 2016-17. However this transaction has not been brought to account.
1.10 Open Market Borrowings of Government
1.10.1 Introduction
A study on Open Market Borrowings by the Government of Karnataka was undertaken by audit to draw linkage between market borrowings and capital formation there from as also study of regular revenue generation for servicing of debts and repayment of principal, in the Finance Department, Boards/Public Sector Undertakings etc. during April-September 2013. The period covered was from 2008-09 to 2012-13. The observations from the study are detailed in the following
10 Total fiscal liabilities: ` 1,16,767 crore plus balance of off-budget borrowings; ` 2,506 crore (` 1,456 crore as per table above and ` 1,050 crore of KPTCL liability taken over by Government – MTFP 2013-17).

53
paragraphs.
There are two types of borrowings resorted to by the State Government, viz.
a. Specific purpose borrowings like borrowings from National Bank for Agriculture and Rural Development (NABARD) for Rural Infrastructure Development Fund (RIDF) works and borrowings from Government of India (GOI) for externally aided projects, which have one to one correspondence with specific plan schemes.
b. General purpose borrowings like market borrowings and small saving loans that do not have one to one correspondence with any particular scheme, but are used to finance budget in general and annual plan in particular.
The market borrowings are part of total borrowings that are used to finance annual plan. The position of the plan size of the Government, balance from current revenue (BCR)11 and the net open market borrowings are brought out in the Table 1.38 below.
Table 1.38 (` in crore)
2008-09 2009-10 2010-11 2011-12 2012-13
Annual Plan size 25,953 29,500 31,050 38,070 42,030
BCR 8,523 9,468 14,748 17,219 16,741
Net open market borrowings 6,584 4,954 1,037 6,207 9,149
There was a positive BCR during the period 2008-13 indicating that the borrowings were used to finance the annual plan.
1.10.2 Overall position
The Ministry of Finance, GOI fixes the annual borrowing ceilings for states as per the fiscal deficit targets recommended by the Finance Commission.
Table 1.39: Debt sustainability indicators (` in crore)
Description 2008-09 2009-10 2010-11 2011-12 2012-13
Total liabilities* 77,131 86,245 94,003 1,04,933 1,19,273 Total public debt 49,688 55,370 59,277 65,315 75,052 Total market loans 18,573 23,527 24,564 30,772 39,921 GSDP 3,10,312 3,37,516 3,98,893 4,58,903 5,25,444 Percentage of market loans to total liabilities
24 27 26 29 33
Percentage of market loans to total public debt
37 42 41 47 53
Weighted average interest rate on market loans-financial year wise
7.8 8.1 8.4 8.8 8.7
Interest paid on market loans 964 1,523 1,796 1,864 2,567 Total interest payment – including interest on off budget borrowings
4,532 5,213 5,641 6,604 7,454
11 BCR – Revenue Receipts minus all Plan Grants and Non-Plan Revenue Expenditure excluding expenditure recorded under the major head 2048 – Appropriation for reduction of Avoidance of debt.

54
Description 2008-09 2009-10 2010-11 2011-12 2012-13
and others GSDP growth rate and interest rate ratio
1.9 1.1 2.2 1.7 1.7
Gross interest payments to revenue Receipts ratio
10.5 10.6 9.7 9.5 9.5
Primary surplus/deficit 4,200 5,662 5,047 5,866 7,053 Revenue surplus/deficit 1,635 1,629 4,172 4,521 1,883 Fiscal deficit 8,732 10,875 10,688 12,470 14,507 Percentage of total liabilities to GSDP
24.86 25.55 23.57 22.87 22.70
Outstanding guarantees 8,693 7,203 6,618 6,640 6,688
Source: Finance Accounts, *the term ‘total liabilities’ also includes off budget borrowings.
Fiscal Deficit represents the borrowings of the Government and is defined as the excess of revenue and capital expenditure including net of loans and advances over revenue receipts and miscellaneous capital receipts. According to the Karnataka Fiscal Responsibility Act, 2002 (FRA), the fiscal deficit was required to be at not more than three per cent of the estimated GSDP by the end of the financial year 2005-06, which was achieved during 2004-05 itself. As a part of the second economic stimulus package, announced by GOI, the States were allowed to raise additional market borrowings during the financial years 2008-09 and 2009-10 by a maximum of 0.5 per cent in each year, of their GSDP, for capital expenditures. In accordance with the decision, the FRA was amended to limit the fiscal deficit at 3.5 per cent during 2008-09 and at 4.0 per cent during 2009-10 of GSDP. The year 2010-11 was considered as a year of consolidation when the fiscal deficit – GSDP limit was fixed at 3.44 per cent and, later, limited to three per cent during 2011-13. The position of fiscal deficit to GSDP during the period 2008-13 showed that the State Government had maintained the ratio at less than those prescribed under the FRA. In accordance with the enhanced limits, the Ministry of Finance, GOI allowed the States to raise additional market borrowings during the period of economic stimulus package. The borrowings of the States were covered under the permission accorded under Article 293 of the Constitution during the period.
The Debt-GSDP Ratio (including off-budget borrowings) and the ratio of interest payments to revenue receipts of the State during the period (2008-13) had shown a declining trend. The debt – GSDP ratio had declined from 24.86 per cent 2008-09 to 22.70 per cent during the year, while the ratio of interest payments to revenue receipts declined from 10.5 per cent in 2008-09 to 9.5 per cent during 2012-13 and was well within the norms prescribed by the TFC. However, during the period 2008-13 the liabilities of market loans to total liabilities of the Government had increased from 24 to 33 per cent. Also, the percentage of market loan to total public debt (liabilities within the consolidated fund) had also shown a predominant shift towards open market borrowings, as its share significantly increased from 37 per cent in 2008-09 to 53 per cent during 2012-13. The interest paid on market loans had also shown a considerable increase (166 per cent) from ` 964 crore in 2008-09 to ` 2,567 crore during 2012-13.
1.10.3 Investment in Intermediary Treasury Bills (TBs)
The surplus cash balance of the State Government maintained with the RBI stood automatically invested in the 14/91 day TBs. The yields on these TBs were low – in respect of 14 day bills, it was between four to five per cent per annum and in

55
respect of 91 day bills it was about 8.6 per cent per annum. The position of market borrowings (net) and the average investment of the surplus cash of the State Government with the RBI in the 14/91 day TBs during the year 2008-13 are indicated in Table 1.40 below.
Table: 1.40 (` in crore)
Year 2008-09 2009-10 2010-11 2011-12 2012-13
Net Open Market borrowings 6,583.58 4,953.88 1,037.27 6,207.50 9,148.76
Average investments in TBs 6,550.16 13,833.82 17,489.55 10,107.72 10,914.20
Interest earned 232.53 309.04 400.28 381.69 531.57
Closing Cash Balance 7,519.31 8,889.99 6,871.51 7,640.61 6,872.36
Source: Finance Accounts
The issue of debt sustainability of the State is related to prudent and sustainable debt practices such as the setting of clear debt management objectives, duration and maturity of loans, debt expansion commensurate with capital expansion plans, investments in projects for durable assets with sustainable income generation capacity etc. As reiterated by the successive Finance Commissions, it is essential that the States follow the practice of borrowing on requirement rather than availability. The XIII FC has emphasized that the position of the available cash balance be considered first before going in for fresh borrowings. It was seen that though the borrowings were raised duly reckoning surplus cash balances, maturity profile, revenue position etc., the Finance Department could have restricted the borrowings during the years 2008-13. The annual borrowing ceilings for the year were approved much in advance by GOI. Later, the State Government went for borrowings at different intervals during the year to fulfill the borrowing requirement after approval by GOI. It was also seen that there was no GOI instructions/advice while approving the borrowing programme of the Government.
The Finance Department had carried out an impact analysis with regard to the interest payments and the maturity profile of the borrowings before going for fresh borrowings. As brought out in MTFP 2013-17, the borrowing profile of the State had shown an increasing trend of greater reliance on open market borrowing, while the share of National Small Savings Fund (NSSF) of the Central Government loans decreased considerably. The GOI constituted committee on the comprehensive (July 2010) review of NSSF had recommended that the mandatory component of investment in NSSF in State Government’s securities be reduced from 80 to 50 per cent. While accepting the recommendations (June 2011) GOI had sought the State’s option of 80 or 50 per cent of mandatory borrowings. In view of the higher cost of NSSF loans, the State Government opted for 50 per cent share in net collections during 2012-13. As a result, its share in borrowings was expected to come down in the medium term.
1.10.4 Maturity Profile of Market Borrowings
The maturity profile of borrowings showed that since 2005-06, all issues of State Development Loans (SDL) had a maturity of 10 years. A significant shift in this trend took place in 2012-13 when the State Government strategically went for development loans of varying tenures. On the RBI’s advice, the State undertook to
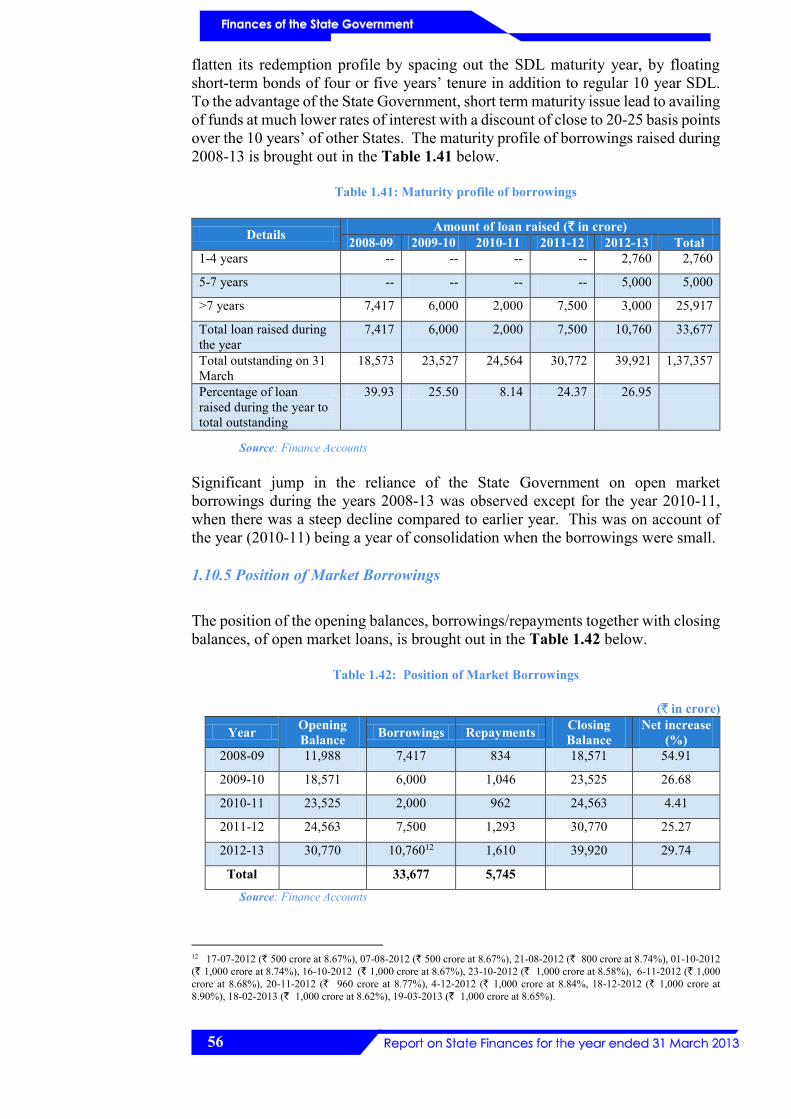
56
flatten its redemption profile by spacing out the SDL maturity year, by floating short-term bonds of four or five years’ tenure in addition to regular 10 year SDL. To the advantage of the State Government, short term maturity issue lead to availing of funds at much lower rates of interest with a discount of close to 20-25 basis points over the 10 years’ of other States. The maturity profile of borrowings raised during 2008-13 is brought out in the Table 1.41 below.
Table 1.41: Maturity profile of borrowings
Details Amount of loan raised (` in crore) 2008-09 2009-10 2010-11 2011-12 2012-13 Total
1-4 years -- -- -- -- 2,760 2,760
5-7 years -- -- -- -- 5,000 5,000
>7 years 7,417 6,000 2,000 7,500 3,000 25,917
Total loan raised during the year
7,417 6,000 2,000 7,500 10,760 33,677
Total outstanding on 31 March
18,573 23,527 24,564 30,772 39,921 1,37,357
Percentage of loan raised during the year to total outstanding
39.93 25.50 8.14 24.37 26.95
Source: Finance Accounts
Significant jump in the reliance of the State Government on open market borrowings during the years 2008-13 was observed except for the year 2010-11, when there was a steep decline compared to earlier year. This was on account of the year (2010-11) being a year of consolidation when the borrowings were small.
1.10.5 Position of Market Borrowings
The position of the opening balances, borrowings/repayments together with closing balances, of open market loans, is brought out in the Table 1.42 below.
Table 1.42: Position of Market Borrowings
(` in crore) Year Opening
Balance Borrowings Repayments Closing Balance
Net increase (%)
2008-09 11,988 7,417 834 18,571 54.91
2009-10 18,571 6,000 1,046 23,525 26.68
2010-11 23,525 2,000 962 24,563 4.41
2011-12 24,563 7,500 1,293 30,770 25.27
2012-13 30,770 10,76012 1,610 39,920 29.74
Total 33,677 5,745
Source: Finance Accounts
12 17-07-2012 (` 500 crore at 8.67%), 07-08-2012 (` 500 crore at 8.67%), 21-08-2012 (` 800 crore at 8.74%), 01-10-2012 (` 1,000 crore at 8.74%), 16-10-2012 (` 1,000 crore at 8.67%), 23-10-2012 (` 1,000 crore at 8.58%), 6-11-2012 (` 1,000 crore at 8.68%), 20-11-2012 (` 960 crore at 8.77%), 4-12-2012 (` 1,000 crore at 8.84%, 18-12-2012 (` 1,000 crore at 8.90%), 18-02-2013 (` 1,000 crore at 8.62%), 19-03-2013 (` 1,000 crore at 8.65%).
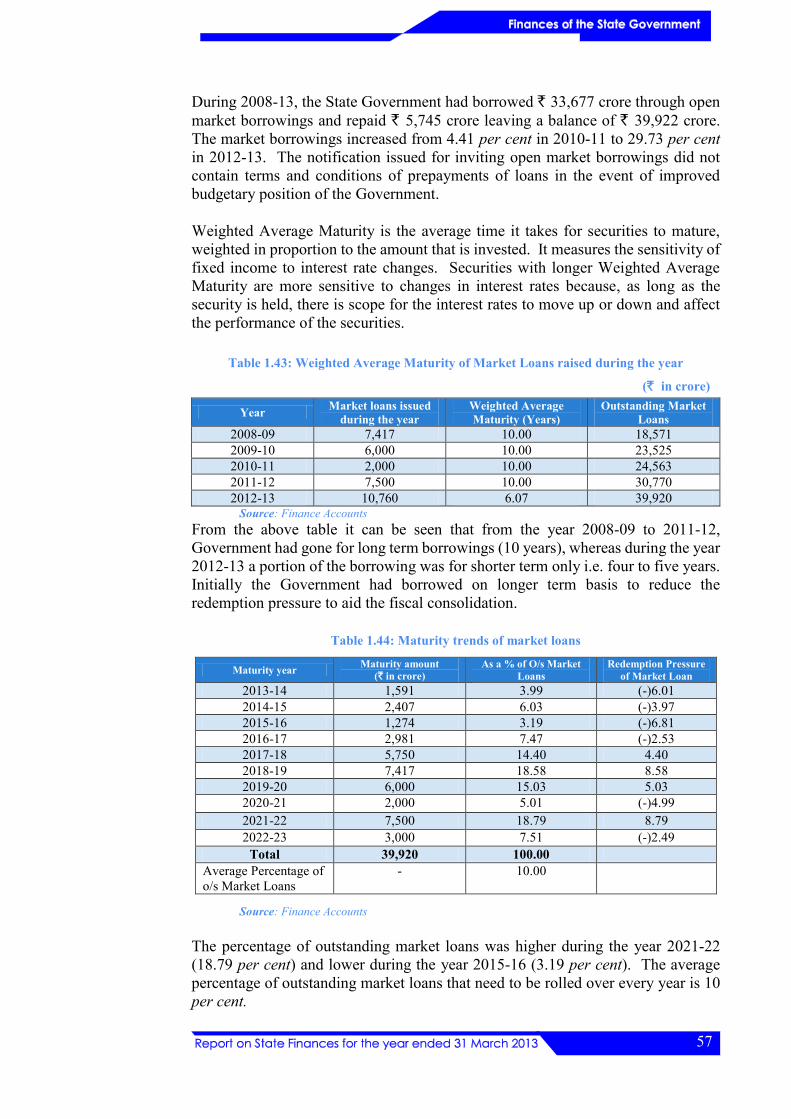
57
During 2008-13, the State Government had borrowed ` 33,677 crore through open market borrowings and repaid ` 5,745 crore leaving a balance of ` 39,922 crore. The market borrowings increased from 4.41 per cent in 2010-11 to 29.73 per cent in 2012-13. The notification issued for inviting open market borrowings did not contain terms and conditions of prepayments of loans in the event of improved budgetary position of the Government.
Weighted Average Maturity is the average time it takes for securities to mature, weighted in proportion to the amount that is invested. It measures the sensitivity of fixed income to interest rate changes. Securities with longer Weighted Average Maturity are more sensitive to changes in interest rates because, as long as the security is held, there is scope for the interest rates to move up or down and affect the performance of the securities.
Table 1.43: Weighted Average Maturity of Market Loans raised during the year
(` in crore)
Source: Finance Accounts From the above table it can be seen that from the year 2008-09 to 2011-12, Government had gone for long term borrowings (10 years), whereas during the year 2012-13 a portion of the borrowing was for shorter term only i.e. four to five years. Initially the Government had borrowed on longer term basis to reduce the redemption pressure to aid the fiscal consolidation.
Table 1.44: Maturity trends of market loans
Maturity year Maturity amount (` in crore)
As a % of O/s Market Loans
Redemption Pressure of Market Loan
2013-14 1,591 3.99 (-)6.01 2014-15 2,407 6.03 (-)3.97 2015-16 1,274 3.19 (-)6.81 2016-17 2,981 7.47 (-)2.53 2017-18 5,750 14.40 4.40 2018-19 7,417 18.58 8.58 2019-20 6,000 15.03 5.03 2020-21 2,000 5.01 (-)4.99 2021-22 7,500 18.79 8.79 2022-23 3,000 7.51 (-)2.49
Total 39,920 100.00 Average Percentage of o/s Market Loans
- 10.00
Source: Finance Accounts
The percentage of outstanding market loans was higher during the year 2021-22 (18.79 per cent) and lower during the year 2015-16 (3.19 per cent). The average percentage of outstanding market loans that need to be rolled over every year is 10 per cent.
Year Market loans issued during the year
Weighted Average Maturity (Years)
Outstanding Market Loans
2008-09 7,417 10.00 18,571 2009-10 6,000 10.00 23,525 2010-11 2,000 10.00 24,563 2011-12 7,500 10.00 30,770 2012-13 10,760 6.07 39,920

58
Taking into account this rollover every year i.e. redemption pressure of market loan, it was observed that there is a negative trend in the redemption pressure of the market loans up to the years 2016-17 and afterwards there is increase in redemption pressure of the Market Loans. From the table it could be seen that the redemption pressure is negative in six out of ten years which is a positive trend. This was on account of lower borrowings previously. The redemption pressure will be high during 2021-22 (8.79 per cent) and less during the year 2017-18 (minus 2.53 per cent). It can be inferred that there will be a huge liability on the Government for the repayment of Market Loans from the year 2018-19 onwards. From the year 2018-19 onwards the rollover risk of Market loans has exhibited an increasing trend.
1.10.6 Interest rate profile
The interest rate profile of open market borrowings during the period 2008-13 is detailed in the Table 1.45 below:
Table 1.45: Interest rate profile
Rate of Interest (per cent)
Market loans raised during the year (` in Crore) 2008-09 2009-10 2010-11 2011-12 2012-13 Total
6 to 6.99 1,500 - - - - 1,500
7 to 7.99 3,000 2,000 - - - 5,000
8 to 8.99 2,917 4,000 2,000 6,000 10,760 25,677
9 to 9.99 - - - 1,500 - 1,500
Total 7,417 6,000 2,000 7,500 10,760 33,677
Average Interest Rate 7.65 8.10 8.43 8.81 8.72 8.34
Source: Finance Accounts As the table shows 76 per cent of the total loans are in the range of 8 to 8.99 per cent rate of interest raised through market borrowings by auction/bidding system. Escalation of market interest rates in tandem with the steady increase of these borrowings was also seen during the period.
1.10.7 Application of borrowings
The borrowed funds (secured and unsecured) are applied for capital expenses for creation of durable assets of material character. As the State Government had maintained surplus on revenue account throughout the period 2008-13, a part of the surplus was utilised for capital formation. This implied that the borrowed funds were spent on capital expenditure. However, the surplus on revenue account was on account of certain fund adjustment transactions. In these cases, the transfer of resources/revenues to the fund head was more than the expenditure debited to the fund. This was on account of improper estimation of expenditure to be incurred during the year relating to the fund. The details of such transactions are indicated in Table 1.46 below.

59
Table 1.46: Details of Fund adjustments made during 2008-13
Year
Revenue surplus as per
accounts (` in
crore)
Surplus overstated by
Audit comments Fund head of A/c. Amount
2008-09 1,635 Karnataka State Forest Development (KFD) Fund Infrastructure Initiative Fund (IIF), Bangalore Metro Rail Corporation Limited (BMRCL) Fund and Chief Minister’s Rural Road Development (CMRRD) Fund
` 9.27 crore on account of transfer of revenue relating to the fund from Consolidated Fund without matching expenditure during the year. ` 1,850 crore was transferred from general revenues to these funds during the year. However, the related expenditure was not transferred on the ground that the accretion to and expenditure from the fund need not be in the same year.
By transferring ` 1,859.27 crore in these cases, the revenue expenditure stood overstated to that extent, reducing revenue surplus and leading to more borrowings.
2009-10 1,629 KFD Fund Infrastructure Initiative Fund (IIF), BMRCL and CMRRD Fund Fiscal Management Fund
` 247.65 crore on account of transfer of revenue relating to the fund from Consolidated Fund without matching expenditure during the year. ` 2,100 crore was transferred from general revenues to these funds during the year. However, the related expenditure was not transferred on the ground that the accretion to and expenditure from the fund need not be in the same year ` 150 crore was transferred from general revenues. The rules regarding governance of the fund had not been framed.
By transferring ` 2,497.65 crore in these cases the revenue expenditure stood overstated to that extent, reducing revenue surplus and leading to more borrowings.
2010-11 4,172 KFD Fund Infrastructure Initiative Fund, BMRCL and CMRRD Fund Fiscal Management Fund Protected Area Management Fund (PAMF)
` 508.31 crore on account of transfer of revenue relating to the fund from Consolidated Fund without matching expenditure during the year. ` 650 crore was transferred to BMRCL from general revenues fund during the year. However, the related expenditure was not transferred on the ground that the accretion to and expenditure from the fund need not be in the same year. ` 150 crore was transferred from general revenues. The rules regarding governance of the fund had not been framed. ` 4.50 crore on account of transfer of revenue relating to the fund from Consolidated Fund without matching expenditure during the year.
By transferring ` 1,312.81 crore in these cases the revenue expenditure stood overstated to that extent, reducing revenue surplus and leading to more borrowings.
2011-12 4,521 KFD Fund Infrastructure Initiative Fund, BMRCL and CMRRD Fund Fiscal Management Fund
` 139.13 crore on account of transfer of revenue relating to the fund from Consolidated Fund without matching expenditure during the year. ` 2,100 crore was transferred to BMRCL from general revenues funds during the year. However, the related expenditure was not transferred on the ground that the accretion to and expenditure from the fund need not be in the same year. ` 50 crore was transferred from general revenues. The rules regarding governance of the fund had not been framed.
By transferring ` 2,289.13 crore in these cases the revenue expenditure stood overstated to that extent, reducing revenue surplus and leading to more borrowings.
2012-13 1,883 KFD Fund
` 709.83 crore on account of transfer of revenue relating to the fund from Consolidated Fund without matching expenditure during the year.
By transferring ` 709.83 crore in these cases the revenue expenditure stood overstated to that extent, reducing revenue surplus and leading to more borrowings.

60
In respect of IIF, BMRCL Fund and CMRRD Fund, though approval of the Legislature was obtained for transfer of the related expenditure to the fund head during the year, the related expenditure was not transferred and was allowed to remain in the Consolidated Fund itself. It was replied by Finance Department that the transfer to the fund was dependent on overall fiscal position managed by the executive. However, a reserve fund which is created for specific purpose to account for transactions of a particular character should record all transactions in complete form. Exclusion of a particular set of transactions (transfer of debit from the Consolidated Fund to the Public Account) distorts the fiscal indicators of the Government. In respect of Forest Development Fund (FDF) and the PAMF, adequate provision was necessary to incur the expenditure. The State Government had stated in MTFP 2011-15 that whenever there was a demand on respective reserve fund, the GOI would be approached for additional borrowings. This clearly implied that the transactions under the fund heads led to an increase of the fiscal deficit. The Public Accounts Committee (PAC) of the Legislature had recommended adherence to the accounting norms and principles in respect of fund transactions. The action taken report on the recommendation of the PAC was awaited.
1.10.8 Investment and returns
The details of the investments of the Government and returns thereon in the form of dividend and their percentage to total investment, the investment of Government in loss making concerns, conversion of loans into equity etc. are brought out in paragraphs 1.8.2 and 1.8.5.
1.10.9 Loans and Advances by Government
The details of Loans and Advances made by the Government, the returns on such loans and advances, instances of conversion of loans into equity, non-issue of terms and conditions for loans and advances have been discussed in paragraphs 1.8.2 and 1.8.5.
1.10.10 Release of funds in respect of off-budget borrowings
These are borrowings by Companies/Corporations through financial institutions on a Government guarantee; the servicing of such debts is solely on the Government, through capital / revenue account. A scrutiny of the accounts of two such entities showed that M/s. Krishna Bhagya Jala Nigam Limited (KBJNL) had a cash balance of ` 1,246 crore which included fixed deposits amounting to ` 260 crore. M/s. Karnataka Road Development Corporation Limited (KRDCL) had a fixed deposit of ` 654 crore and cash balance of ` 137 crore. These amounts were mainly released by the Government for servicing of debt. These funds thus released by the Government during the period 2008-09 to 2011-12 had not been properly utilised nor supervision of utilisation of funds released during the year considered before fresh release of funds. This had the effect of inflating the capital expenditure to the extent stated above. It was further stated by these two entities that the releases are based on the budgetary allocations made to them and that funds are required to take up fresh works as per approved programme of works and timely payment of bills to ensure targeted level of progress.

61
Mention was made in the Report on State Finances (2008-09) on the parking of funds of ` 250 crore released to M/s. KRDCL without being put to use. Subsequently, ` 10 crore was withdrawn during the year 2010-11 and ` 240 crore during 2011-12 for the purpose of investment in Public Private Partnership Project, of which only ` 25.31 crore had been spent leaving a balance of ` 224.69 crore with the company. The action of the Government in 2008-09 clearly indicated that the amount was released without proper justification/examination of facts.
Mention was also made in the Report on State Finances (2008-09) on parking of funds in public sector banks by M/s. Karnataka Power Transmission Corporation Ltd., (` 500 crore). The said release of money was treated as soft loan and subsequently treated as equity (2009-10). This had the effect of the amount being utilised twice impacting the fiscal deficit.
An amount of ` 500 crore was released to Karnataka Power Corporation Ltd. as equity to add to its power generation capacity. The shares were, however, not allotted. The amount was deposited in a nationalized bank on April 2, 2009. An amount of ` 336 crore was utilised during August 2009 and the balance of ` 164 crore was retained in fixed deposit. This has led to overstating the capital expenditure of the Government during the year as the amounts were released only to avoid lapse of budget grants / escalate capital expenditure.
1.10.11 Subsidy expenditure
Subsidy under power sector is towards regularization of unauthorized Irrigation pump sets below 10 horse power. The State Government had released ̀ 96.41 crore during the period 2006-13 to M/s. Bangalore Electricity Supply Company (BESCOM). However, only ̀ 44.78 crore was utilised leaving a balance of ̀ 51.63 crore with the entity. The revenue expenditure during the period stood overstated to that extent.
1.11 Debt Management
1.11.1 Debt Profile
Table 1.47 gives details of outstanding fiscal liabilities of the Government under Consolidated Fund and Public Account compared with the per capita liability.
Table 1.47: Debt Profile of the State (` in crore)
Borrowings through 2008-09 2009-10 2010-11 2011-12 2012-13 Open market loans 18,571 23,525 24,563 30,770 39,920 Negotiated loans 2,074 2,345 2,763 2,972 3,425 NSSF loans 19,351 19,598 21,436 20,591 20,074 GOI loans 9,692 9,902 10,515 10,982 11,634 Public Account borrowings 21,862 28,112 32,666 37,715 41,714 Total Fiscal liabilities 71,550 83,482 91,943 1,03,030 1,16,767 Population (in crore) 5.79 5.85 5.91 6.11 6.11 Per capita debt ratio(in `) 12,358 14,270 15,557 16,863 19,111
The per capita debt has significantly increased from ̀ 12,358 in 2008-09 to ̀ 19,111 in 2012-13, an increase of 55 per cent.

62
1.11.2 Debt sustainability
Apart from the magnitude of the debt of the State Government, it is important to analyze various indicators that determine the debt sustainability of the State. The debt sustainability is defined as the ability of the State to maintain a constant debt-GDP ratio over a period of time and also embodies the concern about the ability to service its debt. Sustainability of debt therefore also refers to sufficiency of liquid assets to meet current or committed obligations and the capacity to keep a balance between costs of additional borrowings and returns from such borrowings. It means that rise in fiscal deficit should match the increase in capacity to service the debt. This section assesses the sustainability of debt of the State Government in terms of debt stabilization, sufficiency of non-debt receipts, net availability of borrowed funds, burden of interest payments (measured by interest payments to revenue receipts ratio) and maturity profile of the State Government securities. Table 1.48 and Appendix 1.11 analyses the debt sustainability of the State according to these indicators for the period 2008-13.
Table 1.48: Debt sustainability indicators and trends
Debt sustainability indicators 2008-09 2009-10 2010-11 2011-12 2012-13
Debt stabilization (` in crore) (Quantum spread -/+ Primary deficit/ surplus)
1,395 (-)3,926 5,774 2,613 1,961
Sufficiency of incremental non-debt receipts (resource gap) (` in crore)
(-)3,400 (-)2,143 187 (-)1,612 (-)2,207
Net availability of borrowed Funds (in per cent) 21 18 9 13 16 Burden of interest payments (IP/RR Ratio)
10.5 10.6 9.7 9.5 9.5
Maturity profile of State debt (in years) (` in crore) 0 - 1 1(0) 1 – 3 3,998(10) 3 – 5 4,254(11) 5 – 7 13.167(33) 7 and above 18,500(46)
Figures in brackets denote the percentage to market borrowings of ` 39,920 crore. Source: Finance Accounts.
1.11.3 Debt stability
Fiscal liabilities are considered sustainable if the Government is able to service these liabilities over the foreseeable future and the debt – GSDP ratio does not grow to unmanageable proportions. A necessary condition for stability is the Domar’s Debt Stability Equation. It states that if the rate of growth of economy exceeds the cost of borrowings, the debt-GSDP ratio is likely to be stable provided primary balances are positive /zero/moderately negative. Primary revenue balance is the difference between revenue receipts and primary revenue expenditure and indicates whether the balance of revenue receipts left out after meeting current revenue expenditure is sufficient for meeting the interest expenditure. During 2008-13 the primary revenue balance was positive and sufficient to meet interest expenditure.
Interest spread is the difference between average lending rate and average borrowing rate. Quantum spread is the product of debt stock and interest spread. The interest spread and quantum spread will be positive/negative depending on whether the GSDP growth rate is more or less than the growth rate of interest payments. When the quantum spread and primary deficit are negative, debt-GSDP ratio will be high indicating un-sustainability of public debt and when the quantum spread and primary deficit are positive, debt-GSDP ratio (excluding off-budget
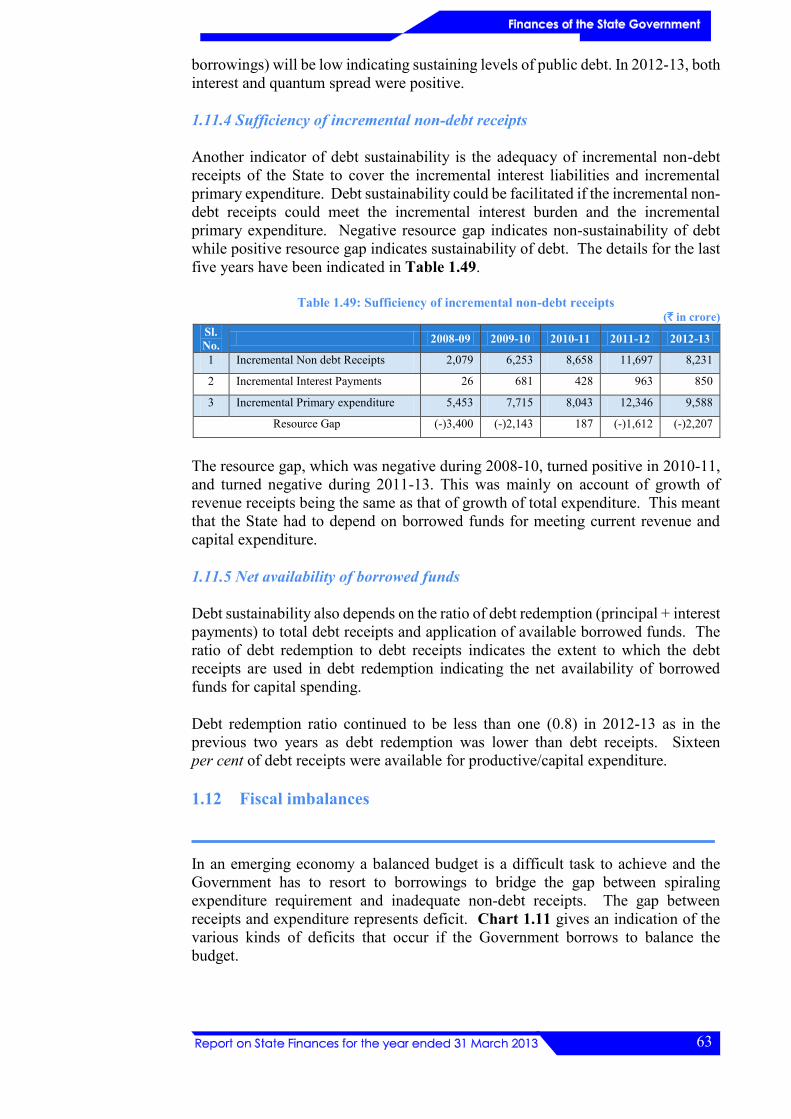
63
borrowings) will be low indicating sustaining levels of public debt. In 2012-13, both interest and quantum spread were positive.
1.11.4 Sufficiency of incremental non-debt receipts
Another indicator of debt sustainability is the adequacy of incremental non-debt receipts of the State to cover the incremental interest liabilities and incremental primary expenditure. Debt sustainability could be facilitated if the incremental non-debt receipts could meet the incremental interest burden and the incremental primary expenditure. Negative resource gap indicates non-sustainability of debt while positive resource gap indicates sustainability of debt. The details for the last five years have been indicated in Table 1.49.
Table 1.49: Sufficiency of incremental non-debt receipts (` in crore)
Sl. No. 2008-09 2009-10 2010-11 2011-12 2012-13
1 Incremental Non debt Receipts 2,079 6,253 8,658 11,697 8,231
2 Incremental Interest Payments 26 681 428 963 850
3 Incremental Primary expenditure 5,453 7,715 8,043 12,346 9,588
Resource Gap (-)3,400 (-)2,143 187 (-)1,612 (-)2,207
The resource gap, which was negative during 2008-10, turned positive in 2010-11, and turned negative during 2011-13. This was mainly on account of growth of revenue receipts being the same as that of growth of total expenditure. This meant that the State had to depend on borrowed funds for meeting current revenue and capital expenditure.
1.11.5 Net availability of borrowed funds
Debt sustainability also depends on the ratio of debt redemption (principal + interest payments) to total debt receipts and application of available borrowed funds. The ratio of debt redemption to debt receipts indicates the extent to which the debt receipts are used in debt redemption indicating the net availability of borrowed funds for capital spending.
Debt redemption ratio continued to be less than one (0.8) in 2012-13 as in the previous two years as debt redemption was lower than debt receipts. Sixteen per cent of debt receipts were available for productive/capital expenditure.
1.12 Fiscal imbalances
In an emerging economy a balanced budget is a difficult task to achieve and the Government has to resort to borrowings to bridge the gap between spiraling expenditure requirement and inadequate non-debt receipts. The gap between receipts and expenditure represents deficit. Chart 1.11 gives an indication of the various kinds of deficits that occur if the Government borrows to balance the budget.

64
Chart 1.11: Type of deficits
The nature of deficit is an indicator of the prudence of fiscal management of the Government. Further, the ways in which the deficit is financed and the resources raised are applied are important pointers to fiscal health. This section presents the trends, nature, magnitude and the manner of financing these deficits and also the assessment of actual levels of revenue and fiscal deficits vis-à-vis targets set under FRA for the financial year 2012-13.
1.12.1 Trends in deficits
Charts 1.12 and 1.13 present the trends in deficit indicators over the period 2008-13.
The targets for revenue and fiscal deficits set for the TFC and XIII FC periods along with their actual levels are given in Table 1.50.
Deficit
Revenue Deficit
Revenue Expenditure
(-)
Revenue Receipts
Fiscal Deficit
Total Expenditure (excluding repayment of borrowings)
(-)
Total receipts (excluding borrowings)
Primay Deficit
Fiscal Defict
(-)
Interest Payment
-15000-13500-12000-10500
-9000-7500-6000-4500-3000-1500
01500300045006000
2008-09 2009-10 2010-11 2011-12 2012-13
1635 16294172 4521
1883
-8732
-10875
-10688
-12470-14507
-4200-5662 -5047 -5866
-7053
(`in
Cro
re)
Chart 1.12: Fiscal imbalances
Revenue Surplus Fiscal Deficit Primary Deficit
0.53 0.481.05
0.99
0.36
2.81
3.22
2.68 2.722.76
1.35
1.68
1.271.28
1.34
0
0.5
1
1.5
2
2.5
3
3.5
2008-09 2009-10 2010-11 2011-12 2012-13
In p
erce
nt to
GSD
P
Chart 1.13: Trends in deficit indicators relative to GSDP
RS / GSDP FD / GSDP PD / GSDP

65
Table 1.50: Outcome vis-à-vis targets under FRA
Period Revenue deficit Fiscal deficit (in percentage)
Targets as per FRA Actual Targets as per FRA
Actual
TFC (2005)10)
2008-09 Maintain Revenue Surplus Maintained
Revenue Surplus
3.5 2.81
2009-10 4.0 3.22
XIII FC (2010-15)
2010-11
Maintain Revenue Surplus Achieved the target
3.44 2.68
2011-12 3.00 2.72
2012-13 3.00 2.76
Source: Finance Accounts
The Government has been able to maintain revenue surplus during the 2008-13. The fiscal target of wiping out revenue deficit by March 2006, as laid down in FRA, was achieved by the State one year ahead in 2004-05. Thereafter the State maintained revenue surplus till 2012-13 with inter-year variations. In 2012-13, the revenue surplus decreased by ` 2,638 crore over previous year and was ` 1,883 crore. The decrease was mainly on account of implementation of the award of the Sixth Pay Commission to its employees/pensioners, increased payment towards subsidies and fund adjustments through book transfers.
The FRA target of reducing fiscal deficit to GSDP ratio to less than three per cent was also met.
In 2012-13 there was a moderate increase in the ratio of fiscal deficit to GSDP as compared to the previous year and was 2.76 per cent, which was well within the target of three per cent.
However, the following transactions affected the fiscal indicators of the State:
(i) Non-transfer of revenues (` 26.63 crore) / expenditure (` 7.40 crore) in respect of Karnataka Silk Worm Cocoon and Silk Yarn Development and Price Stabilisation Fund and ` 2.63 crore being the GOI contribution to Consumer Welfare Fund for carrying out consumer welfare activities remained under the Consolidated Fund.
(ii) Adjustment of ` 1,000 crore under Consolidated Sinking Fund and treating the investment as investment from Fiscal Management Fund by an equivalent amount, thus making the transaction revenue neutral.
(iii) Utilizing / bringing the earlier years’ transaction to current year’s books of account viz., conversion of loan to equity (` 11.22 crore), conversion of investment into revenue / capital expenditure (` two crore) etc., resulted in boosting of capital expenditure and revenue expenditure of current year, thereby allowing the State to borrow more.
Revenue Surplus
Revenue surplus represents the difference between revenue receipts and revenue expenditure. Revenue surplus helps to decrease the borrowings.
Against the growth rate of 12 per cent of revenue receipts, the growth rate of

66
revenue expenditure was 17 per cent. This resulted in revenue surplus being brought down during 2012-13.
The State Government in MTFP (2013-17) has stated that ‘the high percentage of committed revenue expenditure to uncommitted revenue receipts revealed that the State has limited flexibility in allocation of resources’. Hence, the need of the hour is expenditure rationalization by weeding out non-essential schemes, limiting non development revenue expenditure and streamlining revenue collections.
Fiscal Deficit
Fiscal deficit represents the net incremental liabilities of the Government or its additional borrowings. The shortfall could be met either by additional public debt (internal or external) or by the use of surplus funds from Public Account. Fiscal deficit trends along with the trends of the deficit relative to key components are indicated in Table1.51.
Table 1.51: Fiscal deficit and its parameters
(` in crore)
Source: Finance Accounts
In 2009-10 fiscal deficit as a percentage of GSDP, non-debt receipts and total expenditure was the highest due to enhancement of fiscal deficit limit based on the advice of the GOI. During 2012-13, fiscal deficit as a percentage of GSDP once again increased, mainly on account of increase in borrowings / reduced revenue surplus.
Primary Deficit
While fiscal deficit represents the need for additional resources in general, a part of such resources may be needed to finance interest payments in respect of States having deficit on revenue account. Interest payments represent the expenditure of past obligations and are independent of ongoing expenditure. To look at the imbalances of the current nature, these payments need to be separated and deducted from the total imbalances. The primary deficit and its parameters for the last five years are indicated in Table 1.52.
Table: 1.52: Primary deficit and its parameters (` in crore)
Period Fiscal Deficit Interest Payments Primary Deficit
2008-09 8,732 4,532 4,200 2009-10 10,875 5,213 5,662 2010-11 10,688 5,641 5,047 2011-12 12,470 6,604* 5,866 2012-13 14,507 7,454* 7,053
Source: Finance Accounts *includes interest payment of ` 542 crore and ` 621 crore towards off-budget borrowings and
others during 2011-12 and 2012-13 respectively
Period Non-debt Receipts
Total expenditure
Fiscal Deficit
Fiscal Deficit as per cent of
GSDP Non-debt receipt
Total expenditure
2008-09 43,528 52,260 8,732 2.81 20.06 16.71 2009-10 49,781 60,656 10,875 3.22 21.84 17.93 2010-11 58,439 69,127 10,688 2.68 18.29 15.46 2011-12 70,136 82,436 12,470 2.72 17.78 15.13 2012-13 78,367 92,874 14,507 2.76 18.51 15.62
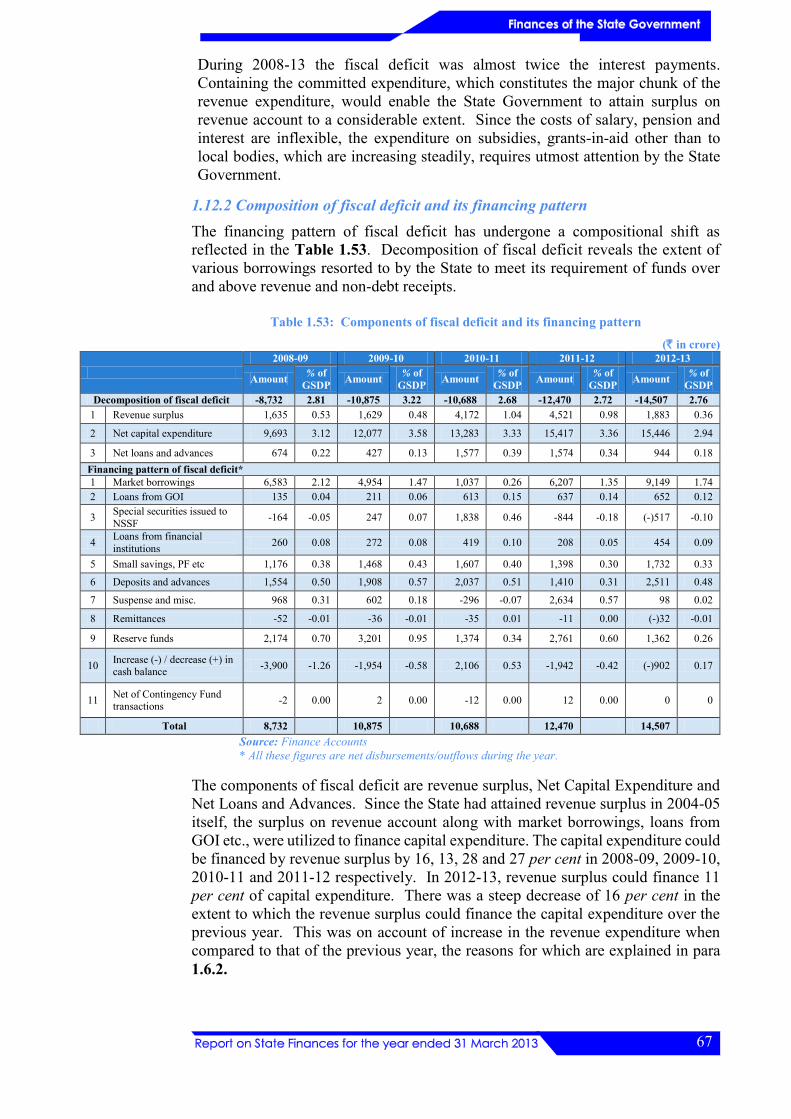
67
During 2008-13 the fiscal deficit was almost twice the interest payments. Containing the committed expenditure, which constitutes the major chunk of the revenue expenditure, would enable the State Government to attain surplus on revenue account to a considerable extent. Since the costs of salary, pension and interest are inflexible, the expenditure on subsidies, grants-in-aid other than to local bodies, which are increasing steadily, requires utmost attention by the State Government.
1.12.2 Composition of fiscal deficit and its financing pattern The financing pattern of fiscal deficit has undergone a compositional shift as reflected in the Table 1.53. Decomposition of fiscal deficit reveals the extent of various borrowings resorted to by the State to meet its requirement of funds over and above revenue and non-debt receipts.
Table 1.53: Components of fiscal deficit and its financing pattern
(` in crore)
2008-09 2009-10 2010-11 2011-12 2012-13
Amount % of GSDP Amount % of
GSDP Amount % of GSDP Amount % of
GSDP Amount % of GSDP
Decomposition of fiscal deficit -8,732 2.81 -10,875 3.22 -10,688 2.68 -12,470 2.72 -14,507 2.76 1 Revenue surplus 1,635 0.53 1,629 0.48 4,172 1.04 4,521 0.98 1,883 0.36
2 Net capital expenditure 9,693 3.12 12,077 3.58 13,283 3.33 15,417 3.36 15,446 2.94
3 Net loans and advances 674 0.22 427 0.13 1,577 0.39 1,574 0.34 944 0.18 Financing pattern of fiscal deficit* 1 Market borrowings 6,583 2.12 4,954 1.47 1,037 0.26 6,207 1.35 9,149 1.74 2 Loans from GOI 135 0.04 211 0.06 613 0.15 637 0.14 652 0.12
3 Special securities issued to NSSF -164 -0.05 247 0.07 1,838 0.46 -844 -0.18 (-)517 -0.10
4 Loans from financial institutions 260 0.08 272 0.08 419 0.10 208 0.05 454 0.09
5 Small savings, PF etc 1,176 0.38 1,468 0.43 1,607 0.40 1,398 0.30 1,732 0.33
6 Deposits and advances 1,554 0.50 1,908 0.57 2,037 0.51 1,410 0.31 2,511 0.48
7 Suspense and misc. 968 0.31 602 0.18 -296 -0.07 2,634 0.57 98 0.02
8 Remittances -52 -0.01 -36 -0.01 -35 0.01 -11 0.00 (-)32 -0.01
9 Reserve funds 2,174 0.70 3,201 0.95 1,374 0.34 2,761 0.60 1,362 0.26
10 Increase (-) / decrease (+) in cash balance -3,900 -1.26 -1,954 -0.58 2,106 0.53 -1,942 -0.42 (-)902 0.17
11 Net of Contingency Fund transactions -2 0.00 2 0.00 -12 0.00 12 0.00 0 0
Total 8,732 10,875 10,688 12,470 14,507 Source: Finance Accounts * All these figures are net disbursements/outflows during the year.
The components of fiscal deficit are revenue surplus, Net Capital Expenditure and Net Loans and Advances. Since the State had attained revenue surplus in 2004-05 itself, the surplus on revenue account along with market borrowings, loans from GOI etc., were utilized to finance capital expenditure. The capital expenditure could be financed by revenue surplus by 16, 13, 28 and 27 per cent in 2008-09, 2009-10, 2010-11 and 2011-12 respectively. In 2012-13, revenue surplus could finance 11 per cent of capital expenditure. There was a steep decrease of 16 per cent in the extent to which the revenue surplus could finance the capital expenditure over the previous year. This was on account of increase in the revenue expenditure when compared to that of the previous year, the reasons for which are explained in para 1.6.2.
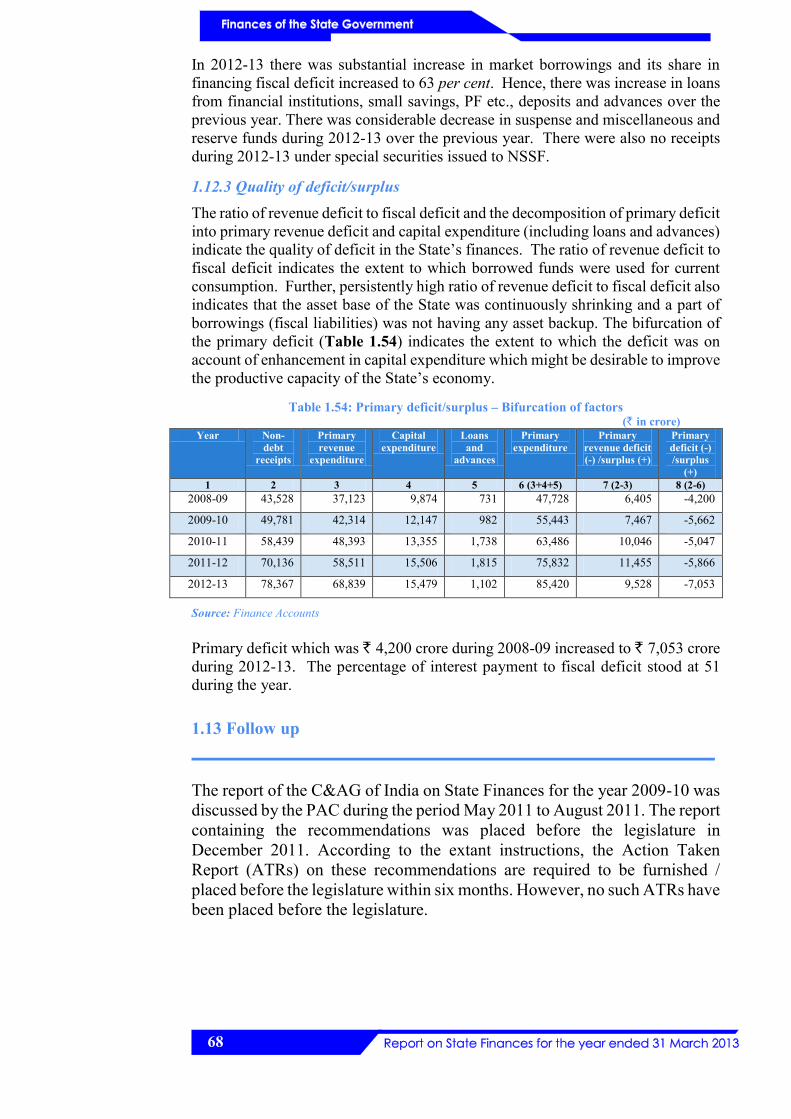
68
In 2012-13 there was substantial increase in market borrowings and its share in financing fiscal deficit increased to 63 per cent. Hence, there was increase in loans from financial institutions, small savings, PF etc., deposits and advances over the previous year. There was considerable decrease in suspense and miscellaneous and reserve funds during 2012-13 over the previous year. There were also no receipts during 2012-13 under special securities issued to NSSF.
1.12.3 Quality of deficit/surplus
The ratio of revenue deficit to fiscal deficit and the decomposition of primary deficit into primary revenue deficit and capital expenditure (including loans and advances) indicate the quality of deficit in the State’s finances. The ratio of revenue deficit to fiscal deficit indicates the extent to which borrowed funds were used for current consumption. Further, persistently high ratio of revenue deficit to fiscal deficit also indicates that the asset base of the State was continuously shrinking and a part of borrowings (fiscal liabilities) was not having any asset backup. The bifurcation of the primary deficit (Table 1.54) indicates the extent to which the deficit was on account of enhancement in capital expenditure which might be desirable to improve the productive capacity of the State’s economy.
Table 1.54: Primary deficit/surplus – Bifurcation of factors (` in crore)
Year Non-debt
receipts
Primary revenue
expenditure
Capital expenditure
Loans and
advances
Primary expenditure
Primary revenue deficit (-) /surplus (+)
Primary deficit (-) /surplus
(+) 1 2 3 4 5 6 (3+4+5) 7 (2-3) 8 (2-6)
2008-09 43,528 37,123 9,874 731 47,728 6,405 -4,200
2009-10 49,781 42,314 12,147 982 55,443 7,467 -5,662
2010-11 58,439 48,393 13,355 1,738 63,486 10,046 -5,047
2011-12 70,136 58,511 15,506 1,815 75,832 11,455 -5,866
2012-13 78,367 68,839 15,479 1,102 85,420 9,528 -7,053
Source: Finance Accounts
Primary deficit which was ` 4,200 crore during 2008-09 increased to ` 7,053 crore during 2012-13. The percentage of interest payment to fiscal deficit stood at 51 during the year.
1.13 Follow up
The report of the C&AG of India on State Finances for the year 2009-10 was discussed by the PAC during the period May 2011 to August 2011. The report containing the recommendations was placed before the legislature in December 2011. According to the extant instructions, the Action Taken Report (ATRs) on these recommendations are required to be furnished / placed before the legislature within six months. However, no such ATRs have been placed before the legislature.

69
1.14 Conclusion and recommendations
Fiscal Position
The State continued to maintain revenue surplus during 2008-13 and kept fiscal deficit relative to GSDP below the limit laid down under FRA.
During 2012-13, revenue surplus was ` 1,883 crore, less than the previous year’s surplus by ` 2,638 crore, mainly on account of increase in revenue expenditure due to implementation of the award of the Sixth Pay Commission, increased subsidies and fund adjustments through book transfers. The fiscal deficit during 2012-13 was 2.76 per cent of GSDP within the limit laid down under the FRA.
Recommendation: Various Central/State legislations like Right to Education, Food Security Act, Employment Guarantee measures etc. are emerging concerns necessitating the review of resources as a whole to access their allocative and technical efficiency.
State’s own resources
The ratio of State’s tax revenue to GSDP showed an increasing trend since 2008-09 and was at 10.23 per cent during 2012-13. However, there was no improvement in the ratio of non-tax revenue to GSDP and it continued to be around one in 2012-13 also.
Recommendation: Non-tax revenues requires significant thrust, by rationalising user charges and reviewing the same regularly, as recommended by Fiscal Management Review Committee (MTFP-2013-17)
Revenue expenditure
There was 21 per cent growth under social sector over the previous year and the share of expenditure on social services to total revenue expenditure increased by one per cent over the previous year and was at 40 per cent in 2012-13. Also, there was a 13 per cent growth in expenditure on economic services in 2012-13 compared to 29 per cent in 2011-12.
The share of plan revenue expenditure to total revenue expenditure decreased from 29 per cent in 2011-12 to 28 per cent in 2012-13.
Eighty eight per cent of revenue expenditure constituted committed expenditure on salaries, pensions, interest payments, subsidies, grants-in-aid, expenditure on operation and maintenance of assets, administrative expenditure and State’s share of centrally sponsored schemes and centrally planned schemes. Though the New Pension Scheme Cell has been created, Government’s matching contribution was yet to be transferred to the fund account. Total subsidy of ` 10,709 crore reflected in the accounts was explicit subsidy and it excluded implicit subsidy of around ` 1,893 crore during 2012-13.

70
Recommendation: Adequate priority needs to be given to both education and health sectors as the ratio under both these sectors are well below the General Category States’ average during 2012-13.
Containing the committed expenditure, which constitutes the major chunk of the revenue expenditure, would enable the State Government to attain surplus on revenue account to a considerable extent. Since the costs of salary, pension and interest are inflexible, the expenditure on subsidies, grants-in-aid other than to local bodies, which are increasing steadily, requires utmost attention by the State Government.
Quality of expenditure
The share of capital expenditure to total expenditure during 2012-13 (18 per cent) decreased by three per cent from that of previous year. The percentage of developmental expenditure to total expenditure decreased to 73 per cent in 2012-13 from 74 per cent in 2011-12.
Funds aggregating ` 773 crore were locked up in incomplete projects as at the end of 2012-13.
The return from investment of ` 49,464 crore as of March 31, 2013 in Companies/Corporations was negligible (` 56.29 crore). The investment included ` 20,110 crore (41 per cent) to Companies/Corporations under perennial loss.
Recommendation: The State Government should formulate guidelines for quick completion of incomplete projects and strictly monitor reasons for time and cost overrun with a view to take corrective action.
The State Government should review the working of State Public Sector Undertakings incurring huge losses and take suitable decisions.
Monitoring of funds transferred directly from the GOI to the State implementing agencies
Government of India directly transferred ` 6,649.14 crore to the implementing agencies of the State during the year and at the end of March 2013. The transfer of funds from Government of India to the state implementing agencies directly ran the risk of inadequate monitoring of utilisation of funds by these agencies in the absence of uniform accounting procedures and effective monitoring system.
Recommendation: Management Information Systems may be established and existing Central Plan Scheme Monitoring System may be utilized effectively for real time accounting and monitoring of funds transferred directly to State Implementing agencies of Central sector schemes.
Funds and other Liabilities
Reserve funds of the State viz., corpus fund of Consumer Welfare Fund, Guarantee Redemption Fund etc., were not created / revived. No rules have been framed regarding administration of Fiscal Management Fund.
71
The outstanding amount of guarantees including interest (` 6,688 crore) excludes some of the power sector utilities of the State and hence the statement on guarantees is not complete and reliable.
Recommendation: Rules with regard to administration and investment pattern of various reserve funds requires to be framed. Also, schemes / programmes are required to be formulated for utilizing the balances.
The State is required to build up a data bank on guarantees given by the Government, guarantee fee/commission, guarantee invoked/discharged etc.
It is desirable to evolve a State Government Guarantee Policy on the lines of that brought out by Government of India.
Debt sustainability
Forty six per cent of the open market borrowings are in the maturity bracket of above seven years. The resource gap turned negative during 2011-13. This was mainly on account of growth of revenue receipts being the same as that of growth of total expenditure. This meant that the State had to depend on borrowed funds for meeting current revenue and capital expenditure.
Recommendation: The State Government has to schedule its borrowings in a prudent manner so as not to burden future generations with high cost debts.
The practice of borrowings based on necessity rather than availability should be strictly adhered to by the State Government. Parking of funds either in nationalized banks/deposit accounts should be avoided. The accounting adjustments should be in accordance with the principles governing the adjustments and partial accounting adjustments to justify the borrowings should be done away with.