channel sounding and indoor radio channel characteristics ... · channel sounding and indoor radio...
TRANSCRIPT

RESEARCH Open Access
Channel sounding and indoor radiochannel characteristics in the W-bandMaria-Teresa Martinez-Ingles4, Davy P. Gaillot2, Juan Pascual-Garcia1, Jose-Maria Molina-Garcia-Pardo1*,José-Víctor Rodríguez1, Lorenzo Rubio3 and Leandro Juan-Llácer1
Abstract
This work presents directional radio channel measurements in the W-band using a commercial versatile channelsounder based on a vector network analyzer (VNA), capable of measuring scattering parameters from 75 to 500 GHz withfrequency converters. The commercial setup has been modified by increasing the distance for one of the convertersusing precision coaxial cables and avoiding the use of amplifiers. Firstly, initial distance-dependent single-input single-output (SISO) measurements of indoor radio channels are presented to assess the validity of the setup in the 75–110 GHzfrequency band with highly directive horn antennas. Then, single-input multiple-output (SIMO) radio channels weremeasured at 94 GHz using one directional and one omnidirectional antenna mounted on two positioners. Initial channelcharacterization is presented comprising root mean square (rms) delay spread, rms angular spread, K-factor, and path lossin an indoor environment at 94 GHz.
1 IntroductionThe UE Horizon 2020 considers the extension of wire-less communication systems to frequencies above60 GHz as one of its priorities (http://ec.europa.eu/pro-grammes/horizon2020/); specifically, it aims to fill thegap between the millimeter and the terahertz spectrum.This frequency range between 60 and 300 GHz is notlimited to communications but also finds application inremote sensing, security, and industrial measurement.The use of this band has been proposed for high-speeddata links, automotive radar, radar imaging, securityscreening, substance identification, and non-destructivetesting among others [1–3].In terms of the W-band (75–110 GHz), most of the
studies found in the literature date from the 1990s, andall of them are narrowband. In [4], propagation in theevaporation duct at 94 GHz is studied, in [5] a computa-tional study at 94 and 140 GHz for oblate spheroidaland spherical raindrops is performed, and in [6], somepropagation studies with rain are performed at 94 GHz.The first indoor propagation (narrowband path loss)measurements at 94 GHz are found in [7] and wide-band in [8]. In [9], wideband measurements over the
full W-band are performed but limited to short dis-tances. In addition, body area networks (BANs) haveshown interest in these frequencies [10]. Therefore,as far as the authors are concerned, there is littleanalysis on indoor wideband measurements in theW-band.In this work, a commercial channel sounder setup de-
signed for sounding a radio propagation channel beyond67 GHz, which is the limit of coaxial wired typical vectornetwork analyzer (VNA) (few models reach 100 GHz),to up to 500 GHz is described. A link budget of the co-axial cables connection to the converter is presented,which enable wireless measurements from 50 to500 GHz (depending on the converter model). In thiswork, we focus on the W-band frequency range.First, single-input single-output (SISO) in the 75–
110 GHz are presented by using two horn antennas usedfor the SISO measurements in order to validate the de-veloped measurement setup. Later, directional measure-ments within 3 GHz around 94 GHz are presented in anindoor environment. However, channel sounding forradio characterization is typically performed with omni-directional antennas. At these frequencies, the requireddynamic range is higher than at lower bands, i.e., a pathloss of 72.4 dB is theoretically obtained at 1 m for100 GHz. To alleviate this issue, one omnidirectional
* Correspondence: [email protected] Tecnologías de la Información y las Comunicaciones,Universidad Politécnica de Cartagena, Cartagena, SpainFull list of author information is available at the end of the article
© 2016 Martinez-Ingles et al. Open Access This article is distributed under the terms of the Creative Commons Attribution 4.0International License (http://creativecommons.org/licenses/by/4.0/), which permits unrestricted use, distribution, andreproduction in any medium, provided you give appropriate credit to the original author(s) and the source, provide a link tothe Creative Commons license, and indicate if changes were made.
Martinez-Ingles et al. EURASIP Journal onWireless Communications andNetworking (2016) 2016:30 DOI 10.1186/s13638-016-0530-7

antenna is used at one side whereas a rotary system witha high directivity horn antenna is used at the other sideto construct an omni-like radiation pattern with a higherdynamic range. This approach was used with 70 GHz in[11]. Preliminary results such as root mean square (rms)delay spread, rms angular spread, path loss, and K-factorare presented and discussed.This paper is organized as follows: Section II fo-
cuses on the description of the channel sounderbased on a commercial VNA, Section III presentswideband measurements in the W-band using hornantennas to assess the validity of the setup, Section IVfocuses on the channel characteristics at the 94 GHzfrequency for an indoor environment, and Section Vconcludes the work.
2 Channel sounderThe millimeter-wave channel sounder setup is described inFig. 1. It is based on a commercial vector network analyzer(VNA), the R&S ZVA 67, and up-converters (http://www.rohde-schwarz.es/product/ZVAZ.html). In this work,the R&S®ZVA-Z110E converter (W-band WR-10, 75 to110 GHz) was used for both the transmitting and receivingunit. The commercial setup is limited to the separation ofthe converters up to 1 m. In order to communicate be-tween the converter and the VNA, four signals come outfrom the VNA to each converter, and they are used tomeasure different mmW frequency bands (note that eachconverter slightly differs in these frequencies):
1. Source input (RF, magenta): 12.5 to 18.33 GHz.Input power in the converter: 4 to 10 dBm.
2. Local oscillator input (LO, blue) IN: 9.34 to13.715 GHz. Input power in the converter: 5 to10 dBm.
3. Measurement output (MEAS, orange): 10 to300 MHz.
4. Reference output (REF, green): 10 to 300 MHz.
The output power of the VNA is typically greater than15 dBm such that a 10 dB margin was used for the ca-bles or amplifiers to separate the converter from theVNA (magenta, blue, green, and orange in Fig. 1). Thispoint is the extension from the application note fromthe manufacturer.In order to take measurements in this frequency
band, it was decided not to use amplifiers in order tosimplify the setup and because the dynamic rangewas enough for the distances considered in the study.Two RG-58 cables with SMA connector were usedfor REF and MEAS, and two 8-m TRUCore300 cableswere used for RF and LO. These cables had an inser-tion loss of 7.8 dB at 18 GHz. Figure 2 presents theVNA setup for using the converters.The system was THROUGH calibrated (Fig. 3), being
included the delay and gain of the antennas in the mea-surements. The measured dynamic range for an inter-mediate frequency (IF) of 100 Hz was 97 dB. Thechannel transfer functions were thus measured by theS21—scattering parameter in the frequency domain.
Fig. 1 Millimeter-wave channel sounder setup
Martinez-Ingles et al. EURASIP Journal on Wireless Communications and Networking (2016) 2016:30 Page 2 of 8

3 Channel sounder validation, 75–110 GHz SISOmeasurementsIn this section, we will validate the use of the chan-nel sounder with SISO measurements. Two horn an-tennas manufactured by Flann Microwave (Model27240–20 (http://www.flann.com/)) were connectedto the channel sounder described in Section II. Theantennas operate in the 73.8–112 GHz range withgain values varying between 18 and 21.5 dBi, asshown in Fig. 4. The VNA was configured to meas-ure the S21-scattering parameter from 75 to110 GHz, i.e., 35 GHz of SPAN and a central
frequency equal to 92.5 GHz, with Nf = 2048 fre-quency points and 50 times averaged. A picture ofthe setup can be seen in Fig. 5.For these first measurements, near line-of-sight (LOS)
channel realizations were measured for distance valuesranging between 10 and 70 cm. Figure 6 shows the mea-sured wideband path loss (PL) at each position takinginto account the frequency gain of the antennas andthe frequency characteristics of free-space propaga-tion. The PL has been calculated as an extension ofthe Friis formula for the case of ultra wideband asdescribed in [12]. Thus, the PL is derived as the ratio
Fig. 2 Photo of cables connected to the VNA
Fig. 3 Calibration process
Martinez-Ingles et al. EURASIP Journal on Wireless Communications and Networking (2016) 2016:30 Page 3 of 8

between the transmit energy and the energy of thereceived signal over the 35 GHz bandwidth. It is as-sumed that there are no polarization losses betweenthe antennas being both vertical polarized. The PLcan be derived from the antenna gain (g(f )), andS21(f ) the scattering parameter as:
PL dBð Þ ¼ −10 log10
Zf max
f min
1g2 fð Þ S21 fð Þj j2df
0B@
1CA ð1Þ
where fmin and fmax are 75 and 110 GHz, respectively.In discrete form, (1) can be rewritten as
PL dBð Þ ¼ −10 log101Nf
XNf −1
n¼0
S21 f min þ nΔfð Þj j2g2 f min þ nΔfð Þ
!
ð2Þ
where the frequency resolution used in the measure-ments is given by:
Δf ¼ f max−f min
Nf −1: ð3Þ
As a comparison, we have also plotted in Fig. 6 theupper bound of the path loss, PLUB, derived when ideal
14
15
16
17
18
19
20
21
22
23
)º( htdiw
ma eB
Bd 3
70 75 80 85 90 95 100 105 110 11518
20
22
Gai
n (d
B)
Frequency (GHz)
Gain (dBi)
H-Plane Beamwidth (º)E-Plane Beamwidth (º)
Fig. 4 Horn antenna specifications in the W-band
Fig. 5 Picture of one of the first trials
10 20 30 40 50 60 7050
55
60
65
70
75
80
Distance (cm)
)Bd( ssol hta
P
Measured path lossUpper bound path loss
Fig. 6 Measured and the upper bound path loss in the W-band
Martinez-Ingles et al. EURASIP Journal on Wireless Communications and Networking (2016) 2016:30 Page 4 of 8

isotropic antennas are used for a uniform transmitspectrum given by [12]:
PLUB dBð Þ ¼ −10 log10c2
4πdð Þ2f minf max
!ð4Þ
where c is the velocity of the light and d is the Tx-Rxseparation distance. Notice that when f = fmin = fmax, (4) isthe free-space path loss for a narrowband transmission.An average 0.84 dB error was measured between both
curves, probably due to slight variations between the realgain and the manufacturer datasheet. The maximum di-mension of the antenna was 26 mm, and at the W-bandmeant a far zone distance of 2(0.026)2/λmin ≈ 49 cm, be-ing λmin = c/fmax. Even if between 10 and 50 cm, we donot fulfill the far zone, the ultra wideband formula pre-dicts the path loss accurately.
The time-delay responses and power delay profile(PDP) can be obtained from the complex channel trans-fer functions via the classical inverse Fourier transform.Figure 7 shows the PDPs for three selected distances(20, 30, and 50 cm). For these distances, the RMS delayspread computed with a 30-dB threshold is 0.12, 0.24,and 0.49 ns, respectively. From these curves, it is alsoshown that strong SMCs (specular multipath compo-nents) lie between 5 and 25 ns and that dense multipathcomponents (DMCs) do not contribute much to the re-ceived power. This is mainly due to reflections of closeobjects such as the table, VNA, or the converters. Thedynamic range is shown to be sufficient even by using a100-kHz intermediate frequency.
4 GHz SIMO measurementsIn this section, indoor channel characteristics are mea-sured by performing SIMO measurements, carried outwith virtual Tx-UCA (Uniform Circular Array) and vir-tual Rx-URA (Uniform Rectangular Array) systems. TheVNA is configured with 1024 frequency points and10 Hz IF.For the transmitter, the virtual Tx-UCA uses the same
horn antenna as in the previous section. For the virtualRx-URA, an omnidirectional antenna manufactured byMi-Wave (WR-10) was selected. This antenna operatesat 94 GHz with a 3 GHz bandwidth, 2 dB gain and typ-ical nominal VSWR of 1.5:1 [http://www.miwv.com/].Vertical polarization has been used for all cases.The Rx position was fixed whereas the Tx was moved
around four different positions in a room. A map of theindoor scenario can be found in Fig. 8.Figure 9 presents a general photo of the scenario
from the Tx antenna. The Tx and Rx antennas were
0 5 10 15 20 25 30-120
-100
-80
-60
-40
-20
0
Delay (ns)
)Bd(
eliforP
yaleDre
woP
d=20 cmd=30 cmd=50 cm
Fig. 7 PDP for Tx-Rx distances of 20, 30, and 50 cm
Fig. 8 Map of the measured room
Martinez-Ingles et al. EURASIP Journal on Wireless Communications and Networking (2016) 2016:30 Page 5 of 8
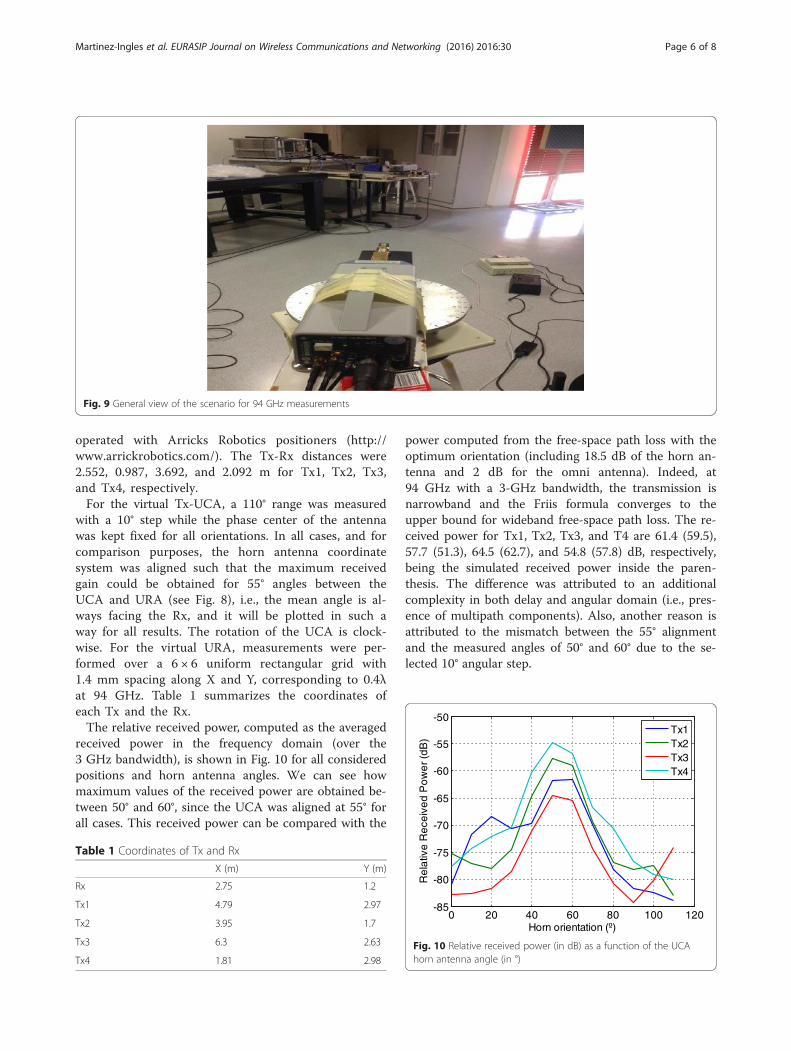
operated with Arricks Robotics positioners (http://www.arrickrobotics.com/). The Tx-Rx distances were2.552, 0.987, 3.692, and 2.092 m for Tx1, Tx2, Tx3,and Tx4, respectively.For the virtual Tx-UCA, a 110° range was measured
with a 10° step while the phase center of the antennawas kept fixed for all orientations. In all cases, and forcomparison purposes, the horn antenna coordinatesystem was aligned such that the maximum receivedgain could be obtained for 55° angles between theUCA and URA (see Fig. 8), i.e., the mean angle is al-ways facing the Rx, and it will be plotted in such away for all results. The rotation of the UCA is clock-wise. For the virtual URA, measurements were per-formed over a 6 × 6 uniform rectangular grid with1.4 mm spacing along X and Y, corresponding to 0.4λat 94 GHz. Table 1 summarizes the coordinates ofeach Tx and the Rx.The relative received power, computed as the averaged
received power in the frequency domain (over the3 GHz bandwidth), is shown in Fig. 10 for all consideredpositions and horn antenna angles. We can see howmaximum values of the received power are obtained be-tween 50° and 60°, since the UCA was aligned at 55° forall cases. This received power can be compared with the
power computed from the free-space path loss with theoptimum orientation (including 18.5 dB of the horn an-tenna and 2 dB for the omni antenna). Indeed, at94 GHz with a 3-GHz bandwidth, the transmission isnarrowband and the Friis formula converges to theupper bound for wideband free-space path loss. The re-ceived power for Tx1, Tx2, Tx3, and T4 are 61.4 (59.5),57.7 (51.3), 64.5 (62.7), and 54.8 (57.8) dB, respectively,being the simulated received power inside the paren-thesis. The difference was attributed to an additionalcomplexity in both delay and angular domain (i.e., pres-ence of multipath components). Also, another reason isattributed to the mismatch between the 55° alignmentand the measured angles of 50° and 60° due to the se-lected 10° angular step.
Fig. 9 General view of the scenario for 94 GHz measurements
Table 1 Coordinates of Tx and Rx
X (m) Y (m)
Rx 2.75 1.2
Tx1 4.79 2.97
Tx2 3.95 1.7
Tx3 6.3 2.63
Tx4 1.81 2.98
0 20 40 60 80 100 120-85
-80
-75
-70
-65
-60
-55
-50
Horn orientation (º)
)B
d(re
wo
Pd
evie c
eR
e vital
eR
Tx1Tx2Tx3Tx4
Fig. 10 Relative received power (in dB) as a function of the UCAhorn antenna angle (in °)
Martinez-Ingles et al. EURASIP Journal on Wireless Communications and Networking (2016) 2016:30 Page 6 of 8

The rms delay spread was also computed with a 30-dBthreshold (Fig. 11). A minimum in the rms values wasclearly observed when the horn antenna axis was facingthe URA with values of 1.58, 0.74, 1.3, and 1.61 ns forposition 1 to 4, respectively. However, when the axeswere not aligned, values up to 30 ns were obtained be-cause of multiple reflections in the scenario.In addition, the maximum-likelihood estimation
(MLE) parameters of the Ricean distribution were com-puted from the frequency domain data [13]. Figure 12shows the K-factor of the best-fitting distribution for allTx positions. As observed in Fig. 11, large values of Kwere measured when the horn antenna faced the URAwith maximum values of 14.3, 11.12, 6.9, and 11.4 dB forposition 1 to 4, respectively. On the other hand, Rayleighdistributions were obtained for the side angles.All previous results strongly indicate that the complex-
ity of the measured radio channels depends on the horn
antenna angle with respect to the Rx. To analyze this ef-fect, high-resolution MLE RiMAX [14] was subsequentlyapplied to the measured SIMO radio channels to extractthe SMCs for each position and horn antenna angle. Forinstance, the time-of-arrival (TOA), direction-of-arrival(DOA), and complex gain were jointly estimated foreach path, as well as the DMCs.As an example, Fig. 13 presents the SMCs estima-
tion results for Tx3 with 0°, 40°, 50°, and 110° hornantenna angles. The power of each SMC is propor-tional to the the circle radius and is also presentedwith a color scale. From this information, the rms an-gular spread was also computed with a 30-dB thresh-old (Fig. 14). Again, the data show that the angularspread reaches its minimum value (72.8°, 54.1°, 62.2°,and 69.6° for position 1 to 4) when the horn antennais aligned with the URA array.
0 20 40 60 80 100 1200
5
10
15
20
25
30
35
40
Horn orientation (º)
)sn(
da
erp
Sy
ale
DS
MR
Tx1Tx2Tx3Tx4
Fig. 11 RMS delay spread (in ns) as a function of the UCA hornantenna angle (in °)
0 20 40 60 80 100 120-40
-30
-20
-10
0
10
20
Horn orientation (º)
)Bd( rotcaf
K
Tx1Tx2Tx3Tx4
Fig. 12 K-factor (in dB) as a function of the UCA horn antenna angle(in °)
TOA (ns)0 20 40 60 80
DO
A (
°)
-200
-100
0
100
2000°40°50°110°
Rel
ativ
e G
ain
(dB
)
-110
-100
-90
-80
-70
-60
Fig. 13 TOA (in ns) as a function of DOA (in °) estimated withRiMAX as for Tx3 with 0°, 40°, 50°, and 110° horn antenna angles
0 20 40 60 80 100 1200
20
40
60
80
100
120
140
)º( d
aer
pS
elg
nA
SM
R
Horn orientation (º)
Tx1Tx2Tx3Tx4
Fig. 14 RMS angular spread in terms of UCA
Martinez-Ingles et al. EURASIP Journal on Wireless Communications and Networking (2016) 2016:30 Page 7 of 8

5 ConclusionsThis paper presents initial investigations of the radiochannel characteristics in the W-band with a commer-cial VNA. The initial limited distance range of the setuphas been successfully increased to much longer distancesusing longer precision cables between the VNA and con-verters. Initial SISO W-band measurements with hornantennas are shown for distance values up to 70 cm tovalidate the system. Then, SIMO measurements are pre-sented at 94 GHz with an omnidirectional antenna anda horn antenna mounted on a rotary system. Furtherwork includes extensive measurement campaigns at94 GHz for indoor scenarios and deeper analysis of theDMC contribution to the radio channels.
AcknowledgementsThis work was supported by MINECO, Spain (TEC2013-47360-C3-2-P TEC2013-47360-C3-3-P) and by European FEDER funds.
Author details1Departamento Tecnologías de la Información y las Comunicaciones,Universidad Politécnica de Cartagena, Cartagena, Spain. 2IEMN/TELICE,University of Lille 1, Villeneuve d’Ascq, France. 3Universitat Politècnica deValència, Camino de Vera, Spain. 4University Center of Defense, San Javier AirForce Base, MDE-UPCT, C/Coronel López Peña, s/n, 30720, Santiago de laRibera, Murcia, Spain.
Received: 28 July 2015 Accepted: 18 January 2016
References1. D Zico, Ultra-wideband and 60 GHz communications for biomedical
applications. Springer. http://link.springer.com/book/10.1007%2F978-1-4614-8896-5.
2. L Jofre, J Romeu, S Capdevila, J Abril, E Nova, M Alonso, The “challenging”world of Terahertz radiation and imaging. Proceedings of the 5th EuropeanConference on Antennas and Propagation (EUCAP), 2011, pp. 3470–3475
3. M Kawase, “Non-destructive evaluation method of pharmaceutical tablet byterahertz-time-domain spectroscopy: application to sound-alike medicines”,J. Infrared Millimeter Terahertz Waves, 34(9), 566–571
4. KD Anderson, 94 GHz propagation in the evaporation duct. IEEE Trans.Antennas Propag. 38(5), 746–753 (1990)
5. K Aydin, Y-M Lure, Millimeter wave scattering and propagation in rain:a computational study at 94 and 140 GHz for oblate spheroidal andspherical raindrops. IEEE Trans. Geosci. Remote Sens. 29(1), 593–601 (1991)
6. C Gloaguen, An experiment for propagation studies at 94 GHz. Eighth Int.Conf. Antennas Propagation 1, 406–409 (1993)
7. A Kajiwara, “Indoor propagation measurements at 94 GHz,” personal, indoorand mobile radio communications, 1995. Sixth IEEE Int. Symp PIMRC’95.Wireless Merging Inf. Superhighway 3, 1026 (1995)
8. J Helminger, J Detlefsen, H Groll, Propagation properties of an indoor-channelat 94 GHz. Int. Conf. Microw Millimeter Wave Technol.Proc 98, 9–14 (1998)
9. R Piesiewicz, R Geise, M Jacob, J Jemai, T Kurner, “Indoor channelmeasurements of point-to-point ultra broadband short range links between75 GHz and 110 GHz”, in International Symposium Antennas and PropagationSociety, 2008, pp. 1–4
10. A Brizzi, A Pellegrini, Y Hao, “Experimental characterization of thepropagation on the human torso at W band”, in Radio ScienceMeeting (Joint with AP-S Symposium), USNC-URSI, 2013, p. 39
11. K Haneda, J Järveläinen, A Karttunen, M Kyro, J Putkonen, Indoor short-rangeradio propagation measurements At 60 and 70 GHz, in EuCAP 2014, The Hague,The Netherlands, 2014, pp. 1–4
12. S Promwong, J Takada, Free space link budget estimation scheme for ultrawideband impulse radio with imperfect antennas. IEICE Electronics Express1(7), 188–192 (2004)
13. NL Johnson, S Kotz, N Balakrishnan, Continuous univariate distributions, vol.1 (Wiley-Interscience, Hoboken, 1993)
14. A Richter, Estimation of radio channel parameters: models and algorithms(Dr.-Ing. dissertation, TU Ilmenau, Ilmenau, Germany, 2005)
Submit your manuscript to a journal and benefi t from:
7 Convenient online submission
7 Rigorous peer review
7 Immediate publication on acceptance
7 Open access: articles freely available online
7 High visibility within the fi eld
7 Retaining the copyright to your article
Submit your next manuscript at 7 springeropen.com
Martinez-Ingles et al. EURASIP Journal on Wireless Communications and Networking (2016) 2016:30 Page 8 of 8