channel response to sediment replenishment in a large
TRANSCRIPT

Received: 28 February 2019 Revised: 19 July 2019 Accepted: 5 August 2019
DOI: 10.1002/rra.3527
S P E C I A L I S S U E P A P E R
Channel response to sediment replenishment in a largegravel‐bed river: The case of the Saint‐Sauveur dam inthe Buëch River (Southern Alps, France)
Guillaume Brousse1 | Gilles Arnaud‐Fassetta1 | Frédéric Liébault2 | Mélanie Bertrand2 |
Gabriel Melun3 | Remi Loire4 | Jean‐René Malavoi4 | Guillaume Fantino5 |
Laurent Borgniet6
1UMR 8586 (PRODIG), Université Paris‐Diderot (Paris 7), Paris, France
2 Irstea, ETNA, University of Grenoble Alpes,
Grenoble, France
3DREC, Agence Française pour la Biodiversité
(AFB), Vincennes, France
4DPIH/CIH, EDF, Lyon, France
5GEOPEKA, Lyon, France
6 Irstea, LESSEM, University of Grenoble Alpes,
Grenoble, France
Correspondence
G. Brousse, Université Paris‐Diderot (Paris 7),
UMR 8586 (PRODIG), Paris 75013, France.
Email: guillaume.brousse@univ‐paris‐diderot.fr
Funding information
Agence française pour la biodiversité;
Électricité de France; INTERREG Alpine Space
HyMoCARES
River Res Applic. 2019;1–14.
Abstract
The Saint‐Sauveur dam was built in 1992 in the middle section of the Buëch River.
Downstream of the dam, a channel incision by several meters was observed. A gravel
replenishment operation was planned in order to restore the active channel. An
equivalent of two times the mean annual bedload‐transport capacity (43,500 m3)
was replenished downstream of the dam in September 2016. The aim of this paper
is to quantify morphological change associated with sediment remobilization in order
to evaluate the efficiency of the restoration works. The monitoring was based on a
combination of (a) change detection using sequential high‐resolution digital elevation
models (from airborne LiDAR data), (b) bedload tracing using active ultrahigh‐
frequency radio‐frequency identification technology, and (c) complementary field
surveys of channel grain‐size distribution and morphology for bedload‐transport
computation. Field monitoring allows us to capture a net aggradation along a 2‐km
reach after the first post‐replenishment flood. A sediment balance analysis was
performed to back‐calculate bedload supply coming from the sluicing operation dur-
ing the flood. Although the sediment replenishment operation clearly had a positive
impact on the morphological conditions of the starved river reach, the effective
bedload supply from artificial berms (22,650 m3) was insufficient to initiate substan-
tial channel shifting along the restored reach and a subsequent amplification of the
sediment recharge. The combination of high‐resolution topographic resurveys and
sediment tracing was successful to evaluate the downstream propagation of sediment
replenishment effects.
KEYWORDS
braided river, dam impact, restoration, river management, sediment replenishment
1 | INTRODUCTION
The sediment budget of many Alpine rivers was strongly impacted by
the cumulative effects of different anthropogenic actions linked to
wileyonlinelibrary.com/jou
valley development during the last decades, leading to a global trend
of sediment deficit (e.g., Surian & Rinaldi, 2003; Piégay, Alber, Slater,
& Bourdin, 2009; Liébault, Lallias‐Tacon, Cassel, & Talaska, 2013). The
causes of disturbance are clearly recognized: (a) gravel mining in active
© 2019 John Wiley & Sons, Ltd.rnal/rra 1

2 BROUSSE ET AL.
channels; (b) river regulation; and (c) dam construction. In parallel, a gen-
eral decrease of sediment supply from headwaters was observed and
was particularly well documented in the Southern French Alps, where
it has been attributed to several environmental changes: (a) climate
change following the end of the Little Ice Age; (b) spontaneous
reforestation following rural depopulation; and (c) torrent‐control
works during the 1860–1915 period (e.g., Astrade, Jacob‐Rousseau,
Bravard, Allignol, & Simac, 2011; Liébault et al., 2005; Liébault & Piégay,
2002). In this context, sediment continuity was temporally broken or
strongly modified, and bed incision and channel pattern shift from
braided to single‐thread styles were observed along many Alpine rivers.
These sediment‐related alterations not only have direct consequences
on infrastructures like bridges, dikes, or roads but also induce a dramatic
loss of aquatic habitats (e.g., Belletti, Dufour, & Piégay, 2013; Bravard
et al., 1997).
Sediment replenishment (or gravel augmentation) is one of the
possible solutions for compensating sediment deficit downstream of
dams and for restoring aquatic habitats of starved river channels
(e.g., Habersack & Piégay, 2008; Kondolf et al., 2014; Sumi, 2006;
USDA, 2004). This operation consists in artificially injecting coarse
sediment in active channels downstream a dam, in such a way that
those materials can be easily removed and transported during high‐
frequency floods. Sediments are generally deposited by creating
berms, which are expected to be scoured during floods. According to
Ock, Sumi, and Takemon (2013), four methods of replenishment are
commonly used: (a) in‐channel bed stockpile; (b) high‐flow stockpile;
(c) point‐bar stockpile; and (d) high‐flow direct injection. According
to Sklar et al. (2009), the efficiency of replenishment can be evaluated
by the resultant extension and duration of riverbed morphological
change, which depends on the dispersive or translational nature of
the generated sediment pulses.
This type of sediment management downstream of dams is
common in Japan (e.g., Kantouch, Sumi, Kubota, & Suzuki, 2010;
Musashi, Nakata, Suzuki, Oshima, & Demizu, 2016; Okano, Kikui,
Ishida, & Sumi, 2004; Sakurai & Hakoishi, 2013) and in the United
States (e.g., Kondolf et al., 2007; Kondolf & Minear, 2004; Merz,
Pasternack, & Wheaton, 2006; Wheaton, Pasternack, & Merz, 2004)
but it is less frequent in Europe where only few cases are known
(e.g., Arnaud et al., 2017). Replenishment with coarse sediments in
the Alpine context is an engineering challenge because of the lack of
feedback reporting from few field experiments and the subsequent
difficulties to anticipate project efficiency. Only two case studies in
Alpine gravel‐bed rivers have been reported (Arnaud et al., 2017;
Heckmann, Haas, Abel, Rimböck, & Becht, 2017), highlighting
the difficulty to isolate the morphological effects of sediment
replenishment and the importance of the reinjected volume for
restoration efficiency. Furthermore, sediment replenishment has been
recently investigated through flume experiments and numerical
modelling in order to compare different designs of sediment
reinjection in river channels. The flume experiments by Battisacco,
Franca, and Schleiss (2016) and the numerical modelling by Juez,
Battisacco, Schleiss, and Franca (2016) showed that the placement
of several berms on both sides of the channel, in a parallel
configuration and under conditions of complete submersion, is the
best condition for a maximum erosion efficiency.
The main goal of the study is to investigate the morphological effect
of sediment replenishment in a large gravel‐bed river using an intensive
field‐based monitoring approach. Explored scientific issues are (a) the
quantification of effective bedload supply from berm erosion during a
flood in a context of high‐flow stockpile design of gravel replenishment,
(b) the detection of the sediment wave propagation following a flood
event, and (c) the characterization of the morphological effects of the
sediment wave along a degrading wandering channel.
A major sediment replenishment operation was recently
implemented in the Buëch River (Southern French Alps; Figure 1a)
downstream of the Saint‐Sauveur dam to stop channel incision and
restore aquatic habitats of an altered, large braided channel. This field
experiment of one‐shot gravel reinjection downstream of a large dam
is the largest ever done in Alpine rivers in terms of single reintroduced
volume, and it provides a unique opportunity to investigate the
morphological effect of such mitigation actions (sediment continuity
and sediment balance recovery). The occurrence of a 5‐year flood
few weeks after the replenishment during which hydraulic sluicing
was operating gave the opportunity to evaluate the replenishment
efficiency by looking not only at the amount of the reinjected volume,
which effectively fed the starved river reach, but also at the down-
stream propagation of the generated sediment pulse.
2 | STUDY SITE
The Buëch, a gravel‐bed braided river draining the Southern French
Prealps, is a major Alpine tributary (Rank 5, Strahler) of the Durance
River (Rank 6 at the confluence of Sisteron). The Saint‐Sauveur dam
is located 4 km downstream of the city of Serres (Figure 1b). This
dam drains an 836‐km2 upland watershed with a maximum elevation
of 2,709 m asl. The watershed geology is exclusively represented by
sedimentary rocks, with alternating folded sequences of marls and
limestones. The climate is Mediterranean, with a mean annual rainfall
of ~800 mm. The mean daily discharge at the Serres gauging station
located upstream of the dam (1964–2014) is 14.1 m3 s−1, and the
2‐, 5‐, 10‐, and 50‐year daily flood discharges are estimated at 140,
210, 250, and 350 m3 s−1, respectively.
The study reach (6.85 km long) extends from the Saint‐Sauveur
dam down to the bridge of Eyguians (Figure 1c). We distinguished
three different hydromorphological unit (HUMs) expressed in length
(L), area (A), and width (W): HUM1 (L, 0.55 km; A, 5.44 ha; W, 85 m)
corresponds to the replenishment site; HUM2 (L, 2 km; A, 30.79 ha;
W, 63 m) corresponds to the most altered reach; and HUM3
(L, 4.3 km; A, 101.5 ha;W, 166 m) is a more preserved braided channel.
The whole study reach presents a mean active‐channel width of
130 m and a mean channel slope ranging from 0.006 to 0.009 m m−1. The channel morphology is a succession of segments characterized
by wandering and braided patterns, although this reach is included in a
~1‐km‐wide alluvial floodplain. The lateral confinement related to
roads or bedrock outcrops is important. Well‐preserved patches of
alluvial forests are only observed in the left side of the channel

FIGURE 1 Location of the study site. (a) Location of the Buëch River in Western Europe. (b) Location of the study site in the Durance hydraulicpower plant network. (c) Sectorization of the study reach. 1 to 9, radio‐frequency identification tag injection transects; 10, study reach forbedload‐transport computation [Colour figure can be viewed at wileyonlinelibrary.com]
BROUSSE ET AL. 3
immediately downstream from the dam and in the right‐side down-
stream of the confluence with the Torrent de Channe. Most of the
floodplain is occupied by cultivated lands and grasslands.
3 | WHY AND HOW A SEDIMENTREPLENISHMENT IN THE BUËCH RIVER ATSAINT‐SAUVEUR?
The Buëch River has been highly impacted by intensive gravel min-
ing since the late 1960s until 2012 (e.g., Gautier, 1994; Liébault
et al., 2013). The total volume of gravel extracted from three active
mining sites was estimated between 5 and 9.7 Mm3 (e.g.,
HYDRÉTUDES, 2013). In addition to gravel mining, the bedload‐
transport continuity was strongly impacted by the construction of
the Saint‐Sauveur dam. This 10‐m‐high and 260‐m‐wide barrier
was constructed between 1990 and 1991 by EDF (French power
plant company), and the commissioning started in 1992. The
construction required dredging of 600,000 m3 of sediment. The full
storage capacity of the reservoir is 1.72 Mm3, and the water is used
for irrigation, hydroelectricity, and touristic development. The dam

4 BROUSSE ET AL.
serves as a water intake structure, supplying a diversion canal, with a
maximum hydraulic capacity of 30 m3 s−1, conducting water to the
laser hydropower plant located 10 km downstream. Downstream
of the dam, the hydrological regime is strongly regulated at 1/10
of the mean interannual discharge. This global annual volume is
redistributed along seasons for aquatic habitat at 0.9 m3 s−1
between July and September, at 1.5 m3 s−1 during late June and
early October, at 2 m3 s−1 between mid‐October and early March,
and at 2.5 m3 s−1 between early March and mid‐June. Although
the Saint‐Sauveur dam is equipped with three flood gates, allowing
some sediment transport continuity during floods (sluicing
operations), most of the coarse sediments are trapped in the
proximal part of the reservoir. It has been estimated that only
20,000 m3 of the yearly coarse sediment load (42,000 m3) could
be transported through the dam (e.g., HYDRÉTUDES, 2013). This
dam has been classified by EDF as partially transparent to the coarse
sediment transport in term of volume, grain size, and frequency
(Loire, 2018), a situation corresponding to 20% of EDF dams.
These alterations of sediment regime may have been amplified by
the general context of sediment supply decrease from the watershed
and the resulting significant channel responses, that is, active‐channel
narrowing and channel degradation, as attested by the historical long
profile of 1908 (Liébault et al., 2013). A shift from a braided to
wandering pattern can be clearly observed along HUM1 and HUM2.
Downstream of the dam, the channel incision reaches 3 m few
years after dam construction and propagates downstream
(HYDRÉTUDES, 2013). Some marly bedrock outcrops are observed
along the degraded reach, as well as undercut groynes on the
right bank.
In September 2016, EDF artificially increased the coarse sediment
supply to the reach. The replenishment operation consisted in the
reintroduction of 43,500 m3 of gravel downstream of the dam. This
volume was constrained by the flood risk management plan of the
Departmental Direction of the Territories (DDT 05), which imposes a
bed level not to be exceeded in the replenishment reach. Sediments
were directly excavated from the alluvial fan deposited in the
reservoir. This sediment volume represents two times the estimated
mean annual bedload yield crossing the dam. Gravels were deposited
along HUM1 by the creation of two artificial gravel berms according
to the “high‐flow stockpile method” (Ock et al., 2013; Figure 2a).
The relative elevation of berms above the bed level ranges from 1.3
to 2.8 m, and therefore, these surfaces are not submerged during
frequent floods (Figure 2b). Berms were composed of two different
parallel units (BU): the 12,300 m3 right berm unit (BU1; 190 m long;
31 m wide; 1/7 bank slope) and the 31,200 m3 left berm unit
(BU2; 360 m long; 46 m wide; 2/3 bank slope). The grain‐size distribu-
tion (GSD) of berms was obtained by bulk sampling (D50 = 33 mm,
D84 = 86.3 mm, and D90 = 102 mm) in the alluvial fan where the sed-
iment has been excavated and is therefore representative of the
bedload GSD of the Buëch River. In addition, a trench was cut into
the left berm (380 m long; 6.5 m wide; 2/3 bank slope) in order to
facilitate the remobilization of an alluvial terrace, which was part of
FIGURE 2 Artificial gravel replenishmentdownstream of Saint‐Sauveur dam in theBuëch River. (a) Unmanned aerial vehicle viewlooking upstream (October 22, 2016, 10:33 a.m.). (b) Typical cross section. The dark linerepresents the initial cross section (February2015), and the dashed line represents thepostreplenishment cross section (November2016)

BROUSSE ET AL. 5
the active channel before dam construction and to avoid right‐bank
channel shifting in marly bedrock outcrops. The trench divided BU2
in three subunits: the left side of the left berm (BU2A), the trench
(BU2B), and the right side of the left berm (BU2C). In order to
maximize the efficiency of the project, the power plant company
modified dam exploitation by increasing the number and duration of
sluicing (opening flood gates and reduce reservoir level until supercrit-
ical conditions recovery) during floods.
4 | METHODS
The physical monitoring combines a bedload tracing programme using
active ultrahigh‐frequency radio‐frequency identification (RFID)
technology, a repetitive high‐resolution topographic survey of the
restored reach, and ancillary field surveys for specific data analysis
(e.g., bedload‐transport computation).
TABLE 2 Technical specifications of airborne LiDAR dataacquisitions
Characteristics LiDAR1 LiDAR2
Date November 4, 2016 December 22, 2016
Laser Riegl LMS Q680i
Flight height (m above
ground level)
500
Flight speed (in nd) 60
Scan frequency (kHz) 400
Altimetric accuracy (m) 0.1
Planimetric accuracy (m) 0.1 0.25
4.1 | Bedload tracing programme
A bedload tracing programme was implemented to evaluate
the sediment transparency (or bedload trapping efficiency) of the
Saint‐Sauveur dam and to monitor the bedload dispersion along
the restored reach. Artificial cobbles and pebbles equipped with active
ultrahigh‐frequency RFID tags (COIN ID; 433.92 MHz; n = 148) were
injected upstream of the dam in November 2016 along nine cross
sections (Figure 1c). It was also planned to inject tracers into berms,
but the first post‐restoration flood occurs too rapidly to have time
to deploy them. Cross sections were equipped with 16 tracers except
for the two last that were equipped with 18 tracers. Patches of
artificial tracers were placed at regular intervals along cross sections;
they replicate natural imbrication and correctly represent the form
and density of natural cobbles–pebbles of the site (Table 1). Because
the size of RFID tags limits the minimum b‐axes of tracer at 32 mm,
our observations of bedload dispersion are limited to the coarser part
(i.e., above the D50) of the bedload GSD. Active tags allowed us to
detect artificial cobbles and pebbles in surface (range of 80 m
according to ELA Innovation©), in subsurface, and below water (e.g.,
TABLE 1 Characteristics of artificial cobbles–pebbles equipped withactive RFID tags
Grain size (in mm)
Artificial cobbles‐pebblescharacteristics 32–45 45–64 64–90
Number of tracers 43 70 35
A‐axis (mm) 53–75 85–94 94–105
B‐axis (mm) 38–44 51–61 72–87
C‐axis (mm) 37–40 48–49 59–62
Weight (g) 146–228 296–377 513–766
Volume (cm3) 54–85 111–140 195–288
Density 2.69 2.67–2.69 2.63–2.66
Abbreviation: RFID, radio‐frequency identification.
Cassel, Dépret, & Piégay, 2017). Active tags have smaller lifetime than
passive ones, but there is no signal collision, and each tag can be
detected even when they are very close to each other (Piégay, Cassel,
Dépret, Michel, & Rollet, A‐.J., & Vaudor, L., 2016). Tracer inventories
were done in late January 2017 along wadable portions of the
channel, and in early February 2017 by craft along nonwadable areas.
4.2 | Repetitive high‐resolution topographic surveys
Repetitive topographic surveys of the restored reach were obtained
from two high‐resolution digital elevation models (4 pixels m−2)
derived from sequential airborne LiDAR surveys. Technical
specifications of the two LiDAR surveys are very similar (Table 2)
and water discharges downstream of the dam were strictly the same
during the two surveys. Global precision of LiDAR data was measured
on immobile targets on three different sites by the private company in
charge of LiDAR data acquisition. The root mean square error of z
values are 0.020 and 0.063 m for the first and second LiDAR surveys,
respectively. Topographic data include only emerged surface. In
addition, sufficient numbers of echoes are recorded in water surface
and allow us to interpolate them in each baseflow channel. The low
water discharges during the two surveys indicate that the submerged
portions of the active channel were spatially limited during data
acquisition and may not have a substantial effect on calculated erosion
Point density (point/m2)a 16–72 17–60
Ground control points 42 129
Mean error (m) −0.003 0.018
RMSE (m) 0.02 0.06
Discharge upstream of
the dam (m3 s−1)
1.7 7.1
Regulated discharge (m3 s−1)b 2
Water release (m3 s−1)c 0
Abbreviation: RMSE, root mean square error.aPoint density after filtering vegetation and water echoes.bMinimum discharge downstream of the dam according to dam exploita-
tion rules (e‐flow).cDifference between natural discharge upstream of the dam, diverted
water, and regulated discharge.

6 BROUSSE ET AL.
and deposition volumes. However, computed gross volumes of ero-
sion and deposition must be considered as lower bound estimates of
the true values.
A control of the alignment between the two surveys was done
using the 3D point clouds, following the procedure described by
Lallias‐Tacon, Liébault, and Piégay (2014). Stable areas well distributed
along the study reach floodplain in which land use has not changed
(garden, grassland, and road) were selected in order to evaluate the
systematic error in elevation (σsys). A mean error (ME) of −0.028 m
was obtained in a set of 7,869 random single points and confirm the
presence of a significant systematic error. A realignment of the two
point‐clouds using the CloudCompare software was done to reduce
the systematic error. We fix the first LiDAR, as the reference and
stable areas were extracted on each cloud in order to calculate the
3D correction matrix. This latter was used to realign the second
survey. Realignment decreases ME from −0.028 to 0.0015 m, which
confirms realignment necessity. Digital elevation model of difference
(DoD) was used to calculate elevation change separately on HUM1,
HUM2, and HUM3. Two types of volumetric calculations were
distinguished: (a) gross erosion or gross deposition volumes and (b)
net sediment balance. According to Anderson (2019), gross volumes
necessitate a thresholding but not net volumes. A threshold of 0.129 m
was obtained by computing the level of detection (LoD) of
significant elevation change (95% confidence interval) calculated by
LoD = 1.96σz with σz ¼ RMSE2LiDAR1 þ RMSE2
LiDAR2
� �0:5according to
Lane, Westaway, and Murray (2003). LoD was subtracted from the
DoD and then excluded according to the Carley et al. (2012) method.
Gross and net volume uncertainty (σv) was estimated using the error
model of Anderson (2019) that accounted for systematic errors and
spatially correlated random errors:
σv ¼ nL2
ffiffiffiffiffiffiffiffiffiffiffiffiffiffiffiffiffiffiffiffiffiffiffiffiffiffiffiffiffiffiffiffiσsc
2
n
πa2i5L2
þ σsys;
s(1)
with n is the number of cells outside LoD interval, L the cell size, and ai
the range over which errors were correlated. The magnitude of the
spatially correlated random errors (σsc) was obtained by semivariogram
analysis in unvegetated stable surfaces and new set of 13,142 random
single points. Systematic errors (σsys) were given by the ME after
realignment process. Cross sections were extracted from the DoD
every 50 m with a spatial resolution of 1 m in order to reconstruct
the longitudinal bed‐level evolution. The downstream evolution of
the low‐flow channel (water surface) was obtained by extracting the
minimum elevation of the cross section (Zmin). The downstream evolu-
tion of the active‐channel elevation was obtained by calculating the
mean elevation of the cross section (Zcs).
In order to compare our results with other case studies, we choose
a set of metrics inspired by Battisacco et al. (2016). Berm erosion was
evaluated by the persistence of sediment replenishment (PR in %),
which illustrates the volume not remobilized by the flow:
PR ¼ 1 −ERR
� �100; (2)
with ER is the effective replenishment eroded volume (in m3) and R
the replenished volume (in m3). We used each cross section of
HUM1 in order to quantify the eroded width by calculating the width
ratio (WR):
WR ¼ 1 −∑We
∑Wb
� �100; (3)
with We is the eroded width (in m) and Wb the berm width (in m). WR
illustrates the relative undisturbed width for each cross section and
separately for each berm unit. The magnitude of the morphological
impact was appreciated by the length of bed aggradation (LR) in the
downstream reach:
LR ¼ LLb; (4)
with L is the length of the aggraded reach (in m) and Lb the maximum
berm length (in m). LR is used to qualify replenishment efficiency.
Submergence of each berm unit has been appreciated by photo
analysis at the peak flow.
4.3 | Ancillary field surveys and bedload‐transportcomputation
Bedload transport was computed according to the GTM model (Gen-
eralized Threshold Model; Recking, 2016) in order to estimate the
coarse sediment output in the study reach and to close the sediment
balance associated with the flow event. This computation was based
on data collected in the field. The study reach for bedload computa-
tion was located at the downstream end of HUM2 (Figure 1b). A cross
section of the active channel and the channel slope along a distance of
346 m were surveyed using a level and a rod. In a band of 10–20 m
along the cross section, each flood mark was characterized with a z
value. Flood‐mark projection along the cross section allows us to eval-
uate the mean depth (d) during high flow and compute the hydraulic
radius for Qmax. The surficial GSD was obtained by a classic pebble
count (Wolman, 1954) sampling of 200 particles on a lateral bar on
the right bank of the cross section (D50 = 20.8 mm; D84 = 40.9 mm).
A channel slope of 0.0032 m m−1 was obtained.
Critical adimensional shear stress for the bed D84
(τc84* = 0.56 S + 0.021, with S as the channel slope in m m−1) and
dimensionless shear stress during flood (τ84* = RS/1.65D84), with R
as the hydraulic radius (in m), were used to calculate τ*/τc* ratios.
The Recking (2013a) formula was then used for bedload computation:
qs ¼ ρsffiffiffiffiffiffiffiffiffiffiffiffiffiffiffiffig s − 1ð Þ
pD3
84 14τ*842:5= 1þ τ*m=τ
*84
� �4� �
; (5)
with qs is the bedload‐transport rate (in g s−1 m−1), ρs the sediment
density, g the acceleration of gravity, s the relative density (ρs/ρ with
ρ the water density), and τ*m the transition between full mobility and
partial transport given by τ*m ¼ 5Sþ 0:06ð Þ D84=D50ð Þ4:4ffiffiS
p−1:5 for
gravel‐bed river. This formula offers a large field application domain
(channel slope from 0.00002 to 0.08 m m−1, and D84 from 0.9 to
BROUSSE ET AL. 7
558 mm) and has been successfully tested with a large set of bedload
data collected in the field (Recking, 2013b).
5 | RESULTS
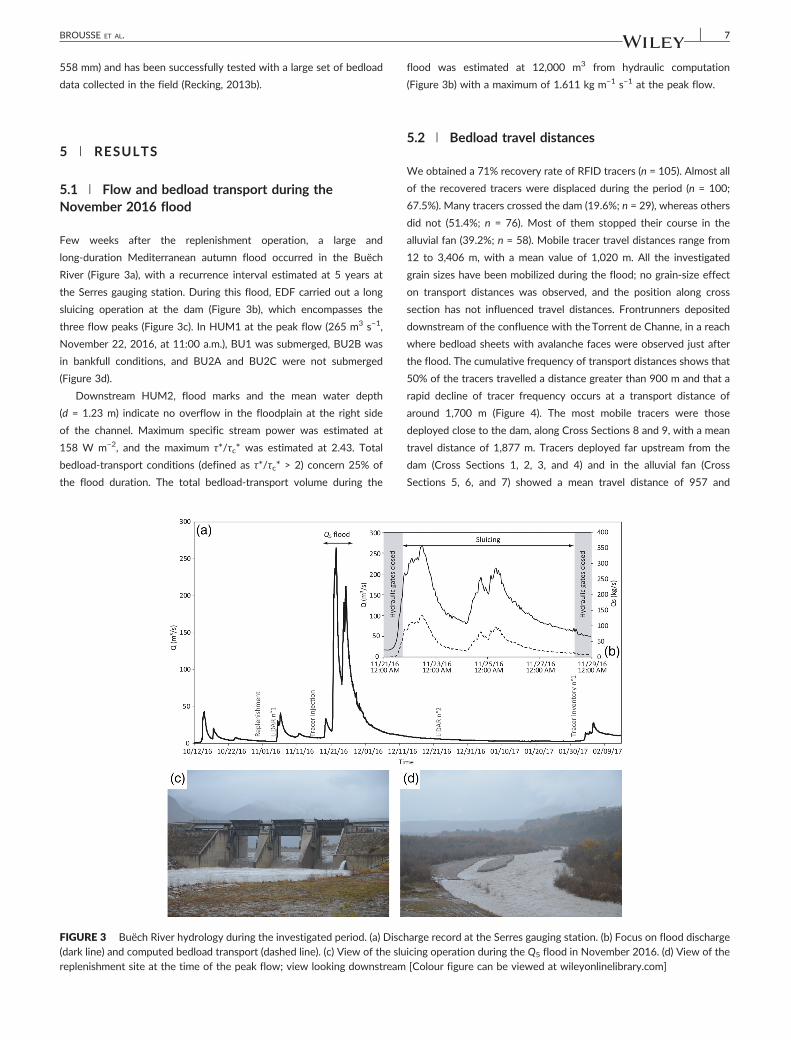
5.1 | Flow and bedload transport during theNovember 2016 flood
Few weeks after the replenishment operation, a large and
long‐duration Mediterranean autumn flood occurred in the Buëch
River (Figure 3a), with a recurrence interval estimated at 5 years at
the Serres gauging station. During this flood, EDF carried out a long
sluicing operation at the dam (Figure 3b), which encompasses the
three flow peaks (Figure 3c). In HUM1 at the peak flow (265 m3 s−1,
November 22, 2016, at 11:00 a.m.), BU1 was submerged, BU2B was
in bankfull conditions, and BU2A and BU2C were not submerged
(Figure 3d).
Downstream HUM2, flood marks and the mean water depth
(d = 1.23 m) indicate no overflow in the floodplain at the right side
of the channel. Maximum specific stream power was estimated at
158 W m−2, and the maximum τ*/τc* was estimated at 2.43. Total
bedload‐transport conditions (defined as τ*/τc* > 2) concern 25% of
the flood duration. The total bedload‐transport volume during the
FIGURE 3 Buëch River hydrology during the investigated period. (a) Disc(dark line) and computed bedload transport (dashed line). (c) View of the slureplenishment site at the time of the peak flow; view looking downstream
flood was estimated at 12,000 m3 from hydraulic computation
(Figure 3b) with a maximum of 1.611 kg m−1 s−1 at the peak flow.
5.2 | Bedload travel distances
We obtained a 71% recovery rate of RFID tracers (n = 105). Almost all
of the recovered tracers were displaced during the period (n = 100;
67.5%). Many tracers crossed the dam (19.6%; n = 29), whereas others
did not (51.4%; n = 76). Most of them stopped their course in the
alluvial fan (39.2%; n = 58). Mobile tracer travel distances range from
12 to 3,406 m, with a mean value of 1,020 m. All the investigated
grain sizes have been mobilized during the flood; no grain‐size effect
on transport distances was observed, and the position along cross
section has not influenced travel distances. Frontrunners deposited
downstream of the confluence with the Torrent de Channe, in a reach
where bedload sheets with avalanche faces were observed just after
the flood. The cumulative frequency of transport distances shows that
50% of the tracers travelled a distance greater than 900 m and that a
rapid decline of tracer frequency occurs at a transport distance of
around 1,700 m (Figure 4). The most mobile tracers were those
deployed close to the dam, along Cross Sections 8 and 9, with a mean
travel distance of 1,877 m. Tracers deployed far upstream from the
dam (Cross Sections 1, 2, 3, and 4) and in the alluvial fan (Cross
Sections 5, 6, and 7) showed a mean travel distance of 957 and
harge record at the Serres gauging station. (b) Focus on flood dischargeicing operation during the Q5 flood in November 2016. (d) View of the[Colour figure can be viewed at wileyonlinelibrary.com]

FIGURE 4 Cumulative frequency distribution of radio‐frequencyidentification tracer transport distances during the November 2016flood
8 BROUSSE ET AL.
114 m, respectively. Most of the tracers that crossed the dam were
injected close to the dam (23/29) on Cross Sections 8 and 9.
5.3 | Sediment remobilization in the replenishmentsite
In HUM1, the LiDAR‐derived DoD shows a gross erosion of
25,450 m3 (±40 m3) and a gross deposition of 7,600 m3 (±20 m3;
Figure 5a,b). This negative sediment balance is clearly driven by berm
erosion: a PR of 48% was obtained by considering the total volume of
berm erosion. The replenishment reach shows a much higher morpho-
logical activity in the right side of the channel, where most of the flow
was concentrated (Figure 5c,d). Erosion was very important for BU1
(6,450 ± 7 m3) and for BU2C (14,100 ± 10 m3), whereas erosion was
very low for BU2A along the trench (1,550 ± 2 m3). PR values obtained
for BU1, BU2C, and BU2A are 47.6%, 31.1%, and 85.6%, respectively.
Bank erosion of a low terrace accounted for the remaining
2,800 ± 17 m3 of sediment loss. A deposit of 800 ± 2 m3 was observed
along the trench, showing that bedload transport was active in this
artificial secondary channel. The remaining 6,800 ± 18 m3 of gross
deposition are homogeneously distributed over the low‐flow channel
of the replenishment reach, which exhibits a 0.5‐m aggradation after
the flood (Figure 6a). This clearly shows that a significant bedload vol-
ume crosses the dam during the flood.
5.4 | Morphological change in the downstream reach
Downstream HUM1, the longitudinal distribution of active‐channel
bed‐level change shows a much higher morphological activity in the
first few kilometres downstream of the dam, up to a distance of
~3.5 km, and a lower activity further downstream (Figure 6b). This is
a first observation suggesting a strong channel response to sediment
replenishment. Along the first 3.5 km downstream of the dam (except-
ing HUM1), three successive singular reaches can be easily isolated,
which alternate in aggradation and degradation. The first one corre-
sponds to a 2‐km aggraded reach corresponding to HUM2; the second
one corresponds to a 0.45‐km degraded reach (upstream part of
HUM3, referred to as HUM3a); the third one corresponds to the next
0.75‐km aggraded reach (HUM3b).
HUM2 is characterized by a net positive sediment balance
(20,700 ± 160 m3; Figure 5a). A general increase of bed level is
observed for both Zcs (Zcs = 0.2 m; min = −0.3 m; max = 0.5 m) and
Zmin (Zmin = 0.5 m; min = −0.1 m; max = 0.7 m). A downstream gradient
of decreasing aggradation intensity is observed along this reach.
HUM3a is characterized by a net negative sediment balance
(−4,700 ± 69 m3). A decrease of active‐channel bed level is observed
for both Zcs (Zcs = −0.15 m; min = −0.6 m; max = 0.1 m) and Zmin (
Zmin = 0.2 m; min = −0.9 m; max = 0.5 m). HUM3b is characterized
by a net positive sediment balance (10,300 ± 120 m3), and an increase
of active‐channel bed level is observed for both Zcs (Zcs = 0.22 m;
min = 0.05 m; max = 0.6 m) and Zmin (Zmin = 0.3 m; min = −0.2 m;
max = 0.8 m). Considering the first aggraded unit (HUM2; 2,000 m)
or the two others downstream of HUM3 (3,200 m), LR ranges from
5.6 to 8.9.
5.5 | Assessment of the downstream propagation ofreplenished gravels
The classic sediment balance equation (O = I − ΔS, with O as the sed-
iment output, I the sediment input, and ΔS the net storage change) and
the cumulative distribution of tracer transport distances were com-
bined for assessing the downstream propagation of the sediment
wave induced by the sediment replenishment operation. By consider-
ing sediment loss of the replenishment reach (HUM1), it appears that
25,450 m3 of gravels has been supplied to the downstream reach of
the Buëch River, mainly by lateral erosion of artificial berms
(22,650 m3). A first way to evaluate the minimum distance at which
this volume has been entirely diffused is to look at the cumulative sed-
iment deposition curve downstream of HUM1. This curve shows that
the minimum diffusion reach has a length of 2.3 km (Figure 7). By
applying the cumulative frequency distribution of tracer transport dis-
tances to the volume of berm sediment loss, it is possible to obtain a
theoretical curve of the sediment wave deposition. This curve nicely
fits to the observed cumulative channel deposition along the first

FIGURE 5 Channel change detection mapfollowing the November 2016 flood. (a) DoDafter LoD subtraction and then exclusionalong HUM1 and HUM2; the white dashedlines represent the surface covered by LiDARdata. (b) Zoom‐in view of HUM1. (c) Sedimentbalance for each berm unit (PR). (d) Relativeno eroded width ratio (WR). DoD, digitalelevation model of difference; LoD, level ofdetection [Colour figure can be viewed atwileyonlinelibrary.com]
BROUSSE ET AL. 9
2.3 km of HUM2 (Figure 7). It is likely that this distance of 2.3 km
corresponds to the maximum propagation of the sediment wave
induced by gravel replenishment. This also means that this distance
is likely the appropriate spatial scale to consider for applying a
reach‐scale sediment balance equation, which is not too biased by
sediment throughput.
The application of the sediment balance equation in HUM2 where
significant net deposition is observed provides a way to reconstruct
sediment transfers of the Buëch River downstream of the dam during
the November 2016 flood (Figure 8). The only term of the equation
that has been constrained is the storage change along the reach (net
deposition of 20,700 ± 160 m3). By considering bedload‐transport
computation using the flood hydrograph at the downstream end of
this reach (12,000 m3), it is possible to evaluate bedload inputs at
32,700 m3. Inputs are divided into (a) berm erosion (22,650 m3),
(b) bank erosion (2,800 m3), and (c) the back‐calculated bedload
passing through the dam (7,250 m3). Because a deposited volume of
7,600 m3 is observed along HUM1, it should be added to the
7,250 m3 that passed through to dam, giving a total bedload transport
crossing the sluice gates during the flood of 14,850 m3. This

FIGURE 6 Buëch River bed‐level change downstream of the dam following the November 2016 flood. (a) Low flow channel evolution (Zmin). (b)Active‐channel evolution (Zcs). Grey surface corresponds to level of detection
FIGURE 7 Cumulative bedload deposition downstream HUM1. 1:Reconstruction of bedload deposition from tracer CDF. 2: Observedgross deposition using sequential LiDAR surveys
10 BROUSSE ET AL.
value corresponds to 35% of the mean annual bedload yield upstream
of the dam and 74% of the mean bedload yield downstream of
the dam.
6 | DISCUSSION
6.1 | How is the downstream propagation ofsediment replenishment assessed?
A key issue to consider for the planning of sediment replenishment
operations in river channels is the pattern of gravel redistribution
downstream of the injection site during flow events. The case of
the Buëch River offers a well‐documented field experiment where
the combination of topographic resurvey covering a long channel
reach (~7 km) and bedload tracing successfully helps to isolate the
morphological signature of an artificially induced sediment wave.
Both the bed‐level evolution and 2D change detection map from
sequential LiDAR data reveal a dominant pattern of channel
aggradation along a 2.5‐km reach downstream of the dam. Further
downstream, another sediment deposition zone is observed at a
distance of 3.5 km, but this distal aggraded reach is likely not related
to the sediment replenishment operation. Additional sediment input
from the Torrent de Channe and active channel remobilization could
have been deposited in this distal area characterized by a short
transition between wandering to braided pattern. The cumulative
frequency of bedload‐transport distances observed during the flood
indeed shows that 90% of the tracers deposited at a distance lower
than 2 km. When this cumulative frequency is used to redistribute
the effective bedload supply from the replenishment reach, which
has been well constrained by sequential LiDAR data, it is possible
to reproduce the observed cumulative deposition curve up to a
distance of around 2 km downstream of the replenishment reach.
Data from RFID tracers clearly help to detect the propagation front
of the artificial gravel wave. It should however not be forgotten that
the frequency curve of tracers only integrates the coarse fraction of
the bedload GSD, and it is possible that the right tail of the distribu-
tion is not correctly represented by the observations. This is also
supported by the fact that tracers have been deployed upstream
of the dam and that their virtual velocity have been potentially
reduced by the trapping effect of the dam and its reservoir. A
seeding of tracers in the artificial berms would have been better
for reconstructing the deposition pattern of the replenished
sediment. It is also recognized that a change detection integrating
the wet portions of the active channel would have been better for
reconstructing the flood sediment balance. However, the fact that
the regulated discharge downstream of the dam was strictly the
same during the two LiDAR surveys shows that bed‐level evolutions
obtained for both the active channel and the low‐flow channel can
be considered as unbiased.

FIGURE 8 Buëch River sediment balance of the November 2016 flood. 1: Net sediment balance from LiDAR surveys. 2: Gross sediment volumesfrom LiDAR surveys. 3: Bedload calculation. 4: Back‐calculated volumes
BROUSSE ET AL. 11
6.2 | Hydraulic sluicing versus sedimentreplenishment
Beyond isolating the downstream effect of sediment replenishment,
the combination of bedload tracing and topographic monitoring suc-
cessfully helps to evaluate the respective role of hydraulic sluicing
and sediment replenishment in feeding the starved channel reach with
sediment. RFID tracers first demonstrated that the sluicing operation
during the flood was effective in terms of bedload continuity, because
19.6% of the tracers deployed upstream of the dam have crossed the
sluice gates. This is also confirmed by gravel deposition in the channel
immediately downstream of the dam, as documented by sequential
LiDAR data. The sediment balance calculated for the reach where
most of the bedload input from the replenishment site gets deposited
also provides a way to back‐calculate the total volume of bedload
crossing the dam during the flood, provided that the computed
bedload export from the investigated reach can be considered as cor-
rect. The bedload flux (direct sampling) was not constrained along the
reach, because such data are particularly difficult to obtain in the field.
Even if some recent advances with seismic sensors deployed along
banks have been reported, it is still a challenge to calibrate the seismic
signal for obtaining a bedload flux (Burtin, Hovius, & Turowski, 2016).
The back‐calculated volume represents approximately half of that sup-
plied by the replenishment reach, but only around 25% of the volume
crossing the dam effectively contributes to the recharge of the starved
channel reach. This clearly shows that hydraulic sluicing alone will be
insufficient to stop the channel incision downstream of the dam, and
that such operations must be associated with sediment replenishment
to compensate the sediment deficit.
6.3 | How efficient is sediment replenishment forfeeding starved river channels?
The case of the Buëch River downstream of the Saint‐Sauveur dam
offered a rare opportunity to document in the field the effect of
artificially built gravel berms in river channels. The high‐flow
stockpile design of sediment placement into the river channel, which
consists of creating artificial berms on each side of the active
channel, proved to be a satisfactory approach, because 48% of the
replenished volume has been effectively entrained during the first
flood following the restoration works. Although this value is far from
the maximum theoretical efficiency of 100% entrainment, it is quite
similar to maximum values reported for recent sediment replenish-
ment operations in large Alpine gravel‐bed rivers (Table 3). The
comparison of berm erosion patterns observed for the Buëch River
confirms the importance of submergence conditions, as previously
demonstrated by flume experiments of sediment replenishment
designs (Battisacco et al., 2016). A higher submergence of the berm
during flow events should guarantee a better remobilization of the
artificially stored sediment. It also appears that the opening of a
trench into the berm does not really improve the erosion, likely
because the diverted discharge was insufficient to induce significant
channel shifting. It is also likely that the trench limited the erosive
power of the main channel by diverting a substantial part of the
flood discharge. Now, the trench is perched and could not be
flooded during high flows.
Efficiency feedback from the Isar River, the Rhine River, and the
Buëch River shows the importance of the replenishment volume for
sediment balance recovery (Table 3). As shown by deficit recovery rate
(DR), it appears that DR < 20% on the Isar River is not enough for
reversing the incision trend. On the contrary, with DR > 70% on the
Rhine River and on the Buëch River, net positive channel storage
changes are observed following replenishment. However, maximizing
the morphological effects of sediment replenishment depends not
only on the reinjected volume but also on the design of berm
deployment in the channel. As shown by Battisacco et al. (2016), the
comparison of LR values obtained in the Rhine and the Buëch con-
firms more efficient gravel dispersion when berms are deployed on
each side of the active channel. However, it is difficult to conclude
about the effect of replenishment design, because differences

TABLE 3 Replenishment feedbacks in large Alpine gravel‐bed rivers
Reference
Replenishment characteristics Heckmann et al. (2017) Arnaud et al. (2017) This paper
River Isar River Rhine River Buëch River
Site 3rd sill Steinbock Monument Kembs Saint‐Sauveur
Drainage area (km2) 1,138 1,138 34,500 836
Active channel width (m) 80 80 110 70
Replenishment date 2013 2013 2010 2016
Mean annual sediment deficit (D, m3 year−1) 10,000 10,000 16,300 20,000
Replenishment volume (R, m3) 4,010 6,312 23,000 43,500
Design Single volume Single volume Single volume Parallel volume
Replenishment design High‐flow stockpiles
Peak flow (m3 s−1) of the first flow event after replenishment 150 1,340 265
Flood frequency (Qf) 0.5 0.5 0.2
PR (%) 60 87 50 48
Effective replenishment (ER, m3) 1,600 800 11,500 22,650
Deficit recovery rate (DR, %) 16 8 71 113.25
Sediment storage change in restored reach Erosion Stability Deposition Deposition
LR (m) ‐ ‐ 3 5.6
Note. ER = R (1 − PR) and DR ¼ 100ERD
� �.
12 BROUSSE ET AL.
between sites may be dominated by the size of the replenishment
operation (relative to catchment size or active channel width), and
by the intensity of the investigated floods, which are both higher for
the Buëch. Feedbacks from additional field experiments are still
missing to make a comprehensive meta‐analysis of design efficiency.
The case of the Buëch River reveals that channel aggradation
was not associated with significant channel shifting and active chan-
nel widening. The volume effectively entrained along the replenished
reach was insufficient to reactivate a braiding pattern along the
restored reach and to subsequently increase the downstream effect
of the sediment replenishment operation. If channel shifting would
have been active in the aggraded reach, the remobilization of low
terraces would have contributed to increase the sediment supply
and to propagate the morphological restoration along a much longer
channel reach. However, the lateral shifting of the aggraded reach
would have only been possible downstream of the confluence with
the Torrent de Channe, where the active channel is unconstrained
by embankments.
7 | CONCLUSIONS
A one‐shot major sediment replenishment operation conducted along
the dam‐impacted Buëch River proved to be successful for reverting
channel incision downstream of the dam. Morphological objectives
are achieved in a favourable hydrological context and attested for a
successful operation.
The complementary use of LiDAR‐based topographic resurvey and
bedload tracing with UHF active RFID tags successfully helps to
detect the downstream propagation of the sediment wave and to
evaluate the respective role of hydraulic sluicing and sediment replen-
ishment in the sediment balance.
In terms of design, some recommendations are also provided to
optimize replenishment efficiency in large gravel‐bed river: (a) the
volume of sediment replenishment should be close to the annual
sediment deficit for a significant morphological recovery; (b) the
high‐flow stockpile design of berm implantation with good submer-
gence is a good solution for maximizing berm erosion; and (c) choice
of trench remains uncertain without specific modelling. Beyond
design, dam exploitation is a major control factor of efficiency, and
sluicing practice should be as frequent as possible in order to maximize
sediment balance recovery.
Moreover, monitoring in other hydrological contexts (flash floods
with or without sluicing) and a longer survey period will permit to
evaluate sustainability of replenishment operation (impact duration,
mean residence time of berms, berms fixing, and best frequency for
replenishment operation).
ACKNOWLEDGEMENTS
This work benefited from the financial support of the INTERREG
Alpine Space HyMoCARES project, Électricité de France (EDF), and
Agence française pour la biodiversité (AFB). It has been implemented
in the framework of the LTER‐ZABR (Site Atelier Rivières en Tresses).
ORCID
Guillaume Brousse https://orcid.org/0000-0003-1090-1737
Frédéric Liébault https://orcid.org/0000-0002-3155-6779

BROUSSE ET AL. 13
Remi Loire https://orcid.org/0000-0002-9547-7703
REFERENCES
Anderson, S. W. (2019) Uncertainty in quantitative analyses of topographic
change: Error propagation and the role of thresholding. Earth Surface
Processes and Landforms, 44, 1015–1033. https://doi.org/10.1002/
esp.4551
Arnaud, F., Piégay, H., Béal, D., Collery, P., Vaudor, L., & Rollet, A.‐J. (2017)Monitoring gravel augmentation in a large regulated river and implica-
tions for process‐based restoration. Earth Surface Processes and
Landforms, 42, 2147–2166. https://doi.org/10.1002/esp.4161
Astrade, L., Jacob‐Rousseau, N., Bravard, J.‐P., Allignol, F., & Simac, L.
(2011) Detailed chronology of mid‐altitude fluvial system response to
changing climate and societies at the end of the Little Ice Age (South-
western Alps and Cévennes, France). Geomorphology, 133, 100–116.https://doi.org/10.1016/j.geomorph.2011.06.028
Battisacco, E., Franca, M. J., & Schleiss, A. J. (2016) Sediment replenish-
ment: Influence of the geometrical configuration on the
morphological evolution of channel‐bed. Water Resources Research,
52, 8879–8894. https://doi.org/10.1002/2016WR019157
Belletti, B., Dufour, S., & Piégay, H. (2013) Regional variability of aquatic
pattern in braided reaches (example of the French Rhône basin).
Hydrobiologia, 712, 25–41. https://doi.org/10.1007/s10750‐012‐1279‐6
Bravard, J.‐P., Amoros, C., Pautou, G., Bornette, G., Bournaud, M., Creuzé
Des Châtelliers, M., … Tachet, H. (1997) River incision in South‐EastFrance: Morphological phenomena and ecological effects. Regulated
Rivers: Research and Management, 13, 1–16.
Burtin, A., Hovius, N., & Turowski, J. M. (2016) Seismic monitoring of tor-
rential and fluvial processes. Earth Surface Dynamics, 4, 285–307.https://doi.org/10.5194/esurf‐4‐285‐2016
Carley, J. K., Pasternack, G. B.,Wyrick, J. R., Barker, J. R., Bratovich, P. M.,
Massa, D. A., Reedy, G. D., Johnson, T. R., (2012) Significant decadal
channel change 58‐67 years post‐dam accountingfor uncertainty in
topographic change detection between contour maps and pointcloud
models. Geomorphology, 179, 71–88.
Cassel, M., Dépret, T., & Piégay, H. (2017) Assessment of a new solution
for tracking pebbles in rivers based on active RFID. Earth Surface Pro-
cesses and Landforms, 42, 1938–1951. https://doi.org/10.1002/
esp.4152
Gautier, E. (1994) Interférence des facteurs anthropiques et naturels dans
le processus d'incision sur une rivière alpine ‐ L'exemple du Buëch
(Alpes du sud). Revue de Géographie de Lyon, 69, 57–62. https://doi.org/10.3406/geoca.1994.4238
Habersack, H., & Piégay, H. (2008) River restoration in the Alps and their
surroundings: Past experience and future challenges. In M. Rinaldi, H.
Habersack, & H. Piégay (Eds.), Gravel‐bed Rivers 6: From process under-
standing to the restoration of mountain rivers (pp. 703–737).Amsterdam: Elsevier.
Heckmann, T., Haas, F., Abel, J., Rimböck, A., & Becht, M. (2017) Feeding
the hungry river: Fluvial morphodynamics and the entrainment of
artificially inserted sediment at the dammed river Isar, Eastern Alps,
Germany. Geomorphology, 291, 128–1442. https://doi.org/10.1016/j.geomorph.2017.01.025
HYDRÉTUDES (2013) Définition d'un plan de gestion des alluvions du
Buëch et de ses affluents. Unpublished technical report, SMIGIBA,
Aspres‐sur‐Buëch.
Juez, C., Battisacco, E., Schleiss, A. J., & Franca, M. J. (2016) Assessment of
the performance of numerical modeling in reproducing a replenishment
of sediments in a water‐worked channel. Advances in Water Resources,
92, 10–22. https://doi.org/10.1016/j.advwatres.2016.03.010
Kantouch, S.A., Sumi, T., Kubota, A. & Suzuki, T. (2010) Impacts of sedi-
ment replenishment below dams on flow and bed morphology of
river. In: First International Conference on Coastal Zone Management of
River Deltas and Low Land Coastlines, pp. 285–303. Alexandria.
Kondolf, G. M., Anderson, S., Lave, R., Pagano, L., Merenlender, A., & Bern-
hardt, E. S. (2007) Two decades of river restoration in California: What
can we learn? Restoration Ecology, 15(3), 516–523. https://doi.org/
10.1111/j.1526‐100X.2007.00247.x
Kondolf, G. M., Gao, Y., Annandale, G. W., Morris, G. L., Jiang, E., Zhang, J.,
… Yang, C. T. (2014) Sustainable sediment management in reservoirs
and regulated rivers: Experiences from five continents. Earth's Future,
2(5), 256–280. https://doi.org/10.1002/2013EF000184
Kondolf, G.M. & Minear, J.T. (2004) Coarse sediment augmentation on the
Trinity River below Lewiston Dam: Geomorphic perspectives and
review of past projects. Report to the Trinity River Restoration Program:
Weaverville, CA.
Lallias‐Tacon, S., Liébault, F., & Piégay, H. (2014) Step by step error
assessment in braided river sediment budget using airborne LiDAR
data. Geomorphology, 214, 307–323. https://doi.org/10.1016/j.
geomorph.2014.02.014
Lane, S. N., Westaway, R. M., & Murray, H. D. (2003) Estimation of erosion
and deposition volumes in a large, gravel‐bed, braided river using syn-
optic remote sensing. Earth Surface Processes and Landforms, 28(3),
249–271. https://doi.org/10.1002/esp.483
Liébault, F., Gomez, B., Page, M., Marden, M., Peacock, D., Richard, D., &
Trotter, C. M. (2005) Land‐use change, sediment production and chan-
nel response in upland regions. River Research and Applications, 21,
739–756. https://doi.org/10.1002/rra.880
Liébault, F., Lallias‐Tacon, S., Cassel, M., & Talaska, N. (2013) Long profile
responses of Alpine braided rivers in SE France. River Research and
Applications, 29, 1253–1266. https://doi.org/10.1002/rra.2615
Liébault, F., & Piégay, H. (2002) Causes of 20th century channel
narrowing in mountain and piedmont rivers of Southeastern France.
Earth Surface Processes and Landforms, 27, 425–444. https://doi.org/10.1002/esp.328
Loire R. (2018) Case study: Restoring sediment continuity in the Buëch. IV
Convegno italiano sulla riqualificazione fluviale. Tra cambiamento
climatico e consumo di suolo: la riqualificazione fluviale per un nuovo
equilibrio del territorio. Bologna.
Merz, J. E., Pasternack, G. B., & Wheaton, J. M. (2006) Sediment budget for
salmonid spawning habitat rehabilitation in a regulated
river. Geomorphology, 76(1), 207–228. https://doi.org/10.1016/j.
geomorph.2005.11.004
Musashi Y., Nakata Y., Suzuki T., Oshima M. and Demizu S. (2016) A prac-
tical example of change of river bed environment downstream from
dam reservoir by sediment replenishment, The 84th Annual Meeting of
International Commission on Large Dams, Johannesburg, South Africa,
ISBN 978‐0‐620‐71042‐8.
Ock, G., Sumi, T., & Takemon, Y. (2013) Sediment replenishment to down-
stream reaches below dams: Implementation perspectives. Hydrological
Research Letters, 7(3), 54–59. https://doi.org/10.3178/hrl.7.54
Okano, M., Kikui, M., Ishida, H. & Sumi, T. (2004) Reservoir sedimentation
management by coarse sediment replenishment below dams. In: Pro-
ceedings of the Ninth International Symposium on River Sedimentation,
pp. 1070‐1078. Yichang.
Piégay, H., Alber, A., Slater, L.,Bourdin, L., (2009) Census and typology of
braided rivers in the French Alps. Aquatic Sciences, 71(3), 371–388.https://doi.org/10.1007/s00027‐009‐9220‐4.
14 BROUSSE ET AL.
Piégay, H., Cassel, M., Dépret, T., Michel, K., & Rollet, A‐.J. & Vaudor, L.
(2016) Suivi par RFID de la mobilité des galets: Retour sur 10 ans
d'expérience en grandes rivières. Bulletin de la Société géographique de
Liège, 67, 77–91.
Recking, A. (2013a) A simple method for calculating reach‐averagedbedload transport. Journal of Hydraulic Engineering, 139, 70–75.https://doi.org/10.1061/(ASCE)HY.1943‐7900.0000653
Recking, A. (2013b) An analysis of nonlinearity effects on bed load trans-
port prediction. Journal of Geophysical Research—Earth Surface, 118,
1264–1281. https://doi.org/10.1002/jgrf.20090
Recking, A. (2016) A generalized threshold model for computing bed load
grain size distribution. Water Resources Research, 52, 9274–9289.https://doi.org/10.1002/2016WR018735
Sakurai, T., & Hakoishi, N. (2013) Numerical simulation of sediment supply
from dam reservoirs to downstream by the placed sediment. In
S. Fukuoka, et al. (Eds.), Advances in River Sediment Research
(pp. 1193–1199). Taylor & Francis Group, ISBN 978‐1‐138‐00062‐9.
Sklar, L., Fadde, J., Venditti, J., Nelson, P., Wydzga, M., & Cui, Y. (2009)
Translation and dispersion of sediment pulses in flume experiments
simulating gravel augmentation below dams. Water Resources Research,
45(8), 1–14. https://doi.org/10.1029/2008WR007346
Sumi, T. (2006) Reservoir sediment management measures and necessary
instrumentation technologies to support them. The 6th Japan–TaiwanJoint Seminar on Natural Hazard Mitigation.
Surian, N., & Rinaldi, M. (2003) Morphological response to river engineer-
ing and management in alluvial channels in Italy. Geomorphology, 50,
307–326. https://doi.org/10.1016/S0169‐555X(02)00219‐2
USDA Forest Service (2004) Gravel mitigation and augmentation below
hydroelectric dams. Fort Collins.
Wheaton, J. M., Pasternack, G. B., & Merz, J. E. (2004) Spawning
habitat rehabilitation—II. Using hypothesis development and testing in
design, Mokelumne River, California, U.S.A. International Journal of
River Basin Management, 2(1), 21–37. https://doi.org/10.1080/
15715124.2004.9635219
Wolman, G. (1954) A method of sampling coarse river‐bed material. Trans-
actions of the American Geophysical Union, 35(6), 951–956. https://doi.org/10.1029/TR035i006p00951
How to cite this article: Brousse G, Arnaud‐Fassetta G,
Liébault F, et al. Channel response to sediment replenishment
in a large gravel‐bed river: The case of the Saint‐Sauveur
dam in the Buëch River (Southern Alps, France). River Res
Applic. 2019;1–14. https://doi.org/10.1002/rra.3527