channel encoding and decoding techniquesethesis.nitrkl.ac.in/7133/1/study_kumar_2015.pdfchannel...
TRANSCRIPT
Channel encoding and decoding techniques
1 | P a g e
STUDY AND ANALYSIS OF DIFFERENT
CHANNEL ENCODING AND DECODING
TECHNIQUES
Thesis submitted in the partial fulfilment of the requirements of
Bachelor of Technology
In
ELECTRONICS AND COMMUNICATION ENGINEERING
BY
RONIT KUMAR
111EC0175
DEPARTMENT OF ELECTRONICS AND COMMUNICATION ENGINEERING
NATIONAL INSTITUTE OF TECHNOLOGY ROURKELA
ROURKELA-769008
ODISHA,INDIA
MAY 2015

Channel encoding and decoding techniques
2 | P a g e
STUDY AND ANALYSIS OF DIFFERENT CHANNEL ENCODING AND
DECODING TECHNIQUES
DISSERTATION SUBMITTED IN MAY 2015
TO THE DEPARTMENT OF
ELECTRONICS AND COMMUNICATION ENGINEERING
Of
National Institute of Technology,Rourkela
In partial fulfilment for the requirements of
Bachelor Of Technology
By
RONIT KUMAR(111EC0175)
Under the supervision of
Prof.Upendra Kumar Sahoo
DEPARTMENT OF ELECTRONICS AND COMMUNICATION ENGINEERING
NATIONAL INSTITUTE OF TECHNOLOGY ROURKELA
ROURKELA-769008
ODISHA,INDIA
MAY 2015

Channel encoding and decoding techniques
3 | P a g e
CERTIFICATE
This is to certify that the work on the thesis entitled Study and analysis of different channel
encoding and decoding techniques by Ronit Kumar is a record of original research work
carried out under my supervision and guidance for the partial fulfilment of the requirements
for the degree of Bachelor in Technology in the department of Electronics and
Communication Engineering in National Institute of Technology,Rourkela.
Place:NIT ROURKELA Prof.Upendra Kumar Sahoo
Date:MAY 2015 Professor,ECE Department, NIT ROURKELA,ODISHA

Channel encoding and decoding techniques
4 | P a g e
ACKNOWLEDGEMENT
First and foremost I would like to express my sincere gratitude towards my project supervisor
and guide Prof. Upendra Kumar Sahoo for his advice during my project work.H e has
encouraged me all through out the year which helped me in achieving my goal.His
observations helped me to establish the overall direction of the research and to move
forward with investigation in depth.He has helped me greatly and been a source of
knowledge.
I would like to extend my thanks to our HOD,Prof.Kamalakanta Mahapatra and to all the
professors of the department for their support.
I would like to thank administrative and technical staff members of the Department who
have been kind enough to advise and help me in their respective role.
Last but not the least,I would like to acknowledge the love,support and motivation I received
from my parents and therefore I dedicate this thesis to my family.
RONIT KUMAR
111EC0175
Channel encoding and decoding techniques
5 | P a g e
ABSTRACT
Maintenance of the quality of data is the most important thing in communication. There are
different components that influence the nature of information when it is transferred over a
communication channel like noise, fading etc. To conquer these impacts channel coding
schemes are introduced. In a digital communication system we have to transmit more data
via a noisy channel which results in vast no. of errors. The answer for this issue is channel
encoding and decoding techniques which helps in error control and in increasing the
effectiveness and performance of communication systems.
Channel encoding and decoding techniques
6 | P a g e
CONTENTS
CERTIFICATE
ACKNOWLEDGEMENT
ABSTRACT
1.INTRODUCTION
1.1-OBJECTIVE OF THE THESIS 11
1.2-THESIS ORGANISATION 11
2.CONVOLUTION ENCODING AND DECODING
2.1-Basics 15
2.2-Convolutional encoding 15
2.2.1-System model 15
2.2.2-Encoding Procedure 16
2.2-.3mpulse response of the encoder 17
2.2.4-Time domain approach 17
2.2.5-Tree diagram 18
2.2.6-Trellis 19
2.2.7-State diagram 20
2.3-Convolutional decoding 21
2.3.1-Maximum likelihood decoding 22
2.3.2-Viterbi Algorithm 23
2.3.3-Simulation results 23
2.3.4-Conclusion 24
3.TURBO EQUALISATION
3.1-Abstract 26
3.2 Basics 26
3.3 Turbo equaliser
Channel encoding and decoding techniques
7 | P a g e
3.3.1-Used channel model 28
3.3.2-Detection 29
3.3.3-Turbo equalisation algorithm 31
3.4-Turbo encoder 31
3.5-Turbo decoder 33
3.6-Simulation results 34
3.7-Conclusion 37
4.EXIT Charts for turbo codes
4.1-Motivation and Introduction 39
4.2-Construction of EXIT Charts 39
4.2.1-Benefits of mutual information 40
4.2.2-Iterative decoder 40
4.2.3-Regions of the BER Curve 42
4.2.4-Transfer Characteristics 42
4.2.5-Simulation results 42
4.3-Decoding trajectories
4.3.1 Introduction 47
4.3.2 Simulation results 47
4.3.3 Conclusion 49
5.Repeat Accumulate Codes
5.1-Motivation and Introduction 51
5.2-Block diagram of the encoder 51
5.3-RA decoder 51
5.3.1 Block diagram 51
5.3.2 Procedure of decoding 52
5.4- Simulation results 52
Channel encoding and decoding techniques
8 | P a g e
5.5- Conclusion 59
6.CONCLUSION AND FUTURE WORK 60
7.REFERENCES 61
LIST OF FIGURES
Figure 1: Block diagram of a convolutional encoder 15
Fig 2:Convolutional Encoder 17
Fig 3-Code tree 19
Fig 4:Trellis diagram of the encoder 20
Fig 5:Trellis diagram of the decoder 21
Fig 6:State diagram of the encoder in fig 2 22
Fig 7:Viterbi decoding 23
Fig 8:Example of Viterbi decoding 24
Fig 9 : BER Simulation of turbo decoder performance 24
FIG 10:DIAGRAM OF A COMMUNICATION SYSTEM 27
Fig 11:Block diagram of turbo equalizer 29
Channel encoding and decoding techniques
9 | P a g e
Fig 12:block diagram of turbo equalisation 31
Fig 13: Structure of the turbo encoder 32
Fig 14:State and trellis diagram 33
Fig 15:Turbo decoder architecture 34
Fig 16: Block diagram of the Log Map BCJR decoder 42
Fig 17:Block doagram of the RA Decoder 54

Channel encoding and decoding techniques
10 | P a g e
LIST OF TABLES
TABLE NO 1-IMPULSE RESPONSE 16.

Channel encoding and decoding techniques
11 | P a g e
CHAPTER 1
INTRODUCTION
Channel encoding and decoding techniques
12 | P a g e
1.1 Objective of the thesis:
Analysing and MATLAB implementation of the Convolutional codes and its encoding and
decoding techniques
Analysing and MATLAB implementation of the Turbo codes, its encoder and decoder
structures and their performance through BER charts
Analysing and MATLAB implementation of the performance of Turbo code through EXIT
Charts
Analysing and MATLAB implementation of the performance of Repeat Accumulate codes
through EXIT Charts and BER charts
1.2 Organisation of the thesis
Chapter 2-This chapter analyses the advantages of convolutional codes over linear block
coding techniques. It also describes its encoding and decoding procedures
Chapter 3- This chapter analyses the advantages of Turbo codes over convolutional codes .It
also describes its encoding and decoding procedures and their structures.
Chapter 4- This chapter analyses the advantages of analysis of Turbo codes through EXIT
Charts as compared to the BER curves.
Chapter 5- This chapter analyses the advantages of repeat accumulate codes over turbo
codes. They are also analysed through EXIT charts.

Channel encoding and decoding techniques
13 | P a g e
CHAPTER 2
CONVOLUTIONAL ENCODING AND
DECODING
Channel encoding and decoding techniques
14 | P a g e
2.1 BASICS
Convolution codes don’t process the data bits block wise rather they process the
consecutive bits and use the convolution property of the polynomials to generate the code
words. This is in contrast to the block codes which process the data in a blocked manner.
The contrast between block codes and convolutional codes is the encoding guideline. It is a
sort of error remedying codes.A polynomial function helps in sliding the stream of
information bits. This is equivalent to the convolution operation which justifies the name of
these codes.
A convolutional encoder encodes L data bits to M > L code bits in every time step. The
encoding technique is not memoryless, as the code bits rely on upon the data bits encoded
at past time steps. This is another enormous distinction from block codes, as the block codes
are memoryless. The reality that the convolutional codes have memory permits them to
work well, when L and M are really little. The block codes need to have long block lengths , in
light of the fact that they are memoryless and their execution enhances with block length.
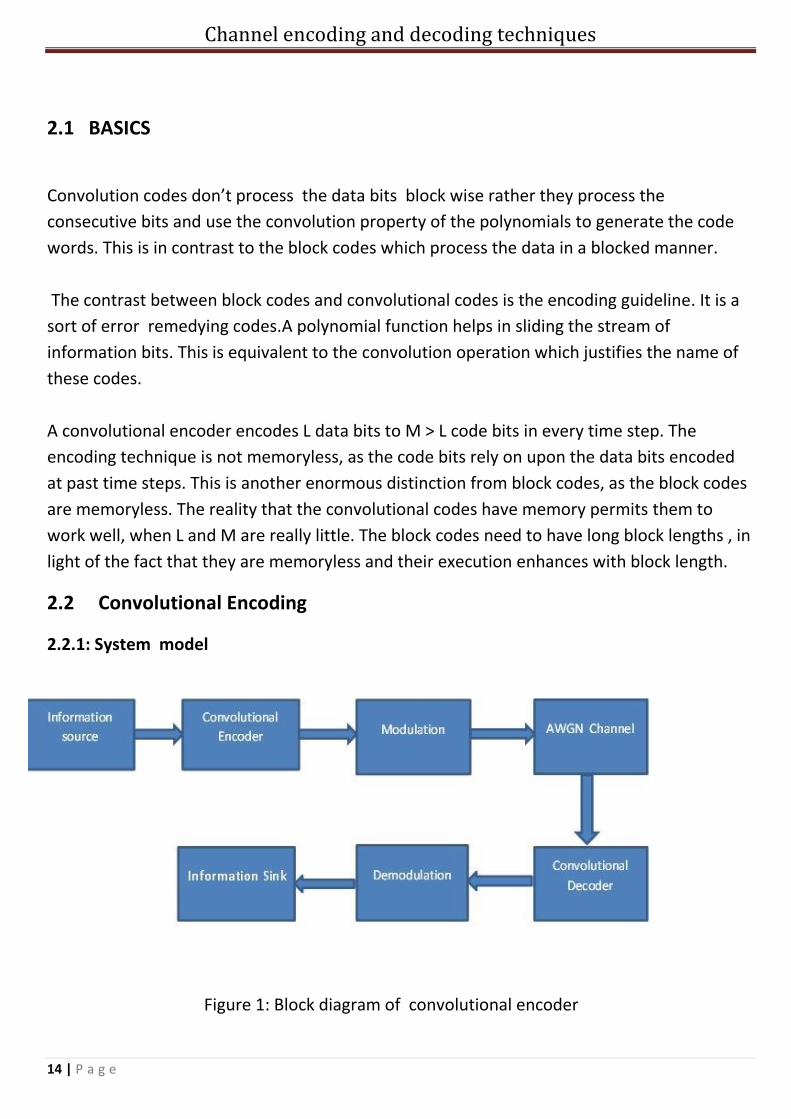
2.2 Convolutional Encoding
2.2.1: System model
Figure 1: Block diagram of convolutional encoder
Channel encoding and decoding techniques
15 | P a g e
A succession of message bits is utilized as information source Convolutional coding is
connected on the binary information . After the completion of encoding of data,
modulation is performed.
AWGN noise is included when this coded information is gone through the channel. The
noise present in the channel changes a portion of the information bits.
Demodulation of the got sequence is performed at the recipient end. After that
convolutional decoding is performed which helps us to recover the unique transmitted
message.
2.2.2. ENCODING PROCEDURE
A bit is moved into the furthest left stage at every information and the bits beforehand
existing in the movement registers are moved one position to right. In the wake of
applying the modulo-2 operation relating yields are gotten. This procedure of proceeds
until the landing of information at the info of encoder. The decision of association
between the movement registers and adders depicts the attributes of code. By
fluctuating the associations, attributes of the code can be changed.
To portray an encoder, set of “n” association vectors are needed.. These associations
depict which shift register is joined with m adders. A “1” in the position shows that,
shift register is joined with the adder and a “0” in given position will demonstrate that
not a solitary association exits between the stage and the adder. In the figure the upper
and lower connection vectors are h1=[1 1 1] and h2=[1 0 1].
Channel encoding and decoding techniques
16 | P a g e
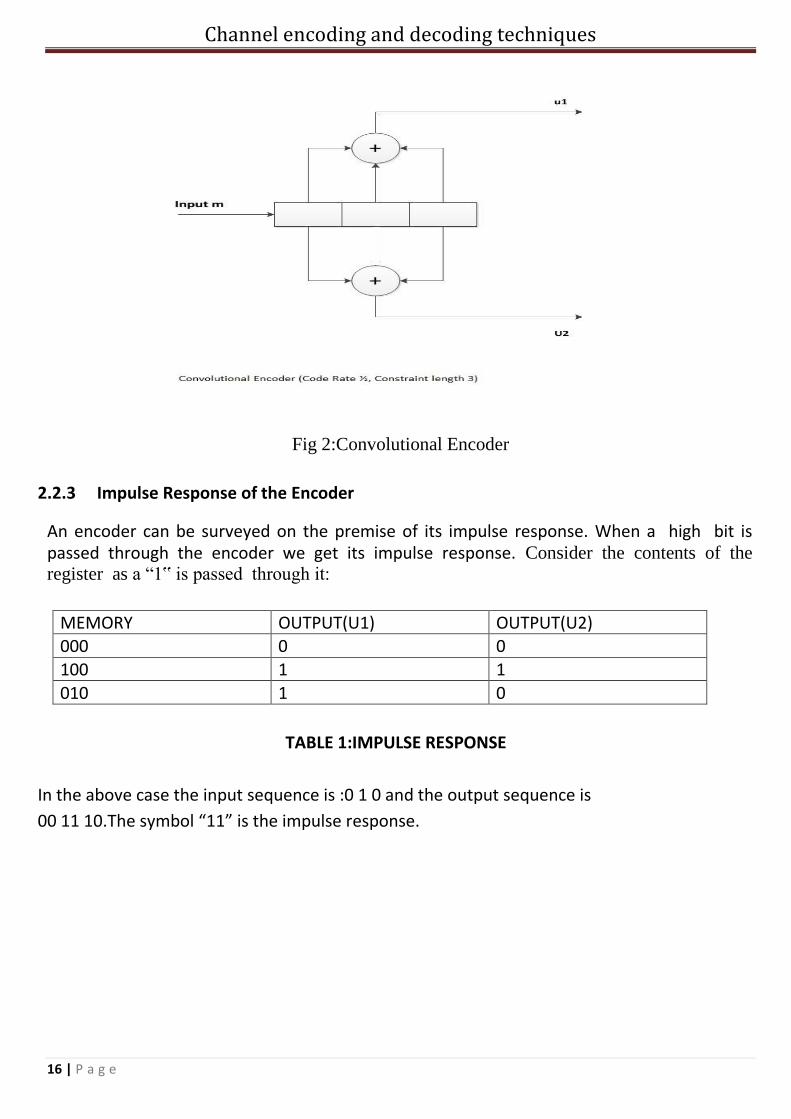
Fig 2:Convolutional Encoder
2.2.3 Impulse Response of the Encoder
An encoder can be surveyed on the premise of its impulse response. When a high bit is passed through the encoder we get its impulse response. Consider the contents of the register as a “1‟ is passed through it:
MEMORY OUTPUT(U1) OUTPUT(U2) 000 0 0
100 1 1
010 1 0
TABLE 1:IMPULSE RESPONSE
In the above case the input sequence is :0 1 0 and the output sequence is
00 11 10.The symbol “11” is the impulse response.
Channel encoding and decoding techniques
17 | P a g e
2.2.4 Convolutional Encoder using time domain approach
The time domain conduct of a binary convolution encoder having code rate 1/N may be
characterized as far as set of N impulse responses.. Lets consider a basic encoder having code
rate ½.We need two impulse responses to describe its conduct in the time space. Let the
sequence [g01 , g11 ,… … , gx1 ]{Here ,x speaks to the quantity of points from where bits are
extricated for modulo-2- adders}denotes the impulse response for way p1 and the grouping
[g02 , g12 ,… … , gx2 ]denotes the impulse response of way p2. The characterized impulse
response is known as the generator sequence of the code. (d0, d1,d2,…..) denote the
message sequence that enter the encoder one bit at a time (starting with d0).The encoder
convolves the message sequence with the impulse response of path p1 and p2 respectively
and then generates two output sequences described as Ci1 and Ci2.The output sequence of
path p1 is the convolutional sum Ci(1)=Ʃxi=0 gi(1) di-1 i=0,1,2…
2.2.5 Tree diagram
The tree diagram helps in understanding the coding procedure of these type of codes.
The encoded group of bits can be derived from the tree diagram. It makes the encoding
procedure more detailed and easy to comprehend.
Channel encoding and decoding techniques
18 | P a g e
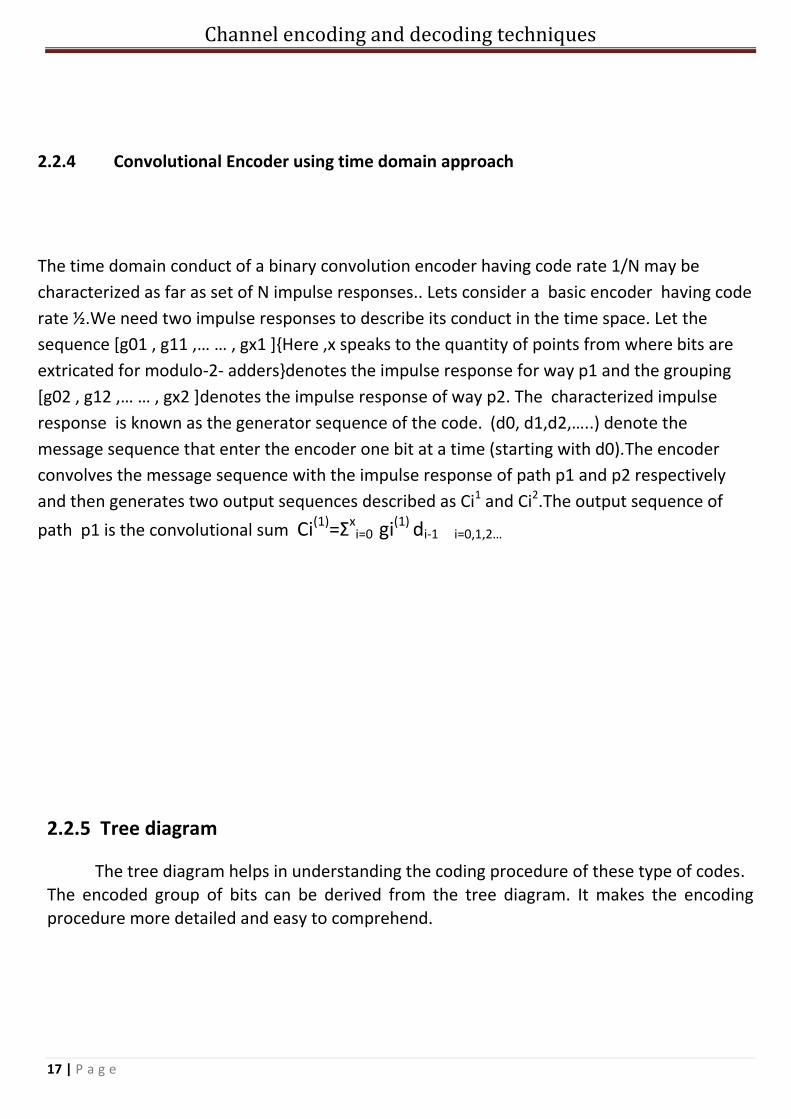
Fig 3-Code tree
Each branch of the tree represents an input symbol and the corresponding pair of binary
symbols(output) is shown on the branch. An input 0 indicates the upper and 1 represents the
lower branch.
2.2.6 Trellis diagram
The trellis diagram of a convolutional code is acquired from its state diagram. All state moves at every time step are expressly demonstrated in the graph to hold the time dimension, as is available in the relating tree diagram. Normally, supporting portrayals on state moves, relating

Channel encoding and decoding techniques
19 | P a g e
info,input and output bits and so on are named in the trellis diagram. It is fascinating to note that the trellis chart, which portrays the operation of the encoder, is extremely helpful for portraying the conduct of the relating decoder, particularly when the celebrated 'Viterbi Algorithm (VA)' is taken after.
Fig 4:Trellis diagram of the encoder

Channel encoding and decoding techniques
20 | P a g e
Fig 5:Trellis diagram of the decoder
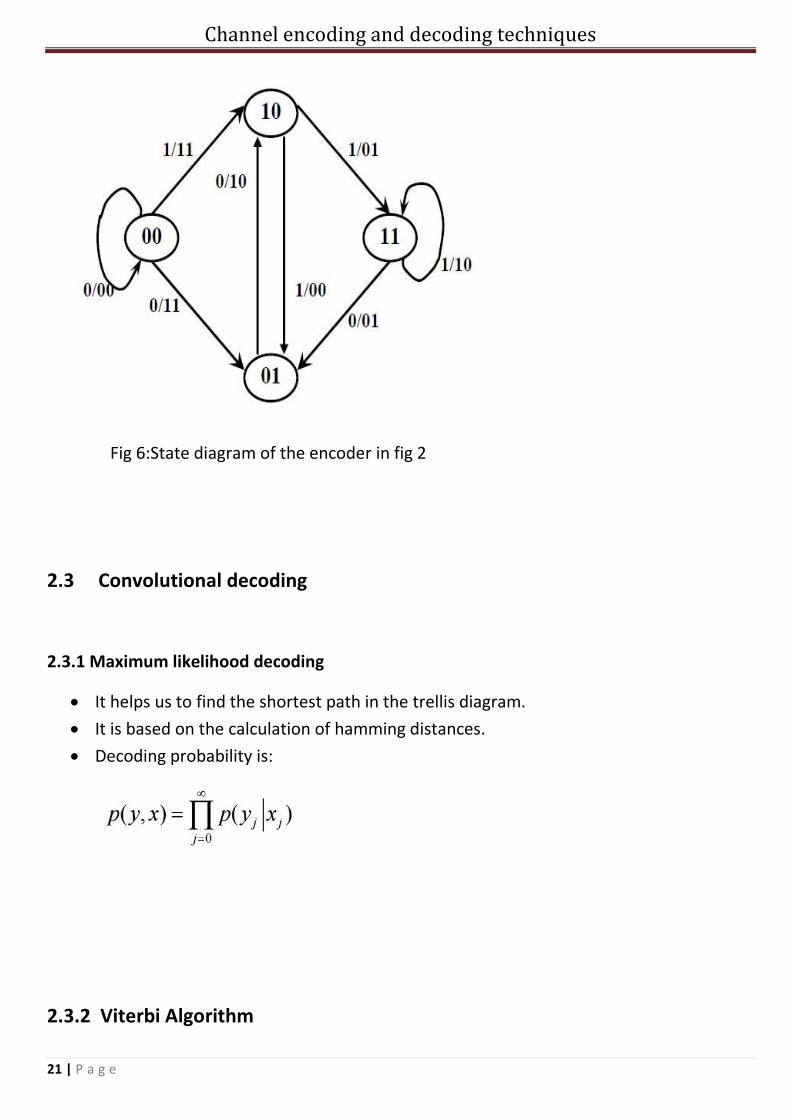
2.2.7 State Diagram
Substance of the furthest right (K-1) shift register stages characterize the states of the
encoder. Along these lines, the encoder in Fig. has four states. The move of an encoder
starting with one state then onto the next, as created by data bits. Fig.4 demonstrates the
state diagram of the encoder in Fig.2. Another information bit causes a move starting with
one state then onto the next. The way data between the states, signified as b/c1 c2 , speaks
to information data bit "b" and the corresponding output bits (c1c2).
Channel encoding and decoding techniques
21 | P a g e
Fig 6:State diagram of the encoder in fig 2
2.3 Convolutional decoding
2.3.1 Maximum likelihood decoding
It helps us to find the shortest path in the trellis diagram.
It is based on the calculation of hamming distances.
Decoding probability is:
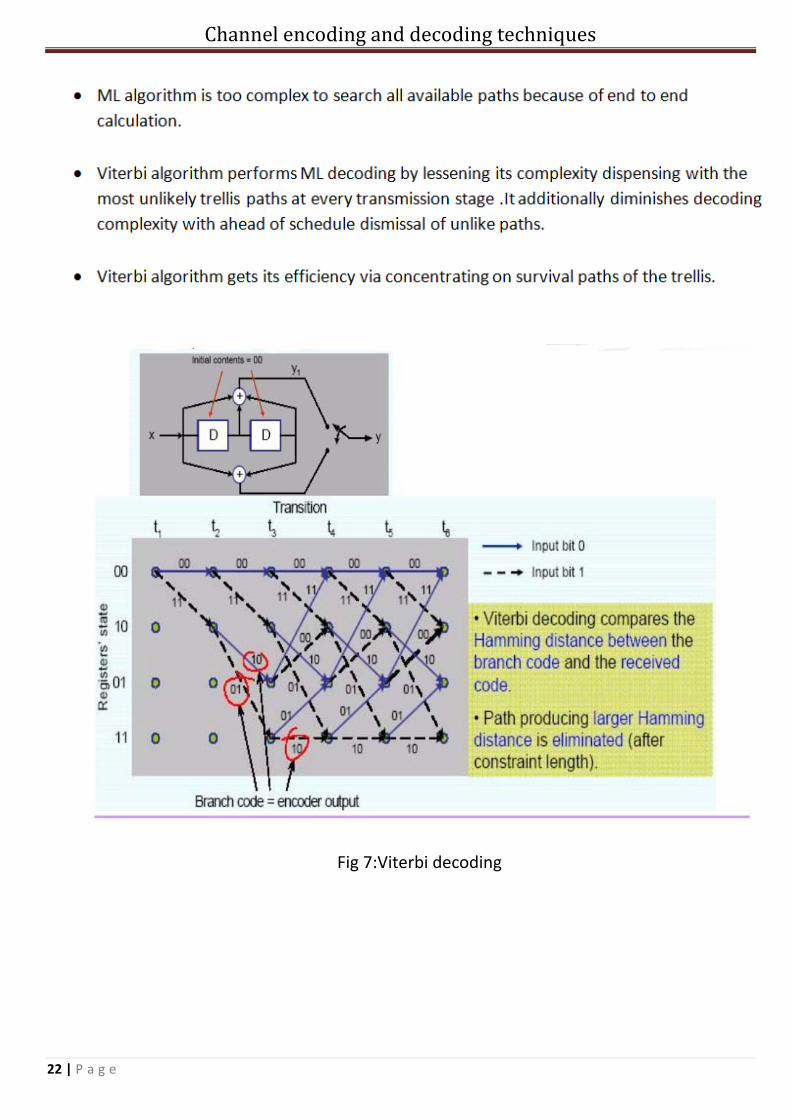
2.3.2 Viterbi Algorithm
Channel encoding and decoding techniques
22 | P a g e
Fig 7:Viterbi decoding
Channel encoding and decoding techniques
23 | P a g e
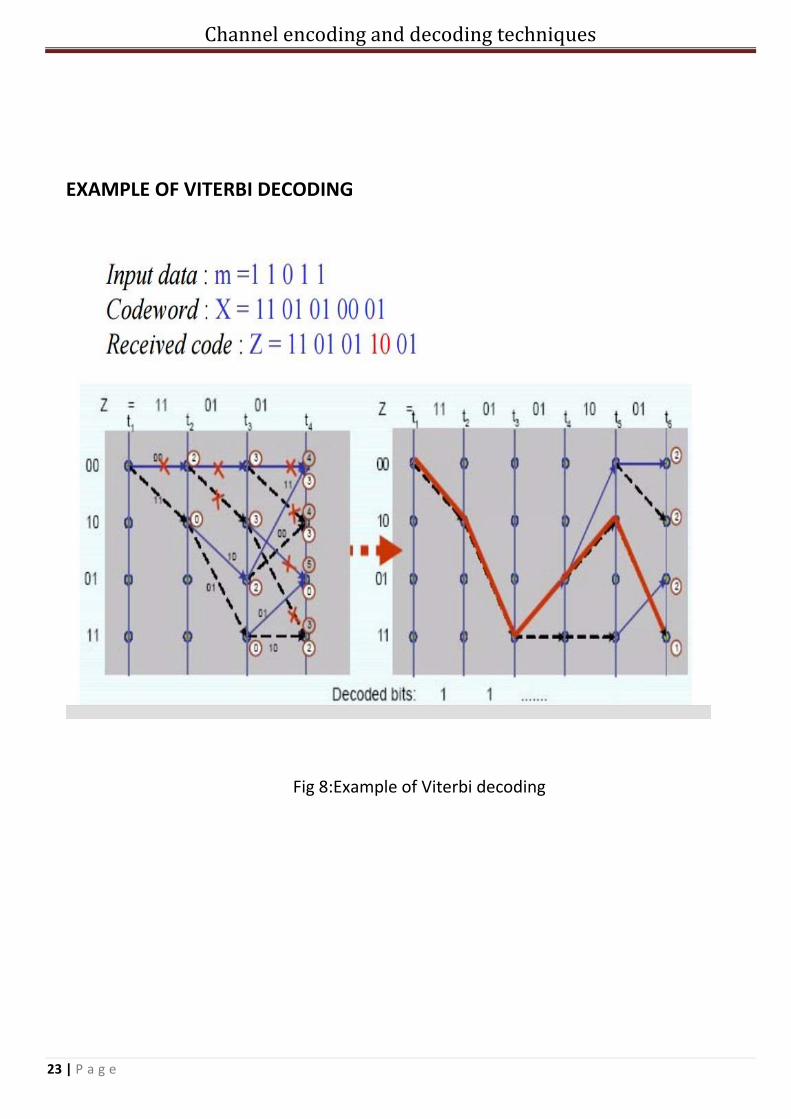
EXAMPLE OF VITERBI DECODING
Fig 8:Example of Viterbi decoding

Channel encoding and decoding techniques
24 | P a g e
2.3.3 Simulation result
Fig 9 : BER Simulation of turbo decoder performance
2.3.4 CONCLUSION
This chapter analyses the convolutional coding and decoding methods and proves that it is
better than the block codes.

Channel encoding and decoding techniques
25 | P a g e
CHAPTER 3
TURBO EQUALISATION
Channel encoding and decoding techniques
26 | P a g e
3.1 ABSTRACT
Turbo equalisation is a characteristic augmentation to the advancement of iterative algorithms
for decoding. If the data bits are protected by FEC and has to be sent through a ISI channel,
then this method is really helpful.
3.2 BASICS
Below given is the transmitter of a communicaton system. The parts of this system are very
important if we want to utilize turbo equalization in the receiving side.
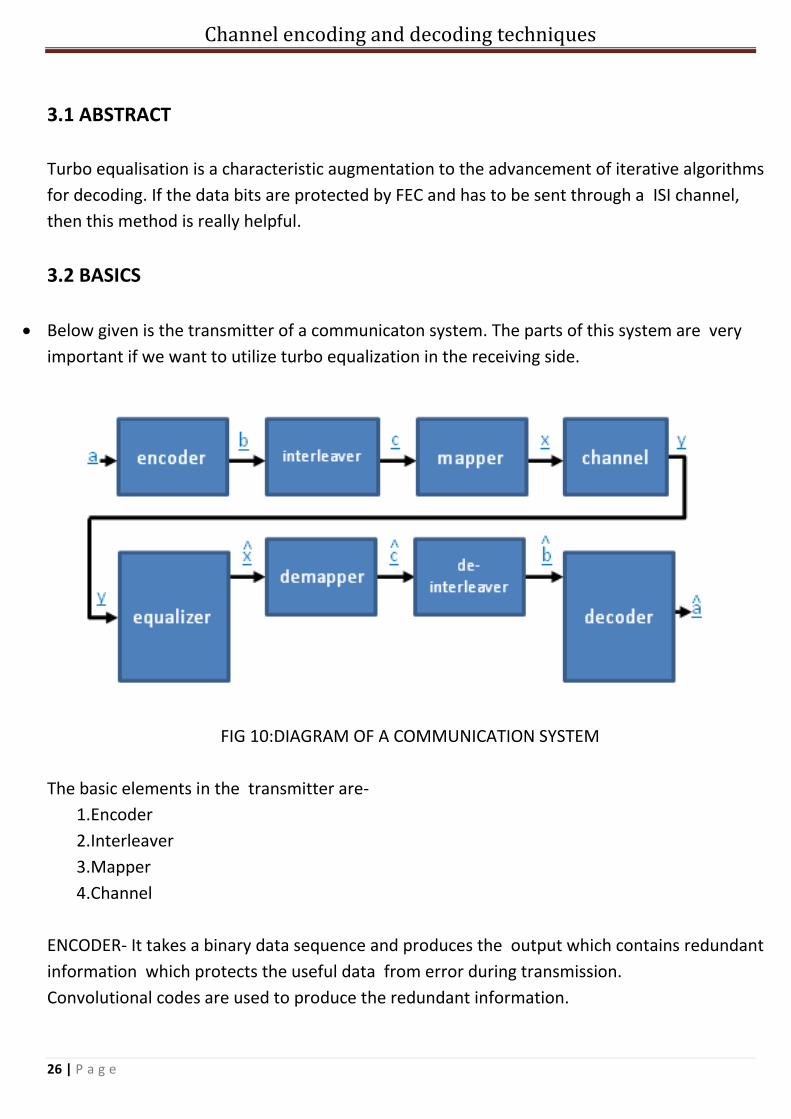
FIG 10:DIAGRAM OF A COMMUNICATION SYSTEM
The basic elements in the transmitter are-
1.Encoder
2.Interleaver
3.Mapper
4.Channel
ENCODER- It takes a binary data sequence and produces the output which contains redundant
information which protects the useful data from error during transmission.
Convolutional codes are used to produce the redundant information.

Channel encoding and decoding techniques
27 | P a g e
INTERLEAVER- The aim of FEC codes is to shield the data from single bit error or short burst
error that is introduced due to noise in the channel.. Because of its shuffling effect it
decorrelates the error events introduced or which can’t be resolved by the equalizer between
neighbouring symbols. Using only a convolutional decoder makes it difficult to mitigate the
error bursts.
MAPPER- It maps the binary bits into channel symbols . In this way binary data are converted
into electrical signal which is then mapped into the channel. The conversion to channel symbols
makes it suitable for modulation.
Receiver- Receiver optimally estimates the data that was transmitted.
Receiver estimates the data such that there is minimum bit error rate. The complexity of
receiver increases because of so many factors.
The complexity increases exponentially with the length of data
In this methodology for expanding the performance, equalizer is utilized for minimizing the
mean square error and symbol error rate by amplifying likelihood of observation in the channel.
3.3 TURBO EQUALIZER
Equalization mitigates the effects of an ISI channel or detection.
The complexity of Viterbi and BCJR is high for certain channels.
The equalization is dependent upon the resulting information from the decoder.
It has an additional loop of feedback as compared to the other equalizers.
Channel encoding and decoding techniques
28 | P a g e
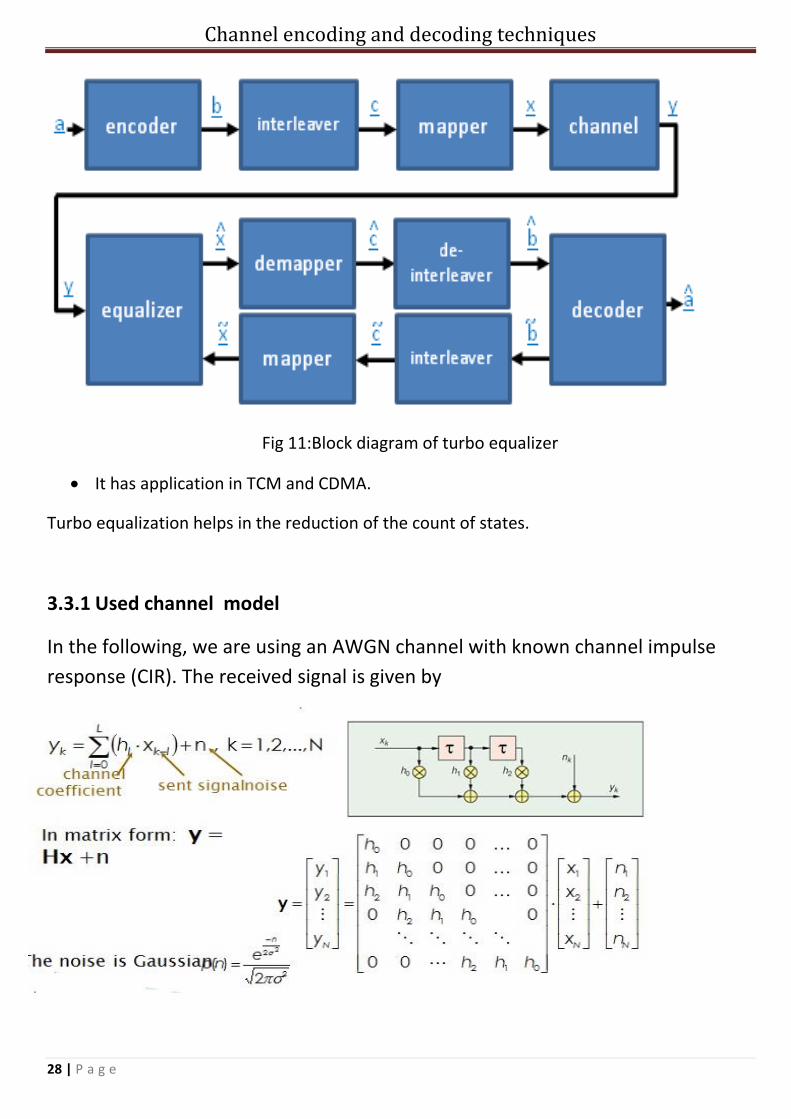
Fig 11:Block diagram of turbo equalizer
It has application in TCM and CDMA.
Turbo equalization helps in the reduction of the count of states.
3.3.1 Used channel model
In the following, we are using an AWGN channel with known channel impulse
response (CIR). The received signal is given by
Channel encoding and decoding techniques
29 | P a g e
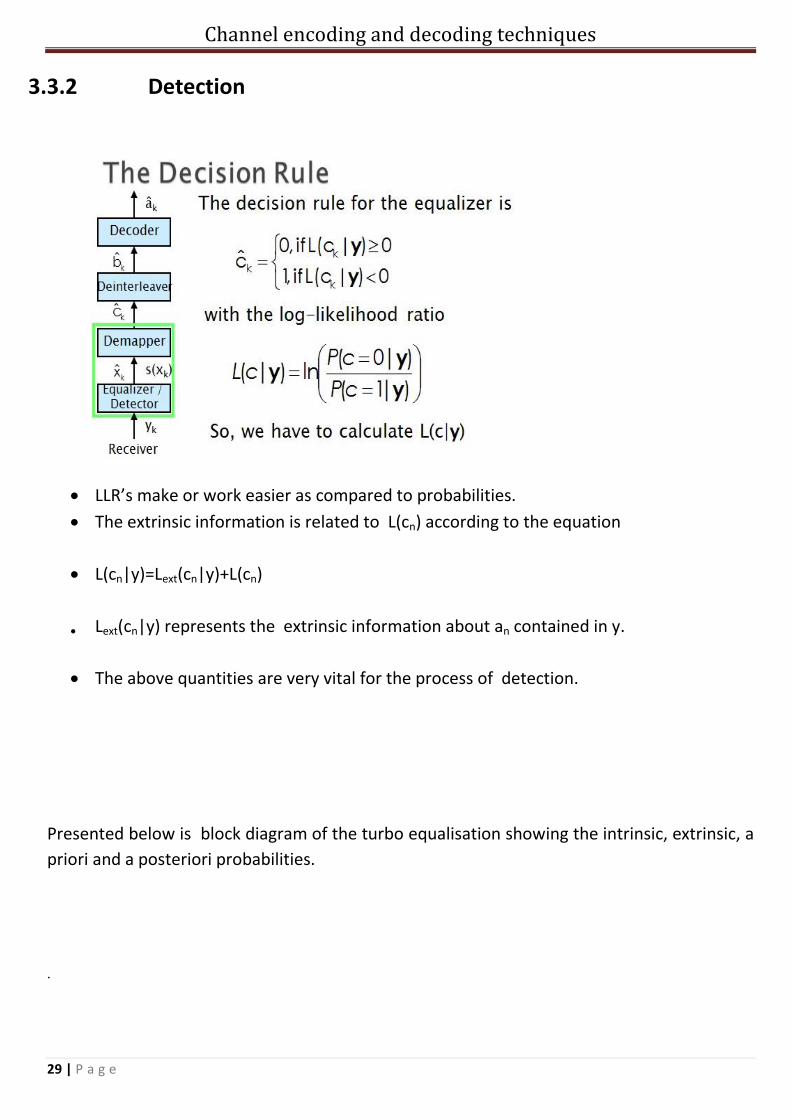
3.3.2 Detection
LLR’s make or work easier as compared to probabilities.
The extrinsic information is related to L(cn) according to the equation
L(cn|y)=Lext(cn|y)+L(cn)
Lext(cn|y) represents the extrinsic information about an contained in y.
The above quantities are very vital for the process of detection.
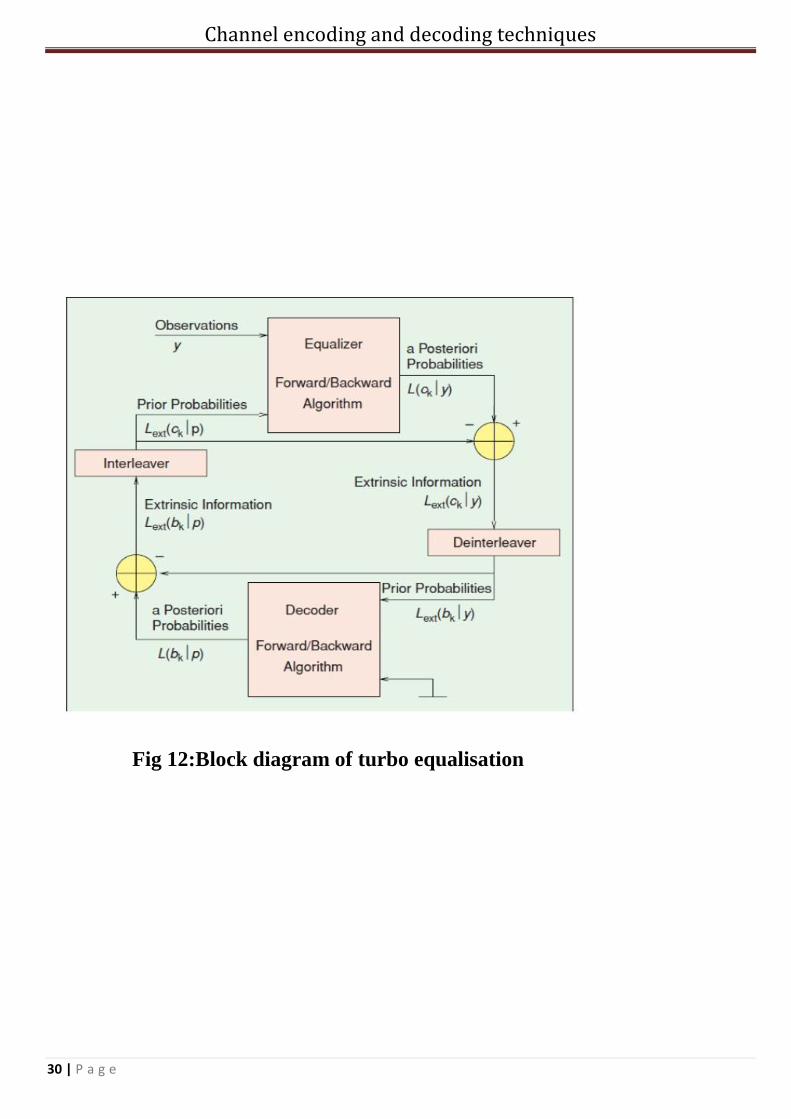
Presented below is block diagram of the turbo equalisation showing the intrinsic, extrinsic, a
priori and a posteriori probabilities.
.
Channel encoding and decoding techniques
30 | P a g e
Fig 12:Block diagram of turbo equalisation

Channel encoding and decoding techniques
31 | P a g e
3.3.3 Turbo equalization algorithm
3.4 Turbo encoder
Channel encoding and decoding techniques
32 | P a g e
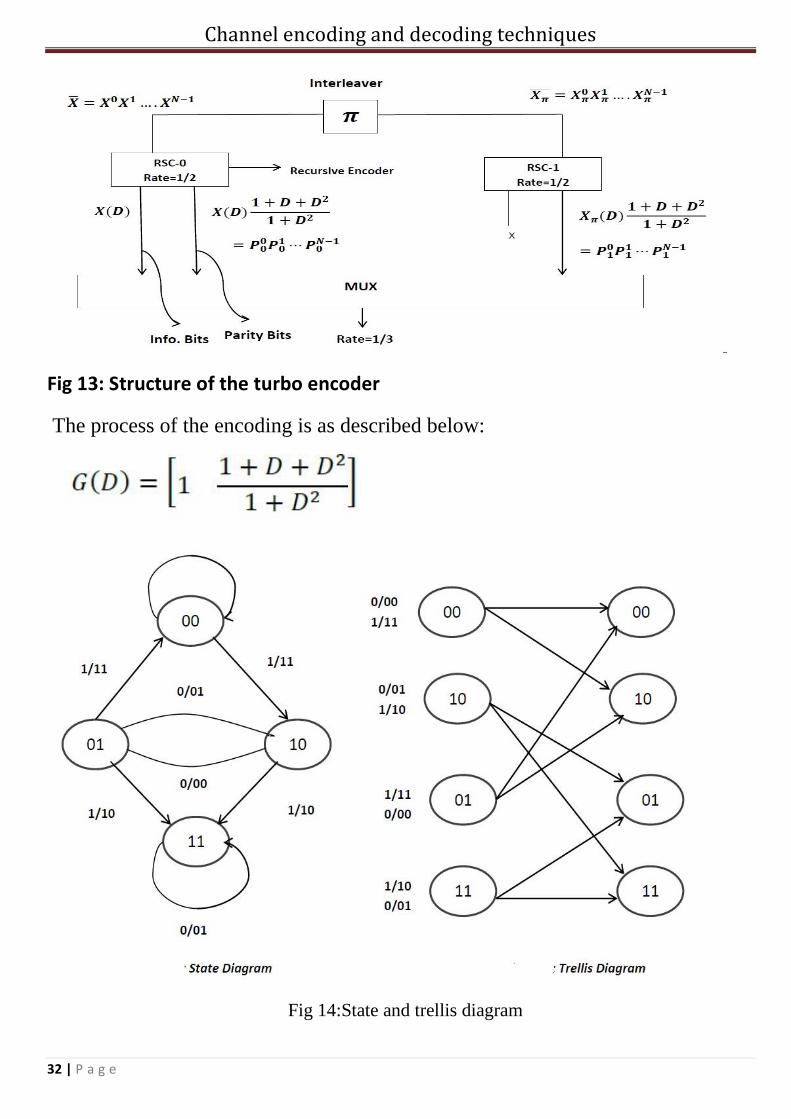
Fig 13: Structure of the turbo encoder
The process of the encoding is as described below:
Fig 14:State and trellis diagram
Channel encoding and decoding techniques
33 | P a g e
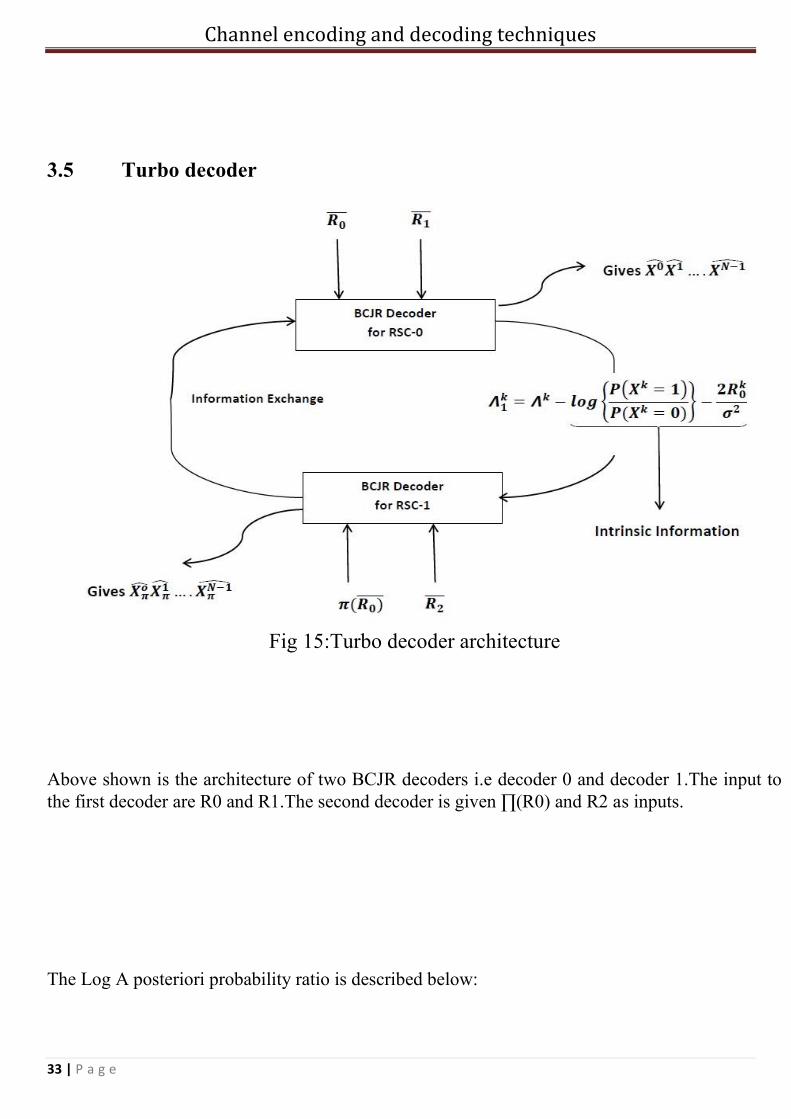
3.5 Turbo decoder
Fig 15:Turbo decoder architecture
Above shown is the architecture of two BCJR decoders i.e decoder 0 and decoder 1.The input to
the first decoder are R0 and R1.The second decoder is given ∏(R0) and R2 as inputs.
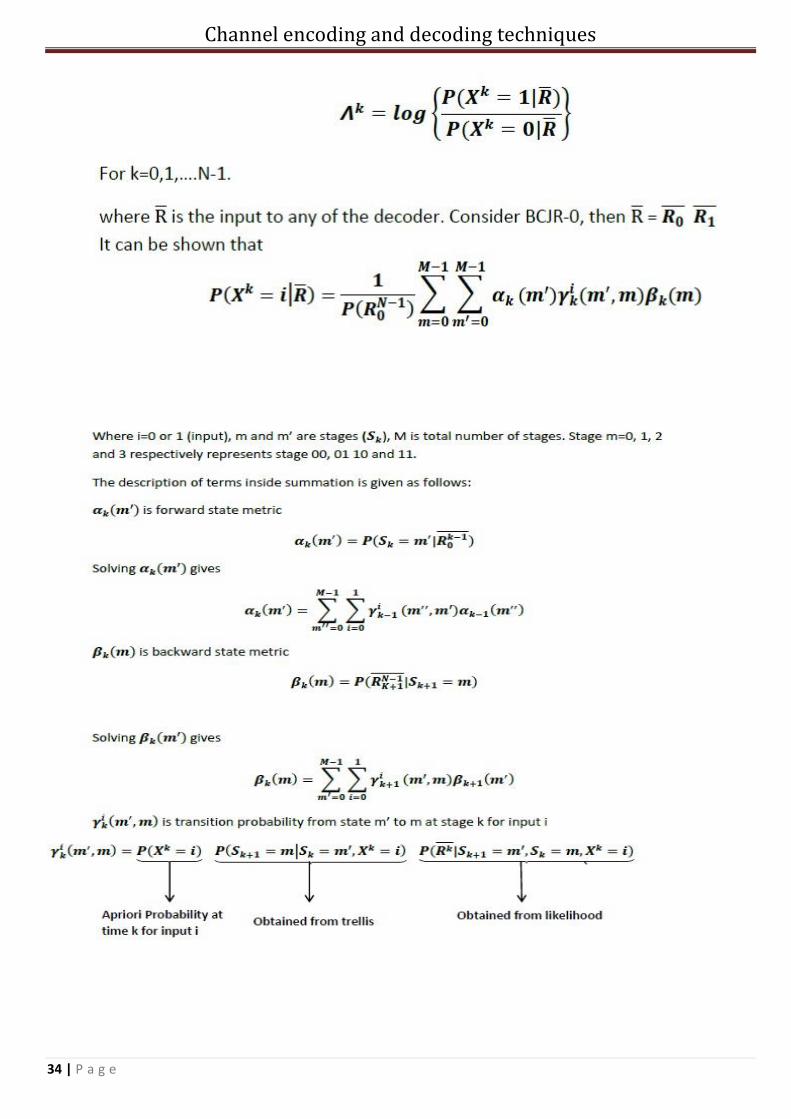
The Log A posteriori probability ratio is described below:
Channel encoding and decoding techniques
34 | P a g e

Channel encoding and decoding techniques
35 | P a g e
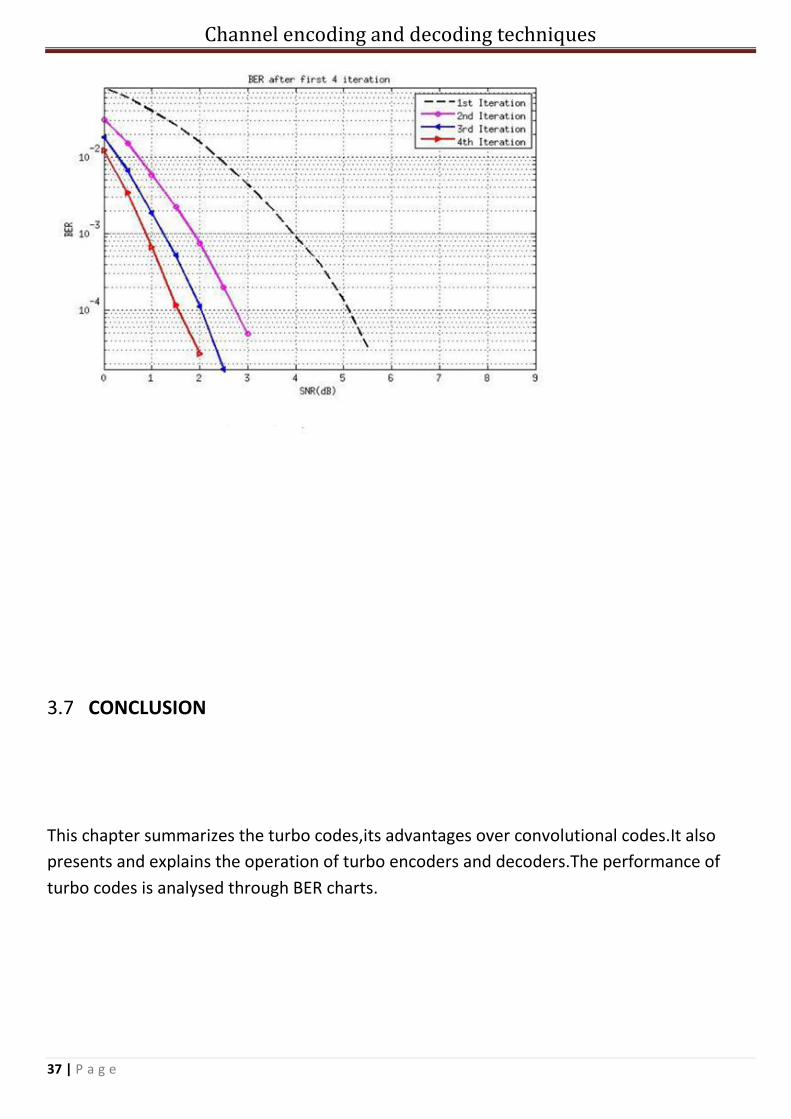
3.6 Simulation results of Turbo decoder

Channel encoding and decoding techniques
36 | P a g e
Channel encoding and decoding techniques
37 | P a g e
3.7 CONCLUSION
This chapter summarizes the turbo codes,its advantages over convolutional codes.It also
presents and explains the operation of turbo encoders and decoders.The performance of
turbo codes is analysed through BER charts.

Channel encoding and decoding techniques
38 | P a g e
CHAPTER 4
EXIT CHARTS FOR TURBO CODES
Channel encoding and decoding techniques
39 | P a g e
4.1 MOTIVATION AND INTRODUCTION
4.2 Construction of Exit charts
The ingredients which we need for the construction of EXIT charts are:
Channel encoding and decoding techniques
40 | P a g e
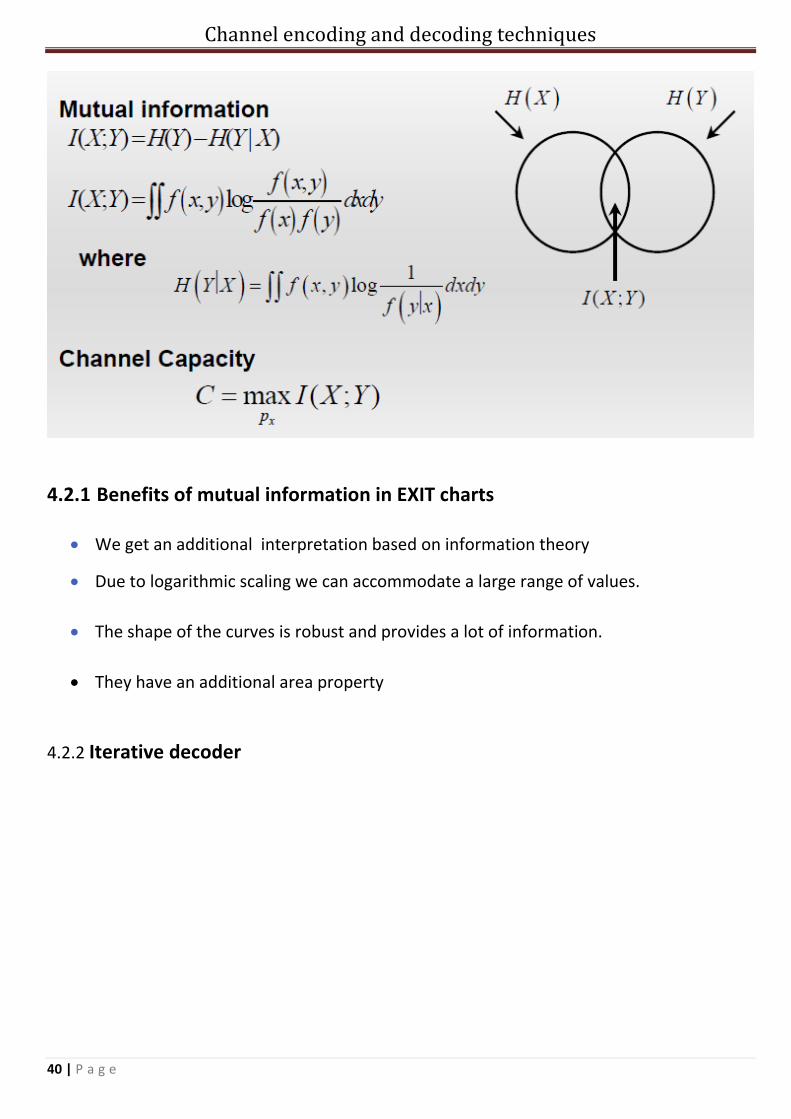
4.2.1 Benefits of mutual information in EXIT charts
We get an additional interpretation based on information theory
Due to logarithmic scaling we can accommodate a large range of values.
The shape of the curves is robust and provides a lot of information.
They have an additional area property
4.2.2 Iterative decoder
Channel encoding and decoding techniques
41 | P a g e
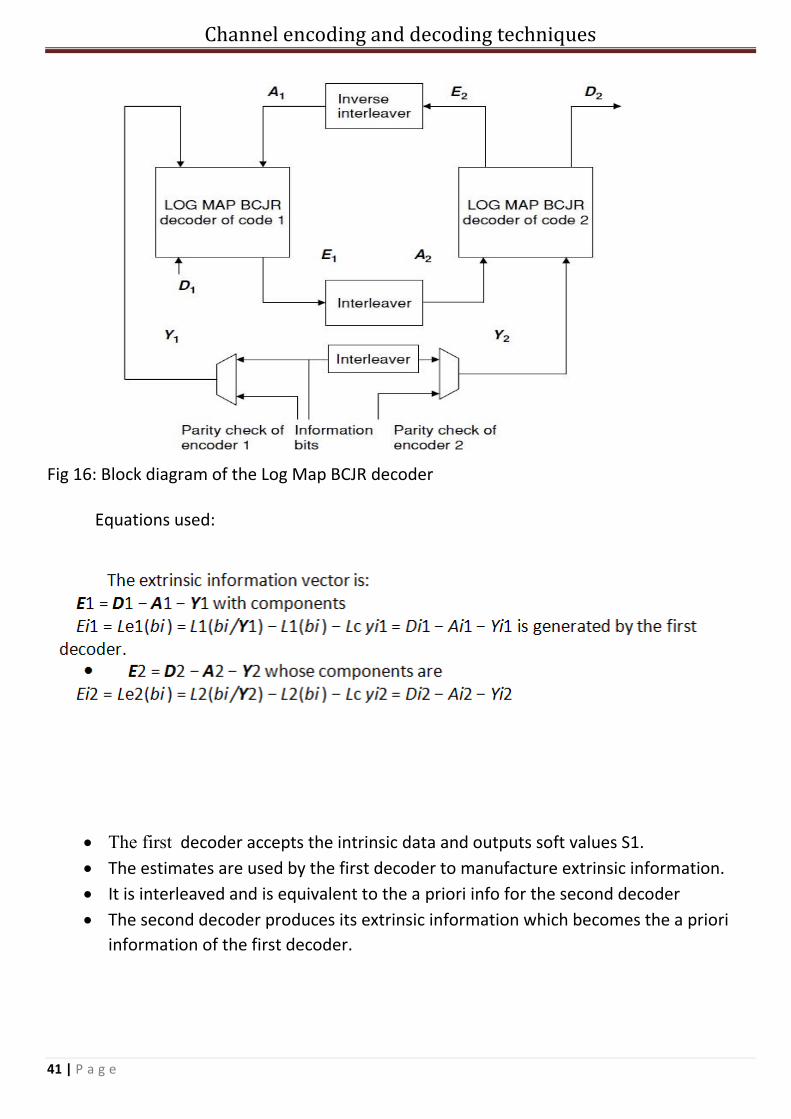
Fig 16: Block diagram of the Log Map BCJR decoder
Equations used:
The first decoder accepts the intrinsic data and outputs soft values S1.
The estimates are used by the first decoder to manufacture extrinsic information.
It is interleaved and is equivalent to the a priori info for the second decoder
The second decoder produces its extrinsic information which becomes the a priori
information of the first decoder.
Channel encoding and decoding techniques
42 | P a g e
4.2.3 Regions of the BER Curve
BER performance curve of a turbo code basically has 3 regions:
• In the 1st region (low values of SNR) the performance of the iterative
decoding is less as compared to the uncoded one which doesn’t even
improve by taking a large no. of iterations.
• In the 2nd region at (middle values of SNR), iterative decoding has an
excellent performance. The performance increases in this so called waterfall
region.
In the 3rd region ( high values of SNR),the rate of performance increment
decreases with SNR.
4.2.4 Transfer characteristics
Extrinsic and a priori information is traded by the iterative decoders.
(E1 becomes A2 and E2 becomes A1)
Mutual information help in tracing the messages ( I(LE;X),I(LA;X) )
Many factors influence the transfer characteristics (for eg.no. of code
memory of code, different polynomials of code etc.)
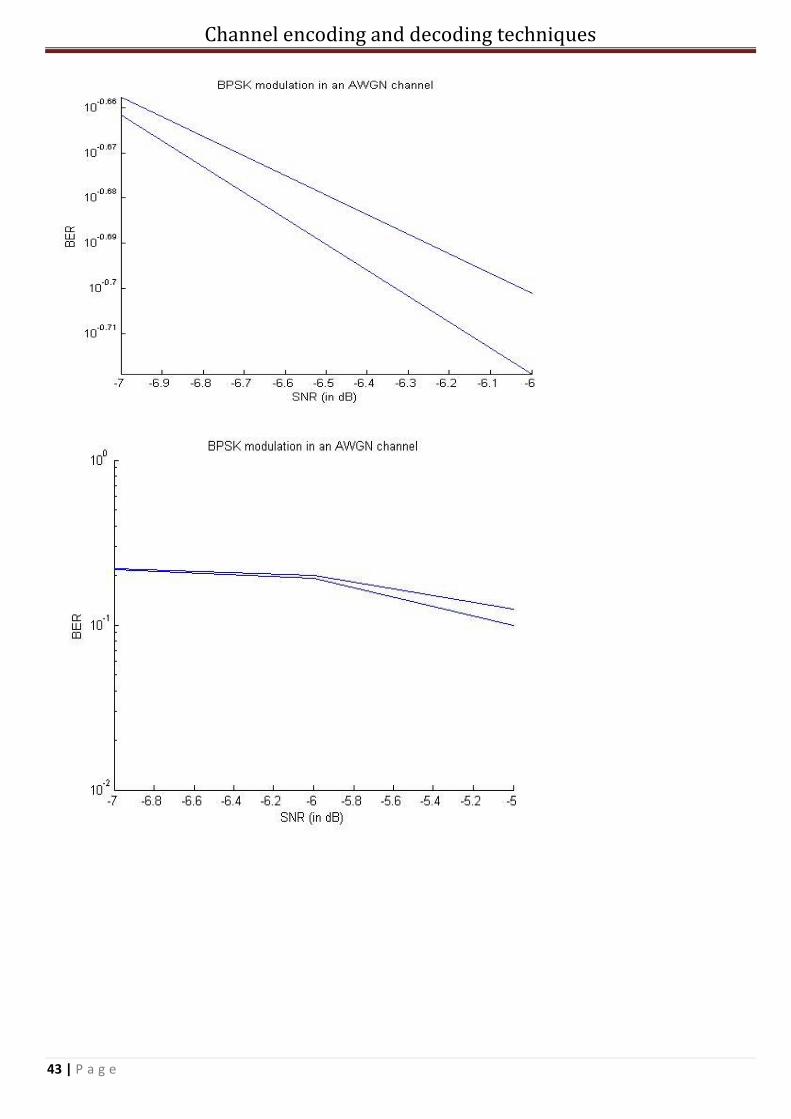
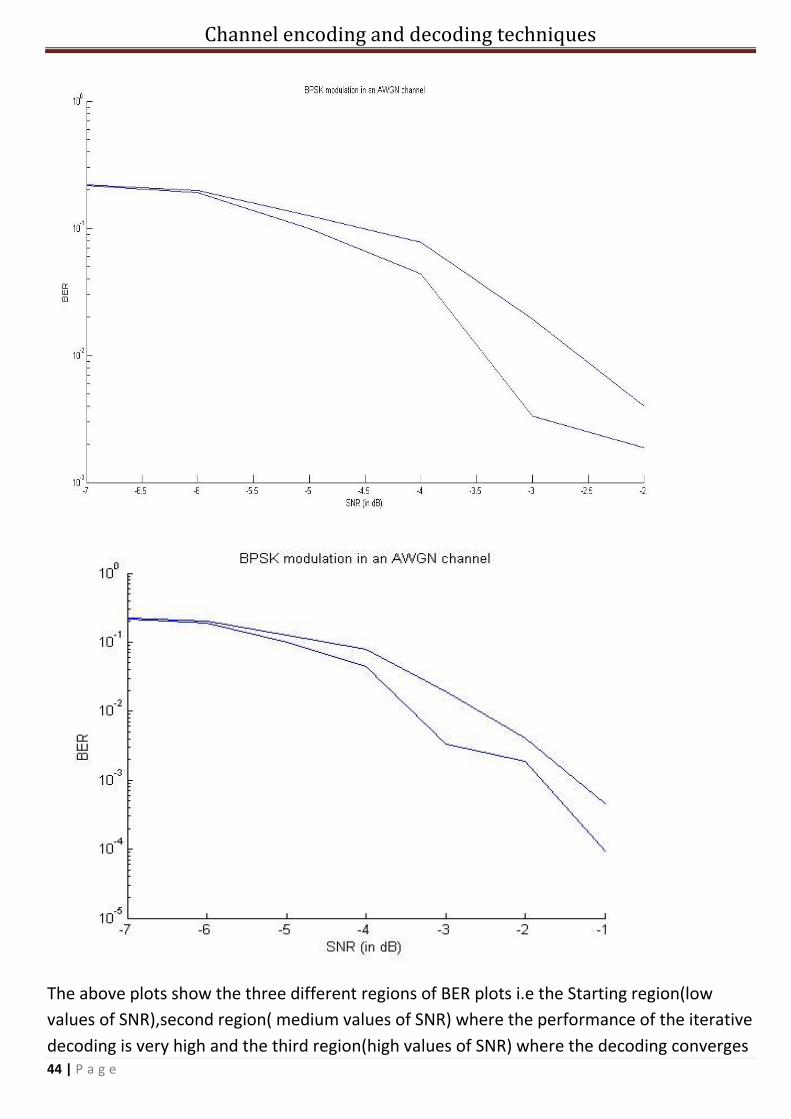
4.2.5 Simulation results
The simulation results compare the BER plots for turbo code and EXIT chart plots
of turbo code.
Channel encoding and decoding techniques
43 | P a g e
Channel encoding and decoding techniques
44 | P a g e
The above plots show the three different regions of BER plots i.e the Starting region(low
values of SNR),second region( medium values of SNR) where the performance of the iterative
decoding is very high and the third region(high values of SNR) where the decoding converges
Channel encoding and decoding techniques
45 | P a g e
in few iterations. The plots show these properties for different ranges of SNR.
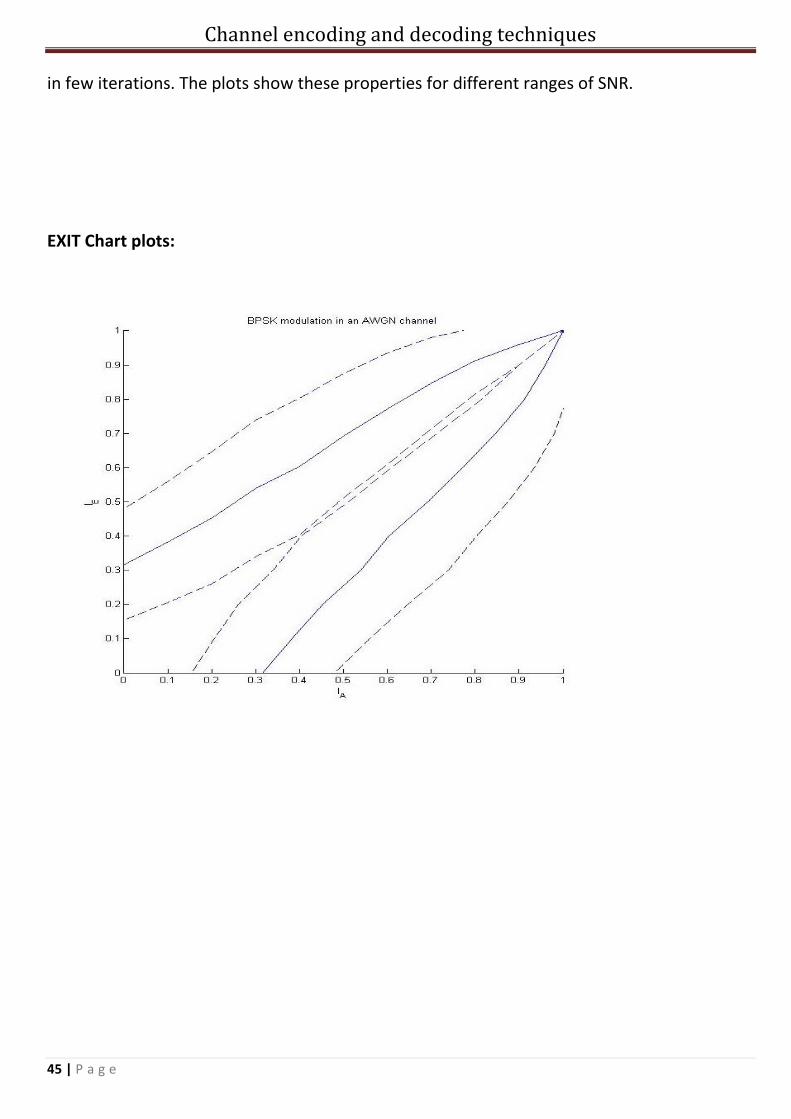
EXIT Chart plots:

Channel encoding and decoding techniques
46 | P a g e
Plot of EXIT charts for different SNRs
Plot of EXIT charts for different SNRs
Channel encoding and decoding techniques
47 | P a g e
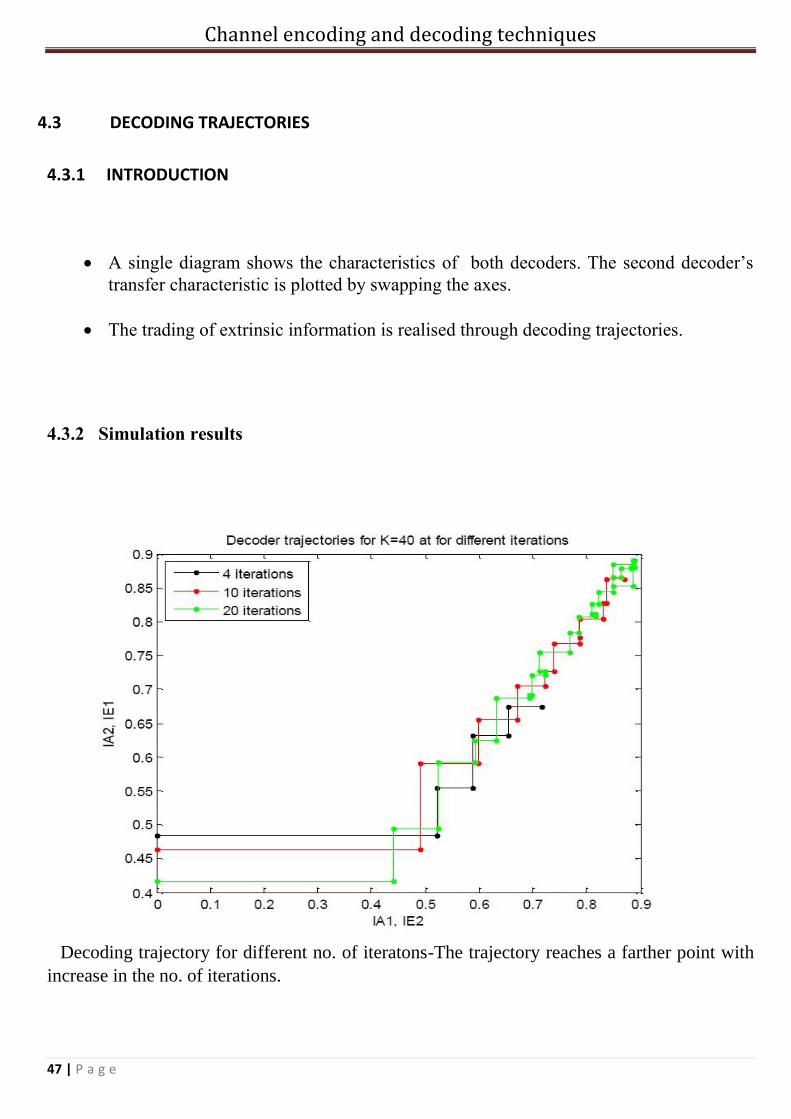
4.3 DECODING TRAJECTORIES
4.3.1 INTRODUCTION
A single diagram shows the characteristics of both decoders. The second decoder’s
transfer characteristic is plotted by swapping the axes.
The trading of extrinsic information is realised through decoding trajectories.
4.3.2 Simulation results
Decoding trajectory for different no. of iteratons-The trajectory reaches a farther point with
increase in the no. of iterations.
Channel encoding and decoding techniques
48 | P a g e
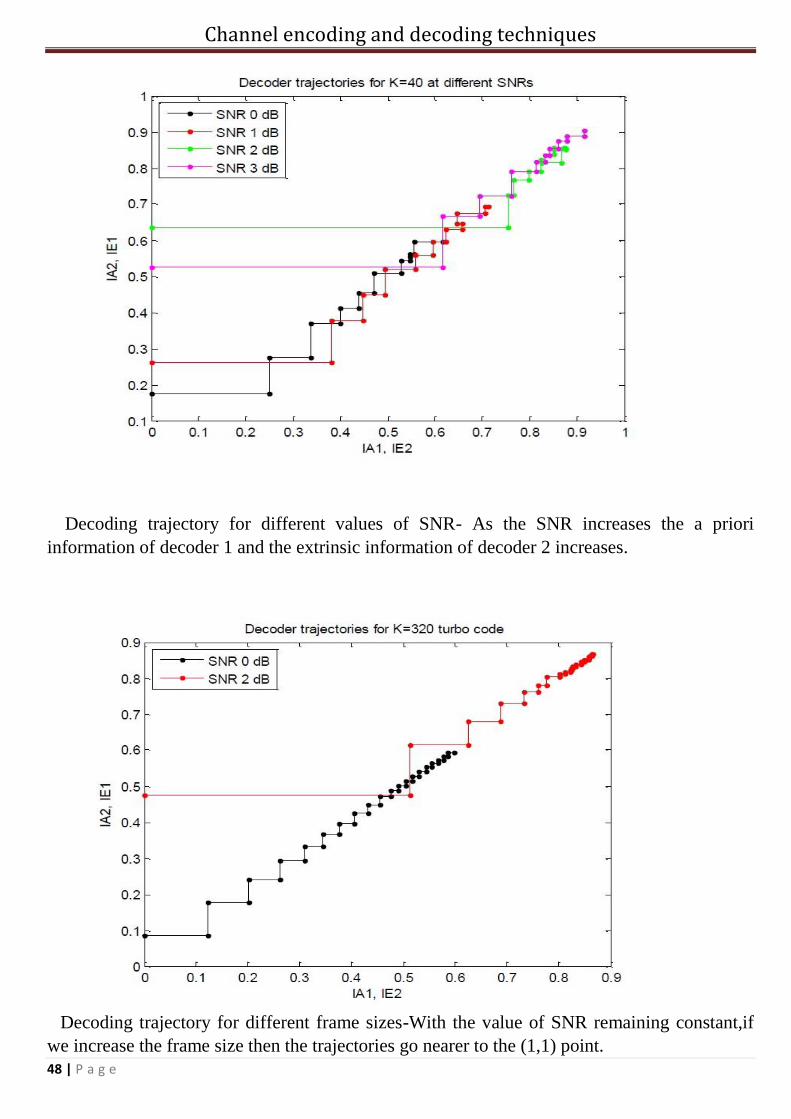
Decoding trajectory for different values of SNR- As the SNR increases the a priori
information of decoder 1 and the extrinsic information of decoder 2 increases.
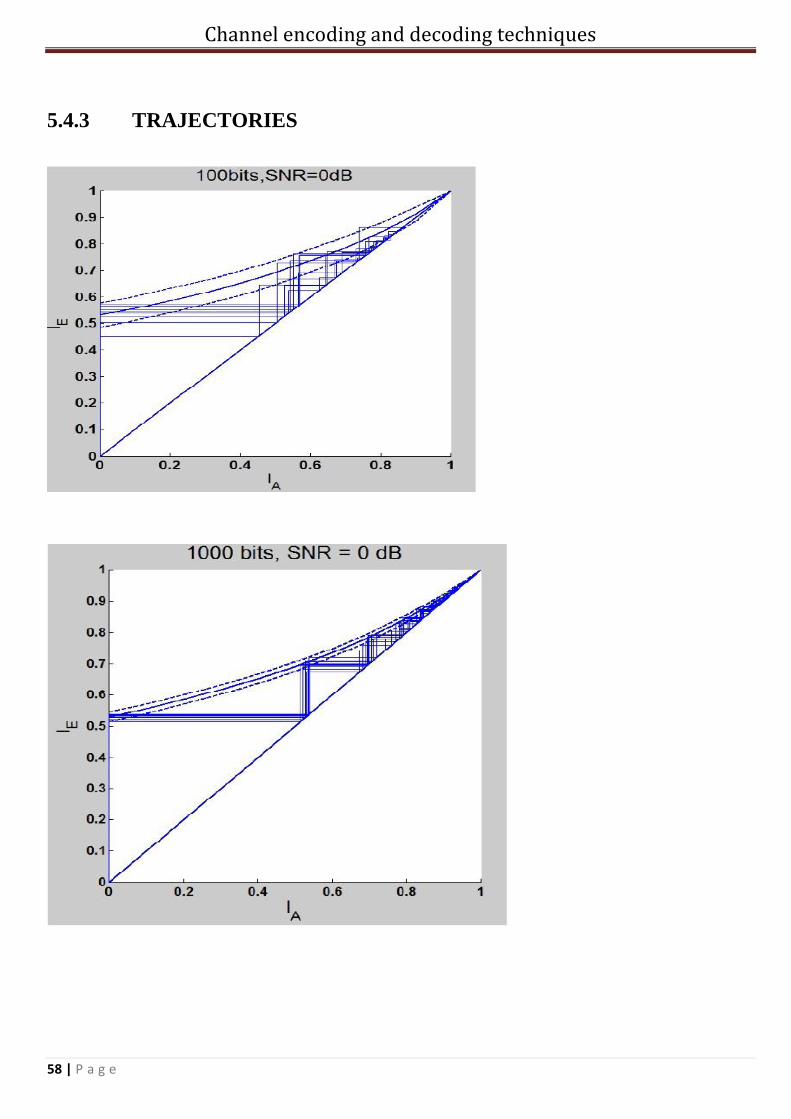
Decoding trajectory for different frame sizes-With the value of SNR remaining constant,if
we increase the frame size then the trajectories go nearer to the (1,1) point.
Channel encoding and decoding techniques
49 | P a g e
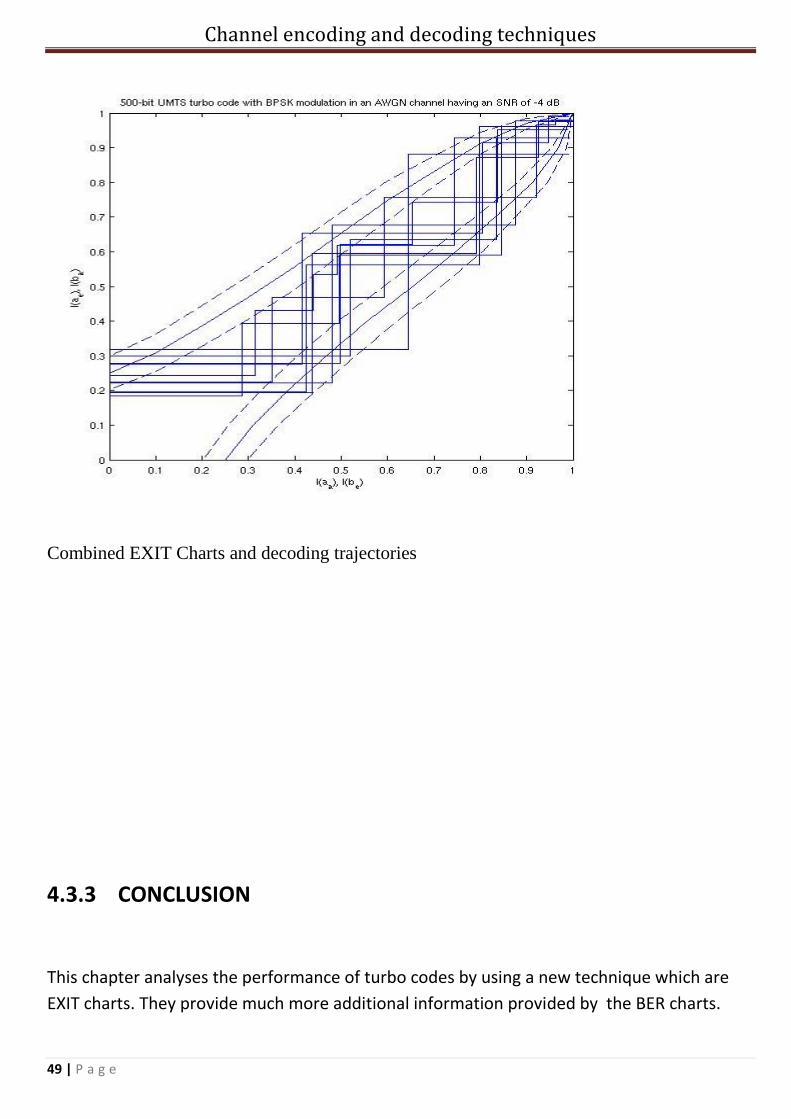
Combined EXIT Charts and decoding trajectories
4.3.3 CONCLUSION
This chapter analyses the performance of turbo codes by using a new technique which are
EXIT charts. They provide much more additional information provided by the BER charts.

Channel encoding and decoding techniques
50 | P a g e
CHAPTER 5
REPEAT ACCUMULATE CODES
Channel encoding and decoding techniques
51 | P a g e
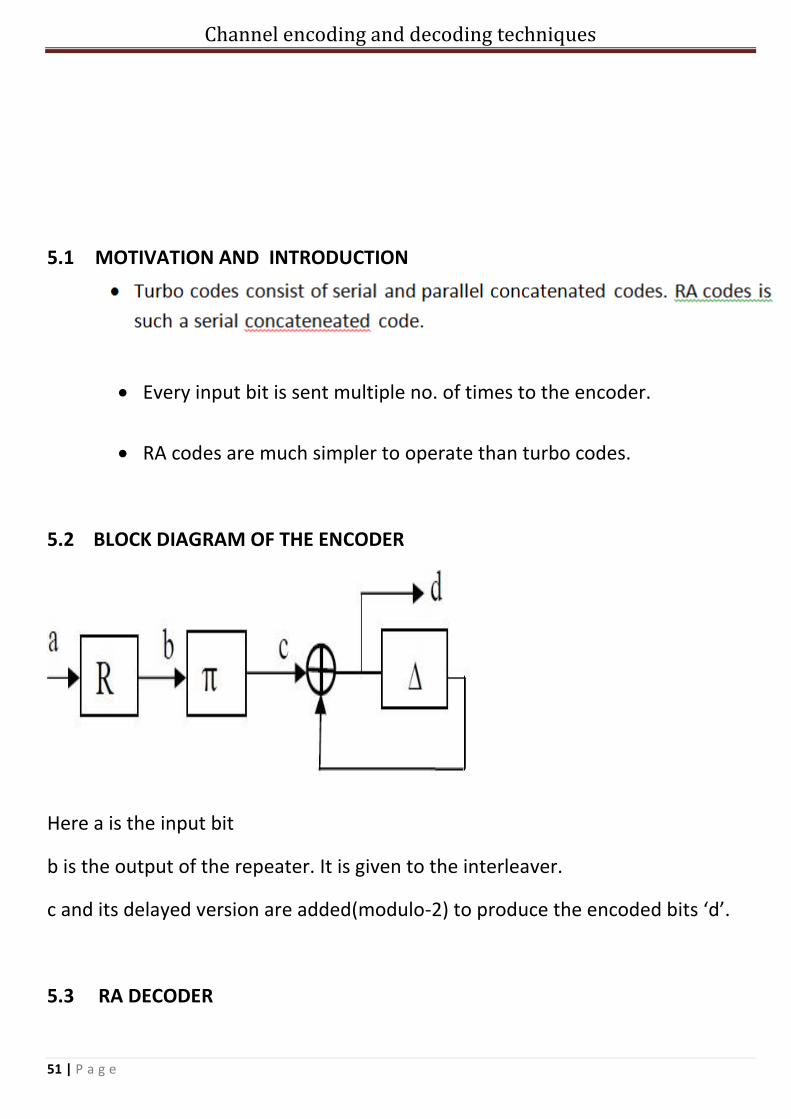
5.1 MOTIVATION AND INTRODUCTION
Every input bit is sent multiple no. of times to the encoder.
RA codes are much simpler to operate than turbo codes.
5.2 BLOCK DIAGRAM OF THE ENCODER
Here a is the input bit
b is the output of the repeater. It is given to the interleaver.
c and its delayed version are added(modulo-2) to produce the encoded bits ‘d’.
5.3 RA DECODER
Channel encoding and decoding techniques
52 | P a g e
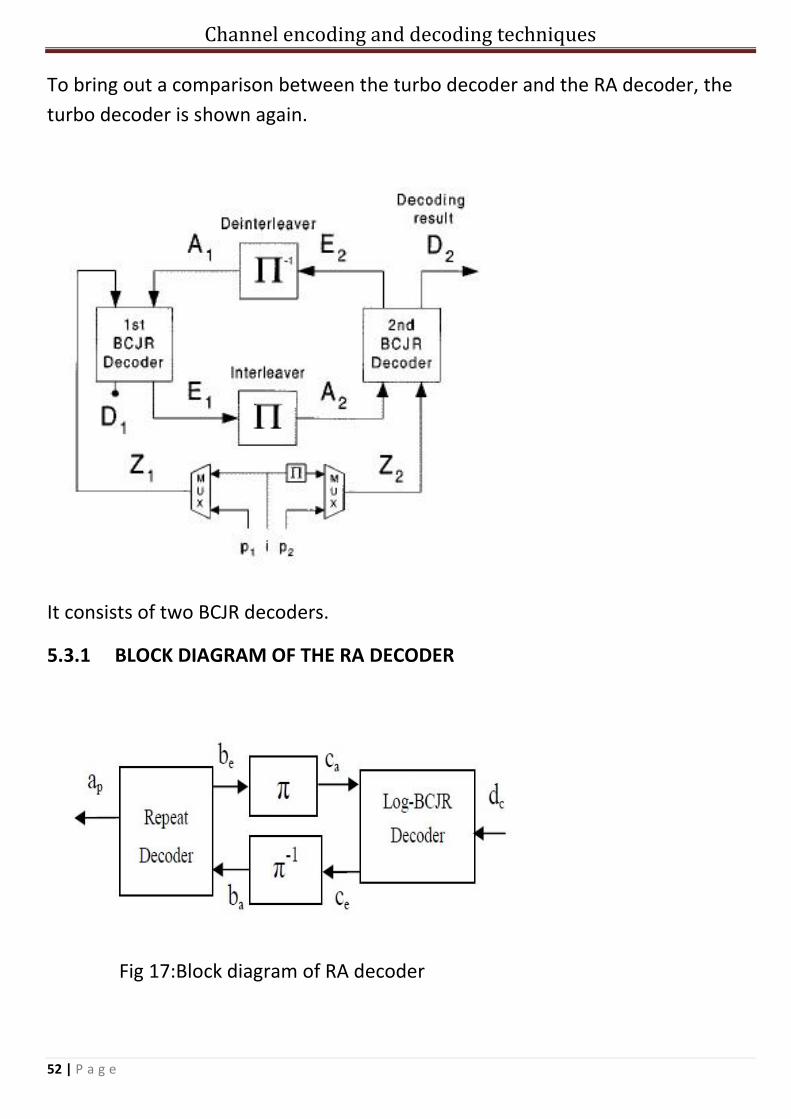
To bring out a comparison between the turbo decoder and the RA decoder, the
turbo decoder is shown again.
It consists of two BCJR decoders.
5.3.1 BLOCK DIAGRAM OF THE RA DECODER
Fig 17:Block diagram of RA decoder
Channel encoding and decoding techniques
53 | P a g e
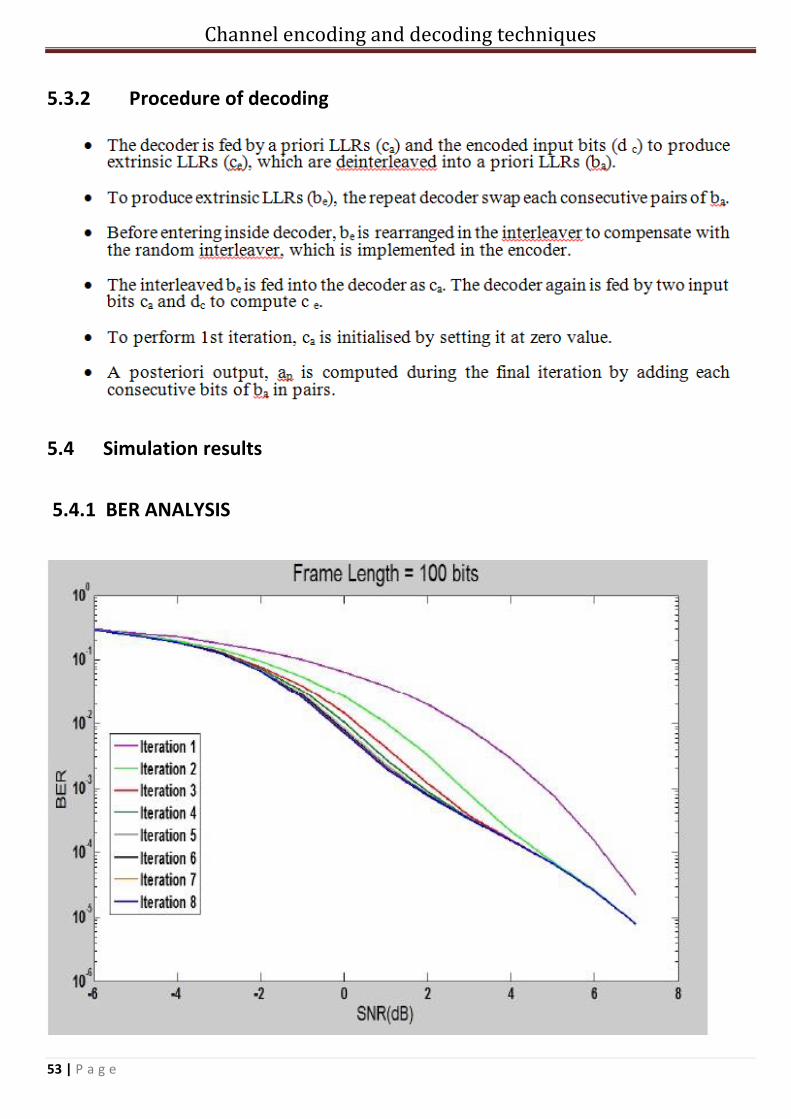
5.3.2 Procedure of decoding
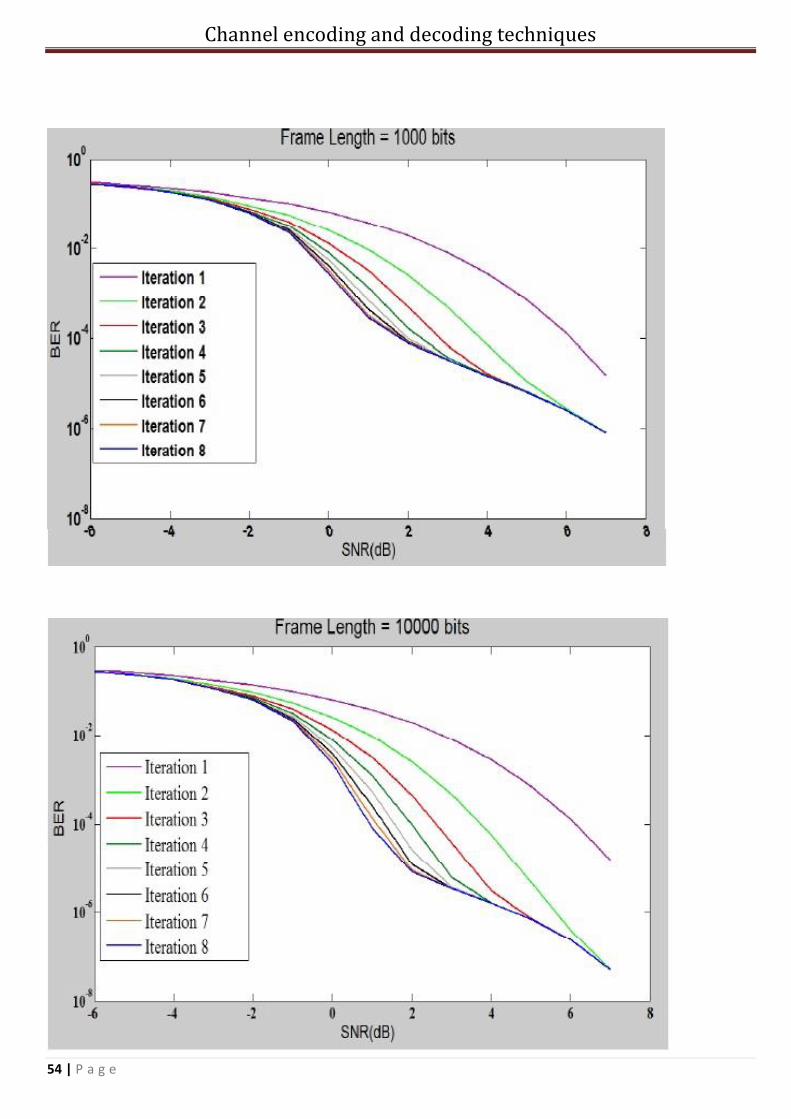
5.4 Simulation results 5.4.1 BER ANALYSIS
Channel encoding and decoding techniques
54 | P a g e

Channel encoding and decoding techniques
55 | P a g e
As the no. of iterations increases the slope of the turbo cliff region increases.
The best BER performance is given by the eighth iteration when the frame length is 10,000 bits.
The performance of the BER curve doesn’t change much with an increase in the no. of iterations.
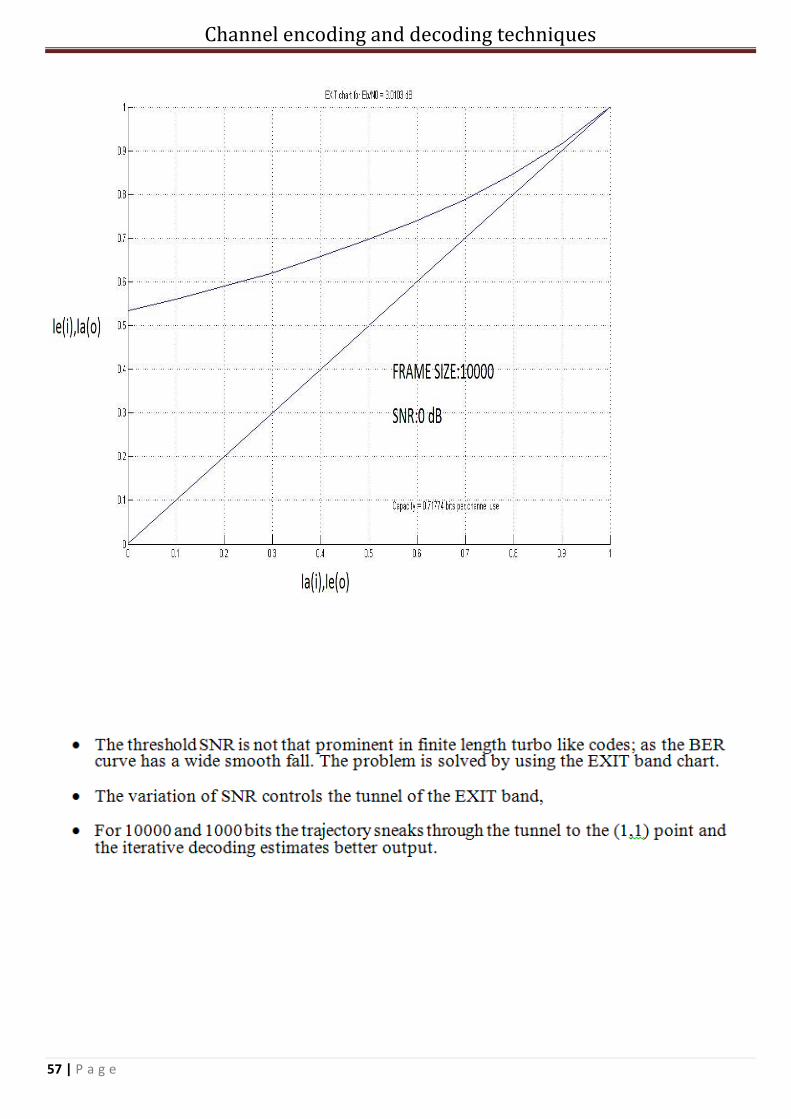
5.4.2 EXIT CHART ANALYSIS

Channel encoding and decoding techniques
56 | P a g e
Channel encoding and decoding techniques
57 | P a g e
Channel encoding and decoding techniques
58 | P a g e
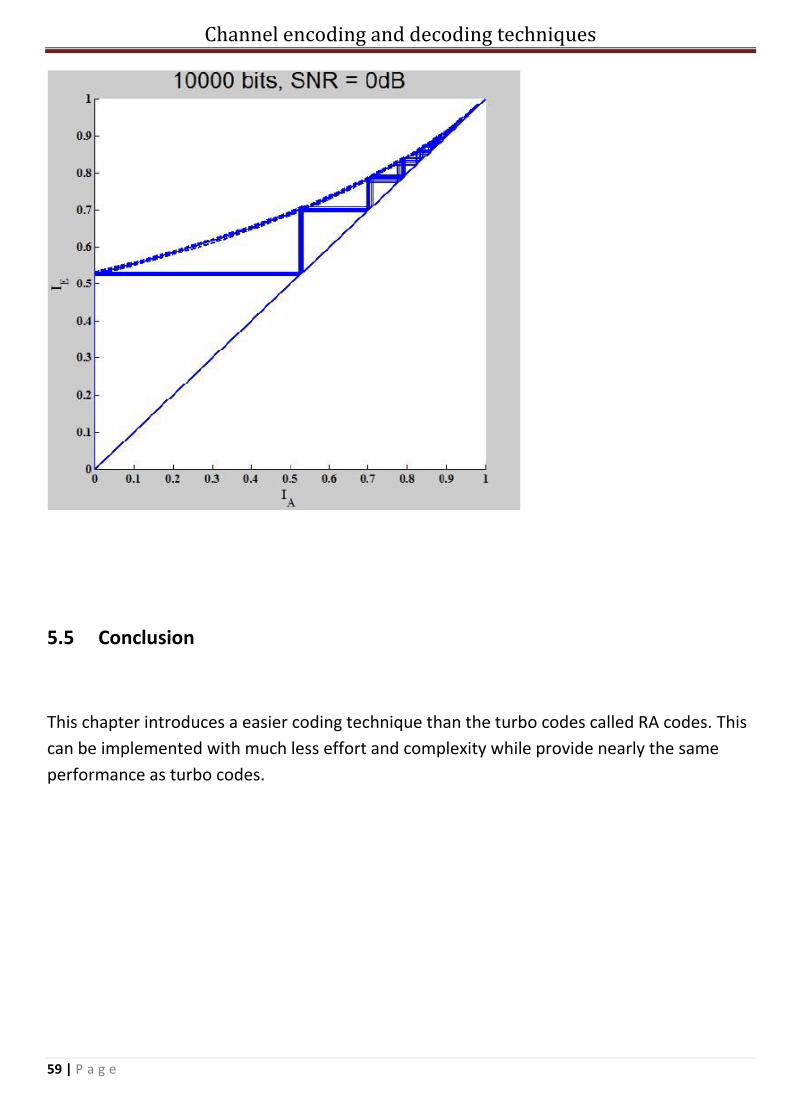
5.4.3 TRAJECTORIES
Channel encoding and decoding techniques
59 | P a g e
5.5 Conclusion
This chapter introduces a easier coding technique than the turbo codes called RA codes. This
can be implemented with much less effort and complexity while provide nearly the same
performance as turbo codes.
Channel encoding and decoding techniques
60 | P a g e
CONCLUSION
By examining the thesis we can find different methods of channel encoding and decoding
methods.The methods discussed here are:
1.Convolutional coding and decoding 2.Turbo coding and decoding
3.Analysis of Turbo codes through EXIT Charts 4.Repeat Accumulate Codes
Convolutional codes showed better performance than the block codes. Turbo codes were an
improvement of the Convolutional codes. The depth of the analysis of Turbo codes was
increased through EXIT Charts.
Due to high degree of complexity of Turbo decoders, Repeat Accumulate codes were
developed which showed nearly the same performance but decreasing the complexity
hugely.
FUTURE WORK
Channel encoding and decoding techniques
61 | P a g e
REFERENCES
G. Forney, “Maximum-likelihood estimation of digital sequences in the presence of
intersymbol interference,” IEEE Trans. Inf. Theory.
L. Bahl, J. Cocke, F. Jelinek, and J. Raviv, “Optimal decoding of linear codes for
minimizing symbol error rate,” IEEE Trans. Inf. Theory
J. Proakis, Digital Communications,
Mohammed El-Hajjar and Lajos Hanzo, “EXIT Charts for System Design and Analysis”,
IEEE Communications Surveys & Tutorials, Vol. 16, no. 1, First quarter 2014
Stephan ten Brink, “Convergence behavior of iteratively decoded parallel concatenated
codes”, IEEE Transactions on Communications, vol. 49, Oct. 2001.
Jorge Castiñeira Moreira,Patrick Guy Farrell,” ESSENTIALS OF ERROR-CONTROL
CODING”, Copyright C @2006 ,John Wiley & Sons Ltd
http://users.ecs.soton.ac.uk/
Sahay Shamsey,” EXIT Chart Analysis of Repeat Accumulate Codes for Log-BCJR
Algorithm in Iterative Decoding”, University of Southampton, ©2013 IEEE
Mohammed El-Hajjar and Lajos Hanzo, “EXIT Charts for System Design and Analysis”,
IEEE Communications Surveys & Tutorials, Vol. 16, no. 1, First quarter 2014
Stephan ten Brink, “Convergence behavior of iteratively decoded parallel concatenated
codes”, IEEE Transactions on Communications, vol. 49, Oct. 2001.