channel change and sediment transport in two desert ... · pdf filechannel change and sediment...
TRANSCRIPT

Channel Change and Sediment Transport in Two Desert Streams in Central Arizona, 1991-92By JOHN T.C. PARKER
U.S. GEOLOGICAL SURVEYWater-Resources Investigations Report 95 4059
Prepared in cooperation with the FLOOD CONTROL DISTRICT
OF MARICOPA COUNTY
Tucson, Arizona 1995

U.S. DEPARTMENT OF THE INTERIOR BRUCE BABBITT, Secretary
U.S. GEOLOGICAL SURVEY Gordon P. Eaton, Director
For additional information Copies of this report can be write to: purchased from:
District Chief U.S. Geological SurveyU.S. Geological Survey Open-File SectionWater Resources Division Box 25286, MS 517375 South Euclid Avenue Denver Federal CenterTucson, AZ 85719-6644 Denver, CO 80225

CONTENTS
PageAbstract ........................................................................................................................................................... 1Introduction........................................................................................................................................................ 2
Scope of study and purpose of report........................................................................................................ 2Description of study sites.......................................................................................................................... 4
Salt River........................................................................................................................................... 4Hassayampa River............................................................................................................................. 6
Flows of 1992............................................................................................................................................ 8Methods of sediment and channel-change data collection........................................................................ 9
Channel change.................................................................................................................................................. 12Salt River................................................................................................................................................... 12Hassayampa River... .................................................................................................................................. 13
Sediment transport............................................................................................................................................. 26Salt River.................................................................................................................................................. 26Hassayampa River..................................................................................................................................... 30
Discussion.......................................................................................................................................................... 33Summary and conclusions................................................................................................................................. 35References cited................................................................................................................................................. 36Survey data......................................................................................................................................................... 39
FIGURES
1. Map showing location of streamflow-gaging stations and study sites, Salt and HassayampaRivers, central Arizona............................................................................................................... 3
2. Diagram showing cross-section and bed-material sampling locations on the Salt Riverbelow 16th Street, Phoenix, Arizona.......................................................................................... 4
3. Photographs showing Salt River before winter flows of 1992, Phoenix, Arizona:A. Looking upstream from the 24th Street bridge......................................................................... 5B. Looking across the channel from the left bank downstream from the
16th Street bridge.................................................................................................................. 54. Diagram showing cross-section and bed-material sampling locations
on the Hassayampa River below the Southern Pacific Railroad bridge,near ArUngton, Arizona.............................................................................................................. 6
5. Photographs showing Hassayampa River before winter flows of 1992near ArUngton, Arizona:
A. Looking downstream from the Southern Pacific Railroad bridge atthe head of the study reach................................................................................................... 7
B. Looking upstream from the old U.S. Highway 80 bridge ....................................................... 76. Cross section showing channel topography characteristic of study reach
in the Hassayampa River............................................................................................................ 87. Hydrographs of flows on the Salt River at 24th Street, Phoenix, Arizona:
A. January through April 1992...................................................................................................... 9B. August 22-31,1992.................................................................................................................. 9
8. Graph showing peak discharges from floods on the Salt River, 1966-92....................................... 109. Hydrographs of flows on the Hassayampa River near ArUngton, Arizona:
A. January 6,1992 ...................................................................................................................... 10B. February 7,1992 ...................................................................................................................... 10C. February 14,1992..................................................................................................................... 10D. August 22-23,1992.................................................................................................................. 10E. Decembers, 1992..................................................................................................................... 10
Con'onts III

FIGURES Continued Page
10-11. Graphs showing:10. Annual flood series on the Hassayampa River near Arlington, Arizona, 1961-92................. 1111. Results of repeat surveys on the Salt River below 16th Street, Phoenix, Arizona.................. 14
12. Photographs showing effects of flows on the Salt River, Phoenix, Arizona, 1992:A, Incised channel below 16th Street near cross section 1........................................................... 16B. Erosion of boulder revetment and loss of structure at storm-drain outlet below
16th Street near cross section 2........................................................................................... 16C. Gravel berms between cross sections 4 and 5 about 800 m below 16th Street bridge............ 16
13-15. Graphs showing:13. Longitudinal profiles of elevation on the Salt River through the study reach
before and after winter flows of 1992: A. Thalweg elevation............................................................................................................. 17B. Mean channel-bed elevation............................................................................................. 17
14. Discharge and gage-height relations at streamflow-gaguig stations on lowerSalt River on the basis of discharge measurements made during flows in 1992:
A. Salt River at 24th Street, Phoenix, Arizona...................................................................... 18B. Salt River at Alma School Road near Mesa, Arizona....................................................... 18
15. Results of repeat surveys of 11 cross sections on the Hassayampa River belowthe Southern Pacific Railroad bridge, near Arlington, Arizona.......................................... 19
16. Photographs showing effects of flows on the Hassayampa River near Arlington,Arizona, 1992:
A. Looking downstream at streambank just below cross section 2after the flow of January 6,1992.......................................................................................... 23
B. Bank erosion after the flow of February 7,1992...................................................................... 23C. Looking upstream at low terrace near cross section 10 before
flow on February 7,1992...................................................................................................... 24D. Low terrace along right side of channel after the flow on
February 7,1992................................................................................................................... 2417-21. Graphs showing:
17. Longitudinal profiles of elevation on the Hassayampa River through the studyreach before and after winter flows of 1992:
A. Thalweg elevation............................................................................................................. 25B. Mean channel-bed elevation............................................................................................. 25
18. Relation of suspended-sediment concentration to time and discharge on theSalt River, Phoenix, Arizona, winter 1992.......................................................................... 26
19. Sediment-transport data, Salt River and other rivers in Arizonacontrolled by dams:
A. Relation of suspended-sediment concentration to discharge............................................ 27B. Comparison of suspended-sediment concentrations and discharge relations
on the Salt River with relations for other controlled rivers in Arizona......................... 2720. Particle-size data, Salt River in Arizona:
A. Particle-size distribution of suspended-sediment and sand-sized bed-materialsamples.......................................................................................................................... 29
B. Particle-size distribution of gravel-sized bed-material samples....................................... 2921. Relation of suspended-sediment concentration to time and discharge,
Hassayampa River near Arlington, Arizona: A. February 7,1992............................................................................................................... 30B. February 14,1992............................................................................................................. 30C. August 23,1992................................................................................................................ 30
IV Contents

FIGURES Continued Page
22-23. Graphs showing:22. Sediment-transport data on the Hassyampa River and other rivers in Arizona:
A. Relation of suspended-sediment concentration to discharge............................................ 31B. Comparison of suspended-sediment concentrations and discharge relations
on the Hassayampa River with relations for other uncontrolled rivers in Arizona...................................................................................................................... 31
23. Particle-size distribution of bed-material samples from the HassayampaRiver below the Southern Pacific Railroad bridge, near Arlington, Arizona...................... 32
TABLES
1. Characteristics of continuous winter flows and a summer flow eventon the Salt River at 24th Street, Phoenix, Arizona, 1992........................................................... 9
2. Characteristics of periods of runoff on the Hassayampa River below the SouthernPacific Railroad bridge, near Arlington, Arizona, 1992............................................................. 11
CONVERSION FACTORS
Multiply
millimeter (mm)
meter (m)
kilometer (km)
square kilometer (km2)
cubic meter per second (m3/s)
By
0.3937
3.281
0.6214
0.3861
35.3107
To obtain
inch
foot
mile
square mile
cubic foot per secxnd
ABBREVIATED WATER-QUALITY UNITS
Chemical concentration and water temperature are given only in metric units. Chemical concentration in water is given in milligrams per liter (mg/L) or micrograms per liter (|J.g/L). Milligrams per liter is a unit expressing the so'ute mass per unit volume (liter) of water. One thousand micrograms per liter is equivalent to 1 milligram per liter. For concentrations less than 7,000 milligrams per liter, the numerical value is about the same as for concentrations in parts per million (ppm).
VERTICAL DATUM
Sea level: In this report, "sea level" refers to the National Geodetic Vertical Datum of 1929 A geodetic datun derived from a general adjustment of the first-order level nets of the United States and Canada, formerly called "5"ea Level Datum of 1929."
Consents V

Channel Change and Sediment Transport in Twc Desert Streams in Central Arizona, 1991-92
SyJohnT.C. Parker
Abstract
Channel change and suspended-sediment transport were monitored in the Salt and Hassayampa Rivers in Maricopa County, Arizona, during the winter and summer rainy seasons of 1991-92. Rows were moderate. Results illustrate the high instability of these channels and high variability of process and response.
A channelized, gravel-paved reach of the Salt River in an industrial part of Phoenix was incised 2 meters by sustained winter flows from upstream reservoir releases that had a peak discharge of 368 cubic meters per second. Similar amounts of channel incision occurred at bridge crossings at four other locations within 20 kilometers upstream from the study reach at 16th Street. Channel incision changed the stage-discharge relation at the streamflow-gaging station at 24th Street. Bank erosion below 16th Street undermined bank revetment and caused a large concrete-drop structure at the mouth of a storm drain to fall into the channel. About 23 kilometers upstream from the study area, bank erosion on the Salt River exhumed a landfill that resulted in entrainment and transport of refuse. The flows, which lasted 5 months beginning in early January, produced the highest peak discharge in 9 years on the normally dry lower Salt River. Tl n. flows were minor, however, compared to peak discharges that occurred during a series of floois from 1966 to 1980. The flood of 1980 that had a peak discharge of 5,100 cubic meters per second was the largest since 1905. In August 1992, several days of flows from reservoir releases produced a higher peak discharge of 493 cubic meters per second that resulted in little or no channel change.
On a sandy, ephemeral reach of the Hassayampa River in rural Maricopa County west of Phoenix, as much as 20 meters of bank erosion resulted from three flows of short duration and low-to-moderate peak discharge. Most bank erosion resulted from a winter flow that lasted about 7 hours, had a peak discharge of 127 cubic meters per second, and an estimated recurrence interval of less than 5 years. A summer flow that lasted 3 hours had a peak discharge of 173 cubic meters per second and caused some bank erosion and possibly some dissection of terraces. The magnitude of change, however, was far less than that of the winter flow.
Suspended-sediment concentration on the Salt River during the winter flows was typical of those for other regulated streams in Arizona and ranged from 2 to 617 milligrams per liter at discharges from 6.7 to 343 cubic meters per second. Fine-grained sediments in the channel bottom probably were the main source of sediment transported in suspension. During periods of prolonged, steady flows, suspended-sediment concentration tended to decline, which ind: cated a probable depletion of sediment supply.
On the Hassayampa River, suspended-sediment concentrations ranged from 12,800 to 132,000 milligrams per liter at discharges of 13 to 128 cubic meters per second. The relation of sediment concentration to discharge was poor for the entire set of samples, but a clear pattern was evident for each period of storm runoff. In two of three periods of runoff sampled, maximum suspended-sediment concentration occurred just before peak discharge and declined rapidly.
Abstract 1

INTRODUCTION Scope of Study and Purpose of Report
Desert streams commonly are characterized by unstable channels, high sediment loads, and long periods of low or no flow punctuated by brief floods that increase discharge several orders of magnitude within minutes. Unstable desert streams near urban areas or transportation networks present special problems to flood-plain managers and engineers who must delineate flood-hazard zones, regulate flood-plain activities, and design and protect structures such as bridges and culverts. Effective management is hampered by the limited knowledge of stream processes in arid regions compared with stream processes in humid regions.
A major obstacle to understanding stream processes in arid and semiarid regions is the meager data base that exists in most areas. Flow records are often fragmentary and short; sediment- transport data are scarce, and data on channel change, such as aerial photographs, generally are historical and of low resolution. The Salt and Hassayampa Rivers in Maricopa County, Arizona (fig. 1), are typical in those respects. Although the lower Salt River passes through the heavily urbanized Phoenix metropolitan area, flow records before 1989 consist only of miscellaneous direct or indirect discharge measurements of the river's few large floods. Sediment-transport data apparently were not collected before 1992. Graf (1983) con ducted a study of channel change on the lower Salt River that resulted from floods of 1966-80, but until 1992, no program of systematic measure ments of channel morphology for the purpose of monitoring channel change had been undertaken. Stream flow records exist for several sites on the Hassayampa River, beginning as early as 1938, but no sediment-transport or channel-change data are known to have been collected before 1992.
The U.S. Geological Survey (USGS) in coop eration with the Flood Control District of Maricopa County began a monitoring program to investigate channel change and sediment transport on the Salt and Hassayampa Rivers at the start of the 1991-92 flood season. Characterization of channel prop erties, measurements of suspended-sediment trans port during floods, and repeated measurements of channel morphology were the main components of the program.
A study site was established on the Sa't River in Phoenix because of the urban location and the stream's economic significance to the Phoenix metropolitan area. During the 1980 flood, which was the largest of six floods during 1966-80, all but two of about 25 bridges and grade crossings on the Salt were closed by flood damage, which caused extreme disruption of the area's trans portation network (Chin and others, 1990). Extensive commercial development adjacent to the channel, sand- and gravel-mining in the channel, and many costly channel modifications, such as bank revetment and grade structures, make an understanding of processes in the Salt River especially critical. For decades at a time, the Salt River has had no significant flow in its channel (Graf, 1983). Modification of the dam at Roosevelt Lake, which is the largest upstream reservoir, reduced reservoir capacity beginning in 1991 and increased the probability that at least moderate floods would occur and would provide an opportunity for obtaining data from a monitoring program.
The Hassayampa River was chosen for study because it is the last large, uncontrolled, generally unmodified desert stream in central Arizona. The ephemeral stream, characterized by a shifting, braided to meandering sand channel, is typical of many alluvial streams in arid to semiarid regions. Except for streamflow records, data are scarce for such streams because flows are of highly variable frequency and magnitude, which makes data collection difficult. Streamflow data are of low accuracy because the unstable channels produce frequent changes in stage-discharge relations. Records at the two active USGS strennflow- gaging stations on the Hassayampa River a"? rated poor, which means that published discharges may be more than 15 percent above or below the true value (Smith and others, 1993). Althor^h the Hassayampa crossed generally undeveloped desert lands from Wickenburg to the Gila River at the time of this study, the area probably will be subjected to development pressures in the coming decades because of its proximity to the Phoenix metropolitan area. Identification and understand ing of processes on the Hassayampa Rive" would aid flood-plain managers and engineers in
2 Channel Change and Sediment Transport in Two Desert Streams in Central Arizona, 1991-92

112°45' 112°30'
^95165000
\ \3Monristown
33°15'
Base from U.S. Geological Surey digital data, 1:100,000, 1983Lambert Conformal Conic projectionStandard parallels 33° and 45°. central meridian -90°00'
10 15 MILES
095170000<
10 15 KILOMETERS
EXPLANATION
STREAMFLOW-GAGINGSTATION Number is site identifier
Site number Site location
095120600 Salt River at Alma School near Mesa095121900 Salt River at 24th Street at Phoenix095165000 Hassayampa River near Morristown095170000 Hassayampa River near Arlington
Figure 1. Location of the streamflow-gaging stations and study sites, Salt and Hassayampa Rivers, central Arizona.
Introduction 3

developing strategies for coping with the unstable channel before residential and commercial devel opment force government agencies to use expen sive structural methods of flood and erosion control.
The monitoring program at both sites origi nally was to continue for several years, but bud getary considerations forced cancellation of the program after the first year of operation. Fortunately, prolonged flow on the Salt River in winter 1992 and the occurrence of several mod erate flows in the winter and summer of 1992 on the Hassayampa River permitted collection of sediment-transport and channel-change data that allow some insight into processes on those streams. This report presents the data collected during the 1-year monitoring program and presents tentative hypotheses and conclusions about processes on the Salt and Hassayampa Rivers and the significance of those conclusions for management issues.
Description of Study Sites
Location of study sites was influenced by the presence of stream flow-gaging stations and by the
degree to which a reach was characteristic of the larger system. In both cases, the reach on which the gaging stations were located was not suitable for monitoring channel change, and monumented cross sections were installed nearby. Both streams studied in this investigation vary in morphology and hydraulic characteristics throughout their length, but the reaches studied are representative of most of the respective channels.
Salt River
On the Salt River, sediment was sampled at 24th Street in Phoenix. Drainage area at the gaging station is 34,683 km2. Monumented cross sections were established 1.6 km downstream between 16th Street and 7th Street to avoid channel disruptions from active sand-and-gravel mining (fig. 2). The channel at 24th Street is typical of urban reaches on the lower Salt River (fig. 3A). Various in-iustrial facilities, including an auto-wrecking yrrd and sand-and-gravel operations, occupy the terrace on either side of the river. The 280-meter wide channel was entrenched 6 to 8 meters be^ow the bank crests, primarily as a result of floods from 1966 to 1980 (Graf, 1983). Most of the channel
DIRECTION FLOW
D
O V
EXPLANATION
- LINE OF CROSS SECTION Number is cross-section identifier
APPROXIMATE BED-MATERIAL SAMPLING LOCATIONS
Gravel-bed channel
Channel mud Terrace
100 I
200 300 METERS
_I
Figure 2. Cross-section and bed-material sampling locations on the Salt River below 16th Street, Phoenix, Arizona.
4 Channel Change and Sediment Transport In Two Deaert Streams In Central Arizona, 1991-92

A, Looking upstream from the 24th Street bridge. Much of the channel bottom has been scraped, and gravel was pushed into piles shown at the left edge of the photograph.
6, Looking across the channel from the left bank downstream from the 16th Street bridge.
Figure 3. Salt River before winter flows of 1992, Phoenix, Arizona.
was gravel paved; however, upstream from the bridge, much of the bottom had been scraped and consisted of hardpacked fine sand and silt embedded with gravel that had been redistributed by heavy machinery. In late 1991, flow approaching the 24th Street bridge was obstructed by a 15- by 60-meter gravel pile about 3 m high that was formed from material that had been scraped from the channel bottom (fig. 3A). In December 1991, a low-flow channel was barely incised into the cobble-paved bottom near the left side of the stream. Banks near 24th Street were
composed of a variety of materials including fill, gravel-mining spoils, boulder riprap, and natural deposits of sand and gravel.
The reach below 16th Street (fig. 3fi) is similar to that at 24th Street; however, there were no signs of active channel manipulation by mining ac tivities. The reach was channelized with boulder revetment covering each bank from 16th Street to 7th Street. The left bank was armored with angular boulders that are 0.5 to 0.75 m in diameter. The right bank was armored with bed material, apparently derived from the adjacent channel
Introduction

bottom, consisting of rounded cobbles and boulders 0.1 to 0.3 m in diameter that were anchored with a heavy wire mesh. The channel bottom was paved with gravel for about 400 m downstream from the 16th Street bridge. Farther downstream, most of the channel bottom had been scraped, and bed composition was highly variable. Bed material in the scraped areas included fine sand and silt with little or no gravel, pebble-, cobble-, and boulder-sized gravel in a fine-grained matrix, and hard-packed gravel pavement. Most of the bed material in the middle to lower part of the study reach appeared to have been redistributed by heavy machinery. Thickets of saltcedar grew on deposits of fine-grained sediments from about the middle of the reach to the 7th Street bridge. Tributary flow carrying local runoff enters the Salt River between 16th and 24th Streets, but such flow was a negligible contribution to total flow through the study reach.
Hassayampa River
On the lower Hassayampa River near Arlington, a 730-meter-long reach below the Southern Pacific Railroad bridge about 2.1 km upstream from the Old U.S. Highway 80 bridge (fig. 1) was chosen for monitoring channel change (fig. 4). The reach, which has a wide, sandy, ephemeral channel (fig. 5A), was selected for studying channel change because it was representative of the Hassayampa River between Wickenburg and the Gila River. Immediately downstream from the study reach is a channelized reach that receives irrigation-return flow and contains a base flow of 0.5 to 3.5 m3/s (fig. 5B). The channelized reach extends from about 975 m upstream to about 1,220 m downstream from the Old U.S. Highway 80 bridge on which the streamflow-gaging station was located. Drainage area at the gaging station is 3,810 km2. The base- flow channel, lined by dense vegetation through most of the reach, is shallowly incised into a wider channel enclosed by levees. Sediment-transport data were collected in this reach because the highway bridge provided the only suitable structure on which the pumping sampler could be installed; however, the reach is atypical of the Hassayampa River in general, which is mainly ephemeral and largely unchannelized. Flow at the
Survey station 2
EXPLANATION
9 LINE OF CROSS SECTIpN Number Is cross-section identifier
APPROXIMATE BED-MATER'AL SAMPLING LOCATIONS
CD Unvegetated channelA Vegetated channel
O Sandy terrace
Figure 4. Cross-section and bed-malarial sampling locations on the Hassayampa Riv^r below the Southern Pacific Railroad bridge near Arlington, Arizona.
gaging station includes irrigation-ret irn flow that enters between the study reach and the gaging station. During periods of runoff, retirn flow may contribute discharges of more ttan 6 m3/s. Therefore, actual discharges through the study
6 Channel Change and Sediment Transport In Two Desert Streams In Central Arizona, 1991-92

A, Looking downstream from the Southern Pacific Railroad bridge at the head of the study reach.
Figure 5. Hassayampa River before winter flows of 1992, Arlington, Arizona.
reach are somewhat lower than those recorded at tiie gaging station.
In the upper part of the study reach, the channel was a 45-meter-wide main channel barely incised
B, Looking upstream from the Old U.S. Highway 80 bridge.
into a wider flood channel (fig. 6) that formed a compound channel as denned by Graf (1988a). The main channel was a sandy, unvegetated zone that included the thalweg (the deepest part of the channel) and a sparsely vegetated zone along the channel margins. The high-flow channel consisted of a low, sandy, unvegetated terrace that stood above the left edge of the main channel. Above the low terrace, a vegetated terrace had abundant evidence of recent inundation including woody flood debris and overflow channels. The distinct high-flow channel terminated at about the lower third of the reach where the channel consisted only of tiie vegetated and unvegetated zones. Maximum relief across the compound channel in the upper reach was about 1.2 m; maximum relief across the channel in the lower reach was about 0.6 m. The right bank of the study reach abutted the remnants of a levee and consisted of 1 to 3 stepped terraces that were 0.5 to 1.5 m high and 15 to 75 m wide. Bank material consisted of beds of weakly cohesive medium to fine sand and silt with some gravel. The material was sufficiently cohesive to maintain a vertical bank, but the banks failed readily when subjected to slight stress. The left bank was a gently sloping earthen levee that had a crest that was 2.4-3.4 m above the channel bottom. Bank material consisted of weakly cemented fine- to-medium sand overlain by 0.15 to 0.5 m of sandy-gravelly fill.
Introduction

cr
tw mcr cc w
p5° 2
111111111
I I I I I I I240 220 200 180 160 140 120 100 80 60
HORIZONTAL DISTANCE ACROSS CHANNEL, IN METERS
Figure 6. Channel topography characteristic of study reach in the Hassayampa River.
40 20
Flows Of 1992
Flows on the lower Salt River from reservoir releases began January 6,1992, (fig. 7, table 1) and continued with a few brief interruptions until June 12, 1992. Mean daily discharge at 24th Street during that period was 54.2 m3/s; peak discharge reached 368 m3/s on February 15. A second peak of 241 m3/s was reached on March 10, and a third peak of 306 m3/s was reached on March 27. The flows of 1992 at the gaging station at 24th Street were the highest and most prolonged in the short history of the streamflow-gaging station, and the peak discharge was the highest since 1983. Flows within 15 percent of the peak discharge were sustained for about 40 hours from February 14 to February 16. Flows near the peak discharge were sustained for almost 100 hours, March 9-14, and for about 20 hours, March 27-28. Reservoir releases in August 1992 produced an even higher peak discharge of 493m3/s; however, flow duration was only for a few days, and flows within 15 percent of the peak were sustained for only 6.5 hours on August 24. Peak discharges on February 15 and August 24 were minor compared with some flood peaks of 1966-80 (fig. 8), particularly the flood of 1980 the highest flood since 1905 that had a peak discharge of 5,100 m3/s. Total volume for the flows of 1992, from January 6 to June 12, was 725,600,000 m3 .
The gaging station on the Hassayampa River near Arlington recorded five periods of storm runoff during water year 1992 (fig. 9, table 2) that were characterized by a rapid rise and fall of stage. In terms of peak discharge, all of the flows of 1992 were moderate events (fig. 10). The flows of January 6, February 14, and Decenber 8 have recurrence intervals of less than 2 y^ars, and the flows of February 7 and August 22 have recurrence intervals of less than 5 years (Garrett and Gellenbeck, 1991). All flows, except possibly that of August 22, were confined to the nain channel and did not top the vegetated ternce (fig. 6). Abundant flood debris, noted at the time of the initial survey of the study site, was s mattered over the terrace. The debris probably was deposited by the flood of March 2, 1991, that had a peak discharge of 199 m3/s (Smith and others, 1993).
Flows on the Hassayampa River are subject to substantial attentuation of peak discharge and of flow volume because of transmission losses to the permeable sandy channel bottom. Gating stations were operated simultaneously on the lower Hassayampa near Arlington and 57 km upstream near Morristown for all but 2 of the 30 years from 1961 through 1992. In that period, only nine of the annual floods (the highest discharge of the year) occurred at both stations as a result of the same event In all but two of those cases, peak discharge of the annual flood was less at the
8 Channel Change and Sediment Tranaport In Two Desert Streams In Central Arizona, 1991-92

500
22 23 24 25 26 27 28 29 30 31 JANUARY FEBRUARY MARCH APRIL AUGUST
Rgure 7. Flows on the Salt River at 24th Street, Phoenix, Arizona. A, January through April 1992. B, August 22-31,1992.
downstream station (Garrett and Gellenbeck, 1991; Boner and others, 1991, 1992; Smith and others, 1993). All of the peak discharges of the annual floods that occurred at both stations from the same event were in response to dissipating tropical cyclones in the fall months or frontal storms in the winter months rather than summer monsoonal thunderstorms (Smith, 1986). Dissipating tropical cyclones and frontal storms typically are more likely to be regional in extent than monsoonal storms (Hirschboeck, 1985; Webb and Betancourt, 1992).
Methods of Sediment and Channel- Change Data Collection
Suspended-sediment data were collected manually on the Salt River at 24th Street in Phoenix near the streamflow-gaging station using the equal-width-increment method (Edwards and Glysson, 1988). A total of 21 composite samples were collected from January 9 to March 26, 1992, at discharges that ranged from 6.7 to 343 m3/s from
Table 1 . Characteristics of flows on the S?tt River at 24th Street, Phoenix, Arizona, 1992
Discharge, In cubic maters per second1
Date
01-15-92
02-15-92
03-27-92
04-06-922
08-24-92
Instan taneous
pesk
59.8
368
306
104
493
Meandally
23.6
81.7
133
46.5
28.9
discharge, In cubicmeters
63,000,000
205,000,000
356,000,000
120,000,000
77,400,000
Flows from winter reservoir releases continued until June 12, 1992.
2Highest discharge occurred April 1,1992, during waning stages of flood that peaked on March 27,1992.
reservoir releases. Sediment concentration was determined for all samples, and particle-size distribution of the sand fraction was determined for four samples.
Introduction 9

6,000
O O LU W QC LU Q.WocLU
5,000
4,000
3,000
? 2,000LU O QC<
O 1,000
January | February | 1966 1973
March December! January March 1978 1979
February | October | 1980 1983
March | February August 1991 1992
DATE OF FLOOD PEAK
Figured. Peak discharges from floods on the Salt River, 1966-92. (Source: Flood peaks for 19f6 to 1980 are published in Graf, 1983. Flood peak of 1983 is based on miscellaneous-discharge measurement at Alma School Road and is published in White and Garrett, 1987. Flood peaks of 1991 and 1992 are based on ccntinuous-gage record at 24th Street and are published in Boner and others, 1992, and Smith and others, 1993.)
180
160
8 140LUw£120w ccH100 LU 5 O m 80
O
r 60
40
20
10 15 20 0
. c D
10 15 200 5 10 15 20 0 5 10 15 20 0
DURATION, IN HOURS
10 15 20
Figure 9. Flows on the Hassayampa River near Arlington, Arizona. A, January 6, 1992. B, February 7, 1992. C, February 14, 1992. D, August 22-23, 1992. E, December 8, 1992.
10 Channel Change and Sediment Transport In Two Desert Streams In Central Arizona, 1991-92

1,200 I I I I I I I T I I I II I T I I I I I I I I \ I I
1,000
LU O)
£ 800Q-
600
LU
O CO
O
§0 200 h
1960 1970 1960 1990
WATER YEAR
Figure 10. Annual flood series on the Hassayampa River near Arlington, Arizona, 1961-92.
On the Hassayampa River, an automated pumping sampler was programmed to collect suspended-sediment samples at ±0.152-meter changes in stage or at 1-hour intervals when stage was between 1.07 and 1.52 m. When the stage was above 1.52 m, samples were to be collected at 10.152-meter changes in stage or at 4-hour intervals. During two winter flows, 15 samples were collected, and 5 more samples were collected during a flow in August. All samples were analyzed for sediment concentration. Because of the brief duration of flows on the Hassayampa, it was not possible to collect sediment-transport data manually to calibrate the point samples collected automatically.
Bedload-transport sampling was not practical on either stream in the study. Bed material on the Salt River was sampled across two cross sections below 16th Street using a grid system to sample gravel greater than 11 mm in diameter. Gravel diameter was measured along the intermediate axis using calipers. Grab samples of finer-grained material were taken from representative deposi-
Tabie 2. Characteristics of periods of runoff on the Hassayampa River below the Southern Pacific Railroad bridge, near Arlington, Arizona, 1992
Date
01-06-92
02-07-92
02-14-92
08-22-92
12-08-921
Dura tion of flow, In hours
4.25
7.25
5.50
3.25
14.00
Discharge, In cubic meters per
second 1
Instan taneous
peak
43.9
136
29.5
173
26.4
Mean of flow period
23.3
59.2
14.7
67.4
91.18
Total flood discharge,
In cubic meters
378,000
16,000,000
291,000
789,000
429,000
'Flow for December 8,1992, was in water year 1993.
tional environments for laboratory-si^ve analysis. On the Hassayampa River, bed material was sampled across four cross sections below the railroad bridge by taking grab sample? at intervals of about 5 m. The sampling populations were
Introduction 11

classified according to sedimentation units that were identified (unvegetated main channel, vegetated main channel, sandy terrace) and the samples from each unit were composited for sieve analysis.
To monitor channel change, eight monumented cross sections were established on the Salt River below the 16th Street bridge. The cross sections and the surveying station were monumented with 1-meter lengths of iron rebar that were driven into the ground on the crests of the river banks. About 0.15 m of rebar is exposed at each cross section end point. Survey data were collected as xyz coor dinates referenced to an arbitrary horizontal and vertical datum that was established at Station 1 (fig. 2). The initial survey was completed in December 1991 immediately before sustained winter flows began. Plans to survey a ninth cross section were abandoned because of the onset of flows. Eleven cross sections and two survey stations were monumented on the Hassayampa River, xyz coordinates were referenced to an arbi trary horizontal and vertical datum established at Station 1 (fig. 4). The initial survey was completed in November. Both streams were resurveyed in June and July 1992. All values were converted to metric units for this report except the xyz coordinates in the section entitled "Survey Data" at the back of this report.
CHANNEL CHANGE
Both streams in this study showed a variable relation between channel response, sediment transport, and magnitude of discharge. Relations for the Hassayampa River are particularly variable. A 1-year monitoring program clearly is not adequate to fully describe the variability in processes, but the data collected exhibit certain patterns that reflect the processes occurring on desert channels of central Arizona and that suggest potential areas for further study.
Salt River
The monumented cross sections below 16th Street (fig. 2) were resurveyed after the 1992 flows. The most pronounced channel change is evident on
cross sections 1 and 2 (figs. 11-12). In mid-December 1991, at the time of tl <; first survey of cross section 1, which is about 8 IT downstream from the 16th Street bridge, low-flow zones were weakly denned by two gentle swales one near the midchannel and one along the left side of the channel (fig. 11). When the cross1 section was resurveyed in June 1992, a chanrel had been incised 2 m into the gravel bottom along the left side of the main channel (fig. 12A). The incised channel began about 90 m upstream from the 16th Street bridge and continued as far as cross section 3 about 450 m downstream from the bridge.
During the winter flows, the former low-flow channel near the middle of cross s^-ction 2 was buried by a gravelly fan that was as rruch as 1.2 m thick and 90 m wide. The fresh g-avel deposit forced flows against the left side of the channel. This diversion of flow caused incision and lateral erosion that led to failure of riprap on the main channel banks and the loss of a concrete-drop structure at the mouth of a storm-drain outlet (fig. 125). The only other location where lateral erosion was known to have sigr'ficant con sequences was upstream from the city of Mesa where a landfill was exposed by tank erosioa Refuse from the landfill was entrained by streamflow and transported downstream through the Phoenix area (Yozwiak, 1992).
At the remaining cross sections, channel change was minor. At cross section 3, the low-flow channel that formed during the winter is shallow but still distinct. Instead of incising into the pre- 1992 channel bottom, however, fre low-flow channel formed in alluvium deposited earlier during the 1992 flows (fig. 11). S^nd deposits blanketed much of cross sections 3 and 4. As much as 1 m of fine sand and silt was deposited in a saltcedar thicket between the middle of the channel and the right bank. Some of the sand deposits were eroded following deposition. The significance of the deposits for long-term channel change is not clear. Deposition of the sediments may be the beginning of a trend of long-term aggradation or may be only short-term storage of sediment that soon will be transported from the reach. Almost no measurable change occurred at c~oss sections 5-8 (fig. 12Q.
12 Channel Change and Sediment Tranaport In Two Desert Streams In Central Arizona, 1991-92
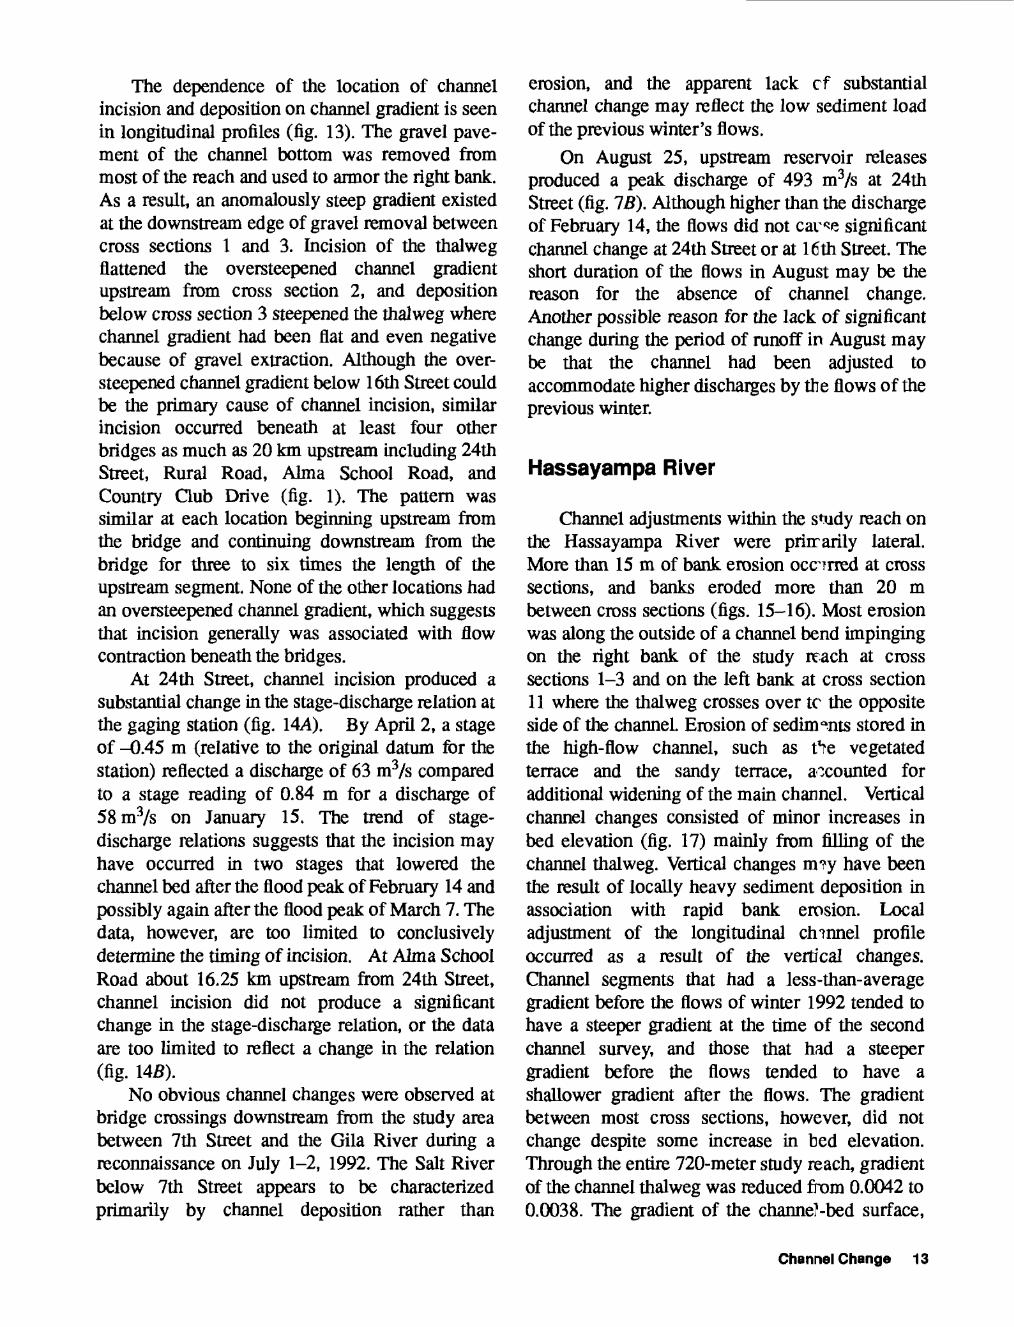
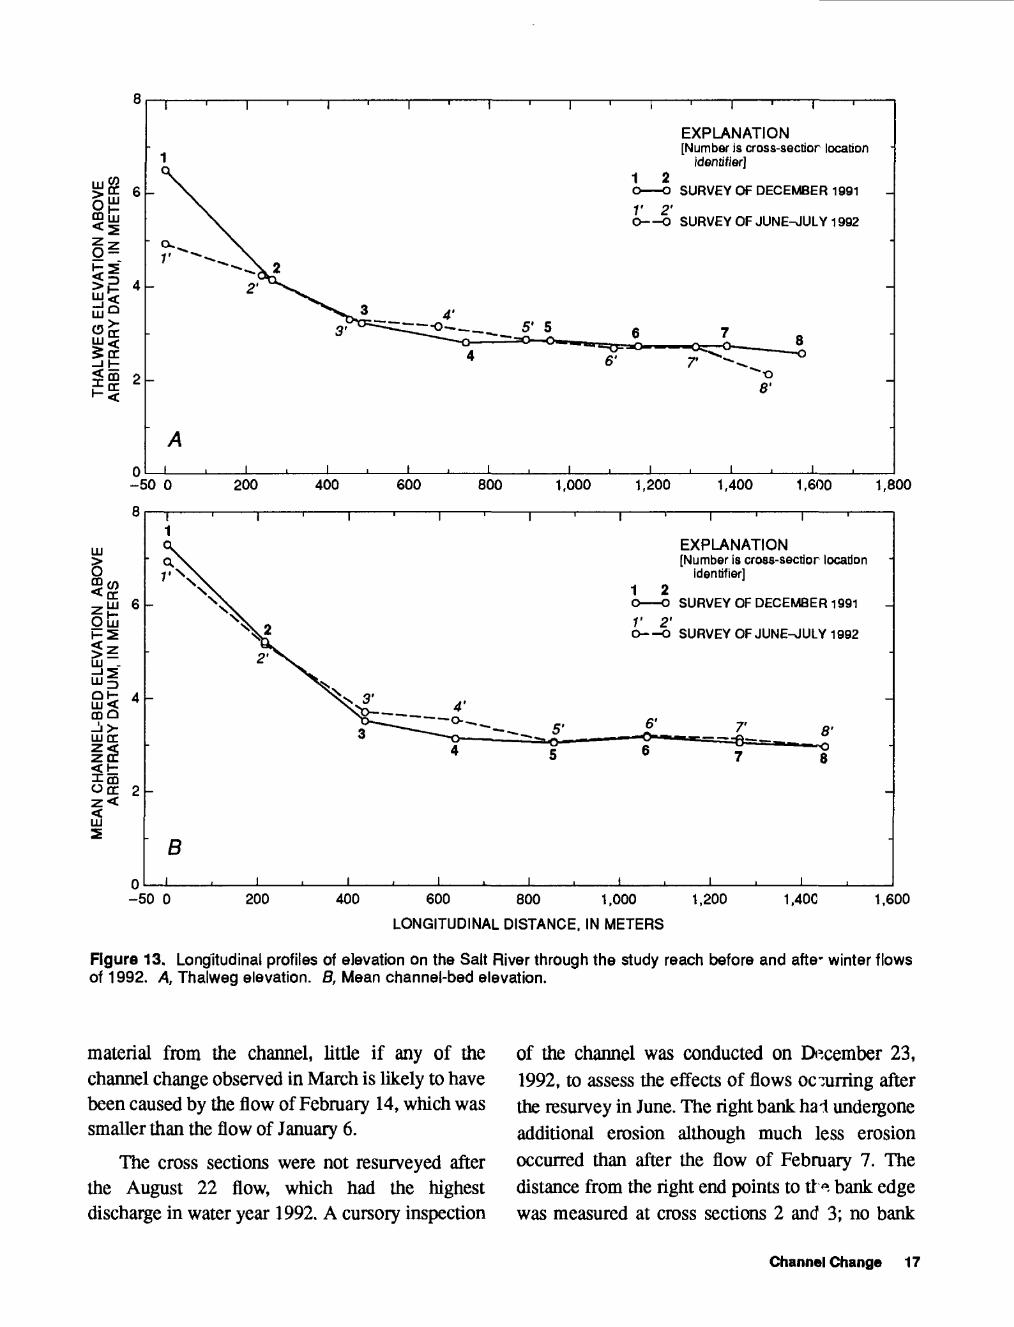
The dependence of the location of channel incision and deposition on channel gradient is seen in longitudinal profiles (fig. 13). The gravel pave ment of the channel bottom was removed from most of the reach and used to armor the right bank. As a result, an anomalously steep gradient existed at the downstream edge of gravel removal between cross sections 1 and 3. Incision of the thalweg flattened the oversteepened channel gradient upstream from cross section 2, and deposition below cross section 3 steepened the thalweg where channel gradient had been flat and even negative because of gravel extraction. Although the over- steepened channel gradient below 16th Street could be the primary cause of channel incision, similar incision occurred beneath at least four other bridges as much as 20 km upstream including 24th Street, Rural Road, Alma School Road, and Country Club Drive (fig. 1). The pattern was similar at each location beginning upstream from the bridge and continuing downstream from the bridge for three to six times the length of the upstream segment. None of the other locations had an oversteepened channel gradient, which suggests that incision generally was associated with flow contraction beneath the bridges.
At 24th Street, channel incision produced a substantial change in the stage-discharge relation at the gaging station (fig. \4A). By April 2, a stage of -0.45 m (relative to the original datum for the station) reflected a discharge of 63 m3/s compared to a stage reading of 0.84 m for a discharge of 58 m3/s on January 15. The trend of stage- discharge relations suggests that the incision may have occurred in two stages that lowered the channel bed after the flood peak of February 14 and possibly again after the flood peak of March 7. The data, however, are too limited to conclusively determine the timing of incision. At Alma School Road about 16.25 km upstream from 24th Street, channel incision did not produce a significant change in the stage-discharge relation, or the data are too limited to reflect a change in the relation (fig. 14J8).
No obvious channel changes were observed at bridge crossings downstream from the study area between 7th Street and the Gila River during a reconnaissance on July 1-2, 1992. The Salt River below 7th Street appears to be characterized primarily by channel deposition rather than
erosion, and the apparent lack cf substantial channel change may reflect the low sediment load of the previous winter's flows.
On August 25, upstream reservoir releases produced a peak discharge of 493 m3/s at 24th Street (fig. IB). Although higher than the discharge of February 14, the flows did not cave significant channel change at 24th Street or at 16th Street. The short duration of the flows in August may be the reason for the absence of channel change. Another possible reason for the lack of significant change during the period of runoff in August may be that the channel had been adjusted to accommodate higher discharges by the flows of the previous winter.
Hassayampa River
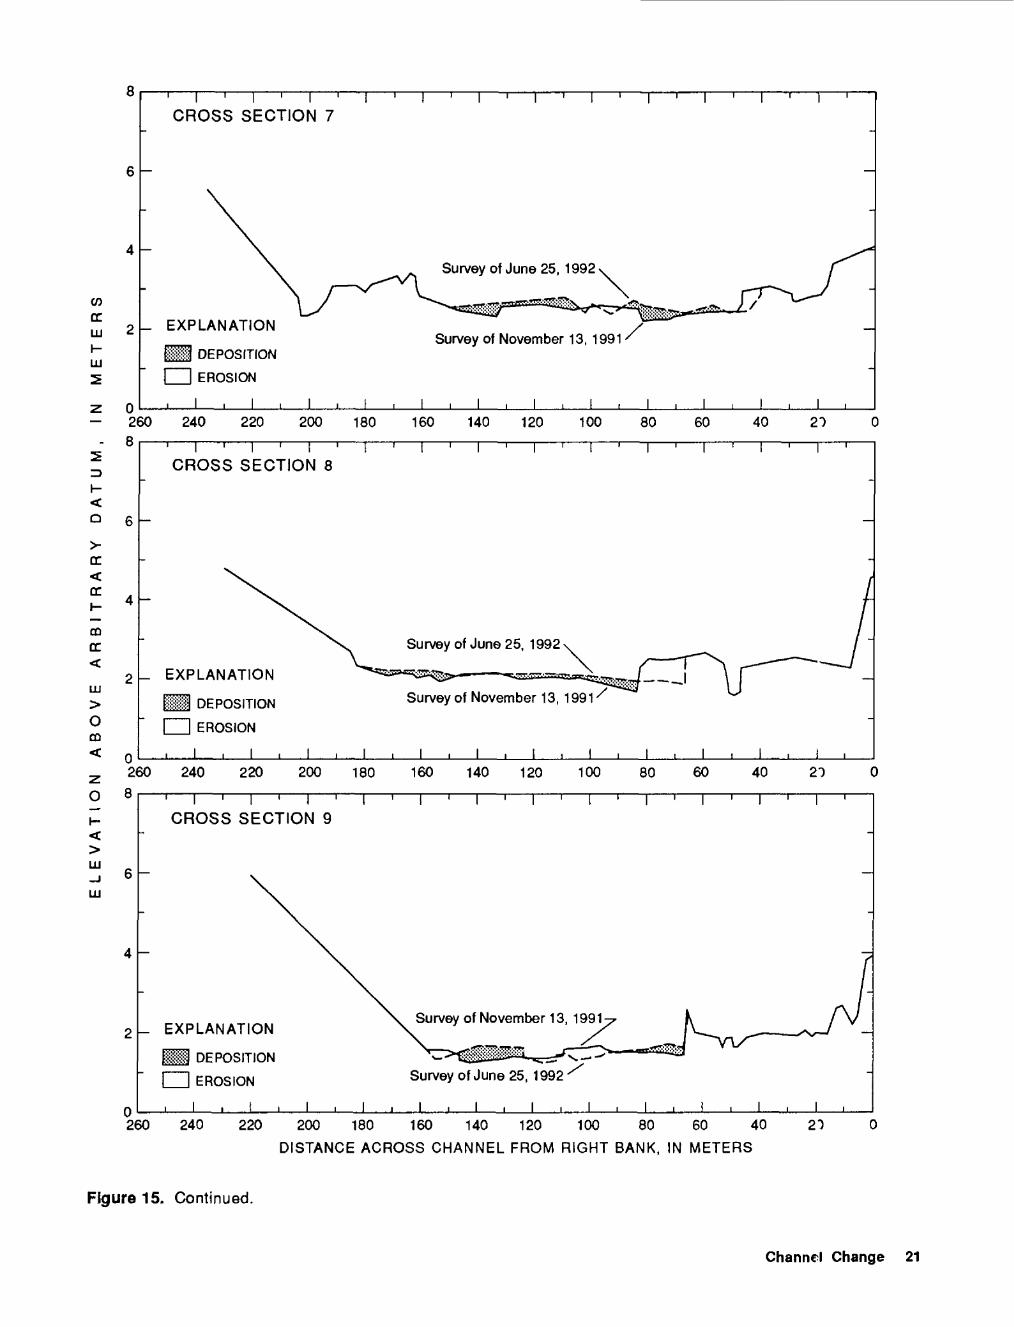
Channel adjustments within the study reach on the Hassayampa River were prirrarily lateral. More than 15 m of bank erosion occurred at cross sections, and banks eroded more than 20 m between cross sections (figs. 15-16). Most erosion was along the outside of a channel bend impinging on the right bank of the study reach at cross sections 1-3 and on the left bank at cross section 11 where the thalweg crosses over to the opposite side of the channel. Erosion of sediments stored in the high-flow channel, such as fre vegetated terrace and the sandy terrace, accounted for additional widening of the main channel. Vertical channel changes consisted of minor increases in bed elevation (fig. 17) mainly from filling of the channel thalweg. Vertical changes m?y have been the result of locally heavy sediment deposition in association with rapid bank erosion. Local adjustment of the longitudinal channel profile occurred as a result of the vertical changes. Channel segments that had a less-than-average gradient before the flows of winter 1992 tended to have a steeper gradient at the time of the second channel survey, and those that had a steeper gradient before the flows tended to have a shallower gradient after the flows. The gradient between most cross sections, however, did not change despite some increase in bed elevation. Through the entire 720-meter study reach, gradient of the channel thalweg was reduced from 0.0042 to 0.0038. The gradient of the channel-bed surface,
Channel Change 13

20
15
10
o> a:
TI1I|11II|11II|1III|IIII|IIII|-
CROSS SECTION 1
Survey of December 12,1991
Survey of June 26, 1992 EXPLANATION
ill DEPOSITION
I I EROSION
I I I I I I L
- 350
Q 15 -
a:< a:
mtr
om
O
< > LU
300
i i i i I i i i i I i i i i
CROSS SECTION 2
Survey of December 12, 1991
_ EXPLANATION
DEPOSITION Survey of June 26, 1992
I i i i i I
L CROSS SECTION 3
15
10
5 - EXPLANATION
DEPOSITION
I I EROSION
_| | | | | | L
Survey of December 12, 1991-
Survey of June 26, 1992/
I I I _L350 300 250 200 150 100 50
DISTANCE ACROSS CHANNEL FROM RIGHT BANK, IN METERS
Figure 11. Results of repeat surveys of the Salt River below 16th Street bridge, Phoenix, Arizona.
14 Channel Change and Sediment Transport In Two Desert Streams in Central Arizona, 1991-92

20
15
10
CROSS SECTION 4
- EXPLANATION
iH DEPOSITION
I I EROSION, i , : I i
Survey of December 12, 1991
350 300 250 200 150 100 5020
15
10
m DC
O m
CROSS SECTION 6
|- EXPLANATION
Hi DEPOSITION
I I EROSION Survey of December 12, 1991'
i , , . , i . , , , i350 300 250 200 150 100 50
DISTANCE ACROSS CHANNEL FROM RIGHT BANK, IN METERS
Figure 11. Continued.
which is the mean elevation of the channel bottom at each cross section, was unchanged.
Almost all of the channel change measured by resurveying the study reach was caused by the flow of February 7, which was the largest of the three flows recorded between the surveys of November 1991 and June 1992. At the time of bed-material sampling on January 31, evidence of minor bank erosion was observed from the flow of January 6. Blocks of bank material in the channel at that time (fig. 16A) were the result of the flow of January 6. The presence of bank material in the channel indicates that bank failure was caused by low flows that were incapable of disaggregating and
transporting the material from the reach. When the site was inspected on March 12, the channel had been greatly altered, primarily by migration of the channel and erosion of the right bmk. Several small terraces were obliterated by erosion or buried by deposition, and several mature pal? verde trees had been washed away. In contrast to conditions after the flow of January 6, almost no sloughed bank material was observed in the channel in March. The absence of failure blocks indicates either that no bank failure occurred during waning flows on February 7 or that any material left in the channel was subsequently removed b;' the flow of February 14. Except for possible removal of failure
Channel Change 15

A, Incised channel below 16th Street near cross section 1; preflow gravel-paved channel bottom was 0.3 to 0.4 meters below vegetated surface (Top right of photograph).
B, Erosion of boulder revetment and loss of structure at storm-drain outlet below 16th Street near cross section 2.
C, Gravel berms between cross sections 4 and 5 about 800 meters below 16th Street bridge showing little or no disturbance from winter flows.
Figure 12. Effects of flows on the Salt River, Phoenix, Arizona, 1992.
16 Channel Change and Sediment Transport in Two Desert Streams in Central Arizona, 1991-92
if 4
EXPLANATION [Number Is cross-section location
identifier]
SURVEY OF DECEMBER 1991
SURVEY OF JUNE^JULY 1992
6'
-50 0 200 400 600 800 1,000 1,200 1,400 1,600 1,800
8
HIi.< rr z uj 6Om
IILU .
OilQH 4
CD Q
LUCC
Z<
S5
EXPLANATION [Number Is cross-section location
identifier]
SURVEY OF DECEMBER 1991
SURVEY OF JUNE^JULY 1992
6'-O 8'
-o
B
-50 0 200 400 600 800 1,000
LONGITUDINAL DISTANCE, IN METERS
1,200 1,400 1,600
Figure 13. Longitudinal profiles of elevation on the Salt River through the study reach before and afte* winter flows of 1992. A, Thalweg elevation. S, Mean channel-bed elevation.
material from the channel, little if any of the channel change observed in March is likely to have been caused by the flow of February 14, which was smaller than the flow of January 6.
The cross sections were not resurveyed after the August 22 flow, which had the highest discharge in water year 1992. A cursory inspection
of the channel was conducted on December 23, 1992, to assess the effects of flows occurring after the resurvey in June. The right bank ha-1 undergone additional erosion although much less erosion occurred than after the flow of February 7. The distance from the right end points to tl <*. bank edge was measured at cross sections 2 and1 3; no bank
Channel Change 17

COccLU
Xo
LU
o< o
1.5
1.0
0.5
- + BEFORE FEBRUARY 15, 1992
O FEBRUARY 15 THROUGH MARCH 17,1992
- A AFTER MARCH 17,1992
-0.5
-1.00.1
2.0
1.B
1.6
1.4
1.20.1
10 100 1,000
B+ BEFORE FEBRUARY 15,1992
O FEBRUARY 15,1992 AND AFTER
1
DISCHARGE,
10 100
IN CUBIC METERS PER SECOND
1,000
Figure 14. Discharge and gage-height relations at streamflow-gaging stations on lower Salt River on the basis of discharge measurements made during flows in 1992. A, Salt River at 24th Street, Phoenix, Arizona. Change in relation between discharge and gage height at 24th Street reflect incision of channel. B, Salt River at Alma School Road near Mesa, Arizona. Although incision occurred at Alma School Road, change is not evident in the discharge and gage-height relation.
retreat had occurred at cross section 2, but about 5 m of retreat was measured at cross section 3 (fig. 15). Low terraces at the base of the right bank in cross sections 4 and 5 had been eroded some what. The left bank also had retreated at cross sections 10 and 11. In addition to the rather minor amounts of bank retreat, the channel may have been downcut somewhat although the generally
low magnitudes of fluctuations in channel-bed elevation on the Hassayampa River make such a determination difficult without su-vey meas urements.
Additional erosion of gullies aid overflow channels in the vegetated terrace on the left of the channel took place between late June and December 23, 1992. Headcut erosion extended the
18 Channel Change and Sediment Tranaport In Two Desert Streams In Central Arizona, 1991-92

COcc
I 'I ' I ' T CROSS SECTION 1
Survey of Novembers, 1991
- EXPLANATION
DEPOSITION
I I EROSION
I , I i I I- 260 240 220 200 180 160 140 120 100 80 60 40
8 I ' I ' I ' I ' T CROSS SECTION 2
r
Survey of November 6, 1991 Survey of June 24, 1992s
mEC
om
O
_ EXPLANATION
iii DEPOSITION
I I EROSION
i I i I ,2608
240 220 200 180 160 140 120 100 80 60 40
n i r \ 'i ' r CROSS SECTION 3
Survey of November 6, 1991
_ EXPLANATION
ill DEPOSITION
I I EROSION
_j__L _L _L _L J_ _L _L _L _L J_260 240 220 200 180 160 140 120 100 80 60 40 20
DISTANCE ACROSS CHANNEL FROM RIGHT BANK, IN METERS
Figure 15. Results of repeat surveys of 11 cross sections on the Hassayampa River below the Southern Pacific Railroad bridge, Arlington, Arizona.
Channel Change 19

CO DC
1 i ' i ' i ' rCROSS SECTION 4
Survey of November 7, 1991
_ EXPLANATION
iJi DEPOSITION
I I EROSION
I . I i I J_ I I
260 81
240 220 200 180 160 140 120 100 80 60 40 20
1 i ' r ^ i ^CROSS SECTION 5
r T
Q
> DC
< DCH
CD
DC
OCD
Survey of November 7, 1991.
Survey of June 24, 1992-^
i_ EXPLANATION
ill DEPOSITION
I I EROSION
i I i I i i i _i_ I i I260 240 220 200 180 160 140 120 100 80 60
O 8
40 20
l|I]i^ -r
CROSS SECTION 6
Survey of November 8, 1991
_ EXPLANATION
DEPOSITION
I I EROSION
I i I i I
Survey of June 24, 1992
I I I260 240 220 200 180 160 140 120 100 80 60 40
DISTANCE ACROSS CHANNEL FROM RIGHT BANK, IN METERS
20
Figure 15. Continued.
20 Channel Change and Sediment Transport In Two Desert Streams in Central Arizona, 1991-92
COtr
CROSS SECTION 7
_ EXPLANATION
ill DEPOSITION
I I EROSION
Survey of November 13, 1991
I
2608
240 220 200 180 160 140 120 100 80 60 40 2")
1 I r 1 ' I ' I
CROSS SECTION 8
O 6
rr
m tr
Om
_ EXPLANATION
ill DEPOSITION
I I EROSION
i I , I i
Survey of June 25, 1992
Survey of November 13, 1991
_|_z 260
O 8
LLJ
LJJ
240 220 200 180 160 140 120 100 80 60 40
CROSS SECTION 9
U EXPLANATION
DEPOSITION
I I EROSION
i I , I
Survey of November 13, 1991
I
Survey of June 25, 1992
I , I i I i I I260 240 220 200 180 160 140 120 100 80 60 40
DISTANCE ACROSS CHANNEL FROM RIGHT BANK, IN METERS
Figure 15. Continued.
Channel Change 21

23 I-
Q
>-
cr<
COcr
om
i- < >
1 1 ' 1 ' I ' T CROSS SECTION 10
_ EXPLANATION
M DEPOSITION
I I EROSION
I i I iSurvey of November 14,1991
I i I i I , I260 2408
220 200 180 160 140 120 100 80 60 40 20
1 i ' i ' i ' r CROSS SECTION 11
\
- EXPLANATION
DEPOSITION
I I EROSION
I i I i
Survey of November 14,1991X
Survey of June 25,1992
I I260 240 220 200 180 160 140 120 100 80 60 40
DISTANCE ACROSS CHANNEL FROM RIGHT BANK, IN METERS
20
Figure 15. Continued.
length of the small channel by about 10 m upstream at the base of the levee on the left bank at cross section 5 (fig. 15). Although overflow occurred on the vegetated terrace during the August flow, the amount of overflow was small, perhaps confined to rivulets no more than a few inches wide that flowed toward headcutting gullies and overflow channels. Headcut erosion seems too great to have been caused entirely by the small amount of overflow that occurred. Sapping of the headcut wall by seepage of subsurface water may have contributed to headcut retreat (Higgins, 1990). Most of the channel changes noted on
December 23 probably were caused by the flow of August 22; however, the flow of December 8 was the longest of the 1992 events and could have caused some localized erosion.
Although the peak discharge on August 22 was 15 percent greater than the peak of February 7, the flow of February 7 apparently cause 1 more bank erosion than the flow in August. Pe*k discharge generally does not correlate directly with rates of bank erosion because of other factors such as cohesiveness of bank material and pre-existing conditions (Knighton, 1984). Most streambanks have some degree of cohesion so that erosion does
22 Channel Change and Sediment Transport In Two Desert Streams In Central Arizona, 1991-92

A, Looking downstream at stream- bank just below cross section 2 after the flow on January 6, 1992. Failure material at base of bank indicates some erosion occurred from the flow in January. (Photo graph was taken on January 30, 1992.)
B, Bank erosion after the flow on February 7, 1992. (Photograph 16B is the same location as photo graph 16A Photograph was taken on April 10, 1992.)
Figure 16. Effects of flows on the Hassayampa River, near Arlington, Arizona, 1992.
not occur immediately upon application of the minimum shear stress necessary for movement of the sediment particles comprising the bank material. Cohesive forces are weakened by increased soil moisture (Wolman, 1959; Hooke, 1979); therefore, flows must not only be of sufficient magnitude to provide the necessary shear stress for bank erosion to occur, they also must last long enough to infiltrate banks and break down cohesive forces. The event on February 7 lasted twice as long as the event in August; however,
mean discharge during both events was com parable. Consequently, during the February flow, infiltration of flow into streambanks and associated weakening of cohesive forces occurred over a longer period of time, and the threshold at which bank erosion takes place was exceeded for a greater period of time. Nonetheless, the magnitude of bank erosion from the first event seems dispro portionate to that of the flow in August solely as a result of a few hours flow duration. The close succession of two flows of comparable peak
Channel Change 23

C, Looking upstream at low terrace near cross section 10 before flow on February 7, 1992. (Photograph was taken on January 30, 1992.)
D, Low terrace along right side of channel after the flow on February 7, 1992. Deposition in channel nearly buried the terrace. (Photograph 16D is the same location as photograph 16C. Photograph was taken on April 10, 1992.)
Figure 16. Continued.
discharge may account for much of the discrepancy in erosion rates. The event in February adjusted the channel to accommodate a peak discharge of about 136 m3/s; the single intervening flow before the event on August 22 did not modify the channel significantly, so only moderate changes in channel geometry were necessary to accommodate the peak discharge of 173 m3/s.
Long-term channel instability is difficult to assess on the basis of a single season of channel monitoring. The amount of bank erosion occurring
on the Hassayampa River as a result of a single, moderate event seems quite high but may not be atypical of alluvial channels in the Southwest. Data on erosion rates for single events on other streams are few. On an entrenched reach of the Santa Cruz River south of Tucson, Arizona, peak discharge of 1,492 m3/s during the flood of October 1983 caused as much as 250 m of bank erosion. During the same flood, about 365 m of bank erosion occurred on an unentrenched reach of the Santa Cruz River near the Pima-Santa Cruz County line
24 Channel Change and Sediment Transport in Two Desert Streams in Central Arizona, 1991-92

EXPLANATION [Number is cross-section location
identifier]
SURVEY OF NOVEMBER 1991
1' 2'O O SURVEY OF JUNE 19?2
900
CQ Q
II
1 2
EXPLANATION[Number Is cross-section location
identifier] 1 2 O O SURVEY OF NOVEMBER 19911' 2'O O SURVEY OF JUNE 19S2
B
I I I I-250 100 200 300 400 500 600
LONGITUDINAL DISTANCE, IN METERS
700 800 900
Figure 17. Longitudinal profiles of elevation on the Hassayampa River through the study reach before and after winter flows of 1992. A, Thalweg elevation. B, Mean channel-bed elevation.
where peak discharge reached 1,274 m3/s (Parker, 1993). The 1983 flood on the Santa Cruz River, however, lasted for 9 days compared to a duration of 7.25 hours for the event on February 7 on the Hassayampa River. Depending on the method used to estimate flood frequency, the Santa Cruz River flood had a recurrence interval from less than 50 to more than 100 years (Roeske and others, 1989; Webb and Betancourt, 1992). Hays (1984) reported
as much as 60 m of bank erosion on the lower Santa Cruz River in response to a 6-day flow with a peak discharge of 234 m3/s and a recurrence interval of about 2 years.
In reaches of maximum bank erosion on the Santa Cruz River, hourly bank-erosion rates averaged over the entire period of runoff for the flood of 1983, were about 0.6-2 m/hr. The maxi mum bank-erosion rate on the study reach of the
Channel Change 25

Hassayampa River, averaged over the entire period of runoff for the flow of February 7, was about 2.1 m/hr. Comparison of erosion rates on the Hassayampa River with other published rates worldwide is difficult because of differences in methods of determining and reporting erosion rates (Hooke, 1980).
SEDIMENT TRANSPORT
Salt River
Suspended-sediment concentration on the Salt River generally increased with flow peaks during the 5-month sampling period (figs. 18 and 19/4, B)\ however, during prolonged periods of steady flow, such as from January 15 through January 29, sediment concentration decreased. Although the sampling density was too low to completely characterize the temporal variability of suspended- sediment transport during the winter flows, a general trend seems to have been toward decreasing sediment concentration with discharge over the entire season, which would suggest
depletion of sediment availability. Seliment con centration generally increased and decreased more rapidly than discharge.
Suspended-sediment concentration, which ranged from 2 to 617 mg/L, is low but is comparable to that of other Arizona streams that are controlled by dams (fig. 195). Because most sediment is trapped in the upstrearr reservoirs, most suspended sediment in transport on the lower Salt River must be supplied by local runoff, bank erosion, and entrainment of sediments stored in the channel. J_x>cal runoff was a negligible component of winter flows. J_x>cal bank erosion occurred but was of low magnitude. Almost all suspended sediment transported through the lower Salt River, therefore, must have come from the channel bottom.
Systematic mapping of channel segments was beyond the scope of this project; however, qualitatively, most of the channel upstream from the sampling site at 24th Street seems to be gravel paved. Fine sand, silt, and clay that constitute the suspended-sediment load is in scattered patches along channel margins, in channel bar? and sheets, and in the interstices among gravel clasts. In at least some locations, gravel pavement is only
500
O 400LLJ «EC LLJ Q- C/> 30°
Omo 20°
C3 EC
I 100 O
EXPLANATION
DISCHARGE
+ SEDIMENT CONCENTRATION
700
600
500
ccLLJ O.
I
400
300
200Oo
100
Q LLJ
JANUARY FEBRUARY MARCH APRIL
Figure 18. Relation of suspended-sediment concentration to time and discharge on the Salt River, Phoenix, Arizona, winter 1992.
26 Channel Change and Sediment Tranaport In Two Desert Streams In Central Arizona, 1991-92

100
DC LU
I]
DC LU Q.
DC O
OZo oi- zLU
Q LU
10
10 100 DISCHARGE, IN CUBIC METERS PER SECOND
1,000
1,000
500 -
EXPLANATION
+ SALT RIVER, PHOENIX
A AGUA FRIA RIVER BE LOW WADDELL DAM
D COLORADO RIVER, LEES FERRY
O VERDE RIVER BELOW BARTLETT DAM
10
UNIT DISCHARGE, IN THOUSANDTHS OF CUBIC METERS PER SECOND PER SQUARE KILOMETER
50
Figure 19. Sediment-transport data, Salt River and other rivers in Arizona controlled by dams. A, Relation of suspended-sediment concentration to discharge. 6, Comparison of suspended-sediment concentrations and discharge relations on the Salt River with relations for other controlled rivers in Arizona.
Sediment Transport 27

1-2 particles thick and is underlain by beds of fine sand and silt. The underlying fine-grained material provides a source for suspended-sediment transport whenever the gravel pavement is disrupted by streamflow or human activity, such as channelization or sand-and-gravel mining (fig. 3A).
Particle-size analysis of the sand fraction of suspended-sediment and bed-material samples shows sediment transported in suspension generally to be finer than deposited material (fig. 20A). Channel sands collected from the pre dominantly gravel-paved channel bottom, and terrace sands collected from the channel margin (fig. 2) are composed of 30-55 percent material finer than 0.25 mm in diameter. Suspended sediment is composed of 80-99 percent of ma terial finer than 0.25 mm in diameter. Bed material collected from channel bottom that had been scraped of gravel has a particle-size distribution similar to that for suspended-sediment samples. Such material appears to be primarily alluvium exposed by gravel-removal operations rather than recent sediments deposited after gravel removal. The alluvium appears to be the most volumetri- cally significant suspended-sediment source imme diately upstream from the sampling site; however, the relative importance of this sediment source through the entire lower Salt River was not determined.
Variability in the relation of discharge to sediment concentration (fig. 19B) probably is related to the fluctuations in the availability of sedi ment for transport. Variability is particularly great at discharges lower than 160 m3/s. At many locations, sediment is not entrained across the entire width of the channel during lower dis charges, and heterogeneity of sediment availability may affect suspended-sediment concentration more than at higher discharges. At higher dis charges, all sediment in the channel bottom available for suspended transport is likely to be entrained.
Bedload transport was not measured in this study, but some qualitative statements about bedload entrainment, transport, and deposition can be inferred from the spatial patterns of channel change. Bed material available for transport as bedload is predominantly coarse gravel (fig. 20B). At cross section 1 below 16th Street, median diameter of gravel-sized bed material (>11 mm) is
27 mm, and maximum particle size was 355 mm. The particle-size distribution of gravel across cross section 8 was slightly lower.
Channel incision that occurred at 16th Street and at other bridges upstream from the study area, where particle size of bed material p-obably was greater, generally occurred in the gravel-paved channel bottom. Apparent lack of channel change before the flood peak of February 15 suggests that little movement of coarse-grained t?4 material occurred before that date. At flows of about 30 m3/s, during which wading-dischane measure ments were made and the channel bottom was observed, neither entrainment, traTSport, nor deposition of bedload could be seen.
The flows of February 14-16, which caused the initial incision at 16th Street, w^re the first flows of sufficient magnitude to entrain the coarser gravel on the channel bottom. The channel bottom at 16th Street was not resampled following the winter flow; however, on inspection, no obvious change in particle-size distribution of bed material was observed. Transport distance of coarse gravel was apparently short, and most material from the incised channel beneath the 16th Stree* bridge was deposited in the gravel lobe at crops section 2 (fig. 11). No evidence of significant deposition of gravel is seen as far downstream as cress section 3, about 430 m downstream from the 16th Street bridge. Indeed, a sheet of sand deposited through out much of cross sections 3 and A terminated abruptly about 500 m downstream from 16th Street, which indicates that transport distance of sand-sized bedload also was short.
Entrainment of coarse gravels may have occurred only in association with contracted flow at bridge sites on the lower Salt River. The short transport distance of such gravels witl in the study reach may have been a function of the flattening of channel gradient caused by removaf of bottom material downstream from cross sectio^ 2 (fig. 13). The low channel gradient results in a low-energy reach below cross section 4 in wh'oh bedload transport was apparently negligible. Gravel berms left on the channel bottom by grading equipment generally were undisturbed by the vdnter flows (fig. 12Q, and pebbles as small as 20 mm in diameter appeared to have remained in place.
28 Channel Change and Sediment Tranaport In Two Desert Streams In Central Arizona, 1991-92

99.999
99.99
99.9
LU N
LU_lo
99
98 -
95
90 -
80 -
70 -
60 i-50 L
40 -
30 -
20 i-
100.01
~ 99.999
t- ocLUz
zLU Ocr
99.99 L-
99.9 E-
EXPLANATION
A-A SUSPENDED-SEDIMENT SAMPLES
O-O CHANNEL MUD SAMPLE FROM SCRAPED SURFACE
D-D GRAVEL-BED CHANNEL SAMPLES AT CROSS SECTIONS 1 AND 8
V-V TERRACE SAMP'.E FROM : EDGE OF CHANNEL AT - CROSS SECTION 1
I0.1 10
EXPLANATION -=
D-D CROSS SECTION 1 -E
CROSS SECTION 8 -
100 PARTICLE DIAMETER, IN MILLIMETERS
1,000
Figure 20. Particle-size data, Salt River in Arizona. A, Particle-size distribution of suspended-sediment and sand-sized bed-material samples. B, Particle-size distribution gravel-sized bed-material samples.
Sediment Transport 29
Hassayampa River
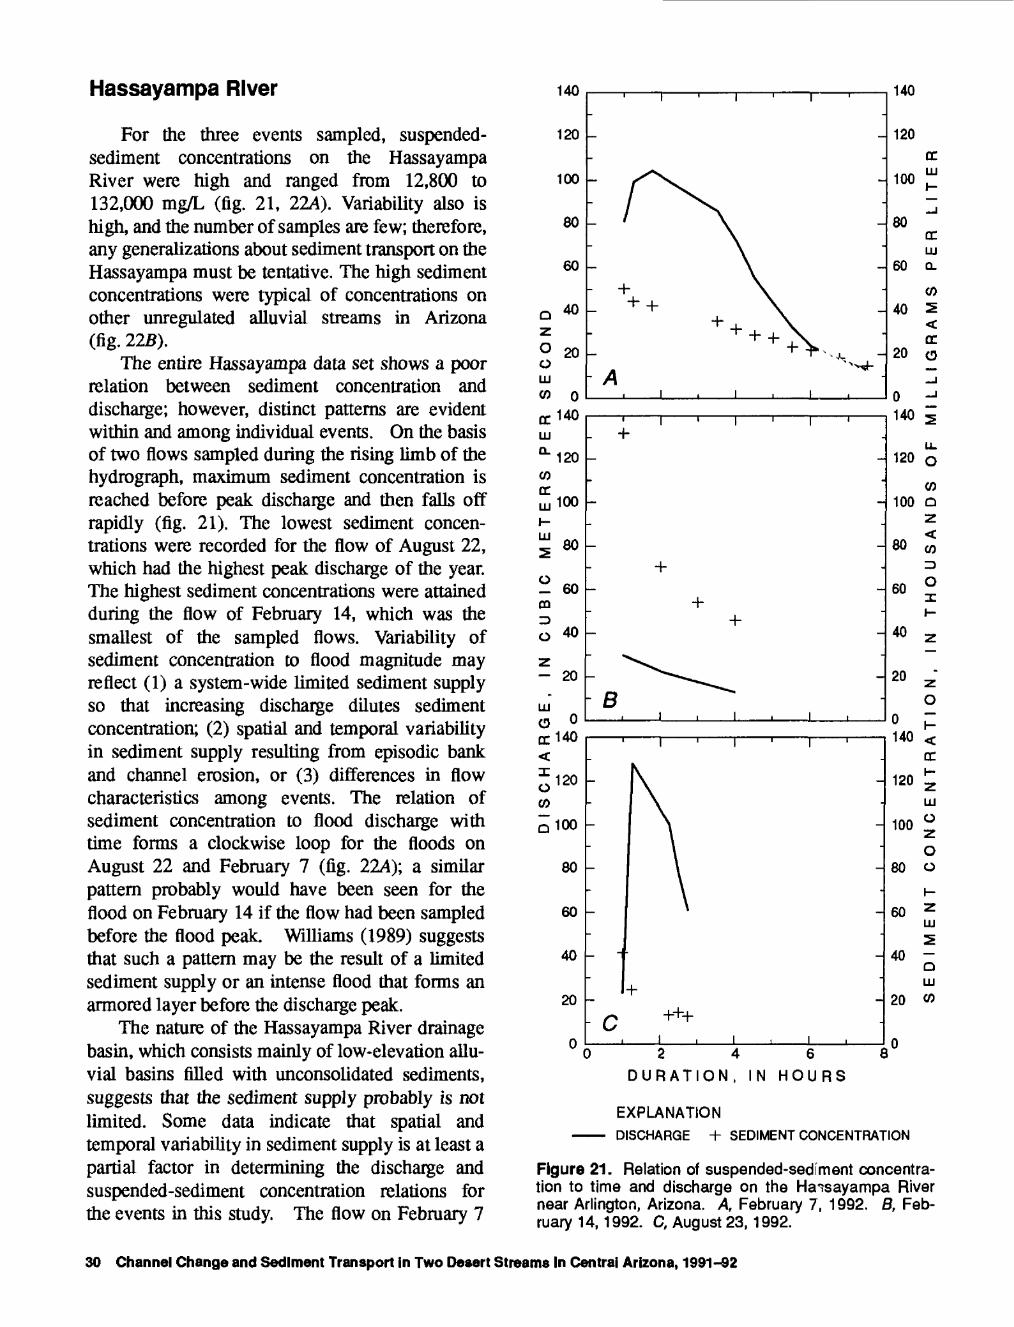
For the three events sampled, suspended- sediment concentrations on the Hassayampa River were high and ranged from 12,800 to 132,000 mg/L (fig. 21, 22A). Variability also is high, and the number of samples are few; therefore, any generalizations about sediment transport on the Hassayampa must be tentative. The high sediment concentrations were typical of concentrations on other unregulated alluvial streams in Arizona (fig. 22B).
The entire Hassayampa data set shows a poor relation between sediment concentration and discharge; however, distinct patterns are evident within and among individual events. On the basis of two flows sampled during the rising limb of the hydrograph, maximum sediment concentration is reached before peak discharge and then falls off rapidly (fig. 21). The lowest sediment concen trations were recorded for the flow of August 22, which had the highest peak discharge of the year. The highest sediment concentrations were attained during the flow of February 14, which was the smallest of the sampled flows. Variability of sediment concentration to flood magnitude may reflect (1) a system-wide limited sediment supply so that increasing discharge dilutes sediment concentration; (2) spatial and temporal variability in sediment supply resulting from episodic bank and channel erosion, or (3) differences in flow characteristics among events. The relation of sediment concentration to flood discharge with time forms a clockwise loop for the floods on August 22 and February 7 (fig. 22A); a similar pattern probably would have been seen for the flood on February 14 if the flow had been sampled before the flood peak. Williams (1989) suggests that such a pattern may be the result of a limited sediment supply or an intense flood that forms an armored layer before the discharge peak.
The nature of the Hassayampa River drainage basin, which consists mainly of low-elevation allu vial basins filled with unconsolidated sediments, suggests that the sediment supply probably is not limited. Some data indicate that spatial and temporal variability in sediment supply is at least a partial factor in determining the discharge and suspended-sediment concentration relations for the events in this study. The flow on February 7
140
120
100
80
60
Q 40
z0 20OLU
co o
DC 140LU
°-120
COtr ujlOO
LU80
_ 60 m
O 40
Z - 20
LU
O °tr 140
o 120CO
Q 100
80
60
40
20
B
140
120
100
80
60
40
20
0140
120
100
80
60
40
20
0140
120
100
80
60
40
tr LU a.
CO
tr o
2468
DURATION, IN HOURS
EXPLANATION
DISCHARGE + SEDIMENT CONCENTRATION
COQZ<CO3oX
LU
2
oLU
20 »
Figure 21. Relation of suspended-sediment concentra tion to time and discharge on the Hassayampa River near Arlington, Arizona. A, February 7, 1992. B, Feb ruary 14,1992. C, August 23,1992.
30 Channel Change and Sediment Transport In Two Desert Streams In Central Arizona, 1991-92

200
100
70
50 CC in t 40
CCUJa.
co Q
co
O
UJoz OO
Q UJco
30co
CC<5 20
10
i i r i
10
500
100
10
EXPLANATION
DATE OF SAMPLES WERE COLLECTED
O February?, 1992
n February 14,1992
A August 22,1992
< DIRECTION OF TIME FOR INDIVIDUAL FLOODS Arrow indicates end of sampling period
50 100
DISCHARGE, IN CUBIC METERS PER SECOND
0.10.0001 0.001 0.01 0.1 1 10
UNIT DISCHARGE, IN THOUSANDTHS OF CUBIC METERS PER SECOND PER SQUARE KILOMETER
100
500
-
-
-
: +_ A
V
To- n
" \X
B 0
v ®Q Q §+
v o v O °A <DH
V v v + 3^ SP* D
v v O V (y<y><3g+++ + D D
EXPLANATION v Q ^ <> r-,
HASSAYAMPA RIVER, <j~i7 r-rn ARLINGTON vv rj D-J
BLACK RIVER, HOUCK _
LITTLE COLORADO P] RIVER, CAMERON
PUERCO RIVER, V CHAMBERS
RILLITO RIVER, TUCSON A
> SANTA CRUZ RIVER, TUCSON
I I 1 Mill I I I 1 mil 1 1 1 1 Mill I I I 1 I nil 1 1 1 1 1 ml I ,111ml
1 1 1
-
-
-
!-~
500
Figure 22. Sediment-transport data on the Hassayampa River and other rivers in Arizona. A, Relat'on of suspended-sediment concentration to discharge. B, Comparison of suspended-sediment concentrations and discharge relations on the Hassayampa River with relations for other uncontrolled rivers in Arizona.
Sediment Transport 31

resulted in significant bank erosion. The high rate of bank erosion may have caused sediment con centration to locally exceed transport capacity resulting in deposition in the channel. Channel- bottom material is primarily sand (fig. 23); however, most bank material, especially in the upper part of the banks, appears to have a higher silt-clay content. If such material were deposited on the channel bottom during the waning stage of the February 7 event, it would provide a source of readily available fine-grained material for suspended-sediment transport during the next event. Such an explanation also is consistent with Williams' (1989) suggestion that clockwise loop relations in sediment concentration and flood discharge with time may be the result of intense floods that flush sediment from a reach before forming an armored channel bottom at the peak of the flood. Whether an armored layer is actually
formed within the study reach of the Hassayampa River is unknown, but isolated boulders and large cobbles scattered over the channel borom indicate that such a layer might be formed at high discharges.
Differences in flow characteristics also have been cited as a cause of variability in d' 'charge and sediment-transport relations. In the Southwest, in particular, less intense winter frontal storms are believed to cause flows that have generally lower sediment concentrations than flows caused by summer monsoonal storms (Matbck, 1965; Burkham, 1972). In some cases, this assumption has been demonstrated (Graf and otters, 1991); however, supporting data generally are meager and sometimes contradictory (Parlor, 1993). Obviously, the seasonality of flow cannot explain the variability among the three Hassayampa River samples because the one summer flow has the
99.999
N55
O
<Htr
oIT
99.99
99.9
99
98
90
80
706050
4030
20
10
EXPLANATION
H CH SAMPLES FROM UNVEGETATED CHANNEL
A A SAMPLES FROM VEGETATED CHANNEL
O-O SAMPLES FROM SANDY TERRACE
0.01I
0.1 1
PARTICLE DIAMETER, IN MILLIMETERS
10
Figure 23. Particle-size distribution of bed-material samples from the Hassayampa River below the Southern Pacific Railroad bridge, near Arlington, Arizona.
32 Channel Change and Sediment Transport In Two Desert Streams In Central Arizona, 1991-92

lowest sediment concentration to discharge relation. The variability might be explained, however, by differences in the origin of flow for the three events. Because of high transmission losses to the streambed, flows on the Hassayampa River that originate well upstream from the sampling site can be expected to have higher sediment concentrations than flows originating closer to the sampling site. Higher stream velocities are required to entrain fine-grained sediment than are needed to transport it (Statham, 1979, p. 120); therefore, as discharge (and velo city) decreases from transmission losses, most of the fine-grained sediment can be expected to remain in suspension and produce a downstream increase in suspended-sediment concentration. The sediment-ladened flow of February 14 apparently originated well upstream from the sampling site near Arlington. The flow produced a peak dis charge of 95.7 m3/s on February 13 at the streamflow-gaging station near Morristown about 57 km upstream from the Arlington station. At Arlington, the flood peak, which occurred early on the morning of February 14, was only 29.5 m3/s. Total streamflow for the period of storm runoff declined even more substantially between the two stations. At Arlington, where the period of runoff lasted less than 1 day, total streamflow was only 9 percent of the total at Morristown where the period of runoff lasted 6 days (Smith and others, 1993). Such a depletion of streamflow would have significantly increased sediment concentration as the floodwave moved downstream. All the other flows at Arlington during the study period apparently resulted from runoff that originated primarily downstream from the gaging station at Morristown.
DISCUSSION
Geomorphic and hydrologic processes in dryland fluvial systems are fundamentally different from processes on streams in humid regions (Graf, 1988b). One fundamental difference between dry and humid regions that has been suggested is the nature of the event that is most significant in determining the morphology and hydraulics of stream channels. In humid, temperate regions, streams generally are perennial; flow approaches
uniform, steady conditions for extended periods of time, and the range of discharge is net. great. The main hydrologic control on such systems is considered by some investigators to be a moderate, frequent flow event, such as the bank-fill discharge that has a recurrence interval of less than 2 years (Wolman and Miller, 1960). In drier ngions, such as the semiarid to arid western United States, many streams are ephemeral; extended periods of uniform, steady flow are exceptional, and the range of discharge can cover six orders of rragnitude on large streams. Rare, high-magnitude events may be the dominant hydrologic control on dryland streams, especially where channel resistance to erosion is high (Baker, 1977; Patton and Baker, 1977). Where channel resistance is low, however, major channel changes can occur over a wide range of discharges although the rate of chmge and the mechanisms causing change will vary according to the magnitude of a flow event (Palter, 1990a, 1990b, and 1993).
The moderate discharges that occ irred on the Salt River in 1992 could be expected to have limited effect on channel morphology. Both banks of the channel are armored with revetment, the channel bottom was paved with coarse gravel, and channel morphology at the beginning of 1992 had been shaped by flows of more than 10 times greater magnitude than flows that occurred in 1992. In fact, the channel changes measured in the study reach and those observed elsewhere on the lower Salt River probably were of little geomorphic sig nificance but were of some importance from a stream-management standpoint Channel incision caused a change in stage-discharge relations and changed the hydraulic characteristics of the low- flow channel at bridge crossings. In the study reach, excavation of material by charnel incision underneath the 16th Street bridge and i*s deposition immediately downstream forced flow against the left bank, resulting in lateral erosion ard ultimately led to failure of bank revetment an-1 loss of a structure. Lateral erosion also led to bank failure and exposure of a landfill upstream fnm Country Club Drive in Mesa. The subsequent stream transport of refuse became a matter of public consternation (Arizona Republic, 1992).
Most channel change associated w;fh moderate flows on the lower Salt River in the winter of 1992 was channel incision beneath bridge? suggesting
D'scussion 33
that the constriction of flow caused by bridge piers in the channel was the major factor controlling the occurrence of channel change. Changes in bed- material composition, channel gradient, channel morphology, and possibly of sediment availability as a result of gravel mining also may have played a role in channel change during the 1992 flows. At least within the study reach, flattening of channel- bed gradient by removal of bed material and grading of the channel bottom could have been a factor in the rapid deposition of gravel immediately downstream from the incised channel. Formation of an anomalously steep channel profile upstream from where gravel had been removed may have increased the degree of channel incision at the head of the study reach. The degree of channel change occurring on the lower Salt River was unanticipated as shown by the failure of bank revetment in the study reach. The failure at moderate flow demonstrates that peak discharges associated with high-magnitude, low-frequency flows are not the only important design criteria on highly disturbed urban channels. A major issue to be addressed on the Salt River and other urban desert streams is the extent to which human alteration of the channel affects hydrologic and geomorphic processes.
Channel instability on the lower Hassayampa River is to be expected because of the easily credible fine to medium sand that forms the banks and channel bottom and the lack of stabilizing bank vegetation; however, the magnitude of bank erosion in response to the flows in 1992 was greater than had been expected. As more data on channel instability in desert streams becomes available, the Hassayampa River channel may not prove to be unusually unstable for a southwestern alluvial stream. The degree of channel response does not increase linearly with flood magnitude. The apparently greater magnitude of bank erosion resulting from the flow of February 7 compared to the flow of August 22, indicates that factors other than peak discharge control the amount of bank erosion. Although duration of flow has been cited as a possible cause of variability in bank-erosion rates for cohesive streambanks, the banks of the Hassayampa River exhibit little if any cohesion, and both of the largest flows of 1992 were of such short duration that additional explanation seems necessary. The sequence of events in this case,
the occurrence of flows of similar magnitude about 6 months apart is a likely cause for the different effects of the two events. Stream channels retain the imprint of previous geomorohologically effective events until they are modified by sub sequent flows. Ephemeral channels in dry environ ments may reflect the morphology ar«i hydraulic conditions imposed by the last effect:ve flow for months, years, or even decades depending on the magnitude of the effective event and the magnitude and frequency of subsequent channel-modifying events (Wolman and Gerson, 1978; Kochel, 1988; Parker, 1993).
At the time of this study, channel instability on the Hassayampa River below Wickent iirg was not a major stream-management issue. Other than railroad tracks and several major hi-ihways that crossed the channel, the lower drainage basin generally was undeveloped, and hurmn activities were minimally affected by the shifting, migrating channel. Future development near the Hassayampa River and similar streams, however, will increase the probability of problems related to channel instability. Furthermore, the high suspended- sediment load of such streams means that any activity that contaminates sediments o~ that causes an increase or decrease in sediment availability can have significant downstream consequences.
The findings of this study rnse several questions concerning processes on alluvial desert channels that may need further investigation to improve the ability of managers to effectively cope with potential problems:
1. What is the variability in bank erosion, channel deposition and channel erosion, and sediment transport fron event to event?
2. How are processes related from one reach to the next? What are the upstream and downstream effects of channel change in a reach?
3. What are the limits of lateral channel instability? What is the maxirr-'jm amount of bank erosion and channel migration that can be expected under current climatic conditions?
4. What is the depth of the active channel bed in sandy, ephemeral channels?
34 Channel Change and Sediment Transport In Two Desert Streams In Central Arizona, 1991-92

5. How does sediment move through the system? What is the source of fine-grained sediment; where is it stored; and, on an engineering time scale, what is its destination?
6. Do mechanisms of channel change vary according to flood magnitude and vary over longer periods of time such as years or decades?
7. How do hydraulic conditions, such as roughness, channel geometry, and gra dient change over time; and what is the mechanism of such change?
8. How long do arid-region, ephemeral channels retain the imprint of previous floods, and what are the mechanisms that remove the imprint?
9. How does human alteration of the channels affect hydrologic and geo- morphic processes on urban desert streams?
SUMMARY AND CONCLUSIONS
Sediment transport and channel change were monitored on the Salt and Hassayampa Rivers in Maricopa County, Arizona, during water year 1992. Although the monitoring program did not continue long enough to sample the variability in stream processes, data that were collected provide some insight into the response of two desert rivers to moderate flows. Channel change was monitored by establishing monumented cross sections across the study reaches on each river. Channel morphology was surveyed along the cross sections before the onset of the winter rainy season, and each cross section was resurveyed in early summer before the summer rainy season. Suspended- sediment samples were collected manually on the Salt River and were collected by automatic sampler on the Hassayampa River. Bed material was sampled on both rivers to characterize channel- bottom sediments.
The Salt River, a large, gravel-paved river in which streamflow occurs in response to releases from upstream reservoirs, was selected for monitoring because of the river's urban location and its potential for disrupting economic activity during floods in the Phoenix area. During sustained
flows from early January to early June 1992, flood peaks of 368, 241, and 306 m3/s occurred. Although the winter flows were the highest in 9 years, they were minor compared to those occurring during a series of floods from 1966 to 1980. In the study area between 16th and 7th Streets, the flows incised the channel 2 m and caused local bank erosion that undermined the boulder revetment and led to failure of a large concrete-drop structure. In August 1992, a short period of flow produced a peak discharge of 493 m3/s; however, the flow had little or no effect on channel morphology. A total of 19 suspended- sediment samples were collected durir"? the winter flows. At discharges from 6.7 to 343 m3/s, sedi ment concentrations ranged from 2 to 617 mg/L, which are typical concentrations for large, controlled streams in Arizona.
The Hassayampa River near Arlington, Arizona, was selected for study because it is the last, large, unregulated, ephemeral stream in central Arizona. Furthermore, it is in an area that can be expected to be subjected to development pressures in coming decades because of its proximity to the Phoenix metropolitan area. An understanding of processes in the unstable, shifting river may enable flood-plain managers and engineers to plan urban development in a way that minimizes the need for expensive structural methods of flood-hazard control.
During 1992, five periods of flow occurred on the Hassayampa River. A flow on February 7 that produced a peak discharge of 127 m3/s caused considerable bank erosion through the study area. A flow on August 22 produced a peak discharge of 173 m3/s but apparently caused less erosion than the earlier, smaller flow. Both flows had a recur rence interval of less than 5 years. Suspended- sediment samples were collected during three periods of flow. Sediment concentrations ranged from 12,800 to 132,000 mg/L for discharges ranging from 13 to 128 m3/s. "Tie relation between sediment concentration and d^charge was complex.
Results of the monitoring program during flows of 1992 on the Salt and Hassayampa Rivers support the following tentative conclusions.
1. Moderate flows on the Salt River can cause channel changes of engineering signi ficance. Channel hydraulics that control
Summary and Conclusions 35

the velocity and shear-stress distribution of moderate flows have been affected by human activity including bridge con struction and gravel mining. On the lower Hassayampa River, the channel is highly unstable, and 15-20 m of bank erosion can occur from a flow with a recurrence interval of less than 5 years. The rate of bank erosion occurring in the flow of February 7, 1992, was comparable to bank-erosion rates for single events on the Santa Cruz River in southern Arizona.
2. Channel incision on the Salt River and bank erosion on the Hassayampa River do not increase linearly in relation to peak discharge. Both streams had summer flows with peak discharges higher than the peak discharges that occurred during the winter, yet channel change was much less from the summer flows. Summer flows were shorter in duration than winter flows especially on the Salt River, which partly may explain the variability in channel response. The sequence of events also appears to have been important in controlling the magnitude of channel response to flow especially on the Hassayampa River where the sequence of events probably was the dominant control
3. Suspended-sediment concentration is low on the Salt River, shows some relation to discharge, and tends to decrease during extended periods of steady flow. The channel bottom is the probable source for almost all suspended sediment. On the Hassayampa River, the relation of sediment concentration to discharge is extremely variable; however, maximum sediment concentration seems to occur immediately before peak discharge and then decreases steadily with the decreasing discharge. High rates of bank erosion may be related to high sediment concentrations. Sediment concentration also may depend on the distance upstream from the sampling site in which flow originates; high streamflow transmission losses may cause increased sediment concentration in flows originating well upstream from the sampling site.
4. The gravel bottom of the Salt River channel is a mobile pavement that can be moved at flows well below maximum flood levels at least within areas of contracted flow rather than an armor that can be entrained only by exfr?me floods. At the discharges occurring in 1992, coarse gravel within the study reach was transported only a short distance from its location at the time of entrainnent
REFERENCES CITED
Arizona Republic, 1992, Trashing our river Editorial: Phoenix, Arizona, The Arizona Republic, January 15,1992, p. A18.
Baker, V.R., 1977, Stream-channel response to floods, with examples from central Texas: Geological Society of America Bulletin, v. 88, p. 1057-1071.
Boner, F.C., Konieczki, A.D., and Davis R.G., 1991, Water resources data, Arizona, water year 1990: U.S. Geological Survey Water-Data Report AZ-90-l,381p.
Boner, F.C., Davis, R.G., and Duet, N.R., 1992, Water resources data, Arizona, water yea- 1991: U.S. Geological Survey Water-Data Report AZ-91-1, 411 p.
Burkham, DJE., 1972, Channel changes of the Gila River in Safford Valley, Arizona, 1846-1970: U.S. Geological Survey Professional Paper 655-G, 24 p.
Chin, E.H., Aldridge, B.N., and Longfieli, RJ., 1990, Floods of February 1980 in southern California and central Arizona: U.S. Geological Survey Professional Paper 1494,126 p.
Edwards, T.K., and Glysson, G.D., 1988, Field methods for measurement of fluvial sediment U.S. Geological Survey Open-File Report 8 '-531,118 p.
Garrett, J.M., and Gellenbeck, D.J., 1991, Basin characteristics and streamflow statistics in Arizona as of 1989: U.S. Geological Survey Water- Resources Investigations Report 91-4041,612 p.
Graf, J.B., Webb, R.H., and Hereford, Richard, 1991, Relation of sediment load and flood-plain formation to climatic variability, Paria River drainage basin, Utah and Arizona: Geological Society of America Bulletin, v. 103, p. 1405-1415.
Graf, W.L., 1983, Flood-related channel change in an arid-region river: Earth Surface Processes and Landforms, v. 8, p. 125-139.
___1988a, Definition of flood plains along arid-region rivers, in Baker, V.R., Kochel, R.C, and Patton,
36 Channel Change and Sediment Transport In Two Desert Streams In Central Arizona, 1991-82

P.C., eds., Flood geomorphology: New York, John Wiley and Sons, p. 231-241.
_1988b, Fluvial processes in dryland rivers: Berlin,Springer-Verlag, 346 p.
Hays, ME., 1984, Analysis of historic channel change as a method for evaluating flood hazard in the semiarid Southwest: Tucson, Arizona, University of Arizona, master's thesis, 41 p.
Higgins, C.G., 1990, Gully development, with a case study by Hill, B.R., and Lehre, A.K., in Higgins, C.G., and Coates, D.R., eds., Groundwater geomorphology The role of subsurface water in Earth-surface processes and landforms: Boulder, Colorado, Geological Society of America Special Paper 252, p. 139-155.
Hirschboeck, K.K., 1985, Hydroclimatology of flow events in the Gila River basin, central and southern Arizona: Tucson, University of Arizona, doctoral dissertation, 335 p.
Hooke, J.M., 1979, An analysis of the processes of river bank erosion: Journal of Hydrology, v. 42, p. 39-62.
___1980, Magnitude and distribution of rates of river bank erosion: Earth Surface Processes, v. 5, p. 143-157.
Knighton, D., 1984, Fluvial forms and processes: London, Edward Arnold, Ltd., 218 p.
Kochel, R.C., 1988, Geomorphic impact of large floods Review and new perspectives on magnitude and frequency, in Baker, V.R., Kochel, R.C., and Patton, P.C., eds., Flood geomorphology: New York, John Wiley and Sons, p. 169-187.
Matlock, W.G., 1965, The effect of silt-laden water on infiltration in alluvial channels: Tucson, Arizona, University of Arizona, doctoral dissertation, 102 p.
Parker, J.T.C., 1990a, Channel changing processes on the Santa Cruz River, Pima County, Arizona, 1936-1986, in French, R.H., ed., Hydraulics/ Hydrology of Arid Lands Proceedings of the International Symposium: New York, American Society of Civil Engineers, p. 441-446.
___1990b, Temporal variability of lateral channel change on the Santa Cruz River, Pima County, Arizona: American Geophysical Union, EOS Transactions, v. 71, no. 43, October 23, 1990, p. 1322.
___1993, Channel change on the Santa Cruz River, Pima County, Arizona, 1936-86: U.S. Geological Survey Open-File Report 93-41,65 p
Patton, P.C., and Baker, V.R., 1977, Geomorphic response of central Texas stream channels to catastrophic rainfall and runoff, in Dc"hring, D.O., ed., Geomorphology in Arid Regions: Binghamton, New York State University, Publications in Geomorphology, p. 189-217.
Roeske, R.H., Garrett, J.M., and Eychane-r, J.H., 1989, Roods of October 1983 in southeas*ern Arizona: U.S. Geological Survey Water-Resorirces Investi gations Report 85-4225-C, 77 p.
Smith, C.F., Boner, F.C., Davis, R.G., Dret, N.R., and Rigas, P.D., 1993, Water resources data, Arizona, water year 1992: U.S. Geological Survey Water- Data Report AZ-92-1, 360 p.
Smith, W., 1986, The effects of eastern north Pacific tropical cyclones on the southwestern United States: National Oceanic and Atmospheric Administration Technical Memorandum NWS WE-197,229 p.
Statham, I., 1979, Earth surface sediment transport: Oxford, Clarendon Press, 184 p.
Webb, R.H., and Betancourt, J.L., 1992, Climatic variability and flood frequency of the Santa Cruz River, Pima County, Arizona: U.S. Geological Survey Water-Supply Paper 2379,40 p.
White, N.D., and Garrett, W.B., 1987, Water resources data, Arizona, water year 1984: U.S. Geological Survey Water-Data Report AZ-84-1,440 p.
Williams, GP., 1989, Sediment concentration versus water discharge during single hydrologic events in rivers: Journal of Hydrology, v. 111, j\ 89-106.
Wolman, M.G., 1959, Factors influencing erosion of a cohesive river bank: American Journal of Science, v. 257, p. 204-216.
Wolman, M.G., and Gerson, R., 1978, Relative scales of time and effectiveness of climate in watershed geomorphology: Earth Surface Processes, v. 3, p. 189-208.
Wolman, M.G., and Miller, JP., 1960, Magnitude and frequency of forces in geomorplrc processes: Journal of Geology, v. 68, p. 54-74.
Yozwiak, S., 1992, River cuts into landfill returns trash to valley: Phoenix, Arizona, The Arizona Republic, January 8,1992, p. A16.
References Cited 37

SURVEY DATA
The following data are published to facilitate future inoccupation of the cross sections established in this study for investigating channel change. Coordinate values shown in the tables are based on an arbitrary datum. The surveying instrument, a
Nikon Total Station DTM-1, recorded x coordinates from right to left values increased as the instrument was turned to the left. The values in the tables are the same as recorded by the instrument. In order to plot the data in plan view, the X values must be negative to orient the plot properly.
Coordinates for cross-section end points and other reference points, Salt River between 16th and 7th Streets, Phoenix, Arizona[Dashes indicate no data]
Reference
Station 1
Coordinate, in feet
X
5,000
Y
5,000
Z
500
Degrees
Azimuth
Minutes
CommentsSeconds
Station coordinates referenced to topofrebar.
Cross-section end points
1 right
Heft
2 right
2 left
3 right
3 left
4 right
4 left
5 right
5 left
6 right
6 left
7 right
7 left
Bright
7,230.44
7,485.36
6,606.42
6,736.14
5,894.80
6,036.71
5,226.89
5,365.10
4,572.53
4,623.23
3,901.00
3,986.03
3,245.51
3,373.50
2,646.67
4,970.26
6,059.00
5,002.90
5,800.78
4,994.62
5,965.82
4,999.96
5,998.44
5,004.56
5,748.71
5,05238
5,777.04
5,137.80
5,860.79
5,284.83
507.09 506.01
508.98 508.40
502.11 501.36
500.04 499.27
502.02 501.11
498.10 500.16
500.16 499.22
495.51 494.87
499.13 498.34
498.93 498.19
497.77 496.98
498.39 497.62
496.56 495.11
495.34 494.46
495.11 494.32
359
23
000
359
...
359
69
179
116
177
142
175
152
173
14
4
6
39
59
54
23
42
16
32
30
6
5
4 End points momimented with rebar driven into ground with about 0.5 foot exposed.
43 Do.
12 Do.
Do.
20 Do.
Do.
22 Do.
51 Do.
19 Do.
46 Do.
17 Do.
10 Do.
32 Do.
40 Do.
54 Do.
Survey Data 39

Coordinates for cross-section end points and other reference points, Sah River between 16th and 7th St-^ets, Phoenix, Arizona Continued
ReferenceCoordinate, in feet Azimuth
Degrees Minutes SecondsComments
Cross-section end points Continued
8 left
9 right
9 left
2,787.73
2,121.46
2,298.47
5,860.63
5,441.98
6,102.36
488.82488.13
495.41494.71
495.17494.68
158
171
157
44
16
48
56
15
7
Do.
Only end points of cross section9 were surveyed.
End points rmnrimented withrebar driven intc ground withabout 0.5 feet exposed.
Other reference points
RM-1
RM-2
RM-3
RM-4
4.987.89
7,628.00
5,025.36
6,055.18
7,460.09 5,416.19
7,269.78 4,967.94
494.80 115 31 00 Chiseled "X" on verticalconcrete pipe in banks below Station 1.
513.17 358 28 00 Top of southwest anchor bolt inhandrail support on southwest end of 16th Street bridge, painted orange.
518.56 267 45 00 Middle of chiseled cross incenter of white painted cross (aerial photograph point) in middle of 16th Street, about 460 feet south of RM-3 and 620 feet north of RM-2, painted orange.
511.74 258 49 24 Top of northwest anchor bolt inhandrail support on northwest end of 16th Street bridge, painted orange.
40 Channel Change and Sediment Transport in Two Desert Strasms in Central Arizona, 1991-92
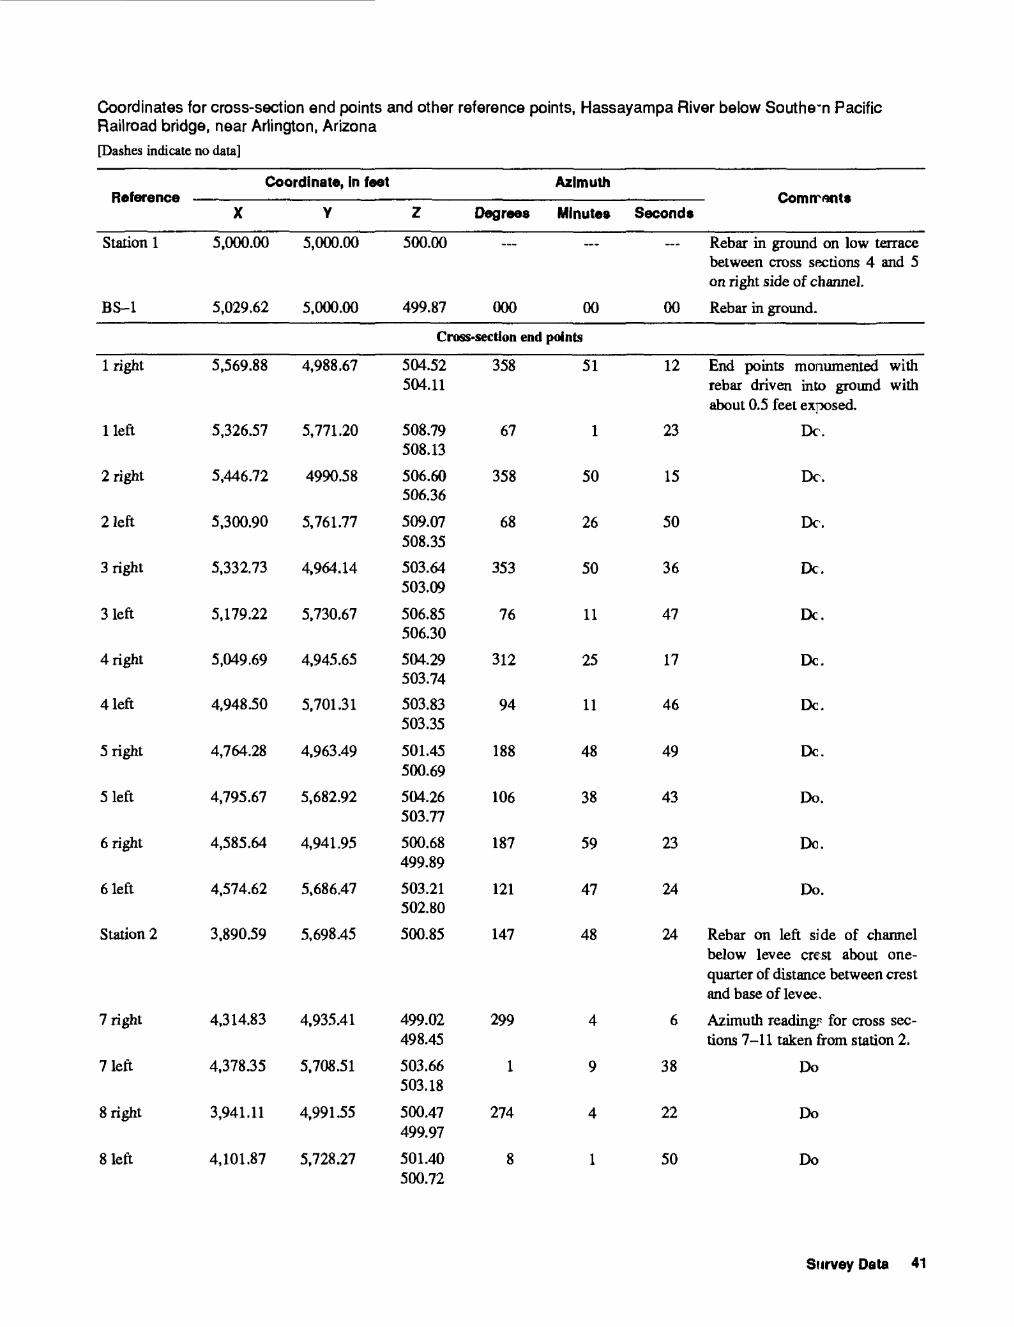
Coordinates for cross-section end points and other reference points, Hassayampa River bebw Southe*n Pacific Railroad bridge, near Arlington, Arizona[Dashes indicate no data]
Reference
Station 1
BS-1
Coordinate, In feet
X
5,000.00
5,029.62
Y
5,000.00
5,000.00
Z
500.00
499.87
Degree*
000
Azimuth
Minute*
00
Seconds
00
ComrranU
Rebar in ground on low terrace between cross sections 4 and 5 on right side of channel.
Rebar in ground.
Cross-section end points
1 right
lleft
2 right
2 left
3 right
3 left
4 right
4 left
5 right
5 left
6 right
6 left
Station 2
7 right
7 left
8 right
8 left
5,569.88
5,326.57
5,446.72
5,300.90
5,332.73
5.179.22
5,049.69
4,948.50
4,764.28
4,795.67
4,585.64
4,574.62
3,890.59
4,314.83
4,378.35
3,941.11
4,101.87
4,988.67
5,771.20
4990.58
5,761.77
4,964.14
5,730.67
4,945.65
5,701.31
4,963.49
5,682.92
4,941.95
5,686.47
5,698.45
4,935.41
5,708.51
4,991.55
5,728.27
504.52 504.11
508.79 508.13
506.60 506.36
509.07 508.35
503.64 503.09
506.85 506.30
504.29 503.74
503.83 503.35
501.45 500.69
504.26 503.77
500.68 499.89
503.21 502.80
500.85
499.02 498.45
503.66 503.18
500.47 499.97
501.40 500.72
358
67
358
68
353
76
312
94
188
106
187
121
147
299
1
274
8
51
1
50
26
50
11
25
11
48
38
59
47
48
4
9
4
1
12
23
15
50
36
47
17
46
49
43
23
24
24
6
38
22
50
End points monumented with rebar driven into ground with about 0.5 feet exposed.
DC.
DC.
DC.
DC.
DC.
DC.
DC.
DC.
Do.
Do.
Do.
Rebar on left side of channel below levee crest about one- quarter of distance between crest and base of levee.
Azimuth reading? for cross sec tions 7-11 taken from station 2.
Do
Do
Do
Survey Data 41
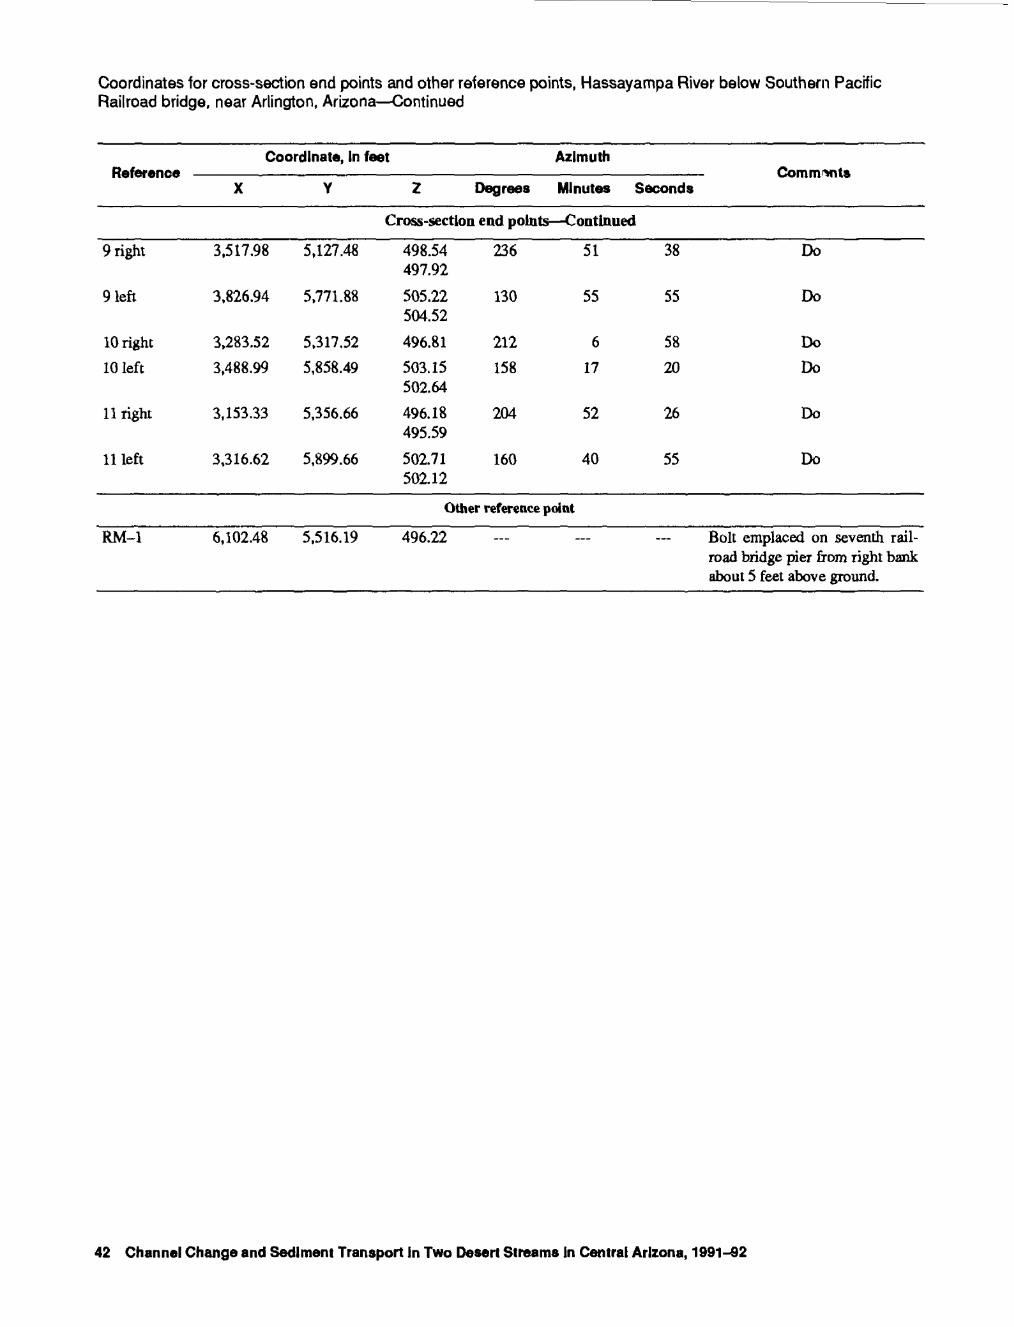
Coordinates for cross-section end points and other reference points, Hassayampa River below Southern Pacific Railroad bridge, near Arlington, Arizona Continued
Coordinate, In feetReference
X Y Z
Azimuth
Degrees Minutes SecondsComnrwts
Cross-section end points Continued
9 right
9 left
10 right
10 left
11 right
11 left
3,517.98
3,826.94
3,283.52
3,488.99
3,153.33
3,316.62
5,127.48
5,771.88
5,317.52
5,858.49
5,356.66
5,899.66
498.54497.92
505.22504.52
496.81
503.15502.64
496.18495.59
502.71502.12
236
130
212
158
204
160
51 38
55 55
6 58
17 20
52 26
40 55
Do
Do
Do
Do
Do
Do
Other reference point
RM-1 6,102.48 5,516.19 496.22 . Bolt emplaced on seventh railroad bridge pier from right bankabout 5 feet above ground.
42 Channel Change and Sediment Transport In Two Desert Streams In Central Arizona, 1991-82