changing picture of listeria in the dairy from recent...
TRANSCRIPT
The changing picture of Listeria in the dairy industry: insights from recent outbreaks
Martin WiedmannDepartment of Food ScienceCornell University, Ithaca, NYE‐mail: [email protected]
Phone: 607‐254‐2838

Outline• The changing food safety pictures• Environmental sources of pathogens (and spoilage
organisms)• Environmental pathogen control programs
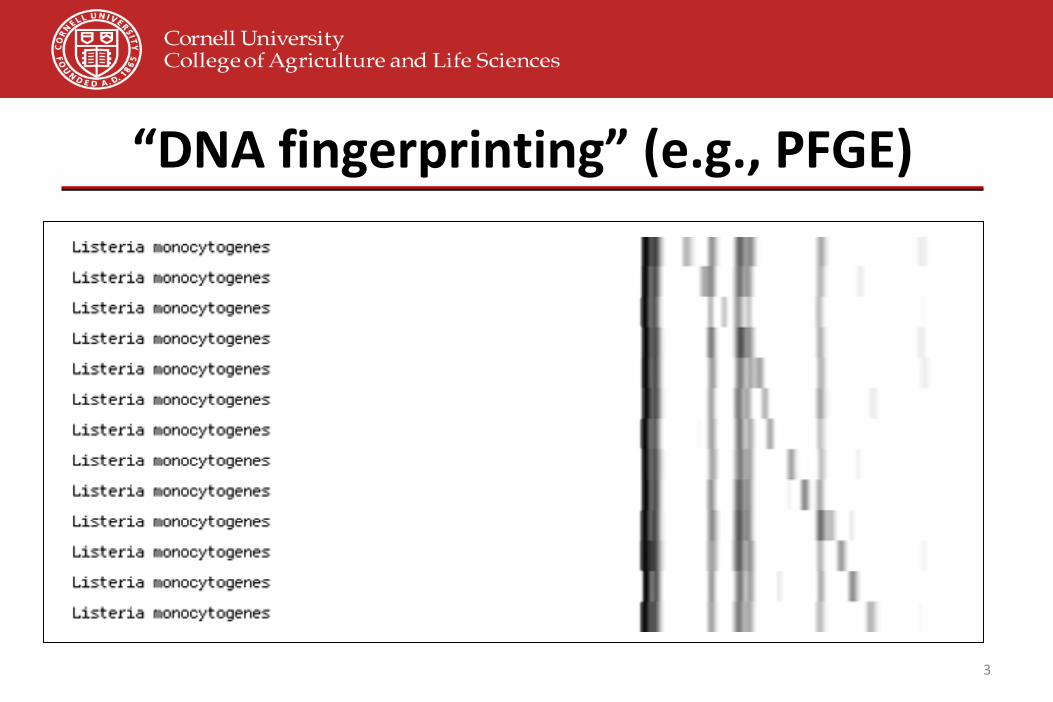
“DNA fingerprinting” (e.g., PFGE)
3

Case study – human listeriosis
outbreak

Human listeriosis cases in NYS: 1/97‐10/98
0
1
2
3
4
5
6
7
8
Jan
Mar
May Jul
Sep Nov Jan
Mar Jun
Aug
Oct

Subtyping results – part I

Subtyping results – part II
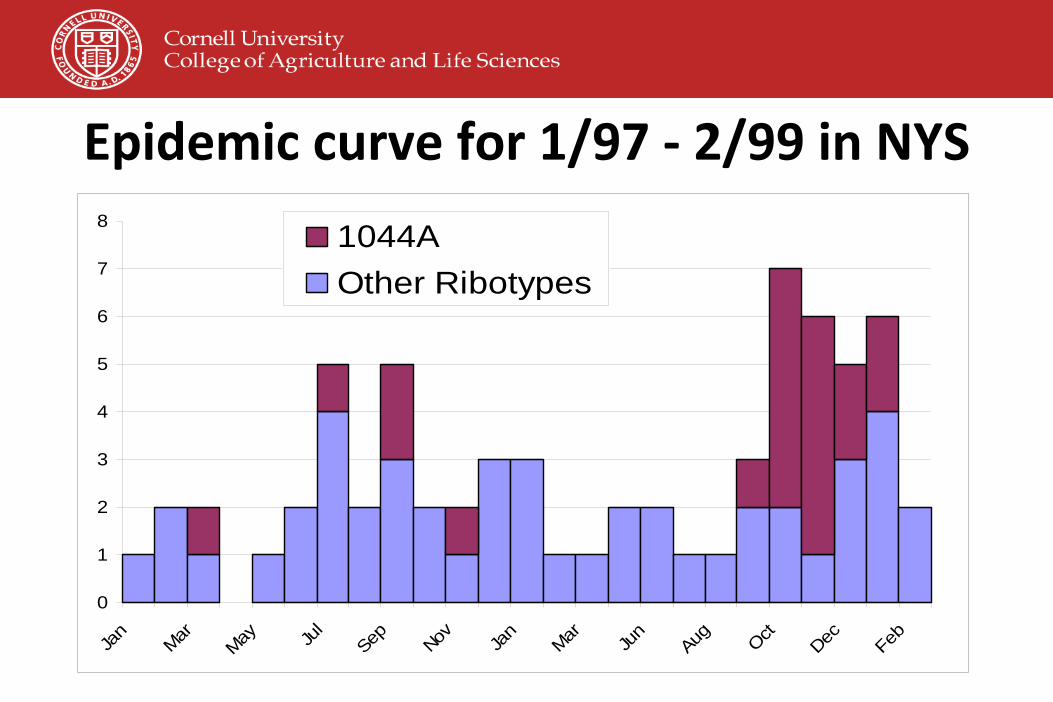
Epidemic curve for 1/97 ‐ 2/99 in NYS
0
1
2
3
4
5
6
7
8
Jan
Mar
May Jul
Sep Nov Jan
Mar Jun
Aug Oct
Dec Feb
1044AOther Ribotypes

Outbreak traced back to a single specific plant in MichiganPlant had an appropriate HACCP plan

Outbreak traced back to a single specific plant in MichiganPlant had an appropriate HACCP planL. monocytogenes source was post‐CCP contamination from
plant environment
PulseNetPulseNet
USAUSA
PulseNet PulseNet EuropeEurope
PulseNet PulseNet Asia Asia PacificPacific
PulseNetPulseNetLatin America Latin America & Caribbean& Caribbean
PulseNetPulseNetMiddle EastMiddle East
PulseNet CanadaPulseNet Canada
PulseNetPulseNet
USAUSA
PulseNet PulseNet EuropeEurope
PulseNet PulseNet Asia Asia PacificPacific
PulseNetPulseNetLatin America Latin America & Caribbean& Caribbean
PulseNetPulseNetMiddle EastMiddle East
PulseNet CanadaPulseNet Canada
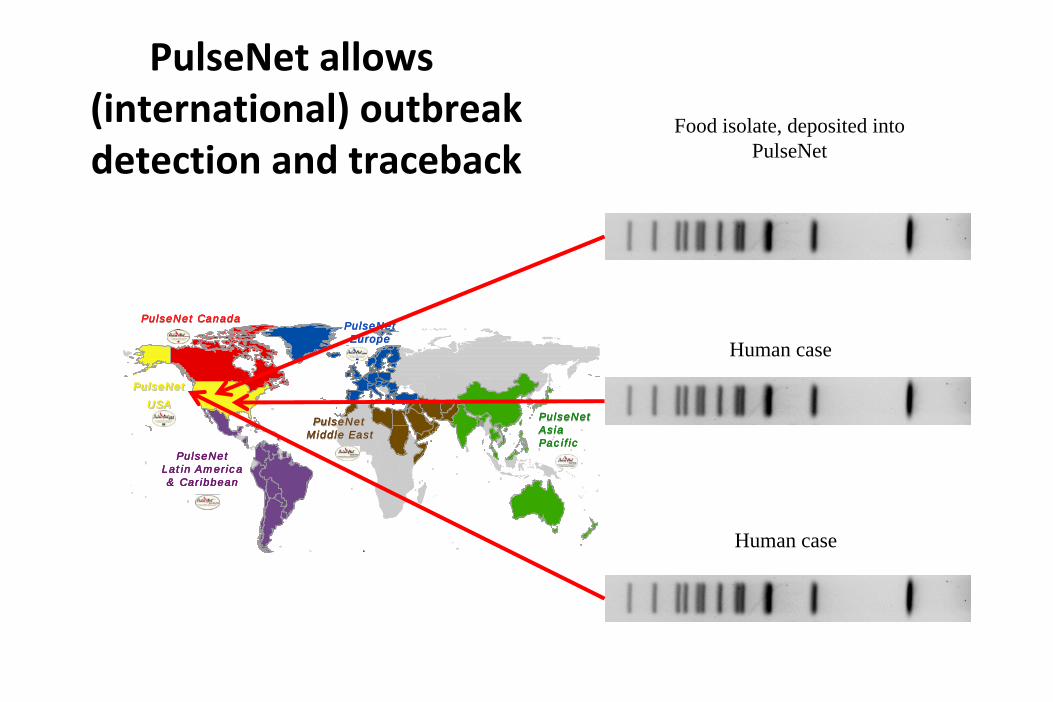
PulseNet allows (international) outbreak
detection and tracebackFood isolate, deposited into
PulseNet
Human case
Human case

The genome sequence revolution
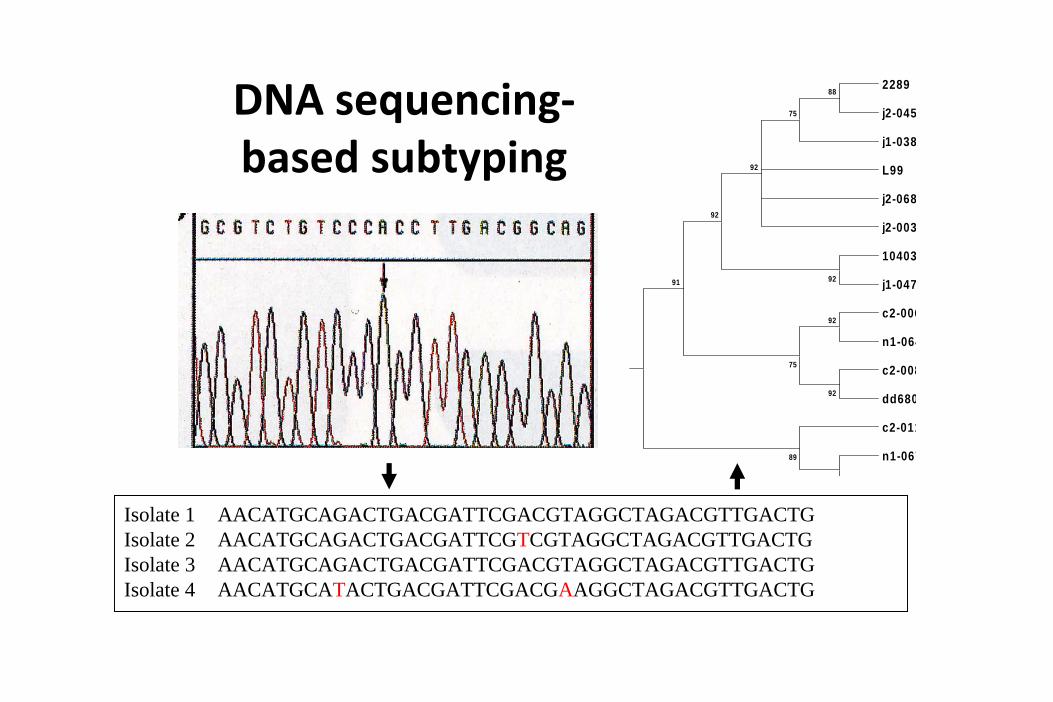
DNA sequencing‐ based subtyping
Isolate 1 AACATGCAGACTGACGATTCGACGTAGGCTAGACGTTGACTGIsolate 2 AACATGCAGACTGACGATTCGTCGTAGGCTAGACGTTGACTGIsolate 3 AACATGCAGACTGACGATTCGACGTAGGCTAGACGTTGACTGIsolate 4 AACATGCATACTGACGATTCGACGAAGGCTAGACGTTGACTG
2289
j2-045
j1-038
L99
j2-068
j2-003
10403
j1-047
c2-006
n1-064
c2-008
dd680
c2-011
n1-067
92
92
92
88
75
92
92
92
75
91
89
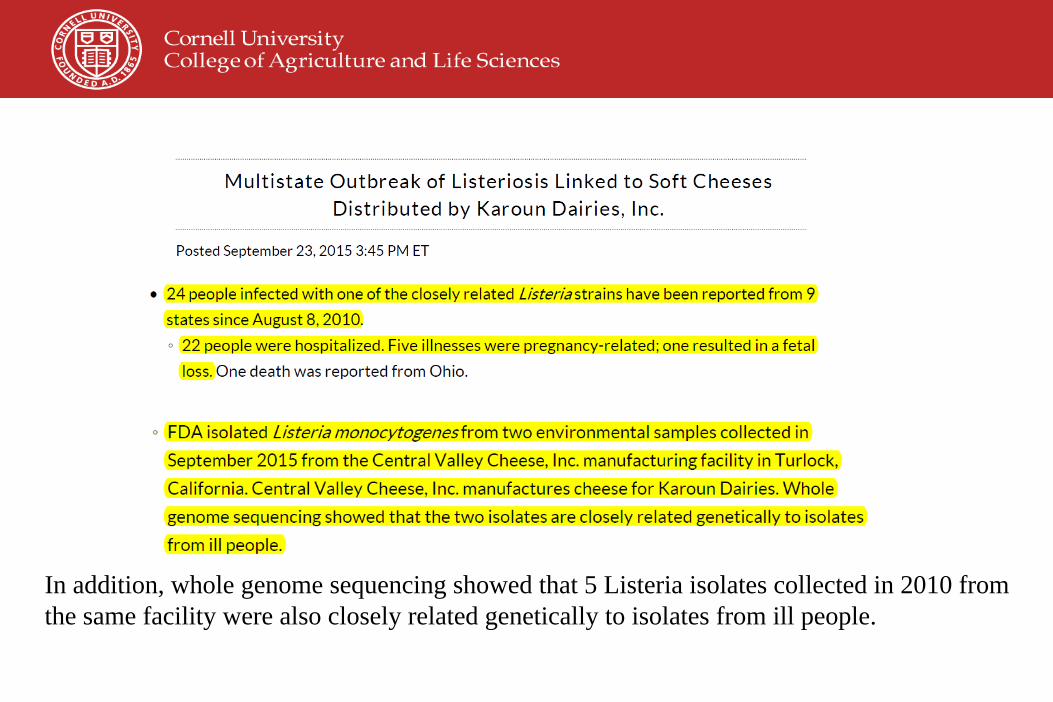
In addition, whole genome sequencing showed that 5 Listeria isolates collected in 2010 from the same facility were also closely related genetically to isolates from ill people.

Multistate Outbreak of Listeriosis Linked to Roos Foods Dairy Products
• Feb 2014• A total of eight persons infected with the outbreak strain
of Listeria monocytogenes were reported from two states: California (1) and Maryland (7)
– 7 ill persons were hospitalized. One death was reported in
California. Five of the illnesses (2 mother‐newborn pairs and a
newborn) were related to pregnancy.
• Whole‐genome sequences of the Listeria strains isolated from Roos Foods cheese products were available after
the recall and were found to be highly related to sequences of the Listeria strains isolated from the
patients
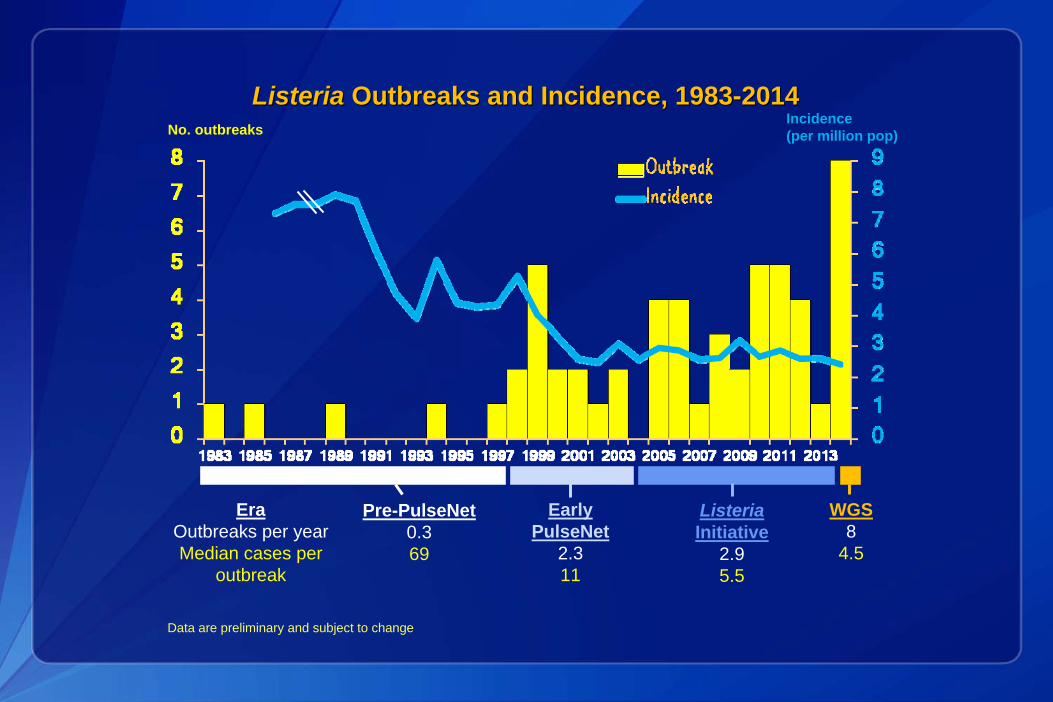
ListeriaListeria Outbreaks and Incidence, 1983Outbreaks and Incidence, 1983--20142014
Pre-PulseNet 0.369
Early PulseNet
2.311
Listeria Initiative
2.95.5
No. outbreaksIncidence (per million pop)
EraOutbreaks per yearMedian cases per
outbreak
WGS8
4.5
Data are preliminary and subject to change

At a Glance:Case Count: 10States: 4Deaths: 3Hospitalizations: 10Recall: Yes
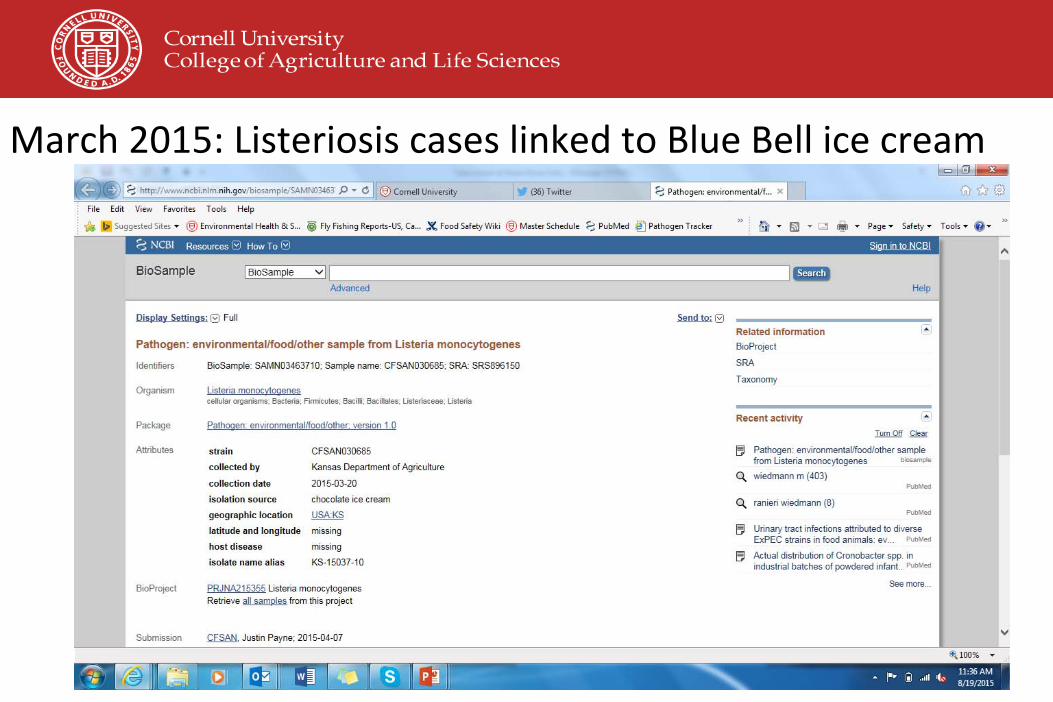
March 2015: Listeriosis cases linked to Blue Bell ice cream


Capri Sun
27,145 likes407,794 shares
https://www.facebook.com/photo.php?fbid=3665369692466&set=a.1561209289771.62897.1821484578&type=1
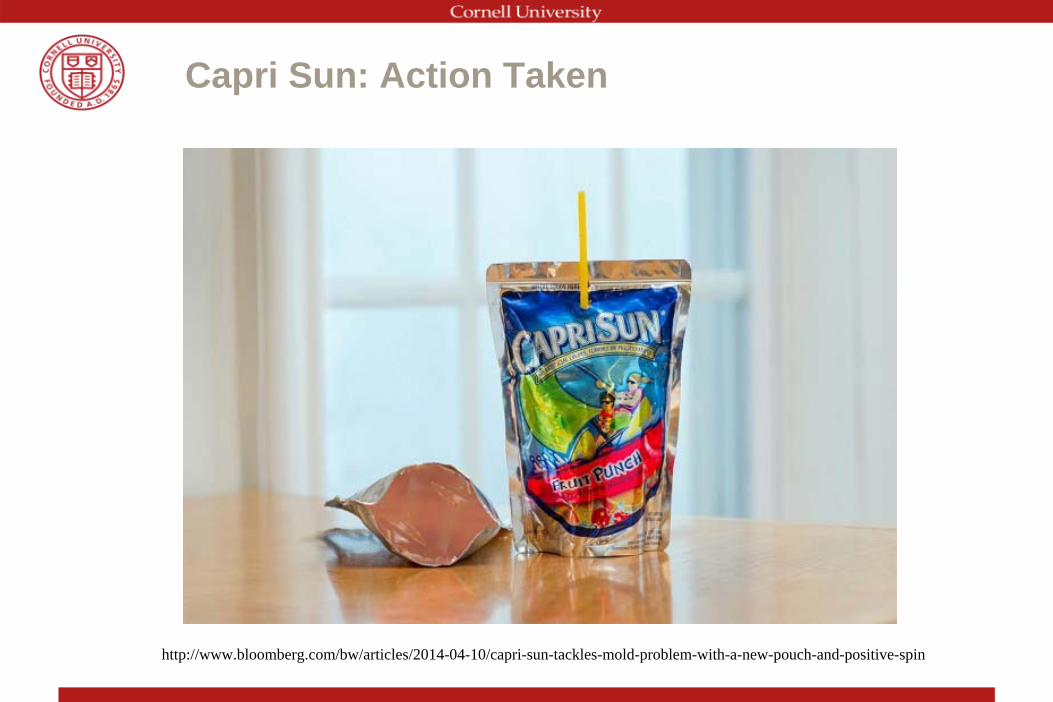
Capri Sun: Action Taken
http://www.bloomberg.com/bw/articles/2014-04-10/capri-sun-tackles-mold-problem-with-a-new-pouch-and-positive-spin
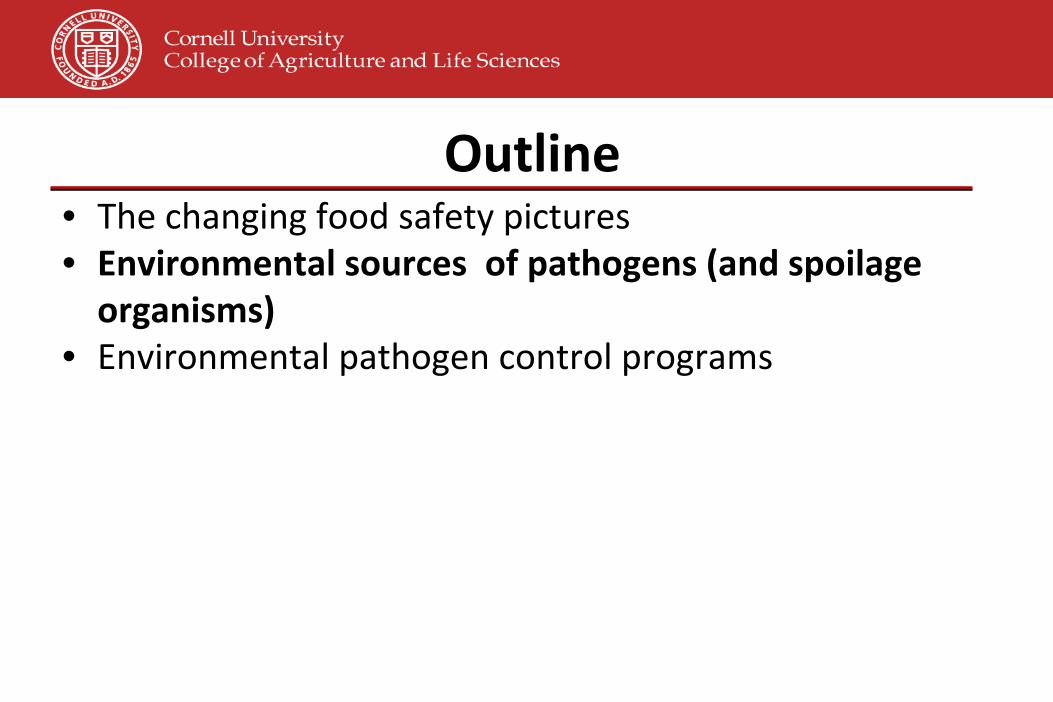
Outline• The changing food safety pictures• Environmental sources of pathogens (and spoilage
organisms)• Environmental pathogen control programs
Sample Source
*
VISIT 2
VISIT 3
VISIT 1
****
********
***
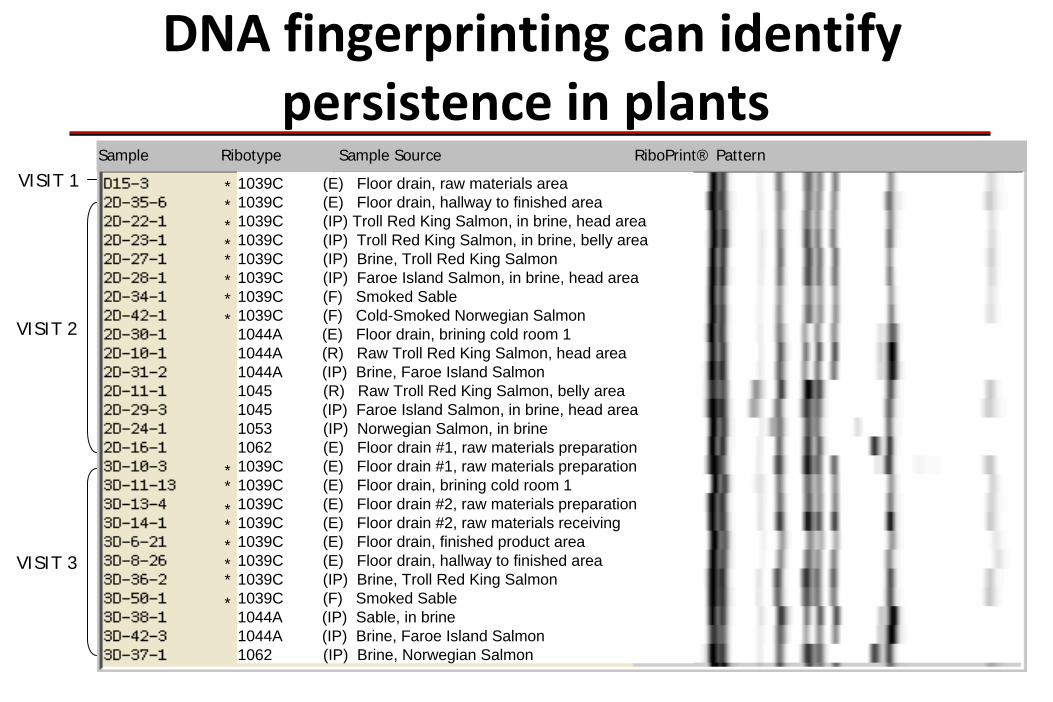
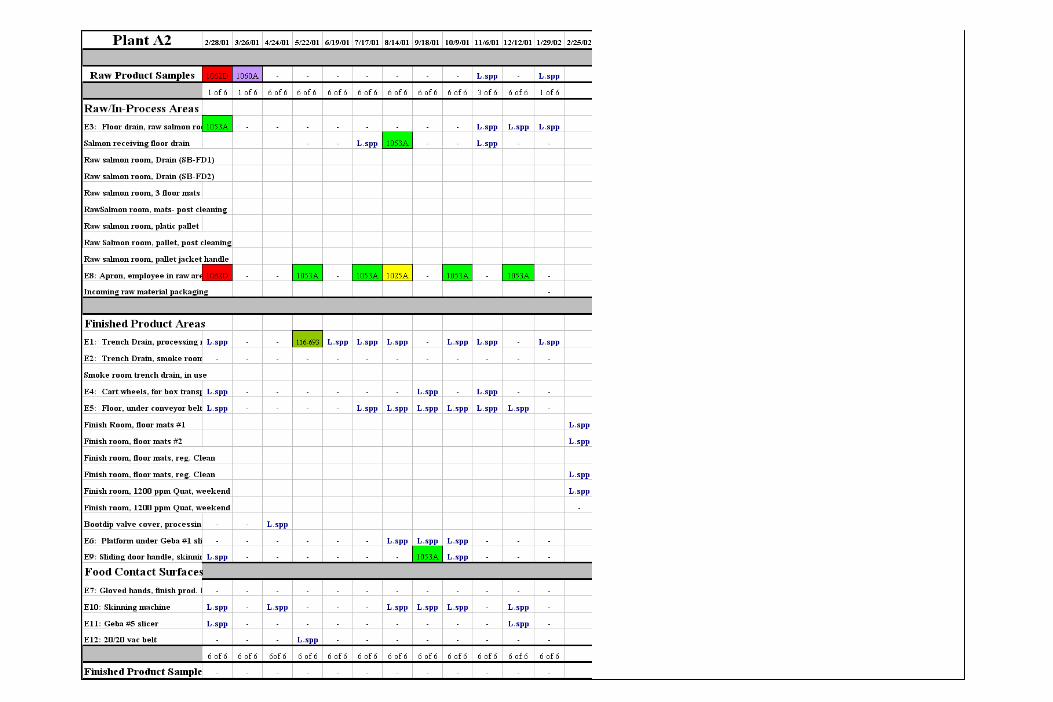
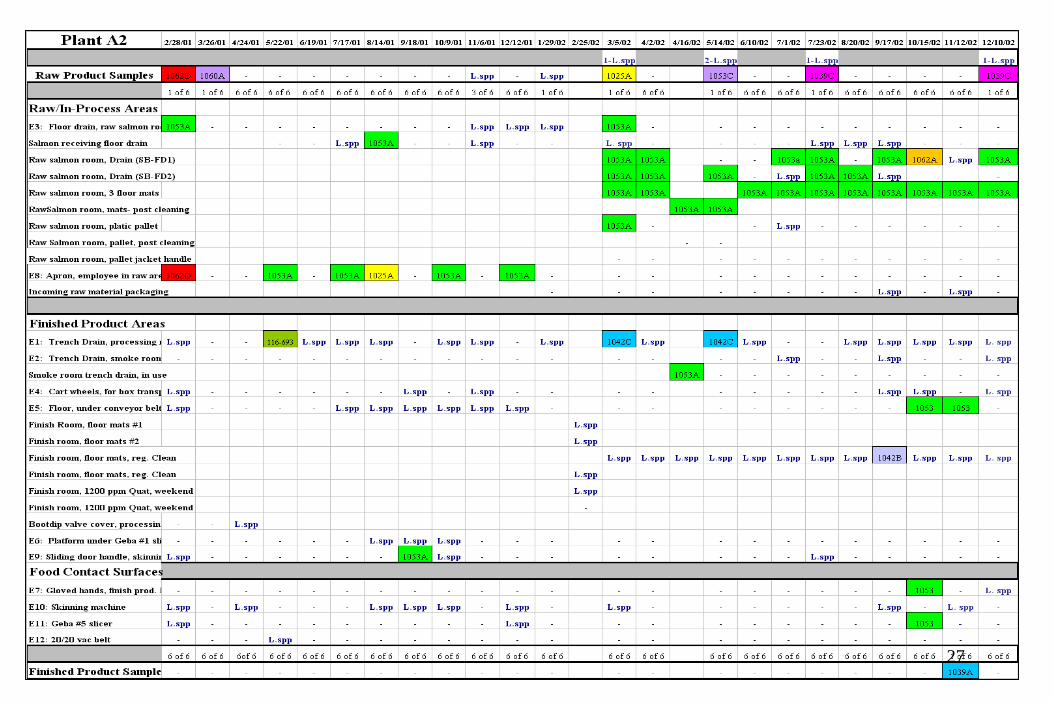
Sample Ribotype Sample Source RiboPrint® Pattern
1039C (E) Floor drain, raw materials area1039C (E) Floor drain, hallway to finished area1039C (IP) Troll Red King Salmon, in brine, head area1039C (IP) Troll Red King Salmon, in brine, belly area1039C (IP) Brine, Troll Red King Salmon1039C (IP) Faroe Island Salmon, in brine, head area1039C (F) Smoked Sable1039C (F) Cold-Smoked Norwegian Salmon1044A (E) Floor drain, brining cold room 11044A (R) Raw Troll Red King Salmon, head area1044A (IP) Brine, Faroe Island Salmon1045 (R) Raw Troll Red King Salmon, belly area1045 (IP) Faroe Island Salmon, in brine, head area1053 (IP) Norwegian Salmon, in brine1062 (E) Floor drain #1, raw materials preparation1039C (E) Floor drain #1, raw materials preparation1039C (E) Floor drain, brining cold room 11039C (E) Floor drain #2, raw materials preparation1039C (E) Floor drain #2, raw materials receiving1039C (E) Floor drain, finished product area1039C (E) Floor drain, hallway to finished area1039C (IP) Brine, Troll Red King Salmon1039C (F) Smoked Sable1044A (IP) Sable, in brine1044A (IP) Brine, Faroe Island Salmon1062 (IP) Brine, Norwegian Salmon
DNA fingerprinting can identify persistence in plants

House bugs & pet Listeria
Samples
Plant B
n=129
Plant C
n=173
Plant D
n=229
P-value
Ribotype % Prevalence
1039C 0.0 0.0 10.0 0.0000
1042B 0.8 1.2 0.4 0.8221
1042C 6.2 0.6 0.4 0.0003
1044A 0.0 2.3 3.1 0.1494
1045 5.4 0.0 0.9 0.0006
1046B 0.0 2.3 0.0 0.0144
1053 0.0 0.6 1.7 0.2686
1062 0.8 0.6 2.6 0.1822
26
27

L. monocytogenes persisted in rubber floor
mats despite sanitation
Listeria can be protected from sanitizer in “micro-cracks”, but can be squeezed out by pressure if people stand on mats
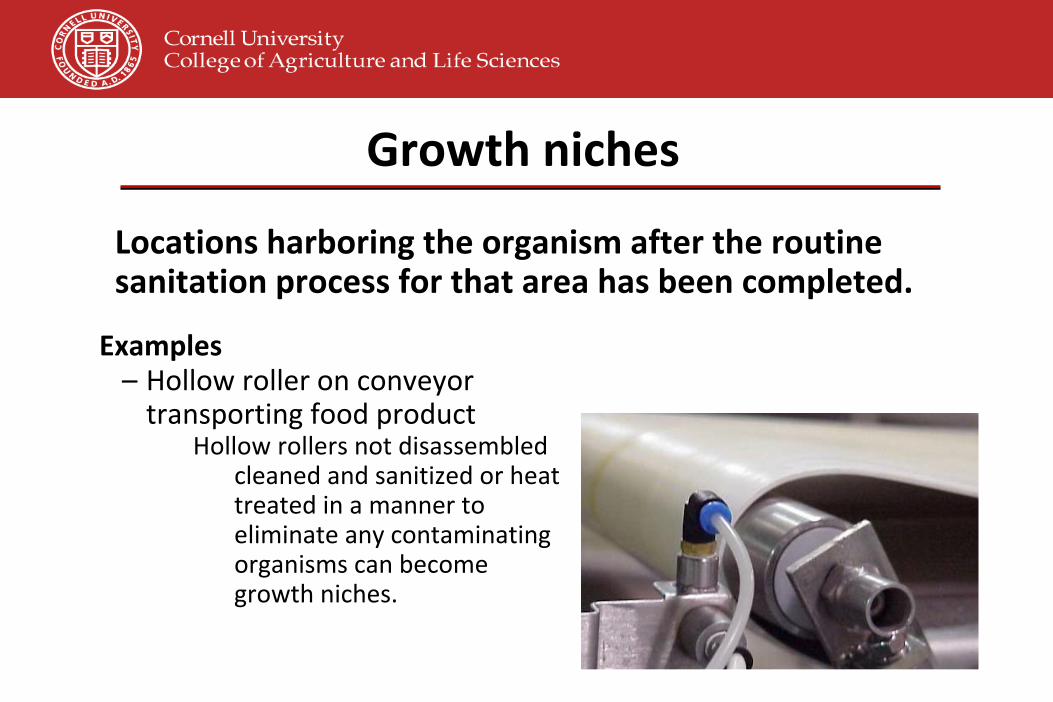
Growth niches
Locations harboring the organism after the routine sanitation process for that area has been completed.
Examples–
Hollow roller on conveyor
transporting food product
Hollow rollers not disassembled
cleaned and sanitized or heat
treated in a manner to
eliminate any contaminating
organisms can become
growth niches.
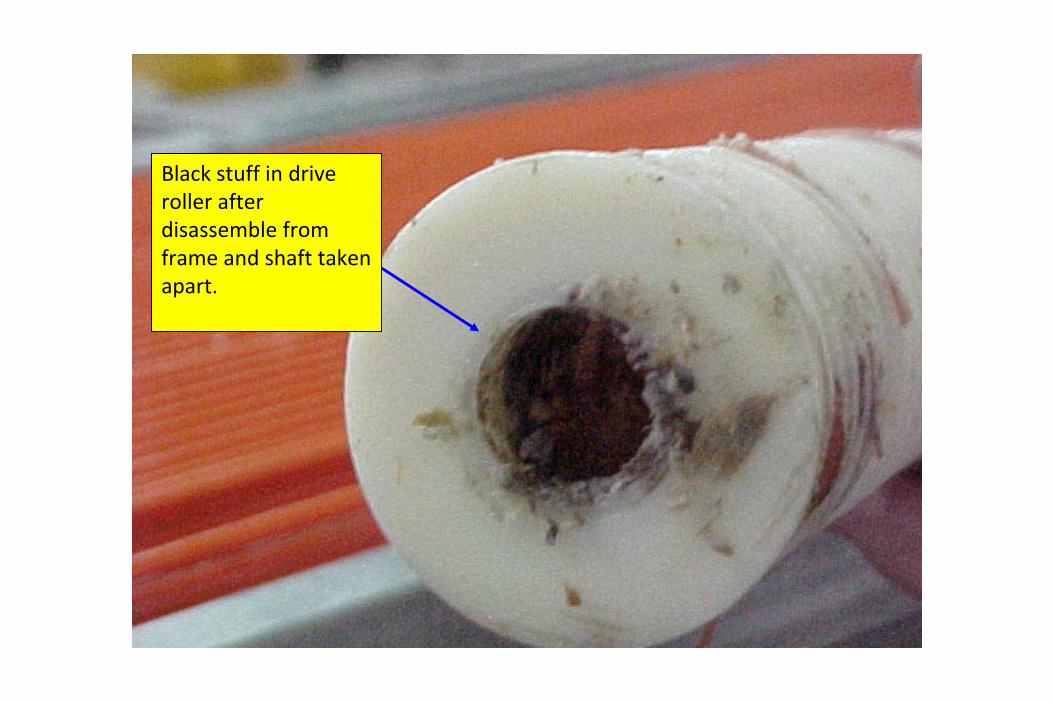
Black stuff in drive
roller after
disassemble from
frame and shaft taken
apart.
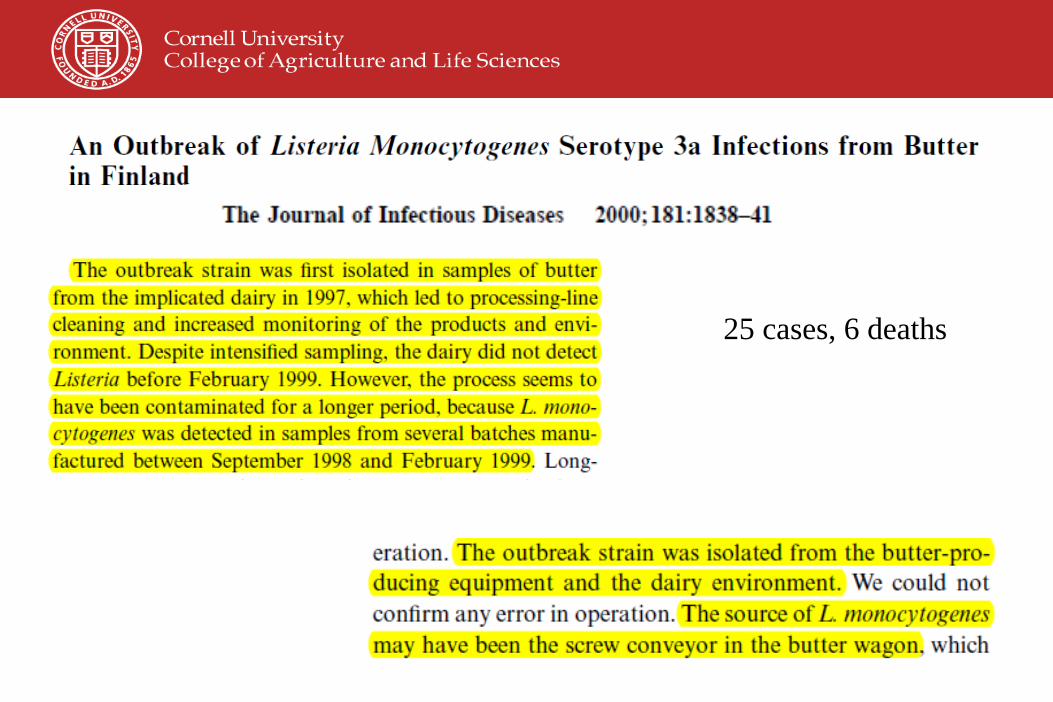
25 cases, 6 deaths

2000 US outbreak ‐ Environmental
persistence of L. monocytogenes? • 1988: one human listeriosis case linked to hot dogs produced
by plant X• 2000: 29 human listeriosis cases linked to sliced turkey meats
from plant X
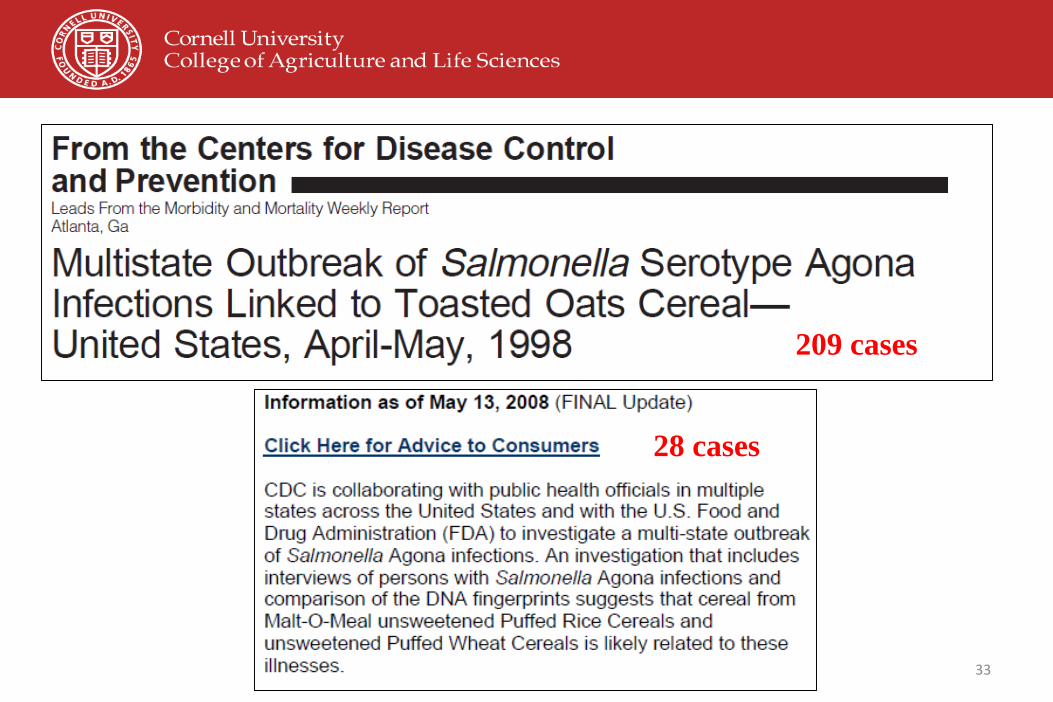
33
209 cases
28 cases

Summary – environmental pathogen
sources and persistence• Persistent environmental contamination with L.
monocytogenes has been reported in almost all types of food processing plants, including RTE seafood plants (> 10 years),
dairy plants; RTE meat plants (>12 years), etc.• A number of listeriosis outbreaks have been linked to
persistent L. monocytogenes contamination in source plants• Industry has adapted the “Seek and Destroy”
strategy to
address this issue
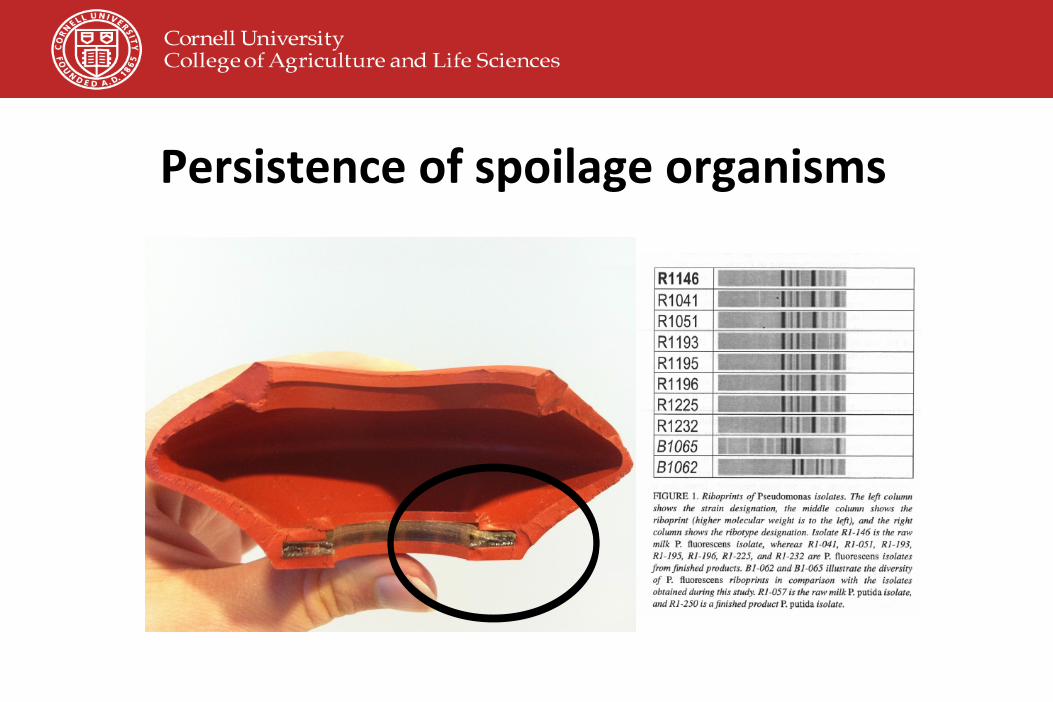
Persistence of spoilage organisms
Outline• The changing food safety pictures• Environmental sources of pathogens (and spoilage
organisms)• Environmental pathogen control programs
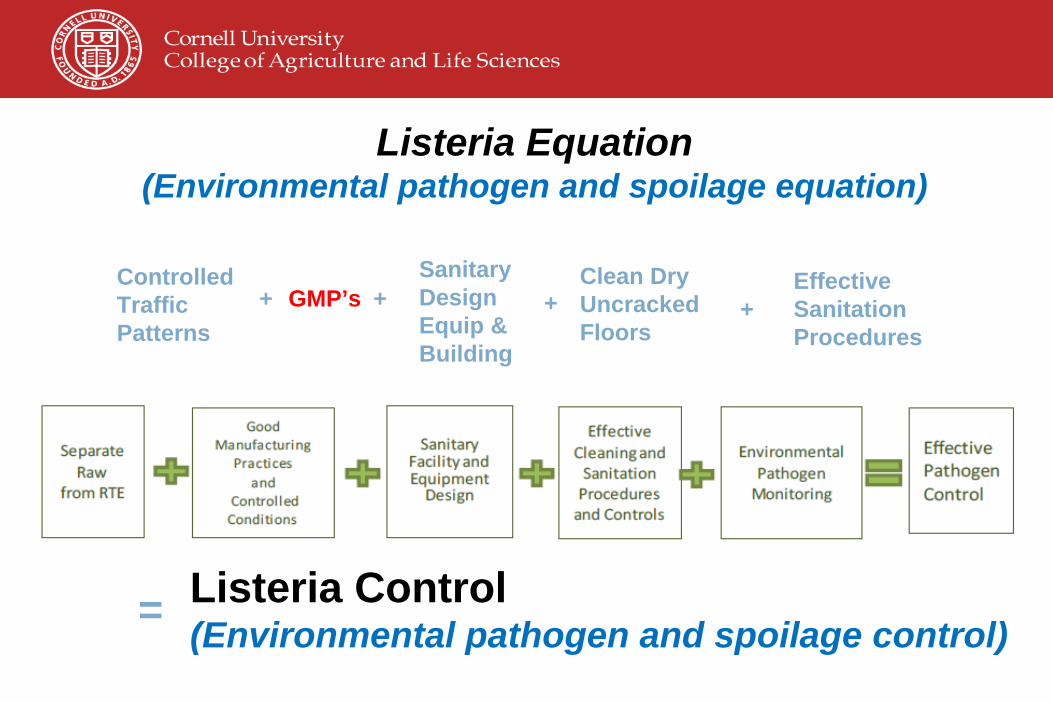
Controlled Traffic Patterns
GMP’sClean Dry Uncracked Floors
Sanitary Design Equip & Building
Effective Sanitation Procedures
Listeria Control(Environmental pathogen and spoilage control)=
++ ++
Listeria Equation(Environmental pathogen and spoilage equation)
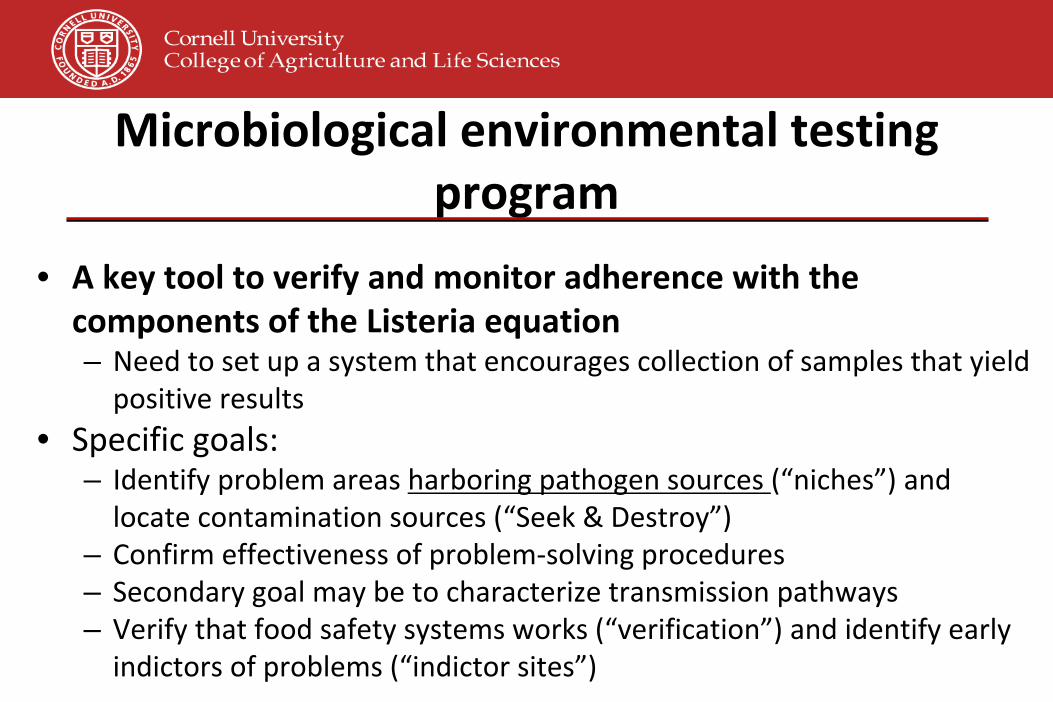
Microbiological environmental testing program
• A key tool to verify and monitor adherence with the components of the Listeria equation
– Need to set up a system that encourages collection of samples that yield
positive results• Specific goals:
– Identify problem areas harboring pathogen sources (“niches”) and
locate contamination sources (“Seek & Destroy”)– Confirm effectiveness of problem‐solving procedures– Secondary goal may be to characterize transmission pathways– Verify that food safety systems works (“verification”) and identify early
indictors of problems (“indictor sites”)
Designing environmental sampling plans
• Sampling plans need to be developed individually for each plant– Layout, production schedules, facility design
• Trend is towards regulatory agencies recommending environmental sampling
– Regulators may perform sampling if there are no data supporting that sampling is
done by the facility

41
Where to test – the zone concept

Where to test
• Niches:– Hallow rollers, table legs, etc.; floor wall junctures; floor cracks;
difficult to clean areas; seals on doors, etc.
– Sampling of niches more likely to identify source• Transfer points:
– Hands, door handles – Sampling of transfer points requires follow up to identify source
• Some areas could be both– Key boards

Where to sample if you hear
“If sampling reveals the presence of Listeria species, it is important that
the processor immediately shuts down the plant and implements an
aggressive sanitation protocol and resampling until Listeria is not found.”
(KSU professor in IFT ePerspectives)
“Our company goal for 2016 is zero Listeria environmental positives”
(Anonymous)
“FDA will collect 100s of environmental samples in your plant if your
records show a single Listeria positive” (industry rumors after an FDA
visit and record review, followed by FDA swab‐a‐thon)
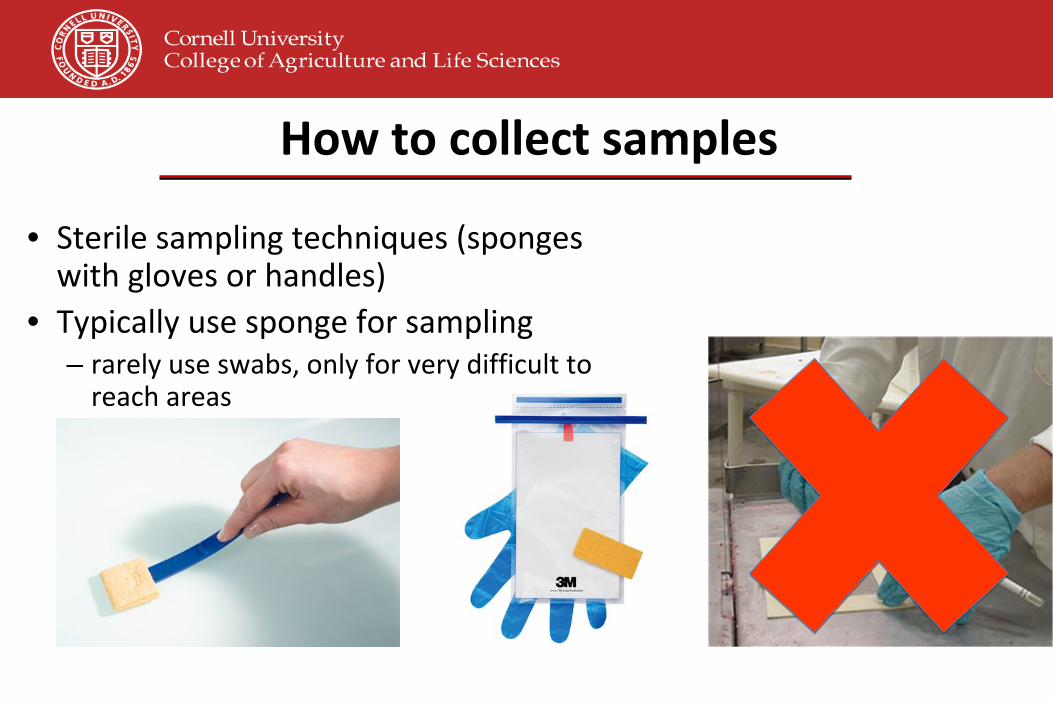
How to collect samples
• Sterile sampling techniques (sponges
with gloves or handles)• Typically use sponge for sampling
– rarely use swabs, only for very difficult to
reach areas
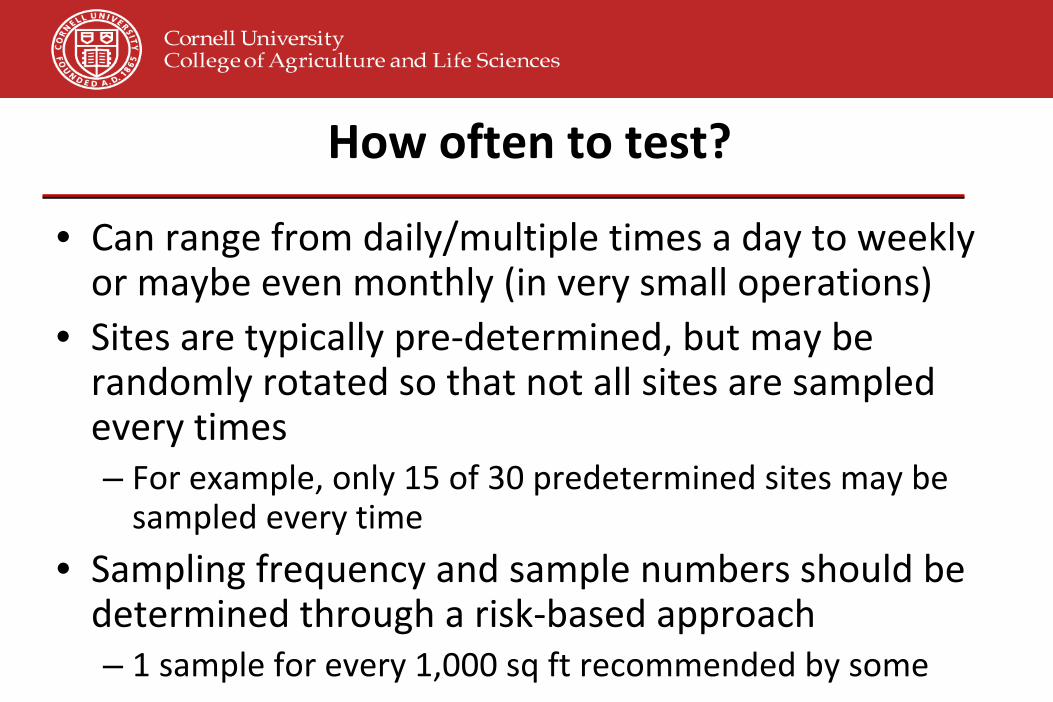
How often to test?
• Can range from daily/multiple times a day to weekly or maybe even monthly (in very small operations)
• Sites are typically pre‐determined, but may be randomly rotated so that not all sites are sampled
every times– For example, only 15 of 30 predetermined sites may be
sampled every time• Sampling frequency and sample numbers should be
determined through a risk‐based approach– 1 sample for every 1,000 sq ft recommended by some

Guidelines for follow‐up and corrections• Corrections based on positive samples need to be plant specific and may differ by
zone
• Trend towards increased frequency of pathogen detection needs to
be investigated
to determine reason and action needs to be taken to reduce frequency
• Additional samples should be taken from environmental area that showed positive
results (“vector swabbing”)
• Positive samples should be followed up with additional investigations and root
cause analyses
as well as intensified cleaning and sanitation (“deep cleaning”)• Corrective actions must go beyond “deep cleaning”
and may include: – Cleaning and sanitation procedures and SSOPs may need to be changed– Maintenance may be needed and preventive maintenance program may
need to be
improved
– Equipment may have to be modified and replaced– Problem areas may have to be shut down temporarily
• Consider if a test and hold program is needed
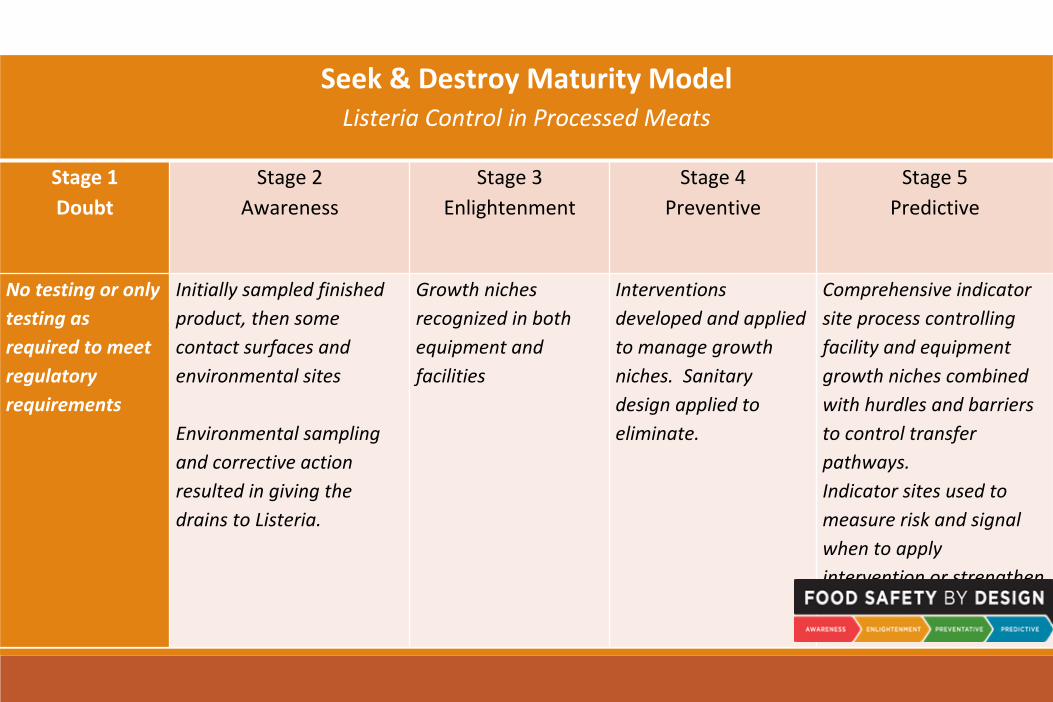
Seek & Destroy Maturity ModelListeria Control in Processed Meats
Stage 1
Doubt
Stage 2
Awareness
Stage 3
Enlightenment
Stage 4
Preventive
Stage 5
Predictive
No testing or only
testing as
required to meet
regulatory
requirements
Initially sampled finished
product, then some
contact surfaces and
environmental sites
Environmental sampling
and corrective action
resulted in giving the
drains to Listeria.
Growth niches
recognized in both
equipment and
facilities
Interventions
developed and applied
to manage growth
niches. Sanitary
design applied to
eliminate.
Comprehensive indicator
site process controlling
facility and equipment
growth niches combined
with hurdles and barriers
to control transfer
pathways.Indicator sites used to
measure risk and signal
when to apply
intervention or strengthen
hurdle

Solid pulleySolid pulleyHollow pulleyHollow pulley
No Food Product or Liquid CollectionApplying the 10 Principles of Sanitary Design
From This To This
Previous Design Sanitary Redesign

Free of Growth niches
From This To This
Previous Design Sanitary Redesign

Ponding water
Poor repairs
Wet floors are a super highway
Must address floors or equipment will be
reseeded……remember the hollow roller
From This To This
Previous Design Sanitary Redesign

How do you know your program is working – routine sampling and validation
Plant ID Prevalence(from routine)
Prevalence(from validation)
A 5.12% (34/664)
1.33%(2/150)
E 11.97% (88/735)
10%(6/60)
F <0.3% (0/334)
6%(3/50)
G 8.33%(19/228)
2.35%(2/85)
H 22.64% (24/106)
8%(2/50)
J 0.94% (1/106)
14%(7/50)

Summary and conclusions• Food processing environment is an important source of
pathogens and spoilage organisms (including, but not limited to L. monocytogenes)
– Pathogens that persist in processing environment have been
linked to costly recalls and outbreaks• Pathogen Environmental Monitoring (PEM) Programs are
a critical component of food safety– Virtually all processing plants would need a PEM program– Results need to be used for immediate corrective actions
as well as long term improvements (equipment design etc.)

Proposed Action items
• Make sure business risks due to food safety and food spoilage issues are known and communicated in your company
• Make sure your company’s leadership shows commitment to food safety and does not unintentionally send the wrong
messages• Assure that your company has a robust pathogen and microbial
environmental monitoring programs that drive both short term corrective actions and long term improvements

FSMA’s stance on PEM