changing occupational structures? the dutch labour market, c
TRANSCRIPT
Changing occupational structures? The Dutch labour market, c. 1580-1900∗
Paper prepared for the session “The Divergence of National Occupational Structures
1500 to 1850” at the World Congress of the International Economic History Association,
Helsinki (Finland) 21-25 August 2006
Danielle van den Heuvel and Elise van Nederveen Meerkerk
Draft paper; please do not quote without the authors’ permission
Introduction
In recent years, debates on modern economic development have become a central
issue, not only in politics but also in the academic field. Bookstores all over the globe
count numerous works on this theme, new ones appearing regularly, and newspapers
are filled with articles and discussions on the subject. Within academia not only
economists but also historians have become increasingly involved in debates on the
origination of the divide between richer and poorer countries.1 One of the central
questions is what lies at the basis of a country’s economic success. A ‘modern’ structure
of the labour market, with a relatively low share of the population in the primary sector, a
high degree of specialization and high levels of wage labour, is often considered to be
one of the driving forces behind economic achievement. With this paper we therefore
want to investigate (changes in) the occupational structure of the Netherlands.
In general the Dutch Republic is regarded as an economically very successful
country. Several historians have stressed the remarkably ‘modern’ structure of the Dutch
economy in the early modern period.2 Supposedly, the Northern Netherlands seems to
have had a very ‘modern’ occupational structure already around 1500 with a relatively
low percentage of the population working in agriculture, even in the countryside. For
∗ With special thanks to Lex Heerma van Voss, Jan Lucassen and Stef Severt for comments on an earlier version of this paper and to Jelle van Lottum for drawing Figure I. 1 Well-known examples are David S. Landes, The wealth and poverty of nations: Why some are so rich and some so poor (London 1998) and Kenneth Pomeranz, The great divergence: China, Europe and the making of the modern world economy (Princeton 2000). 2 Jan de Vries and Ad van der Woude have labelled the Dutch Republic ‘the first modern economy’. J. de Vries and A. van der Woude, The first modern economy. Success, failure, and perseverance of the Dutch Economy, 1500-1815 (Cambridge 1997) notably 693-710. Bas van Bavel and Jan Luiten van Zanden have recently argued that they should have taken their analysis even further; according to them, the origins of the early modern Dutch economy did not appear like a deus ex machina after 1500, but must have had earlier roots in the medieval period. See e.g. J.L. van Zanden, 'The 'revolt of the Early Modernists' and the 'first modern economy': an assessment', Economic History Review LV (2002) especially 637-638. Bas van Bavel, ‘Rural wage labour in the sixteenth-century Low Countries: an assessment of the importance and nature of wage labour in the countryside of Holland, Guelders and Flanders’, Continuity and Change 21 (2006) 37-72.

Changing Occupational Structures? Van den Heuvel and Van Nederveen Meerkerk 2
Holland, Jan Luiten van Zanden has concluded that already in 1514 only 39% of the
population worked in the primary sector (24% in agriculture, 12% in fishing, and 3% in
peat digging). Another 38% worked in industry and the rest was active in trade, transport
and other services. These figures are striking, even compared to England, where about
half of the population was working in the agricultural sector around 1800, a quite modern
occupational structure compared to other western European countries at that time.3
Furthermore, the Dutch economy was characterized by a highly specialized and
commercialized agriculture sector and a relatively large share of the population
performing wage labour.4 Therefore, in order to tell more about economic growth in
relation to the occupational structure, it is important not only to investigate changes
between the different sectors, but also look into more qualitative developments within
sectors, such as the rise of wage labour and specialization.
An analysis of the Dutch early modern labour market is not new. Jan Lucassen
did pioneering work by reconstructing large parts of the Dutch labour force (e.g.
seasonal workers and sailors).5 Moreover, his model of labour mobilisation shows the
profound flexibility of labour at that time.6 Other labour market historians rather focussed
on the sedentary working population, but they usually restricted themselves to one single
town or region.7 To complement our existing knowledge, it is desirable to come to an
overall picture of the occupational structure of the Dutch Republic. In our opinion, an
aggregate analysis of various regional population registers and censuses over a long
period can be a very useful contribution. This paper is a first attempt to make such an
analysis based on a large set of occupational data. We want to raise the following
questions. How was the Dutch labour market structured in this period? How did the
structure of the labour market change over time, and what caused these changes? In
3 Van Zanden, 'Revolt', 632-634. Note that these figures are for the most part caused by the dense urbanization of the region. In another article, Van Zanden specifies that in the countryside of Holland, 41% worked in agriculture, 20% in fishing and 6% in peat digging (thus 67% in the primary sector). Jan Luiten van Zanden, ‘Taking the measure of the Early Modern economy: Historical national accounts for Holland in 1510-14’, Economic History Review 6 (2002) 138. 4 According to Van Bavel, ‘Rural wage labour’, 62-63. Holland c. 1550: 48% wage labour; Guelders river area: 57% wage labour; Flanders: 25% wage labour. 5 See e.g. Jan Lucassen, Migrant labour in Europe 1600-1900 (London 1987); Jaap Bruijn and Jan Lucassen, Op de schepen der Oost-Indische Compagnie. Vijf artikelen van J. de Hullu (Groningen 1980). A revision of the size of the maritime labour force as estimated in 1980 has lately been undertaken by Jelle van Lottum and Jan Lucassen. Jelle van Lottum and Jan Lucassen, Varen over de baren (forthcoming). 6 Jan Lucassen, ‘Labour and Early Modern economic development’, in: Karel Davids and Jan Lucassen (eds.), A miracle mirrored. The Dutch Republic in European perspective (Cambridge 1995) 367-409; Jan Lucassen, ‘Mobilization of labour in early modern Europe’, in: Maarten Prak (ed.), Early modern capitalism (Cambridge 2000) 161-174. 7 Among others: Leiden: F. Daelemans, ‘Leiden 1581. Een socio-demografisch onderzoek’, A.A.G. Bijdragen 19 (1975) 137-218; H.A. Diederiks, D.J. Noordam and H.D. Tjalsma (eds.), Armoede en sociale spanning. Sociaal-historische studies over Leiden in de achttiende eeuw (Hilversum 1985). North Holland: A.M. Van der Woude, Het Noorderkwartier : een regionaal historisch onderzoek in de demografische en economische geschiedenis van westelijk Nederland van de late middeleeuwen tot het begin van de negentiende eeuw (Wageningen 1972). Veluwe: H.K. Roessingh, ‘Beroep en bedrijf op de Veluwe in het midden van de 18de eeuw’, A.A.G. Bijdragen 13 (1965) 181-274.

Changing Occupational Structures? Van den Heuvel and Van Nederveen Meerkerk 3
what economic sectors were people employed in the countryside and in towns? To what
extent did this vary throughout space and time? We will differentiate between the various
areas within the country, and we will especially pay attention to differences between
Holland and the other provinces.
By answering these questions we want to contribute to a more profound insight
into the influence of changes in labour market structures on general economic
developments. It is widely known that the economic success of the Dutch Republic did
not last, and that from the end of the seventeenth century onwards its economy
underwent relative stagnation and decline. As opposed to other Western European
countries, large-scale industrialization took off rather late: around 1850. How can it be
that the ‘first modern economy’ was so late to industrialize after all? Might it be that its
head start slowed down the need for later processes of modernization?8 With this paper
we hope to (at least partly) answer these intriguing questions by giving a long-term view
of more than three centuries of labour market developments in the Northern
Netherlands. Furthermore, we will not only focus on the urban labour market, but also
provide information about villages in the countryside. In the end, we hope that the
outcome of this paper will enable us to compare developments on the Dutch labour
market with those of other countries, and to be more precise, with those of England,
Japan, India and Taiwan.9
The paper is structured as follows. After a discussion of our source material and
method, we will address the developments in the labour market in both urban and rural
areas in different periods. Following the availability of the sources, we have chosen a
rather traditional division in three periods, each of which represents a particular stage in
the economic development of the Northern Netherlands. The year 1580 forms the kick-
off for the first period (1580-1675). This period, generally known as the ‘Dutch Golden
Age’ was characterised by enormous economic growth. In the second period under
scrutiny, the eighteenth century, the Dutch economy stagnated and even faced a relative
decline, for instance compared to Britain. The third and final period is 1800-1900, in
which developments in the labour market took place that ultimately led to
industrialization.
8 Of course, we are not the first to address these questions. A recent example of a research project that tried to come to a better understanding of the slow industrialization of the Netherlands is that of the analysis of the Dutch national accounts in the nineteenth century. See Jan Luiten van Zanden and Arthur van Riel, The strictures of inheritance: the Dutch economy in the nineteenth century, (Princeton 2000) 1-10. For earlier literature on the subject see: Johannes de Vries, De economische achteruitgang der Republiek in de achttiende eeuw (Amsterdam 1959) A.J. de Jonge, De industrialisatie in Nederland tussen 1850 en 1914 (Amsterdam 1968); Richard Griffiths, Industrial retardation in the Netherlands 1830-1850 (Den Haag 1979); De Vries and Van der Woude, First modern economy. 9 These are the countries under study in the other papers in the session.

Changing Occupational Structures? Van den Heuvel and Van Nederveen Meerkerk 4
Sources and method
To answer the research questions raised above, we mainly rely on tax registers and
population records. We have collected large databases of quantitative source material
for the period of 1580-1810, based on our own archival research and publications by
others.10 For the nineteenth century, we have used the available national statistics and
existing literature.11
There are some clear disadvantages in using tax and population registers as
sources for reconstructing the historical labour market. First of all, they offer us a very
static recording of the labour market at one particular moment in time. This certainly
does not always do justice to the usual complexity and flexibility of the early modern
labour market, in which people had more than one job, shifted jobs regularly, and often
performed seasonal labour.12 Secondly, most special taxes were only imposed on
people who had an income or capital above a certain limit. Many participants in the
labour market did not reach this level of income, and as a consequence they were not
registered. In some cases however, every head of household was taxed, or a shadow
archive was made of those who did not have to pay taxes. These are valuable sources
for the historian who is interested in the whole social spectrum of the early modern
labour market. However, this immediately leads us to a third source problem. Because
usually only the head of the household or the family was registered, the possible labour
of many married women, live-in (maid)servants, lodgers and children remains invisible.
This especially leads to an under-representation of the female part of the workforce.13
Nevertheless, we shouldn’t be too pessimistic. For the Northern Netherlands,
many complete registrations have survived that provide us with essential information
10 See the Appendix for a systematic overview. Primary sources: Municipal Archives ’s-Hertogenbosch, Biljettering 1742; ibidem, Blokboeken 1775-1785; Volkstelling 1808. Regional Historical Centre Tilburg, Kapitale schatting 1665; ibidem, Volkstelling 1810; Historical Centre Overijssel, Volkstelling 1742; ibidem, Volkstelling 1812; Municipal Archives Leiden, Volkstelling 1581; ibidem, Kohier Hoofdgeld 1749 (made accessible by NIWI at: http://esf.niwi.knaw.nl/esf1999/projects/kohier); Municipal Archives Alkmaar, Personele Quotisatie Graft 1742; ibidem, geredresseerd kohier voor de imposten op zout- en zeepgeld Winkel 1734; ibidem, kohier van het familiegeld Winkel 1742; ibidem, Kohier familiegeld Zijpe (1674), ibidem, Kohier van Zijpe van de familie (1742), ibidem, Patentregister Zijpe (1808); Municipal Archives Rotterdam, Klein Familiegeld 1674, thanks to H. Kentin and Marjolein van Dekken, Personele Quotisatie 1742. Literature: J.G. van Dillen (ed.), Amsterdam in 1585. Het kohier der capitale impositie van 1585 (Amsterdam 1941); Diederiks e.a., Armoede en sociale spanning); W.F.H. Oldewelt, Kohier van de personeele quotisatie te Amsterdam over het jaar 1742, 2 delen (Amsterdam 1945). G.J. Peltjes, Leidse lasten. Twee belastingkohieren uit 1674 (Leiden 1995); H. van Wijngaarden, Zorg voor de kost. Armenzorg, arbeid en onderlinge hulp in Zwolle 1650-1700 (Amsterdam 2000). 11 CBS, Volkstelling 1849 and CBS, Beroepentelling 1899, both made accessible online: http://www.volkstellingen.nl/nl/. 12 Lucassen, Migrant labour; A. Knotter, 'Problems of the family economy: peasant economy, domestic production and labour markets in pre-industrial Europe', Economic and Social History in the Netherlands 6 (1994) 44. 13 Other historians also recognize this problem. See for example: Bridget Hill, ‘Women, Work and the Census: a Problem for Historians of Women’, in: History Workshop Journal 35 (1993), 78-94; S.C. Ogilvie, A bitter living. Women, markets, and social capital in Early Modern Germany (Oxford 2003) 23.

Changing Occupational Structures? Van den Heuvel and Van Nederveen Meerkerk 5
about male and female heads of households. Although they only formed part of the
working population, these sources at least give us systematic information about all
heads of households. Aggregating all these systematic local labour market structures
enables us to give a broad picture of changes within the Dutch Republic over a long
period of time. Furthermore, a few registrations have indeed listed all members of a
certain community.14 Since we have so many sources, especially for the seventeenth
and eighteenth century, some important general conclusions can be drawn.
The scheme in the Appendix gives an overview of all registers analysed for this
paper. As can be seen, for each part of the country involved in the analysis, we have
selected both urban and rural areas (when available). In selecting the different cases we
have taken into account the possibility of extrapolation of the results. Although regional
differences will have existed even within certain types of localities, in general it will be
possible to discern specific development patterns of for instance commercial towns,
industrial areas, and the more agrarian countryside outside Holland. In order to give both
a coherent and differentiated view, we will not only look at the province of Holland, but
also give information about other provinces, such as Overijssel, Guelders and Brabant.
Although we are unable to cover the country as a whole, this selection of localities in the
end makes it possible to draw a general picture for the Northern Netherlands.
Figure I. The Dutch Republic: the areas under study15
14 For a good example see: Regional Historical Centre Tilburg, Volkstelling 1810; CBS, Volkstelling 1849; CBS, Beroepentelling 1899. 15 Copyright Jelle van Lottum 2006.

Changing Occupational Structures? Van den Heuvel and Van Nederveen Meerkerk 6
For our analysis, we have used a categorization which is currently used by many
historians working on the Dutch (early modern) labour market. This categorization
roughly resembles PST.16 A short elaboration on the system, and our own adjustments,
can be found in the Appendix. We will refer to the primary, secondary, and tertiary
sectors according to the occupational classification in this scheme. In this paper, we will
first of all pay attention to shifts between the three different sectors, in order to uncover
changes in the occupational structure.17 But because we believe that economic
development can sometimes not be indicated by sectoral shifts, but rather by
developments within sectors, we will also analyse some of these ‘internal’ changes. In
doing this, our main focus will be on developments in the textile industry and in the retail
trade, to investigate respectively the rise of wage labour and new patterns of
specialisation.
The Dutch Republic’s Golden Age, c. 1580-1675
For political, economic, and religious reasons, the Netherlands started a war for
independence from the Spanish Habsburg monarchy in 1568, which would last until the
Peace of Westphalia in 1648. Already in 1588, seven provinces in the North proclaimed
the Dutch Republic of United Provinces.18 Despite the ongoing warfare, relative peace
existed after 1585 in the economically most important coastal provinces of the Republic,
Holland and Zeeland. In the Southern Netherlands, the war against Catholic Spain
continued, resulting in the loss of their dominant position in trade and industry.
Thousands of Protestant migrants fled from the southern parts of the Netherlands to the
safer cities in the North. This migration provided the Republic with a new labour force of
both skilled and unskilled workers. Furthermore, many of the refugees were rich
merchants from cities like Antwerp and Ghent, who brought capital and knowledge,
giving an economic impulse to the Dutch cities in which they settled.19 The unstable
16 The PST-categorization was developed by Tony Wrigley and Leigh Shaw-Taylor to reconstruct the evolution of the occupational structure of Britain in the period 1397-1911. See for an elaborate descripation: Leigh Shaw-Taylor, ‘The occupational structure of England c. 1750-1881. A preliminary report.’ [online: http://www-hpss.geog.cam.ac.uk/research/projects/occupations/introduction/summary.pdf] 17 We would also like to stress here that the road to ‘modern economic development’ not necessarily meant a transition from a predominantly agrarian via an industrialised to a service economy. In the western world for instance, some important exceptions to this rule are the US and the Netherlands. Göran Therborn, European modernity and beyond: The trajectory of European societies, 1945-2000 (London/Thousand Oaks/New Delhi 1995) 68-71. 18 See: I. Schöffer e.a. (ed.), De Lage Landen van 1500 tot 1780 (Amsterdam 1991) 140. 19 A standard work on southern Netherlands migration to the Republic is: J.G.C.A. Briels, De Zuid-Nederlandse immigratie, 1572-1630 (Haarlem 1978). See O. Gelderblom, Zuid-Nederlandse kooplieden en de opkomst van de Amsterdamse stapelmarkt (1578-1630) (Hilversum 2000) 15-28, for a good overview of the discussions on the role of Flemish merchants for the Republic’s economy.

Changing Occupational Structures? Van den Heuvel and Van Nederveen Meerkerk 7
international situation, with England and France at constant war, continued for almost a
century.
Due to all these circumstances, the Dutch Republic became the leading
economic power from the 1580s until at least 1650. The dominant role of the Dutch in
shipping and trade led to the development of a large staple market in the city of
Amsterdam, where people dealt in goods from all over the world.20 Although the
literature has focussed very much on the Republic’s commercial and maritime function, it
has lately been recognized that industry has also been very important for its economic
development in this period.21
In 1581, four years before the fall of Antwerp, and with its dramatic changes in
the Dutch economy as described above, the population of the Holland town of Leiden
was registered. At that time Leiden counted approximately 12,000 inhabitants, a number
that would quintuple to about 62,000 a century later. In this particular registration the
occupations of 15.5% of the population (and two-thirds of the household heads) are
mentioned. At this moment in time, before the migration of thousands of textile workers
from the Southern Netherlands and the growth of this particular economic sector,
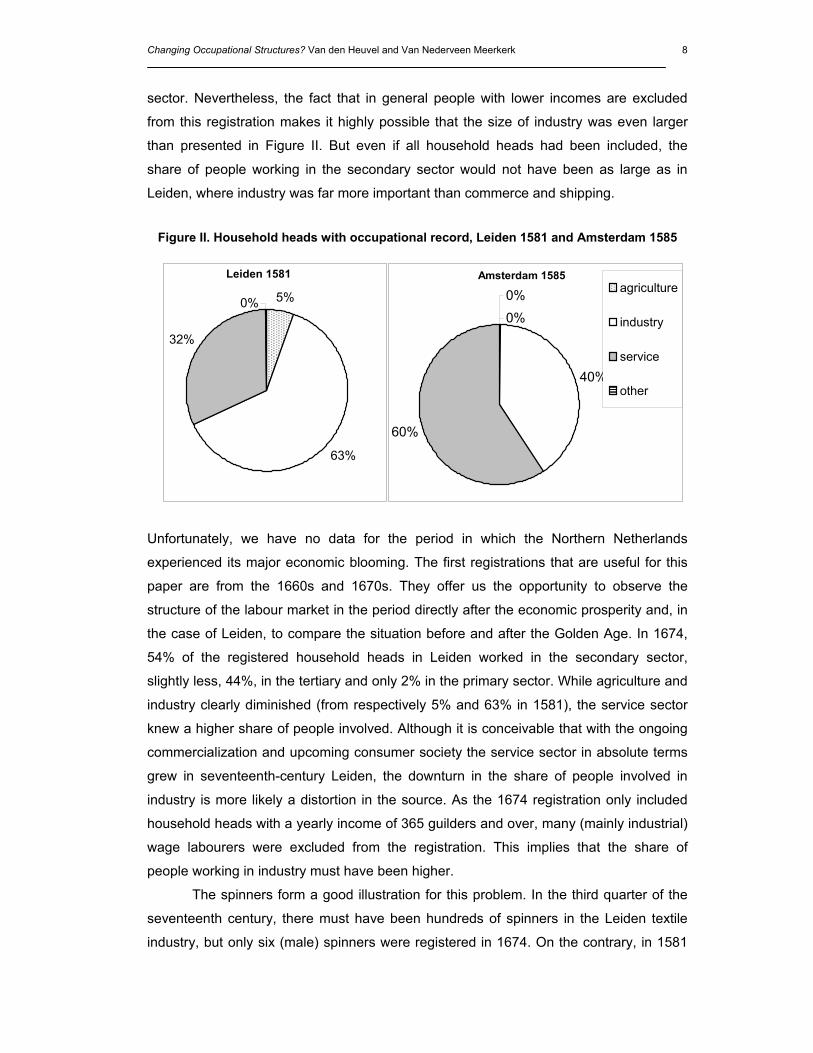
industry was already by far the largest employer: 1,179 heads of household (63%)
worked in this sector. Second came the tertiary sector, but with only 598 persons, it was
a little more than half the size of the secondary sector. Agriculture was small in Leiden,
and consisted of only 101 people (5.4%), mainly working as farmers and market
gardeners. The category ‘other’ contains unspecified labour, such as day labourers and
other casual labourers, which we were unable to categorize into one of the three sectors.
At about the same time, in 1585, in Amsterdam a tax register was conducted.
The purpose of the tax levy was to raise enough money to form an army of horsemen
and foot soldiers to free Antwerp from Spanish rule. Only the well-to-do were
incorporated in this registration. The result is that the lower groups in society such as
day labourers are missing, but also a large part of the independent craftsmen: only the
richer artisans are included.22 This has important consequences for the distribution of the
household heads over the different economic sectors. As we can see in Figure II, the
majority of the registered population worked in the tertiary sector, mainly in commerce
and shipping. About 40% of the household heads found a job in industry. Commercial
enterprise was already well developed in sixteenth-century Amsterdam, and it is
therefore not unthinkable that a large share of the population worked in this economic
20 J.I. Israel, Dutch primacy in world trade, 1585-1740 (Oxford 1989); C. Lesger, Handel in Amsterdam ten tijde van de Opstand. Kooplieden, commerciële expansie en verandering in de ruimtelijke economie van de Nederlanden ca. 1550-ca. 1630 (Hilversum 2001). 21 De Vries and Van der Woude, First modern economy, 270-272. 22 Van Dillen, Amsterdam in 1585, xxxiii-xxxiv.
Changing Occupational Structures? Van den Heuvel and Van Nederveen Meerkerk 8
sector. Nevertheless, the fact that in general people with lower incomes are excluded
from this registration makes it highly possible that the size of industry was even larger
than presented in Figure II. But even if all household heads had been included, the
share of people working in the secondary sector would not have been as large as in
Leiden, where industry was far more important than commerce and shipping.
Figure II. Household heads with occupational record, Leiden 1581 and Amsterdam 1585
Unfortunately, we have no data for the period in which the Northern Netherlands
experienced its major economic blooming. The first registrations that are useful for this
paper are from the 1660s and 1670s. They offer us the opportunity to observe the
structure of the labour market in the period directly after the economic prosperity and, in
the case of Leiden, to compare the situation before and after the Golden Age. In 1674,
54% of the registered household heads in Leiden worked in the secondary sector,
slightly less, 44%, in the tertiary and only 2% in the primary sector. While agriculture and
industry clearly diminished (from respectively 5% and 63% in 1581), the service sector
knew a higher share of people involved. Although it is conceivable that with the ongoing
commercialization and upcoming consumer society the service sector in absolute terms
grew in seventeenth-century Leiden, the downturn in the share of people involved in
industry is more likely a distortion in the source. As the 1674 registration only included
household heads with a yearly income of 365 guilders and over, many (mainly industrial)
wage labourers were excluded from the registration. This implies that the share of
people working in industry must have been higher.
The spinners form a good illustration for this problem. In the third quarter of the
seventeenth century, there must have been hundreds of spinners in the Leiden textile
industry, but only six (male) spinners were registered in 1674. On the contrary, in 1581
Amsterdam 1585
0%
40%
60%
0% agriculture
industry
service
other
Leiden 1581
5%
63%
32%
0%
Changing Occupational Structures? Van den Heuvel and Van Nederveen Meerkerk 9
there had already been 74 (male and female) spinning heads of households. As the
industry grew spectacularly in the following century, and the import of yarn was not
sufficient to supply all weavers, considering the amount of cloth that was produced in
Leiden in 1674, we may assume that these six spinners are hardly representative for the
actual number present in the town. Besides the fact that also many non-household
heads were working as spinners, the majority of the household heads spinning were not
able to earn an income as high as 365 guilders a year. Apparently only these six men
were able to do so.23 In addition to this specific example, there will have been many
other industrial wage labourers (carders, combers, guild journeymen etc.) that are not
included in this registration. Approximately 30 kilometres to the south of Leiden and also in the province of
Holland, we find the city of Rotterdam, a port town that had about 40,000 inhabitants in
the second half of the seventeenth century. In 1674 the same registration took place as
in Leiden, however compared to the latter town, a much larger share of the total
population was registered.24 This implies that the standard of living in Rotterdam was
higher than in Leiden. The occupational structures of both towns look more or less the
same, at least for the particular group that has been taken down for taxation. In
Rotterdam 55% of the people worked in industry, 39% in the service sector, and 4%
were employed in agriculture.25
A comparison of the share of people employed in the maritime sector shows that
in the 1674 registrations Rotterdam and Leiden did not differentiate that much. While
8.5% of the people in the tertiary sector in Leiden worked in inland shipping and
seafaring, in Rotterdam this was not much higher and consisted of 12.5%. The majority
worked as bargemen and many of the seafaring personnel was therefore missing in the
registration. It is well known that the port towns in the province of Holland suffered from
a so-called ‘(East) Indian Leak’ in the seventeenth and eighteenth century. Recently
Victor Enthoven showed that also a West Indian Leak existed that was comparable in
size.26 Despite the fact that the East and West India Companies employed many foreign
sailors, still thousands of Dutch men left the country employed by these companies.27
Especially for the 1674 registration of Rotterdam this means that the service sector will
23 Elise van Nederveen Meerkerk, Unpublished PhD-thesis, chapter 4. See also: Elise van Nederveen Meerkerk, ‘Segmentation in the pre-industrial labour market: Women’s work in the Dutch textile industry, 1581-1810’, International Review of Social History 51 (2006) 201, 204. 24 In Leiden 5% of the population was registered, and in Rotterdam 12%. 25 The primary sector might be a little overrepresented due to the inclusion of neighboring villages of Charlois and Katendrecht in the registration. 26 Victor Enthoven, ‘Dutch crossings. Migration between the Netherlands and the New World, 1600-1800’ Atlantic Studies 2:2 (2005) 153-176. 27 Jan Lucassen, ‘A multinational and its labor force: The Dutch East India Company, 1595-1795’, International labor and working-class history 66 (Fall 2004) 12-39.

Changing Occupational Structures? Van den Heuvel and Van Nederveen Meerkerk 10
have been larger than presented. Whereas we have seen that in Leiden the under-
representation will have manifested itself in the secondary sector, we might conclude
that in Rotterdam the tertiary sector will have been larger.
When we expand our view to the countryside we get a completely different view
of the Dutch labour market in the seventeenth century. A comparison of two villages, in
two totally different settings, results in some remarkable conclusions. De Zijpe, a typical
Holland ‘polder’, was founded in 1579 when a piece of land of 6,755 hectares to the
northwest of the city of Alkmaar was gained from the sea. The colonization of this new
piece of land happened gradually: in 1622 only 1,283 people had settled in the polder
and a lot of land was still uninhabited. Nevertheless, from the 1630s the number of
inhabitants rose quicker than before: from 308 houses present in that year the number of
houses grew to 576 in 1674, with a population of 2,412.28 At the other end of the country,
in the southern province of Brabant we find the village of Tilburg. This was an
industrialising village where the textile industry was of great importance: cloth from
Tilburg started to become known throughout the country for its low prices. In 1665
Tilburg was on the eve of an enormous bloom of its textile industry, with a population of
approximately 7,000 inhabitants.29
In the comparison of the occupational structures of both villages, agriculture
plays a remarkable role. In 1665 we find 885 people in Tilburg registered as farmer or
agricultural labourer, which is more than half of the registered population. In De Zijpe in
1674 235 household heads held an occupation in the primary sector: only 41%, despite
the large amount of agricultural land and the fact that the majority of the De Zijpe houses
were farms.30 Nevertheless, we may assume that the share of people performing
agricultural labour was higher. De Zijpe knew a large number of male day labourers
(‘hantschoijers’ and ‘arbeitsmannen’). It is likely that these men were mainly employed in
the primary sector as grass mowers and haymakers.31 Interestingly enough, when
adding them all to the primary sector (which is challengeable, because some of them will
have worked in the other two sectors) the share of household heads rises to about 60%
and is comparable to that of Tilburg (57%). In any case, we can conclude from this that
wage labour already played a major role in the Holland countryside.
Another striking difference is the size of the tertiary sector in both towns. While
Tilburg was much larger in population numbers, De Zijpe had a much larger service
sector. An analysis of the size of the retailing branch in both localities shows that the
28 A. Zijp, ‘Hoofdstukken uit de economische en sociale geschiedenis van de polder Zijpe in de 17de en 18de eeuw’, Tijdschrift voor geschiedenis 70 (1957) 29-48 and 176-188, esp. 34-35, 40, 42, 178. 29 Gerard van Gurp, ‘Proto-industrialisatie in Tilburg en Geldrop’, Textielhistorische Bijdragen 39 (1999) 37. 30 Together with hunters and fishermen the primary sector consisted of 44%. 31 Cf. Jan Lucassen, Migrant labour in Europe 1600-1900 (London 1987) 52.
Changing Occupational Structures? Van den Heuvel and Van Nederveen Meerkerk 11
Brabant village was much more self-sustainable. When comparing the amount of
shopkeepers and traders present, we find only 14 traders (0.2% of the population) in
Tilburg and 26 (5%) in De Zijpe. Besides wholesalers as cloth merchants in Tilburg and
wood merchants in De Zijpe, the retail trade in the former village consisted of 1 retailer
per 1,000 inhabitants and was significantly more developed in the latter with 1 retailer
per 26 inhabitants. Apparently, contrary to the inhabitants of the North Holland
countryside, the Tilburg villagers were, at this moment in time, still very much relying on
home grown and produced products for their necessities of life. Moreover, as many other
Holland villages, De Zijpe knew a reasonably large population of sailors and skippers
and seafaring and inland shipping made up 56% of the economic services.32
In the seventeenth century the occupational structure of the different localities
varied enormously. Already before Amsterdam became the commercial and financial
centre of the world, its economic structure was characterised by a highly developed
service sector. Leiden and Rotterdam can be considered as prototypes for the smaller
towns in the province of Holland. Rotterdam was a middle-sized port town with a
differentiated economic structure that consisted of a combination of fishing, merchant
shipping, navy and various industries and was in economic structure probably quite
representative for towns as Enkhuizen and Delft. Leiden on the other hand, was an
‘industrial town’ with a large export industry, and was therefore roughly comparable to
other industrial centres such as Haarlem and Gouda. The province of Holland seems to
have had a typical urban system in which the different towns, with their own
specialization, to a certain extent complemented each other.33
A comparison of the occupational structures of a typical Holland polder with the
countryside of Brabant suggests that Holland was indeed divergent from other parts of
the country. In the next section, the eighteenth-century data will tell us more about the
differences between Holland and ‘the rest’, and their meaning.
The ‘long eighteenth century’ (1675-1795): stagnation and decline?
The ‘long eighteenth century’ was traditionally seen as a period of crisis and
stagnation.34 In the first half of the 1670s, a severe economic crisis occurred, with
sharply declining prices, which also struck contemporaries as most extraordinary. Indeed
the wage level remained stable, at least until 1740, which implied a higher real wage
32 This is also typical for many other localities in the Holland countryside. Piet Boon, Bouwers van de zee: zeevarenden van het Westfriese platteland c. 1680-1720 (Den Haag 1996). 33 Earlier Jan Lucassen has come to a similar categorization based on size and economic structure, however his clusters are more geographically determined. Jan Lucassen, Immigranten in Holland 1600-1800. Een kwantitatieve benadering, CGM Working Paper 3 (2002) 21. 34 See e.g. J.A. Faber, ‘De Noordelijke Nederlanden van 1480 tot 1780. Structuren in beweging’, in: Algemene Geschiedenis der Nederlanden 5 (1979) 197-207.
Changing Occupational Structures? Van den Heuvel and Van Nederveen Meerkerk 12
level. However, relatively high nominal wages also meant a growing pressure on the
wage bill, and with a declining demand, this led to decreasing employment possibilities.35
Despite this overall negative picture, some nuances are in order. First of all, the
long eighteenth century also experienced its economic upswings, albeit not as
spectacular as in the century before.36 Moreover, there were distinctly diverse regional
developments, with for instance an expanding (proto-)industrialization of the countryside
in the Eastern and Southern provinces in the period 1675-1740.37 And, apart from the
regional differences, there were also overall developments in the various economic
sectors, such as changes in the retailing branch, brought about by changing consumer
behaviour.38
In 1742 the province of Holland started levying a new tax, the Personele
Quotisatie (PQ). This tax only applied to families with an income from 600 guilders a
year. In practice, only about 5% of the total population (c. 20-25% of all household
heads) were listed. This implies that most casual and wage labourers will not have been
recorded in this tax register. Furthermore, foreigners, ministers, army officers and
journeymen were excepted from this taxation. Despite the under-representation of
certain groups, notably the lower strata of society, an analysis is nevertheless useful. In
the city of Amsterdam, for instance, the PQ indeed taxed 5% of all inhabitants, exactly
the same percentage as in 1585. This enables a comparison over time.39 The share of
industry had dropped in this period from 40% to a mere 24%. On the other hand, the
service sector had expanded considerably: from about 60% to almost 73%. This
increase was particularly due to the growth of the tertiary sector. The most obvious was
the increase of various sorts of trade: wholesale and distributive trade, but also retailing
had developed. Furthermore, there were a lot of rentiers who, in the eighteenth century,
were often active participants in the financial branch. Moreover, some of these rentiers
35 De Vries and Van der Woude, First modern economy, 674-675. 36 De Vries, De economische achteruitgang, esp. 167-184. 37 See e.g. Cor Trompetter, Agriculture, proto-industry and Mennonite entrepreneurship: A history of the textile industries in Twente, 1600-1815 (Amsterdam 1997); Gerard van Gurp, Brabantse stoffen op de wereldmarkt. Proto-industrialisering in de Meierij van ’s-Hertogenbosch 1620-1820 (Tilburg 2004). 38 Jan de Vries, ‘Between purchasing power and the world of goods: Understanding the household economy in Early Modern Europe’ in: John Brewer and Roy Porter (eds.), Consumption and the world of goods (London/New York 1993) 85-132, 107-120, Jan de Vries, ‘The industrious revolution and economic growth’ in: Paul A. David and Mark Thomas, The economic future in historical perspective (Oxford 2003) 43-72, 47. 39 Based on data presented earlier by W.F. Oldewelt, Piet Lourens and Jan Lucassen made a reconstruction of part of the labour market by estimating the numbers of guild members in Amsterdam in 1688. A conversion to PST leads to 0% in the primary sector, 47% in the secondary and 53% in the tertiary sector. However a comparison with our data on household heads is problematic because a large part of non-guilded labour (merchants, day labourers, primary sector) is not included. At the same time, in the guilds that united retailers a lot of non-household heads (notably married women) were members. Piet Lourens and Jan Lucassen, ‘Ambachtsgilden binnen een handelkapitalistische stad: aanzetten voor een analyse van Amsterdam rond 1700’ in: NEHA-Jaarboek 61 (Amsterdam 1998) 121-162, Oldewelt, Kohier, dl. I , 12, Danielle van den Heuvel, ‘Women, retailing and consumer changes. Evidence from eighteenth-century ’s-Hertogenbosch’. Paper presented at the Cambridge Group of Population and Social Structure, 30 January 2006.

Changing Occupational Structures? Van den Heuvel and Van Nederveen Meerkerk 13
were also engaged in trade in goods.40 It is notable that relatively many of the
merchants, traders and rentiers were women.
The fact that Amsterdam had grown about 8 times from 30,000 to 240,000
inhabitants since 1585,41 of course had its implications for the occupational structure. In
the Golden Age thousands of migrants had been attracted by the city’s expanding
commercial, financial and naval activities. Although industry is under-recorded in this
source, since casual and wage labourers were over-represented in this sector, the
relative decline of the sector is nevertheless symbolic. Indeed, the previous period of
economic crisis especially hit the industrial sector.
This becomes even clearer when we compare Amsterdam with other cities and
towns in this period. Rotterdam had also obtained an important commercial and naval
function in the seventeenth century, but, as we have read, here industry had still been by
far the largest sector in 1674 (c. 55%). Although the PQ 1742 is less representative for
the working population than the 1674 tax register,42 the share of industry had dropped to
29%. This steep decline within less than 70 years time cannot solely be ascribed to
registration differences. Even more spectacular was the growth of the service sector.
Although this sector will be somewhat over-represented in the PQ register, its rise from
less than 40% in 1674 to 70% in 1742, indicates a significant change in the city’s
occupational structure.43 Because the number of inhabitants had risen since 1674, it is
unlikely that it was only a question of relative increase, due to industrial workers leaving
the city. Instead, the city had a large influx of immigrants, especially after 1730.44 More
probable is that the economic crisis was very much restricted to the secondary sector,
and that Rotterdam instead more and more focussed on commerce.
For Leiden, we have a registration of all occupations of household heads for
about the same period (1749). Here, industry was still by far the most important sector:
almost 75% of the working population with an occupational record. Compared to 1674,
when industry was, as we have mentioned, under-recorded, it is much more
representative for the entire population. Therefore, it is sensible to make a comparison
with the census of 1581. The growth of the secondary sector in Leiden can be mainly
attributed to the rise of the textile industry. In 1581, 23% of all household heads already
worked in textile production (36.5% of all heads in industry), but this was before the
actual take-off of the industry. Although the real blooming of the textile branch occurred 40 All this activity is exactly why we include rentiers in the service sector, instead of considering them as people ‘without occupation’. 41 Marco H.D. van Leeuwen and James E. Oeppen, ‘Reconstructing the demographic regime of Amsterdam 1681-1920’ Economic and Social History in the Netherlands 5 (1993) 87. 42 Klein Familiegeld Rotterdam: 12% of all inhabitants listed; PQ 1742: 5% listed. 43 We say ‘somewhat’, because the under representation of industrial labour will partly have been compensated by the absence of sailors in these registers, as was stated in the previous section. 44 Arie van der Schoor, Stad in aanwas: geschiedenis van Rotterdam tot 1813 (Zwolle, 1999) 327.

Changing Occupational Structures? Van den Heuvel and Van Nederveen Meerkerk 14
between 1585 and 1660, in 1749 still almost 50% of all household heads (68% of all
heads in industry) worked in textile production. This of course leaves unmentioned the
thousands of women and children who also worked in this sector, but who are usually
invisible in these sources. As said, however, the Leiden textile industry was far over its
top in 1749. A lot of workers had become wage dependent in the course of the
seventeenth century, due to changes in the production relations. The long economic
crisis starting at the end of the century, had led to overall impoverishment and
unemployment, but especially hit these wage earners. Not surprisingly, a lot of people
left the city of Leiden in this period: its number of inhabitants had dropped from between
55.000 and 65.000 in 1675 to a mere 37,000 around 1750.45
In cities outside Holland, developments were strikingly different. The eastern
province of Overijssel and the southern province of Brabant, for instance, had not
exactly experienced a ‘golden age’ during the seventeenth century. First of all, more
than the provinces in the west of the Republic, these areas had been confronted with
warfare in the first half of the seventeenth century. Secondly, especially Brabant had
suffered from trade barriers imposed by the powerful cities of Holland. The eastern town
of Zwolle had managed to profit a little, but not much, from the Republic’s economic
boom during the seventeenth century. On the other hand, the town experienced growth
between 1670 and the first decades of the eighteenth century, especially due to
developments in shipping. A comparison between its occupational structure in 1712 and
1742 shows that, on first appearance, it hardly changed in thirty years time.
Nevertheless, within the different sectors, changes did occur. In the service sector, for
instance, a modest growth of commerce, in particular retailing, took place. The industrial
sector waned somewhat, and this was mainly attributed to the declining linen industry,
which began to suffer from the rise of proto-industry on the eastern countryside, as we
will turn to in a while.
The Brabant town of ’s-Hertogenbosch, on the other hand had only known
stagnation and crisis since the end of the sixteenth century. Due to political isolation, and
more particularly the industrial restrictions, it was never able to revive its industrial
greatness. However, ’s-Hertogenbosch did have an important function as a regional
service centre. And because it was a frontier town, it also had an important military
function. Therefore, in 1742 the town had a highly developed tertiary sector, which
employed more than 60 percent of the working population. By far the most important
were traders and retailers (see Table 1). This applied to both men and women, but for
women this branch was relatively twice as important. Furthermore, relatively many
45 Dirk Jaap Noordam, ‘Demografische ontwikkelingen‘ in: S. Groenveld (ed.), Leiden. De Geschiedenis van een Hollandse stad. Deel 2 1574-1795, 43-53, esp. 44.
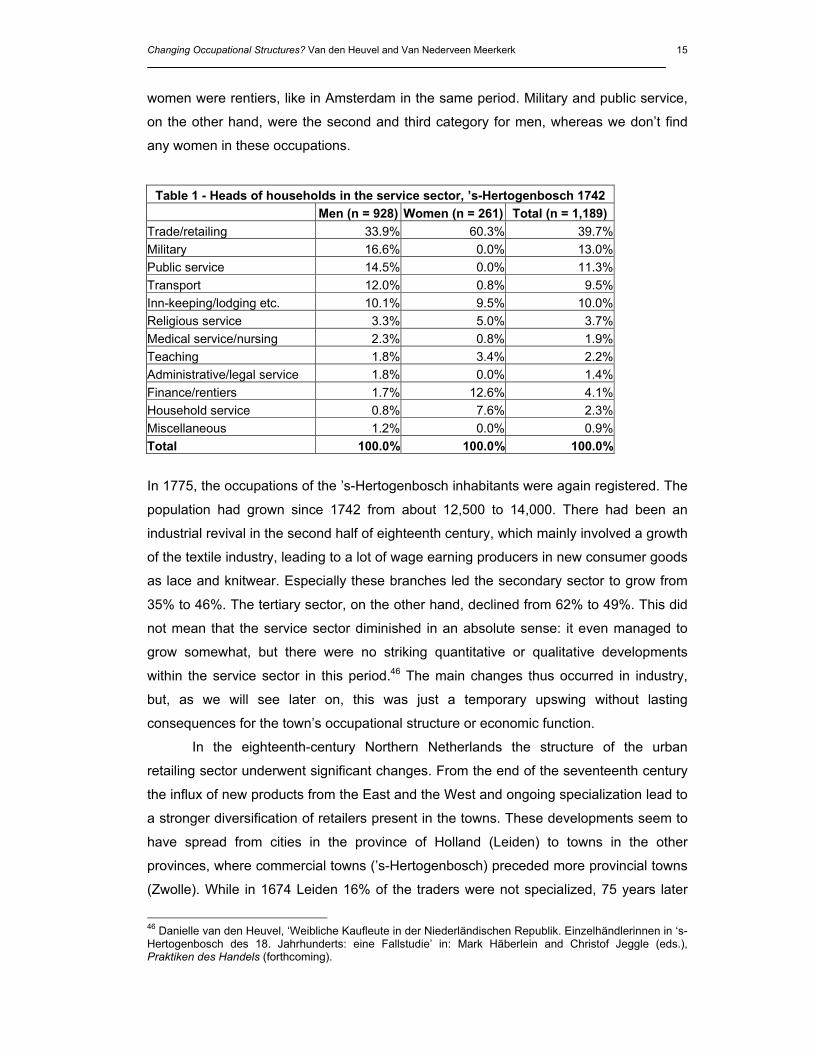
Changing Occupational Structures? Van den Heuvel and Van Nederveen Meerkerk 15
women were rentiers, like in Amsterdam in the same period. Military and public service,
on the other hand, were the second and third category for men, whereas we don’t find
any women in these occupations.
Table 1 - Heads of households in the service sector, ’s-Hertogenbosch 1742 Men (n = 928) Women (n = 261) Total (n = 1,189)
Trade/retailing 33.9% 60.3% 39.7% Military 16.6% 0.0% 13.0% Public service 14.5% 0.0% 11.3% Transport 12.0% 0.8% 9.5% Inn-keeping/lodging etc. 10.1% 9.5% 10.0% Religious service 3.3% 5.0% 3.7% Medical service/nursing 2.3% 0.8% 1.9% Teaching 1.8% 3.4% 2.2% Administrative/legal service 1.8% 0.0% 1.4% Finance/rentiers 1.7% 12.6% 4.1% Household service 0.8% 7.6% 2.3% Miscellaneous 1.2% 0.0% 0.9% Total 100.0% 100.0% 100.0%
In 1775, the occupations of the ’s-Hertogenbosch inhabitants were again registered. The
population had grown since 1742 from about 12,500 to 14,000. There had been an
industrial revival in the second half of eighteenth century, which mainly involved a growth
of the textile industry, leading to a lot of wage earning producers in new consumer goods
as lace and knitwear. Especially these branches led the secondary sector to grow from
35% to 46%. The tertiary sector, on the other hand, declined from 62% to 49%. This did
not mean that the service sector diminished in an absolute sense: it even managed to
grow somewhat, but there were no striking quantitative or qualitative developments
within the service sector in this period.46 The main changes thus occurred in industry,
but, as we will see later on, this was just a temporary upswing without lasting
consequences for the town’s occupational structure or economic function.
In the eighteenth-century Northern Netherlands the structure of the urban
retailing sector underwent significant changes. From the end of the seventeenth century
the influx of new products from the East and the West and ongoing specialization lead to
a stronger diversification of retailers present in the towns. These developments seem to
have spread from cities in the province of Holland (Leiden) to towns in the other
provinces, where commercial towns (’s-Hertogenbosch) preceded more provincial towns
(Zwolle). While in 1674 Leiden 16% of the traders were not specialized, 75 years later
46 Danielle van den Heuvel, ‘Weibliche Kaufleute in der Niederländischen Republik. Einzelhändlerinnen in ‘s-Hertogenbosch des 18. Jahrhunderts: eine Fallstudie’ in: Mark Häberlein and Christof Jeggle (eds.), Praktiken des Handels (forthcoming).

Changing Occupational Structures? Van den Heuvel and Van Nederveen Meerkerk 16
was reduced to 4%. Around the same time, in 1742, the share of non-specialized traders
in ’s-Hertogenbosch and Zwolle was much higher: respectively 23% and 49%.47
Tables 2 and 3 in Appendix C make even clearer that in this period (c. 1674-
1749) the structure of the retailing sector changed profoundly, but that these changes
occurred gradually in the different parts of the country. Both in the selling of consumable
household goods and of wearing apparel,48 we can distinguish a pattern in which Leiden
preceded ’s-Hertogenbosch and Zwolle. In the mid-eighteenth century only relatively
little specialization had taken place in the latter town, while Leiden was characterised by
the largest diversification among traders. The specialization of traders in ’s-
Hertogenbosch was less crystallised than in Leiden, but more than in Zwolle. While in
Zwolle no real changes seem to have taken place before 1750, in the Brabant town it is
likely that the first changes occurred around 1720.49 Furthermore, while in Leiden
already rather large numbers were involved in the sale of ‘new products’ as
haberdashery and coffee and tea, this was much less the case in the other two towns.
As the Leiden register of permits for dry coffee and tea dealers shows, these
developments could have great impact on the size (and probably also the composition)
of the sector as in the period 1747-1752 the majority (63%) of the 195 permit holders
were married women.50
Finally, let us shift our focus from the eighteenth-century urban context to the
rural environment. In the Holland countryside, we have registers for the De Zijpe polder
and the small rural town Winkel for 1742, and for the village Graft in 1748 (see Figure
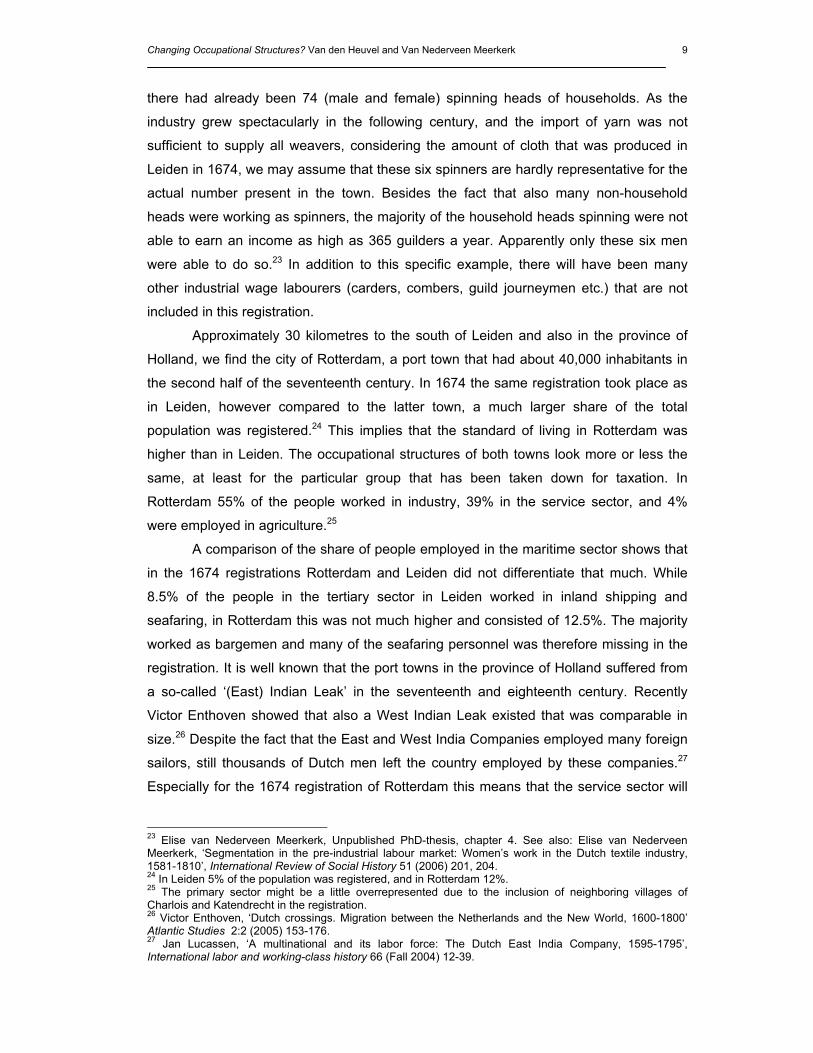
III).51 Both De Zijpe’s number of residents and its occupational structure had not
changed much since 1674. The percentage working in agriculture had even dropped
slightly to 38%, or a maximum of 57% if we again assume that all registered day
labourers worked in this sector. The service sector had grown a little, and industry had
remained exactly the same. Remarkably, the much smaller town of Winkel shows a
similar occupational structure, which leads us to believe that these economies are
representative for a large part of the Holland countryside. With its totally different
structure Graft represents the other part of rural Holland: the highly (proto-)industrialised
47 This analysis is based on tax registers, and therefore our results concern people that are registered as a trader or shopkeeper without any further specification. 48 This categorization is derived from that of Mui and Mui. H. Mui and L. Mui, Shops and shopkeeping in eighteenth century England (London 1989). 49 Van den Heuvel, ‘Women, retailing and consumer changes’. 50 Regionaal Archief Leiden (RAL), 501A Stadsarchief van Leiden 1574-1816, Burgemeestersdagboeken, inv. 174. On the contrary, among the salt and soap vendors married women formed only 6%. 51 The status of Winkel as a town was a medieval relict, it therefore more resembled a village. It had for instance very low population numbers (660 in 1742) and an economic structure with a rather high share of agriculture (see Figure III).

Changing Occupational Structures? Van den Heuvel and Van Nederveen Meerkerk 17
villages mainly concentrated to the North of Amsterdam, in the Zaanstreek (shipbuilding,
papermaking) and the adjacent Schermereiland (mainly textile industry).52
Figure III. Occupational structure of Winkel (1742), De Zijpe (1742) and Graft (1748)
For the countryside as well, we get a different picture outside Holland. From the second
half of the seventeenth century, the countryside in the east and the south of the
Republic, mainly Brabant, developed into important proto-industrial regions, mostly with
linen and wool industries. Although we have no comparable figures to illustrate this
development, we do know that in general, agriculture in these regions made way for a
proto-industrial wage earning proletariat, specializing in textile industry, sometimes (but
not necessarily!) combining their activities with small-scale farming.53
For De Veluwe, a considerable rural region in the centre of the Dutch Republic,
which also had some proto-industry, we have occupational data for 1749.54 This region
contained approximately 54,000 inhabitants, 14,000 of whom (c. 26%) lived in six small
to middle-sized towns. As a whole, its occupational structure consisted of 48% of the
population working in the primary, 28% in the secondary and 19% in the tertiary sector.
But if we only look at the rural areas in De Veluwe (only parishes and hamlets, without
the six towns), the structure looks totally different, with 69% in the primary, 23% in the
secondary and 8% in the tertiary sector. This probably is much more representative for
the occupational structure of the Dutch countryside in general than the rural areas in the
province of Holland. Figures from the same year on the countryside in the north-eastern
province of Friesland, another typical agrarian region with eleven small towns, confirm
this idea. In Friesland, the occupational structure in the countryside was quite similar to
52 De Vries and Van der Woude, First modern economy, 299-303, 312-314 and 557-559. 53 De Vries and Van der Woude, First modern economy, 557-559; Van Gurp, Brabantse stoffen. 54 Roessingh, ‘Bedrijf en beroep’.
Graft 1748
11%
64%
24%
1%
agriculture
industry
service
other
De Zijpe 1742
17%
26%
19%38%
Winkel 1742
21%
28%
14%
37%
Changing Occupational Structures? Van den Heuvel and Van Nederveen Meerkerk 18
that of rural areas in De Veluwe, with 67% working in agriculture, 19% in industry, and
14% in services.55
At the end of the eighteenth century, this dual structure between Holland and the
rest still existed. In 1795, in the Republic as a whole 67% of the rural population worked
in agriculture (i.e. 40% of the total population). In the western provinces Holland and
Zeeland, these figures were a lot lower, with an average of 50 of the rural population (i.e.
28% of the entire population) in the primary sector.56 It is important to note that more
than a third of the rural population of the country lived in Holland and Zeeland.
Therefore, we must conclude that the modern structure of the Dutch labour market, with
a low average percentage of the population working in agriculture, even in the
countryside, was for the most part due to the strikingly divergent pattern of exactly these
two provinces.
Our data confirm that the image of overall economic stagnation and downturn in
the long eighteenth century has to be differentiated, both according to sector and to
region.57 Industrial decline was indeed a fact, but this mostly struck cities in Holland,
such as Leiden, Amsterdam and Rotterdam. Apart from Leiden, these cities seem to
have specialized even more than before on activities in the tertiary sector. In an eastern
town like Zwolle, no real industrial decline and even growth occurred between 1670 and
1730. On the other hand, the southern town ’s-Hertogenbosch, which had known a long
period of (especially industrial) decline, experienced a short revival of industrial
production, of mainly new textile consumable goods. And also large parts of the eastern
and southern countryside, notably outside Holland, experienced a process of proto-
industrialization. And between 1740 and 1780, the service sector particularly developed
in the cities of Holland. In towns outside this province, the process of commercialization
and specialization of trade did not expand considerably before c. 1720 (’s-
Hertogenbosch), and 1750 (Zwolle). It is very probable that these innovations first
spread in the seventeenth century in Holland, which was indeed the centre of commerce
and trade. Only slowly, and with the gradual improvement of their economic situation, did
these changes reach the other cities and towns of the Dutch Republic.
A long road towards industrialization (1795-1900)
In 1795, the revolutionary French overpowered the Dutch, introducing heavy tax burdens
and the Continental System, which, in combination with the British trade blockades,
55 Faber, ‘De Noordelijke Nederlanden’, 205. 56 De Vries and Van der Woude, First modern economy, 228. 57 See De Vries, De economische achteruitgang and De Vries and Van der Woude, First modern economy.

Changing Occupational Structures? Van den Heuvel and Van Nederveen Meerkerk 19
resulted in a fierce economic crisis.58 After the defeat of France, a reunion with the
Belgian provinces followed, and the Kingdom of the Netherlands was established. As
opposed to the northern regions, industrialization had already greatly progressed in
these southern provinces. The Dutch King William’s policy was to maintain the existing
regional division of economic structures, with the commercial centre in the North, and
the industrial base of the nation in the South, which should be reinforced by the gains of
the colonies. Consequently a lot of investments were made in the southern industrial
areas. However, Belgium’s successful struggle for independence in 1830 meant that the
Dutch Kingdom lost these important provinces already 15 years after its foundation.
Even in 1850, the Dutch economy was clearly underdeveloped compared to other
European countries like Britain, Belgium, France and Prussia regarding steam power
capacity.59 Despite the Netherlands’ late industrialization, economic growth and
development did occur in the first half of the nineteenth century.60
However, Van Zanden and Van Riel refer to a ‘troubled recovery’ when they talk
about Dutch economic development in the first half of the nineteenth century. They
conclude that the country’s relatively modern structure of the labour force at the
beginning of the nineteenth century did not imply a comparably high level of GDP. As
opposed to Britain, the Dutch could not maintain their early modern economic growth
level exactly because the transition to ‘modern economic growth’ (a sustained increase
in per capita or per worker product) took place much later in the Netherlands. Here, the
process of transition towards an ‘industrial’ structure of the economy was only completed
after 1870.61 Indeed in most branches large-scale industrialization, and thus the raise of
productivity, only took place in the period 1850-1870.62 Between 1890 and 1910, the
process obtained such dynamic, that by this time we can speak of an industrial society
with modern industrial growth.63
For the beginning of the nineteenth century we were able to collect data from a
few towns outside Holland. The population register of ’s-Hertogenbosch in 1808 shows
that the town had about the same number of inhabitants as in 1775, but that far fewer
household heads were registered. This especially had consequences for the share of
registered women, who constituted 25% of all household heads in 1775, but only 16% in
1808. The town’s occupational structure in 1808 resembled 1742: the share of industry
had dropped again from 46% in 1775 to 37%, similar to the level in 1742, whereas the
58 De Vries and Van der Woude, First modern economy, 685. 59 Griffiths, Industrial retardation, 1-6. 60 Griffiths, Industrial retardation, 185-189; Michael Jansen, De industriële ontwikkeling in Nederland, 1800-1850 (Amsterdam 1999) 28; Van Zanden and Van Riel, Strictures of inheritance,163-164. 61 Van Zanden and Van Riel, Strictures of inheritance, 263-266. 62 J.A. de Jonge, De industrialisatie in Nederland tussen 1850 en 1914 (Amsterdam, 1968) 241-242. 63 De Jonge, De industrialisatie, 245.

Changing Occupational Structures? Van den Heuvel and Van Nederveen Meerkerk 20
service sector had grown to 56%, almost reaching the 1742 level again. Both in the
secondary and the tertiary sector, the share of women had dropped spectacularly. In
1775, almost 30% of all registered people in industry had been women, compared to just
10% in 1808. In the service sector as well, their share had declined from 25% to 21% in
the same period.64 This obviously means that economic downturn affected the labour
market participation of women more than it did men’s. In the town of Zwolle, we discern
a similar pattern when comparing the censuses of 1742 with 1812. The industry sector
declined here as well, albeit less severely, and the service sector grew somewhat.
Furthermore, the share of female labour participation dropped as well in this period, from
24.5% to 20% of all household heads with an occupation.
In 1810, Tilburg had grown from a large village (population c. 7,000 in 1665) with
a combination of agriculture and proto-industry into a small industrial town (population c.
10,000). The primary sector had dropped spectacularly from 57% to 16% of the
registered workforce. The tertiary sector instead had grown somewhat, but services
were still very underdeveloped (7%), considering the large number of inhabitants. The
secondary sector comprised 70% of all household heads with an occupation. This sector
was still very much focussed on the textile industry, which comprised three quarters of
all household heads in industry. Mechanization of the Tilburg textile industry had not yet
taken place. Although the town would be one of the first in the Netherlands to
industrialize, with the introduction of a steam driven spinning machine in 1827, this was
not yet the case in 1810.65 It was thus rather proto-industrial than modern industrial
growth that had caused these dramatic changes in the Tilburg occupational structure. In 1849, a national occupational census was executed, which also differentiated
between various regions and individual municipalities. For the country as a whole, the
division of the working population over the different economic sectors was remarkably
equal: 27% worked in agriculture; 26% in industry; 26% in service and 21% other. The
large category ‘other’ is caused by casual labour, which was undefined and is thus hard
to classify according to sector, although we may assume that a lot of them performed
labour in the primary sector.66 This presumption is strengthened because our
reconstruction of the occupational structure of two rural areas (Guelders and North-
Holland) leads to significantly higher shares of the category ‘other’ than in the individual
cities and towns (Amsterdam, Rotterdam, Leiden, ’s-Hertogenbosch and Zwolle) we
have analysed for 1849.
64 Note that it only concerns household heads, which leaves out the considerable number of women working as maidservants in the tertiary sector. 65 Jansen, Industriële ontwikkeling; Van Gurp, Brabantse stoffen, 214. 66 De Jonge, De industrialisatie, 9-10.
Changing Occupational Structures? Van den Heuvel and Van Nederveen Meerkerk 21
More in general, the occupational structures of respectively urban and of rural
areas show strikingly many more similarities in 1849 than in the previous century. This
probably can partly be explained by the more corresponding data we have: all local
registrations were carried out according to a similar format. Furthermore, not just heads
of households, but all working people were consequently listed, which not only leads to
better comparable datasets than in the eighteenth century, but also to an actual
reflection of the labour market. Despite these issues relating to source material, we do
think that with the establishment of a national state, the various regional labour markets
might have converged in the preceding decades. The replacement of the Republic’s
federal structure with a national reign by a strong-minded king, who was determined to
modernize the country’s economy, had played a large role in its economic unification in
the first decades of the nineteenth century. While in (many of) the rural areas the four different occupational categories are
more or less equal in size and in a way resemble the distribution of the Netherlands as a
whole in 1849, in towns two sectors (industry and service) are by far the largest. Despite
the alleged convergence, within the urban context (again) a clear differentiation between
more industrial cities and commercial cities is visible, which now reached beyond the
province of Holland. Amsterdam and Rotterdam form a good example of the latter. The
occupational structure of these two cities had become almost identical, probably due to
the rise of the Rotterdam harbour in this period. At the end of the nineteenth century, the
Rotterdam port would even outgrow that of Amsterdam.67 At the other end of the
spectrum, we find industrial towns as Leiden and ’s-Hertogenbosch. Although since
1749 the predominantly industrial economy of Leiden shifted towards one with a larger
service sector than before, its secondary sector was still substantial. ’s-Hertogenbosch
on the other hand, experienced growth in the sector of industry and transformed from a
more commercial town in 1808 to a town with an occupational structure that resembled
Leiden.
The most important development in the occupational structure in the Netherlands
in the nineteenth century, albeit in a different pace in the different localities, is the decline
of the category ‘Other’, mainly comprising casual labourers. We can discern different
patterns in rural and urban areas, and within the urban settings we can distinguish
between commercial, industrial and provincial towns. While in the countryside in 1849
the share of casual labourers varied from approximately 15 to 30%, in most towns by
that time it was smaller than one-tenth of the working population. Provincial towns knew
relatively the largest numbers (e.g. various towns in Guelders 15%, Zwolle 8%), while in
67 Paul van de Laar, Stad van formaat: geschiedenis van Rotterdam in de negentiende en twintigste eeuw (Zwolle 2000).

Changing Occupational Structures? Van den Heuvel and Van Nederveen Meerkerk 22
large commercial centres as Amsterdam and Rotterdam only 2% of the labour force was
registered as such. In the end this results in a general decline of this particular group of
workers as is shown in Figure IV.
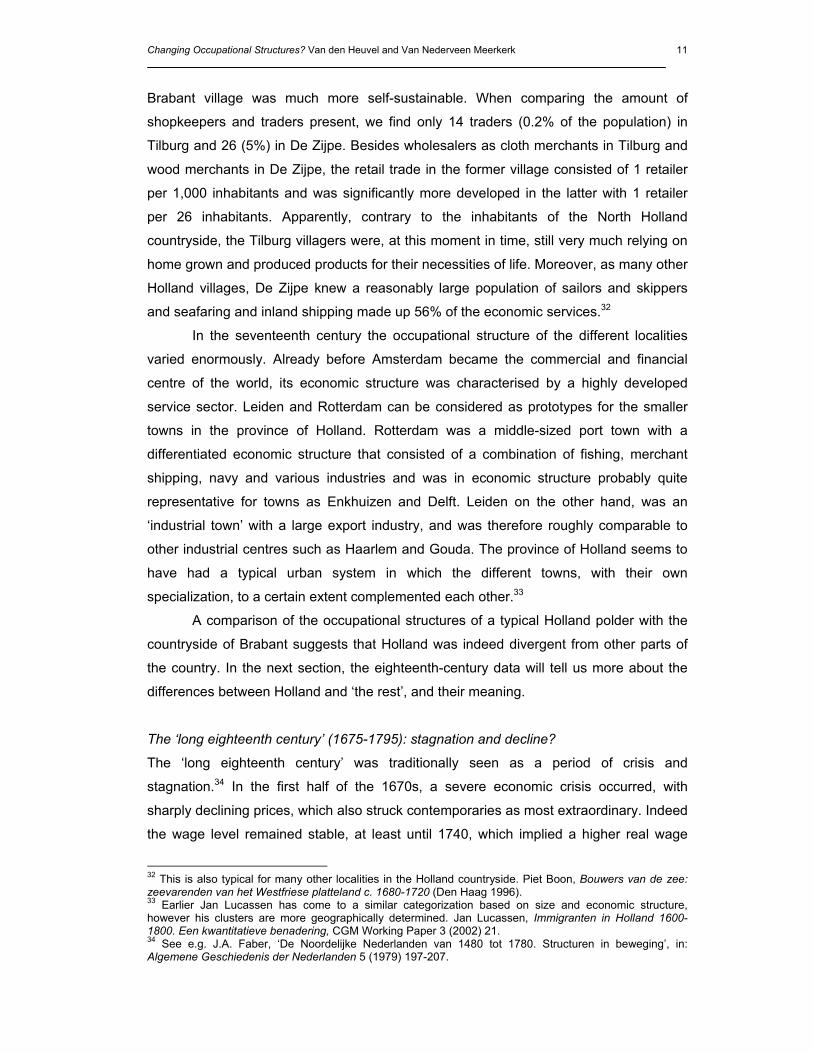
Figure IV. Occupational structure (all inhabitants) of the Netherlands, 1849 and 1899
Whereas in the Netherlands as a whole in 1849 still 21% was not specifically engaged in
a particular occupation or economic sector, fifty years later this has decreased
enormously, to 2%, a level that before was only reached by highly commercial cities in
the province of Holland. In the end, this results nationwide in an equal division between
the three sectors agriculture (31%), industry (33%) and service (34%).
First of all, this points to a transformed structure of the labour market, with indeed
only 31% of the working population in the primary sector. Although we have to bear in
mind that the Dutch economy was far less modern than industrialized countries as
England (6%) and Germany (18%) at the time,68 its share of the primary sector in GDP
was under the European average around 1900.69 Secondly, we can conclude that by
1899, the flexible character of the traditional industry had been replaced by a far more
fixed, time-disciplined, factory proletariat.
Conclusion
The analysis of occupational data from the Netherlands over more than three centuries
showed that in the course of time, the different parts in the Netherlands grew closer and
closer and became economically more integrated. It was precisely this integration that
had important consequences for the distribution of people over the different economic
sectors.
68 Maxine Berg, The Age of Manufactures (1700-1820) (London, 1985) 44. 69 Van Zanden and Van Riel, Strictures of Inheritance, 265.
Netherlands, 1849
27%
26%
26%
21%
Netherlands, 1899
31%
33%
34%
2% agriculture
industry
service
other
Changing Occupational Structures? Van den Heuvel and Van Nederveen Meerkerk 23
In the period that became known as the Dutch Golden Age, the province of
Holland had a highly specialized economic structure. This applied not only to towns, but
also to rural areas, where in typical agrarian polders a relatively large share of the
registered population worked as agrarian wage labourers. During the seventeenth
century, the smaller Holland towns grew into an urban system of on the one hand more
commercial and on the other more industrial urban centres that complemented each
other. In this way, Holland further diverged from the other parts in the country, where –
as the example of Tilburg (1665) has shown – the local economy was still much more
oriented on agriculture. Unfortunately, we do not have data at our disposal for other
parts of the country in this specific period, but censuses of the late seventeenth-century
towns as ’s-Hertogenbosch and Zwolle and of eighteenth-century rural areas as De
Veluwe indicates that in the Golden Age Holland was the exception and not the rule,
even within the Dutch Republic. That Holland nevertheless has determined the general
picture, is obvious, because throughout the early modern period, almost 50% of the
population lived in this province.70
Looking at occupational data of various areas furthermore made clear that the
real economic crisis in the ‘long eighteenth century’ was bound to certain localities and
sectors. It especially occurred in the sector of industry in the province of Holland after
1670. For a large part, this was due to the shift of important export industries to rural
areas outside Holland, to be more precise to the eastern and southern provinces of the
Republic. The service sector however was able to maintain itself and even grow in this
period, especially in already important commercial and maritime centres such as
Amsterdam and Rotterdam. The image of economic depression has to be nuanced by
another, more qualitative shift in the occupational structure. From probably the mid-
seventeenth century onwards, a process of commercialization and ongoing
specialization in the retailing branch took place which spread from cities in Holland in the
17th century (Rotterdam and Leiden) via commercial towns in the other provinces (as ’s-
Hertogenbosch) at the start of the 18th century to other provincial towns (for example
Zwolle) where a real transition did not take place before 1800.
This all leads to the conclusion that there was a highly divergent pattern of
development within the Dutch Republic, in which the economic crisis was very much
concentrated on industry in the Holland cities and towns, and did not so much affect the
service sector. Outside the province of Holland, some parts of the countryside
blossomed because of their proto-industrialization. Furthermore, towns outside Holland
70 1622: 45%; 1780: 46%; 1795: 44% of the total Dutch population lived in Holland. De Vries and Van der Woude, First modern economy, 50-52. In 1849, this percentage had declined to 34%. CBS, Volkstelling 1849.

Changing Occupational Structures? Van den Heuvel and Van Nederveen Meerkerk 24
did not suffer so much and sometimes even experienced industrial growth besides the
already mentioned changes in the commercial sector (Zwolle c. 1670-1750; ’s-
Hertogenbosch c. 1750-1780).
Moreover, we have seen that the ‘modern’ occupational structure of the Dutch
Republic, with low percentages working in the primary sector, mainly applied to Holland.
The rest of the country had large parts of the rural population working in agriculture,
comparable to other West-European economies at the time, with the possible exception
of England, where agriculture only comprised 40% of the national product in 1688.71
Only from the middle of the nineteenth century onwards, in rural areas outside the
province of Holland, the share of the agricultural labour force dropped.
The modernity and economic growth of Holland remained confined to the service
sector, also after 1800. Not surprisingly, the rural industrial areas outside Holland, such
as Brabant and Twente, were the first to witness large-scale mechanization, and in an
international perspective, even they were late to industrialize. In other words, the
pioneering role Holland had had during its Golden Age might have hindered long-term
economic development for the country as a whole. Probably, the federal political
structure of the Republic, rendering large power to the (ever more service-oriented)
Holland cities, prevented this course of development from changing radically. It is
probably also for this reason that a lot of local occupational reconstructions hardly show
any shocking fluctuations between c. 1750 and 1850.
Nevertheless, in 1849, we already see much more converging patterns between
regions within and outside of Holland. In broad lines, a more ‘national’ rather than a
provincial division of labour had occurred, in which (besides the countryside) we can
discern two types of cities, ‘service-oriented’ and ‘industrial-based’ (albeit mostly
traditional, non-mechanized industries). This process seems to have started much
earlier, as in the eighteenth century the various towns under study more and more
resembled each other in the structure of the labour market.
At the end of the nineteenth century, however, a total transformation of the Dutch
occupational structure had taken place. This process of alteration is probably best
illustrated by the decline of the category ‘other’. Whereas this category in most of the
pre-industrial society (thus up to 1850) contained mainly both agrarian day labourers and
wage labourers in industry, these workers had almost disappeared around 1900. With
this, the Dutch economy changed profoundly and more-and-more started to catch up
with neighbouring countries as Germany and England that already underwent such
changes.
71 Berg, Age of Manufactures, 44.

App
endi
x
App
endi
x A
– A
n ov
ervi
ew o
f the
ana
lyse
d so
urce
s (fo
r the
exa
ct re
fere
nces
, see
Bod
y Te
xt, F
ootn
ote
6)
R
egio
n
Pe
riod
Prov
ince
of H
olla
nd
So
uthe
rn p
rovi
nces
Ea
ster
n pr
ovin
ces
Net
herla
nds
tota
l
Am
ster
dam
Le
iden
R
otte
rdam
C
ount
rysi
de
Den
Bos
ch
Cou
ntry
side
Zw
olle
C
ount
rysi
de
1580
-167
5 C
apita
le im
posi
tie 1
585
(tax)
Vo
lkst
ellin
g 15
81
(all
hh)
Klei
n Fa
mili
egel
d 16
74
(tax)
D
e Zi
jpe,
Kle
in
Fam
ilieg
eld
1674
(tax
)
Tilb
urg
Kapi
tale
sch
attin
g 16
65 (a
ll hh
)
30
,000
inh.
1,
493
occ.
(5%
) 12
,170
inh.
1,
883
occ.
(15,
5%)
40,0
00 in
h.
4,54
2 oc
c. (1
1%)
2,41
2 in
h.
528
occ.
(22%
)
c. 7
,000
inh.
15
59 o
cc. (
22%
)
Klei
n Fa
mili
egel
d 16
74 (t
ax)
G
raft,
Zou
t-en
Zee
pgel
d 16
80 (e
xcis
e ta
x)
62,0
00 in
h./2
,490
oc
c. (4
%)
c.
3,0
00 in
h.
72 o
cc. (
2,5%
)
1675
-179
5 Pe
rson
ele
Quo
tisat
ie 1
742
(tax)
H
oofd
geld
174
9 (a
ll hh
) Pe
rson
ele
Quo
tisat
ie
1742
(tax
) W
inke
l, Pe
rson
ele
Quo
tisat
ie 1
742
(tax)
Bi
ljette
ring
1742
(a
ll hh
)
Volk
stel
ling
1712
(a
ll hh
) Ve
luw
e 17
49
c.
220
.000
inh.
11
,234
occ
. (5%
) 37
238
inh.
8,
904
occ.
(24%
) 56
.000
inh.
26
73 o
cc. (
5%)
660
inh.
19
0 oc
c. (2
9%)
12,5
00 in
h.
1,91
0 oc
c. (1
5%)
c.
10,
000
inh.
1,
715
occ.
(17%
)inh.
54,
000
8,68
3 oc
c. (1
6%)
De
Zijp
e, P
erso
nele
Q
uotis
atie
174
2 (ta
x)
Blok
boek
en 1
775
(a
ll hh
)
Volk
stel
ling
1742
(a
ll hh
)
2,15
8 in
h.
518
occ.
(24%
) 14
,049
inh.
2,
797
occ.
(20%
)
12,0
00 in
h.
3,11
5 oc
c. (2
6%)
Gra
ft, P
erso
nele
Q
uotis
atie
174
8 (ta
x)
c. 1
,500
inh.
34
4 oc
c. (2
3%)
1795
-190
0 Vo
lkst
ellin
g 18
49
(all
inh.
) Vo
lkst
ellin
g 18
49
(all
inh.
) Vo
lkst
ellin
g 18
49
(all
inh.
) G
raft,
Pat
entre
gist
ers
1807
Vo
lkst
ellin
g 18
08
(all
hh)
Tilb
urg
Volk
stel
ling
1810
(a
ll in
h.)
Volk
stel
ling
1812
(a
ll hh
)
22
4,03
5 in
h.
71,8
27 o
cc. (
32%
) 35
,895
inh.
14
,817
occ
. (41
%)
90,0
73 in
h.
32,2
86 o
cc. (
36%
) 1,
090
inh.
39
7 oc
c. (3
6%)
13,9
00 in
h.
1,80
0 oc
c. (1
3%)
9,68
0 in
h.
2,45
7 oc
c. (2
5%)
6,22
1 in
h.
1,22
7 oc
c (2
0%)
De
Zijp
e, P
aten
tregi
ster
s 18
07
Volk
stel
ling
1849
(a
ll in
h.)
Vo
lkst
ellin
g 18
49
(all
inh.
) G
ueld
ers
Volk
stel
ling
1849
(all
inh.
) Vo
lkst
ellin
g 18
49
(all
inh.
)
???
inh.
55
1 oc
c.
21,7
03 in
h.
9,24
9 oc
c. (4
3%)
18
,168
inh.
6,
514
occ.
(36%
)271,
077
inh.
11
1,83
0 oc
c. (4
1%)
3,05
6,87
9 in
h.
1,25
8,27
2 oc
c. (4
1%)
Volk
stel
ling
coun
trysi
de
NH
184
9 (a
ll in
h.)
Bero
epen
telli
ng 1
899
(all
inh.
)
174,
958
inh.
68
,364
occ
. (39
%)
5,10
4,13
7 in
h.
1,92
3,58
4 oc
c. (3
8%)
[inh.
= in
habi
tant
s; o
cc. =
occ
upat
iona
l rec
ords
; hh
= ho
useh
old
head
s]
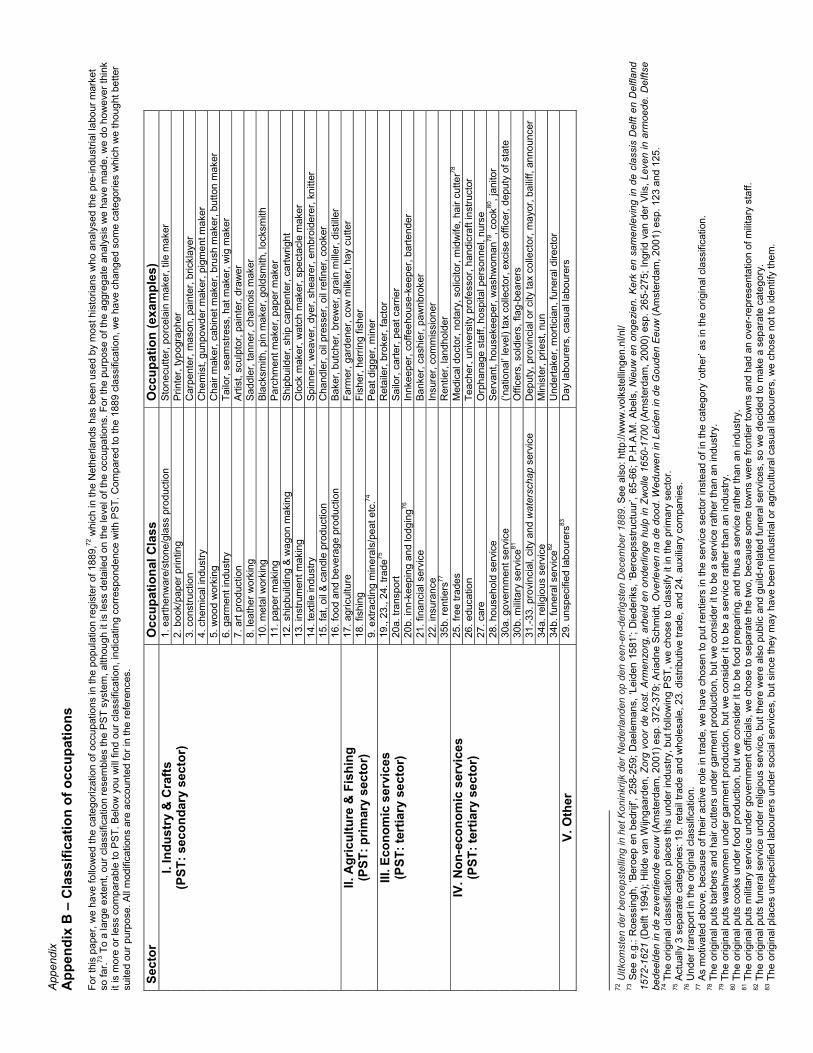
App
endi
x A
ppen
dix
B –
Cla
ssifi
catio
n of
occ
upat
ions
Fo
r thi
s pa
per,
we
have
follo
wed
the
cate
goriz
atio
n of
occ
upat
ions
in th
e po
pula
tion
regi
ster
of 1
889,
72 w
hich
in th
e N
ethe
rland
s ha
s be
en u
sed
by m
ost h
isto
rians
who
ana
lyse
d th
e pr
e-in
dust
rial l
abou
r mar
ket
so fa
r.73 T
o a
larg
e ex
tent
, our
cla
ssifi
catio
n re
sem
bles
the
PS
T sy
stem
, alth
ough
it is
less
det
aile
d on
the
leve
l of t
he o
ccup
atio
ns. F
or th
e pu
rpos
e of
the
aggr
egat
e an
alys
is w
e ha
ve m
ade,
we
do h
owev
er th
ink
it is
mor
e or
less
com
para
ble
to P
ST. B
elow
you
will
find
our
cla
ssifi
catio
n, in
dica
ting
corr
espo
nden
ce w
ith P
ST. C
ompa
red
to th
e 18
89 c
lass
ifica
tion,
we
have
cha
nged
som
e ca
tego
ries
whi
ch w
e th
ough
t bet
ter
suite
d ou
r pur
pose
. All
mod
ifica
tions
are
acc
ount
ed fo
r in
the
refe
renc
es.
Se
ctor
O
ccup
atio
nal C
lass
O
ccup
atio
n (e
xam
ples
) 1.
ear
then
war
e/st
one/
glas
s pr
oduc
tion
Ston
ecut
ter,
porc
elai
n m
aker
, tile
mak
er
2. b
ook/
pape
r prin
ting
Prin
ter,
typo
grap
her
3. c
onst
ruct
ion
Car
pent
er, m
ason
, pai
nter
, bric
klay
er
4. c
hem
ical
indu
stry
C
hem
ist,
gunp
owde
r mak
er, p
igm
ent m
aker
5.
woo
d w
orki
ng
Cha
ir m
aker
, cab
inet
mak
er, b
rush
mak
er, b
utto
n m
aker
6.
gar
men
t ind
ustry
Ta
ilor,
seam
stre
ss, h
at m
aker
, wig
mak
er
7. a
rt pr
oduc
tion
Artis
t, sc
ulpt
or, p
aint
er, d
raw
er
8. le
athe
r wor
king
Sa
ddle
r, ta
nner
, cha
moi
s m
aker
10
. met
al w
orki
ng
Blac
ksm
ith, p
in m
aker
, gol
dsm
ith, l
ocks
mith
11
. pap
er m
akin
g
Parc
hmen
t mak
er, p
aper
mak
er
12. s
hipb
uild
ing
& w
agon
mak
ing
Sh
ipbu
ilder
, shi
p ca
rpen
ter,
cartw
right
13
. ins
trum
ent m
akin
g C
lock
mak
er, w
atch
mak
er, s
pect
acle
mak
er
14. t
extil
e in
dust
ry
Spin
ner,
wea
ver,
dyer
, she
arer
, em
broi
dere
r, kn
itter
15
. fat
, oil
& ca
ndle
pro
duct
ion
Cha
ndle
r, oi
l pre
sser
, oil
refin
er, c
ooke
r
I. In
dust
ry &
Cra
fts
(PST
: sec
onda
ry s
ecto
r)
16. f
ood
and
beve
rage
pro
duct
ion
Ba
ker,
butc
her,
brew
er, g
rain
mill
er, d
istil
ler
17. a
gric
ultu
re
Farm
er, g
arde
ner,
cow
milk
er, h
ay c
utte
r 18
. fis
hing
Fi
sher
, her
ring
fishe
r II.
Agr
icul
ture
& F
ishi
ng
(PST
: prim
ary
sect
or)
9. e
xtra
ctin
g m
iner
als/
peat
etc
.74
Peat
dig
ger,
min
er
19.,
23.,
24. t
rade
75
Ret
aile
r, br
oker
, fac
tor
20a.
tran
spor
t Sa
ilor,
carte
r, pe
at c
arrie
r 20
b. in
n-ke
epin
g an
d lo
dgin
g76
Innk
eepe
r, co
ffeeh
ouse
-kee
per,
barte
nder
21
. fin
anci
al s
ervi
ce
Bank
er, c
ashi
er, p
awnb
roke
r 22
. ins
uran
ce
Insu
rer,
com
mis
sion
er
III. E
cono
mic
ser
vice
s (P
ST: t
ertia
ry s
ecto
r)
35b.
rent
iers
77
Ren
tier,
land
hold
er
25. f
ree
trade
s M
edic
al d
octo
r, no
tary
, sol
icito
r, m
idw
ife, h
air c
utte
r78
26. e
duca
tion
Teac
her,
univ
ersi
ty p
rofe
ssor
, han
dicr
aft i
nstru
ctor
27
. car
e O
rpha
nage
sta
ff, h
ospi
tal p
erso
nnel
, nur
se
28. h
ouse
hold
ser
vice
Se
rvan
t, ho
usek
eepe
r, w
ashw
oman
79, c
ook80
, jan
itor
30a.
gov
ernm
ent s
ervi
ce
(‘nat
iona
l’ le
vel)
tax
colle
ctor
, exc
ise
offic
er, d
eput
y of
sta
te
30b.
mili
tary
ser
vice
81
Offi
cers
, sol
dier
s, fl
ag-b
eare
rs
31.-3
3. p
rovi
ncia
l, ci
ty a
nd w
ater
scha
p se
rvic
e D
eput
y, p
rovi
ncia
l or c
ity ta
x co
llect
or, m
ayor
, bai
liff,
anno
unce
r 34
a. re
ligio
us s
ervi
ce
Min
iste
r, pr
iest
, nun
IV. N
on-e
cono
mic
ser
vice
s (P
ST: t
ertia
ry s
ecto
r)
34b.
fune
ral s
ervi
ce82
U
nder
take
r, m
ortic
ian,
fune
ral d
irect
or
V. O
ther
29
. uns
peci
fied
labo
urer
s83
Day
labo
urer
s, c
asua
l lab
oure
rs
72 U
itkom
sten
der
ber
oeps
telli
ng in
het
Kon
inkr
ijk d
er N
eder
land
en o
p de
n ee
n-en
-der
tigst
en D
ecem
ber 1
889.
See
als
o: h
ttp://
ww
w.v
olks
telli
ngen
.nl/n
l/ 73
See
e.g
.: R
oess
ingh
, ‘Be
roep
en
bedr
ijf’,
258-
259;
Dae
lem
ans,
‘Lei
den
1581
’; D
iede
riks,
‘Ber
oeps
stru
ctuu
r’, 6
5-66
; P.H
.A.M
. Abe
ls, N
ieuw
en
onge
zien
. Ker
k en
sam
enle
ving
in d
e cl
assi
s D
elft
en D
elfla
nd
1572
-162
1 (D
elft
1994
); H
ilde
van
Wijn
gaar
den,
Zor
g vo
or d
e ko
st. A
rmen
zorg
, arb
eid
en o
nder
linge
hul
p in
Zw
olle
165
0-17
00 (A
mst
erda
m, 2
000)
esp
. 265
-275
; Ing
rid v
an d
er V
lis, L
even
in a
rmoe
de. D
elfts
e be
deel
den
in d
e ze
vent
iend
e ee
uw (A
mst
erda
m, 2
001)
esp
. 372
-379
; Aria
dne
Schm
idt,
Ove
rleve
n na
de
dood
. Wed
uwen
in L
eide
n in
de
Gou
den
Eeu
w (A
mst
erda
m, 2
001)
esp
. 123
and
125
.
74 T
he o
rigin
al c
lass
ifica
tion
plac
es th
is u
nder
indu
stry
, but
follo
win
g P
ST, w
e ch
ose
to c
lass
ify it
in th
e pr
imar
y se
ctor
. 75
Act
ually
3 s
epar
ate
cate
gorie
s: 1
9. re
tail
trade
and
who
lesa
le, 2
3. d
istri
butiv
e tra
de, a
nd 2
4. a
uxili
ary
com
pani
es.
76
Und
er tr
ansp
ort i
n th
e or
igin
al c
lass
ifica
tion.
77
As
mot
ivat
ed a
bove
, bec
ause
of t
heir
activ
e ro
le in
trad
e, w
e ha
ve c
hose
n to
put
rent
iers
in th
e se
rvic
e se
ctor
inst
ead
of in
the
cate
gory
‘oth
er’ a
s in
the
orig
inal
cla
ssifi
catio
n.
78 T
he o
rigin
al p
uts
barb
ers
and
hair
cutte
rs u
nder
gar
men
t pro
duct
ion,
but
we
cons
ider
it to
be
a se
rvic
e ra
ther
than
an
indu
stry
. 79
The
orig
inal
put
s w
ashw
omen
und
er g
arm
ent p
rodu
ctio
n, b
ut w
e co
nsid
er it
to b
e a
serv
ice
rath
er th
an a
n in
dust
ry.
80 T
he o
rigin
al p
uts
cook
s un
der f
ood
prod
uctio
n, b
ut w
e co
nsid
er it
to b
e fo
od p
repa
ring,
and
thus
a s
ervi
ce ra
ther
than
an
indu
stry
. 81
The
orig
inal
put
s m
ilita
ry s
ervi
ce u
nder
gov
ernm
ent o
ffici
als,
we
chos
e to
sep
arat
e th
e tw
o, b
ecau
se s
ome
tow
ns w
ere
front
ier t
owns
and
had
an
over
-rep
rese
ntat
ion
of m
ilita
ry s
taff.
82
The
orig
inal
put
s fu
nera
l ser
vice
und
er re
ligio
us s
ervi
ce, b
ut th
ere
wer
e al
so p
ublic
and
gui
ld-r
elat
ed fu
nera
l ser
vice
s, s
o w
e de
cide
d to
mak
e a
sepa
rate
cat
egor
y.
83 T
he o
rigin
al p
lace
s un
spec
ified
labo
urer
s un
der s
ocia
l ser
vice
s, b
ut s
ince
they
may
hav
e be
en in
dust
rial o
r agr
icul
tura
l cas
ual l
abou
rers
, we
chos
e no
t to
iden
tify
them
.
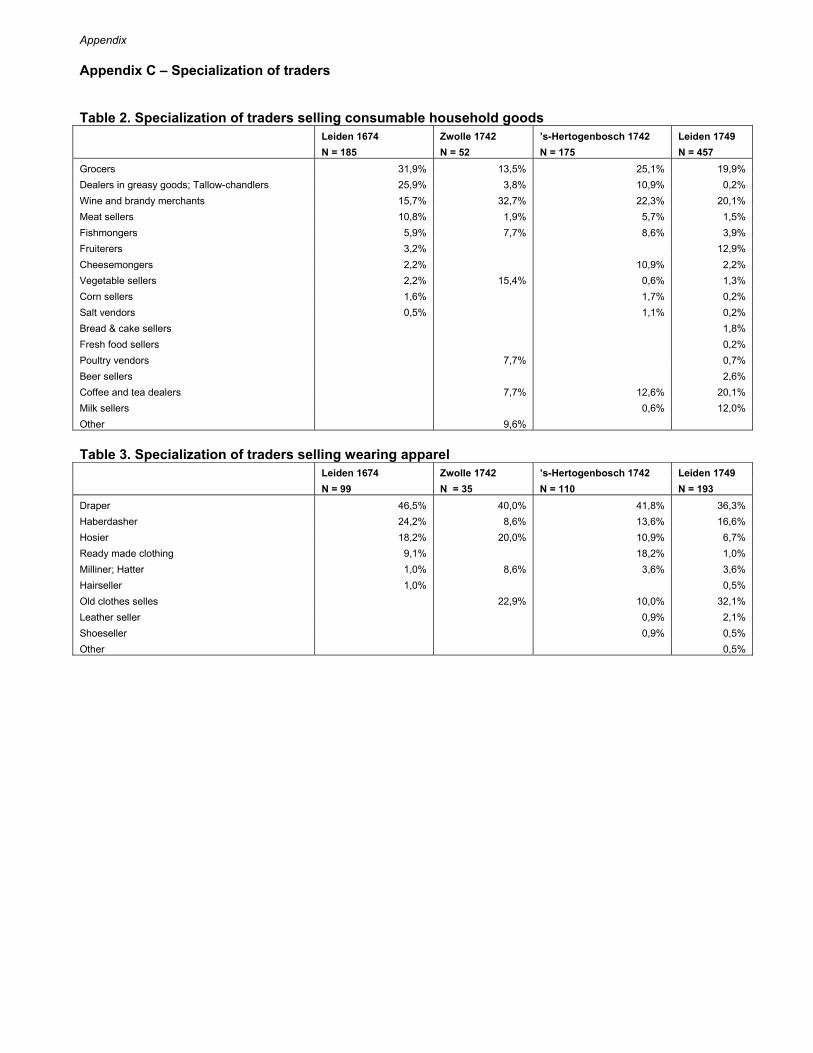
Appendix
Appendix C – Specialization of traders Table 2. Specialization of traders selling consumable household goods Leiden 1674 Zwolle 1742 ’s-Hertogenbosch 1742 Leiden 1749 N = 185 N = 52 N = 175 N = 457 Grocers 31,9% 13,5% 25,1% 19,9% Dealers in greasy goods; Tallow-chandlers 25,9% 3,8% 10,9% 0,2% Wine and brandy merchants 15,7% 32,7% 22,3% 20,1% Meat sellers 10,8% 1,9% 5,7% 1,5% Fishmongers 5,9% 7,7% 8,6% 3,9% Fruiterers 3,2% 12,9% Cheesemongers 2,2% 10,9% 2,2% Vegetable sellers 2,2% 15,4% 0,6% 1,3% Corn sellers 1,6% 1,7% 0,2% Salt vendors 0,5% 1,1% 0,2% Bread & cake sellers 1,8% Fresh food sellers 0,2% Poultry vendors 7,7% 0,7% Beer sellers 2,6% Coffee and tea dealers 7,7% 12,6% 20,1% Milk sellers 0,6% 12,0% Other 9,6% Table 3. Specialization of traders selling wearing apparel Leiden 1674 Zwolle 1742 ’s-Hertogenbosch 1742 Leiden 1749 N = 99 N = 35 N = 110 N = 193 Draper 46,5% 40,0% 41,8% 36,3% Haberdasher 24,2% 8,6% 13,6% 16,6% Hosier 18,2% 20,0% 10,9% 6,7% Ready made clothing 9,1% 18,2% 1,0% Milliner; Hatter 1,0% 8,6% 3,6% 3,6% Hairseller 1,0% 0,5% Old clothes selles 22,9% 10,0% 32,1% Leather seller 0,9% 2,1% Shoeseller 0,9% 0,5% Other 0,5%