changing landscape perceptions and the meaning of
TRANSCRIPT

CHANGING LANDSCAPE PERCEPTIONS AND THE
MEANING OF WILDERNESS:
VISITORS’ BELIEFS ABOUT A NATIONAL PARK
BY
REBECCA ANN GROSSBERG
A thesis submitted in partial fulfillment of the requirements for the degrees of
MASTER OF SCIENCE
(Rural Sociology)
and
MASTER OF SCIENCE (Land Resources)
at the
UNIVERSITY OF WISCONSIN-MADISON
1999

1
Chapter 1
Introduction: The Great New Wilderness Debate
Rapid social change in the nineteenth and twentieth centuries has produced numerous
ideas about wild nature. These often contradictory ideas have tended not to replace each
other entirely, but to accumulate, layer upon layer. As consensus about any one true
meaning of wilderness fades, debates abound in academic circles. Philosophers, ecologists,
historians, environmentalists and others are debating the meaning and utility of the
wilderness concept. The Great New Wilderness Debate: A Collection of Writings Defining
Wilderness from John Muir to Gary Snyder (Callicott & Nelson, 1998), traces the
development of what the editors call “the received wilderness idea,” criticisms and defenses
of the idea, and innovative ways of thinking that move beyond it. The question of whether
“wilderness” is a biological fact or a social construction lies at the core of the debate.
Wilderness as a Social Construction
The early American preservationists were concerned with wilderness as a real entity
that deserved protection, and frequently spoke of the immense power of the wild landscape.
However, at times they refer to wilderness as something less tangible, something that
depends on the perception of the observer. The following quotation by John Muir suggests
the subjectivity of a wild landscape.
To the sane and free it will hardly seem necessary to cross the continent in search of wild beauty, however easy the way, for they find it in abundance wherever they chance to be. Like Thoreau they see forests in orchards and patches of huckleberry

2
brush, and oceans in ponds and drops of dew. Few in these hot, dim, strenuous times are quite sane or free; choked with care like clocks full of dust, laboriously doing so much good and making so much money – or so little – they are no longer good for themselves.
– Muir, 1901, p.49
Muir acknowledges that certain individuals have the capacity to perceive wilderness in
almost any landscape. He implies that large expanses of wild land must be preserved for the
rest of us, who are not “sane and free.” A more recent articulation of the subjective nature of
wilderness comes from Yi-Fu Tuan’s book Topophilia.
People rarely perceive the irony inherent in the idea of preserving the wilderness. “Wilderness” cannot be defined objectively: it is as much a state of the mind as a description of nature. By the time we can speak of preserving and protecting wilderness, it has already lost much of its meaning… As a state of the mind, true wilderness exists only in the great sprawling cities.
– Tuan, 1974, p.112
These two quotations from Tuan and Muir express the fundamental idea behind the social
constructionist perspective. Wilderness consists of more than an ecological system. Its
meaning can be found more readily in people’s minds than in the landscape itself.
The tenet that wilderness is a subjective concept suggests that it is malleable through
time and space. Roderick Nash traces the historical development of the wilderness idea in
his book “Wilderness and the American Mind.” Nash points out that although “wilderness”
is a noun it behaves like an adjective:
The term designates a quality (as the “-ness” suggests) that produces a certain mood or feeling in a given individual and, as a consequence, may be assigned by that person to a specific place. Because of this subjectivity a universally acceptable definition of wilderness is elusive. One man’s wilderness may be another’s roadside picnic ground. – Nash, 1982, p.1

3
Nash describes the transformation in American attitudes toward wilderness as a positive
evolution. In the Old World and Puritan New England, the predominant attitude was fear
and disgust. The Romantic period glorified and sacralized wild nature, and in the late
nineteenth century John Muir and his followers advocated a preservation ethic. In revealing
that “wilderness” has had several different meanings at different points in American history,
Nash’s work suggests that we can not take it for granted as a biological fact.
William Cronon echoes Nash’s historical construction narrative in his 1995 essay
“The Trouble with Wilderness; or, Getting Back to the Wrong Nature.” Cronon writes: “Far
from being the one place on earth that stands apart from humanity, [wilderness] is quite
profoundly a human creation” (1995, p.69). He supports his argument by tracing the
different conotations wilderness has had at different points in history. Up until the nineteenth
century, the conotation was negative. Wilderness was thought of as a dangerous, sinister
place representing moral confusion. The Romantic Movement turned this image on its head
by emphasizing the sublime character of the wilderness. It still had frightening qualities, but
now it was a place one went to find God, rather than confront the devil.
Cronon traces another cultural force that has shaped the wilderness idea, the myth of
the frontier. Americans created their nation by taming the wilderness, so once the frontier
was “closed” at the end of the nineteenth century protecting wilderness became necessary to
preserving the national character. Not only was the wilderness a cathedral where one could
hope to find God, it was also a heritage site where one could recall what it meant to be an
American. In Cronon’s view, the American wilderness carries the complex baggage of these
multiple cultural meanings.

4
Coincident with the changing connotations, Cronon adds, institutional changes have
also affected the meaning of wilderness. The end of the nineteenth century saw an increase
in wilderness tourism, particularly among urban elites. With the creation of the national park
system, wilderness was ensured to be a safe place by government bureaucratic agencies.
Furthermore, it was a place devoid of human settlement. Native Americans were removed
from the newly acquired government land and resettled onto reservations. Thus, none of the
original frontier conflicts existed anymore, and rich urbanites could recreate safely in the
now “domesticated” wilderness. At this point Cronon departs from a Nash-style optimism
and staunchly criticizes the wilderness idea. The “trouble with wilderness” that he identifies
is its definition as a place where humans are not. This meaning sets up a human-nature
dualism that he thinks jeopardizes the goals of contemporary environmentalism. Cronon’s
provocative essay has endured much criticism, from other historians, environmentalists, and
conservation biologists (Sessions 1997, Worster 1997, Waller 1998, Soule & Lease 1995).
Cronon, however, was not the first to criticize the American concept of wilderness.
“The first criticism of the wilderness idea was voiced by those upon whom it was imposed
and those whom it dispossessed” (Callicott & Nelson 1998, p.5). Native American leaders
such as Chief Luther Standing Bear challenged the American concept of wilderness as early
as 1933 (Land of the Spotted Eagle, in Callicott & Nelson 1998). Recent critiques from
“third and fourth world” thinkers have focused on the danger of importing the American
ideal of wilderness to developing countries. In 1989, Indian sociologist Ramachandra Guha
published “Radical Environmentalism and Wilderness Preservation: a Third World
Perspective” in Environmental Ethics. Guha attacked the American Deep Ecology
5
movement for its imperialistic attempt to apply the American definition of wilderness to
countries like India. Deep Ecologist Arne Naess and political scientist David Johns
responded in subsequent issues of Environmental Ethics, expressing their view that
wilderness has intrinsic value and cannot be conceived as a mere construction of human
culture. With this intellectual exchange, the “New Wilderness Debate” was born (Callicott &
Nelson 1998, p.7).
Wilderness as a Biological Fact
Other voices in the debate rebut the social constructionist perspective and argue that
wilderness is a biological fact. Like social constructionism, the biological argument has its
roots in the writings of some of the early American preservationists. The following passage
from Sigurd Olson’s essay “Why Wilderness?” exemplifies this view.
[Men today] need the sense of actual struggle and accomplishment, where the odds are real and where they know that they are no longer playing make believe. These men need more than picnics, purling streams, or fields of daffodils to stifle their discontent, more than mere solitude and contemplation to give them peace. Sigurd Olson, 1938, p.98
Olson conveys wilderness as something distinct from humans. The wilderness experience
has a powerful effect on men that can be found in no other (tamer) landscape. Olson uses the
word “real” repeatedly throughout the essay – for example, in the above phrase “where the
odds are real and where they know that they are no longer playing make-believe.” In his
view, wilderness is not an idea in the minds of humans, but a real and potent force outside of
their consciousness.

6
This view of wilderness as a physical reality has resurfaced in contemporary
responses to social constructionism. Dave Foreman (1998) echoes the language of Sigurd
Olson in his essay “Wilderness Areas for Real.” Deep Ecologist George Sessions (1997)
applies the term “postmodern deconstructionists” to Cronon and others who suggest that
nature and wilderness are mere social constructions. He defines postmodern
deconstructionism as “a contemporary form of anthropocentric humanism which espouses
cultural relativism, an antipathy to science, and a preference for cities” (1997, p.46).
Sessions criticizes the leftist activists and intellectuals who have attempted to co-opt the
environmental movement into their social justice agendas, and he criticizes social
constructionist theorists like Cronon in the same vein. From his deep ecological standpoint,
wild nature is real and valuable in its own right, and should not be reduced to a mere figment
of human imagination (for more responses to postmodern deconstructionism, see Soule and
Lease, 1995).
Environmental historian Donald Worster (1997) criticizes some of his colleagues for
turning environmental history into an anthropocentric narrative. Following Stephen J. Pyne
(1982), many historians claim that none of the North American landscape was ever truly
wilderness; it had been deliberately manipulated by native populations for thousands of years
before European settlement. Worster expresses skepticism that “two million people spread
over what is now Canada and the United States, a people armed with primitive stone tools,…
could… have truly ‘domesticated’ the whole continent” (1997, p.10). Worster further
criticizes Nash and Cronon for implying that “the wilderness is nothing real but is only a
cultural construct dreamed up by rich white romantics” (1997, p.11). The love of wilderness,

7
Worster argues, “has much older cultural roots, and it may even have roots in the very
structure of human feelings and consciousness going far back into the evolutionary past,
transcending any cultural patterns” (1997, p.11).
Botanist Donald Waller (1998) criticizes Cronon for only discussing anthropocentric
values of wilderness, suggesting that there are ecological values as well that can only be
determined by science. Waller questions Cronon’s notion that the tree in the garden is just as
wild as the trees in the forest. He states that “the tree in the garden is not wild because it has
been removed from its ancestral ecological and evolutionary context. We should define an
organism as tame or wild according to its context rather than its constitution” (1998, p.544).
Considering all areas as equally wild poses the problem of environmental relativism: if this is
so, why should we be concerned with conserving nature at all?
Waller, Worster, Sessions, and many others have contributed to a backlash to
social constructionism. The consequences extend beyond acadeamia to the realm of
conservation policy. Recent trends in conservation advocate the protection of large
wilderness areas (Soule and Noss, 1998). This process, termed “rewilding”, is justified by
ecological principles. The logic is as follows. Keystone predators are necessary to maintain
ecological interactions in a given system; wide-ranging predators require large cores of
protected landscape; these core areas must be connected by corridors “to insure long-term
viability of wide-ranging species” (1998, p.22). Contrary to Cronon’s view that small,
“domesticated” natural areas close to home are just as worthy of protection as remote
wildernesses, the rewilding perspective unambiguously favors large wild landscapes.

8
Summary
The biological fact and social construction arguments embody two very different
approaches to understanding the meaning of wilderness. To those who take the biological
approach, wilderness is essentially an unproblematic idea. They focus on scientifically (or,
sometimes, philosophically) defining and defending wilderness. People of the constructionist
leaning come at the issue more critically. Critics of the wilderness idea are diverse; the
concept of wilderness has been termed “ethnocentric, androcentric, phallocentric,
unscientific, unphilosophic, impolitic, outmoded, even genocidal” (Callicott & Nelson, 1998,
p.2). Despite their diversity, however, these writers all start from the fundamental
observation that wilderness is socially defined. The concept has the potential to take
different shapes in different historical eras and cultural contexts.
The New Wilderness Debate is a debate about the concept of wilderness, not
necessarily about its form. People do not argue that wilderness is either entirely socially
constructed or entirely objective, and therefore I do not aim to prove that one side of the
debate is “right.” Rather, I seek a middle ground. I start from the social constructionist tenet
that wilderness definitions are subjective and malleable. This chapter has introduced my
broad research question: is it accurate and useful to view wilderness as a social construction?
More specifically, I will ask, how do wilderness definitions change over time? I will ground
this question by examining visitors’ beliefs about a particular natural landscape: the Apostle
Islands National Lakeshore.

9
Chapter 2
The Research Context and the Apostle Islands Study
Research about wilderness users’ behaviors, attitudes, and beliefs began in the 1960s.
It was spurred in part by the massive increase in outdoor recreation among Americans since
the end of the Second World War (ORRRC, 1962a). The passage of the Wilderness Act of
1964 further encouraged social scientists to examine users’ reactions to the wilderness
system. Some of the first researchers (Lucas, 1964b; Taves et al., 1960) compared paddling
canoeists in The Boundary Waters Canoe Area Wilderness to other campers. Lucas found
that canoeists were more attracted by the wilderness qualities of the area and perceived less
of the area as real wilderness. Merriam and Ammons (1967) describe a range of users’
wilderness concepts, from the mountaineer to the roadside camper. The ORRRC (1962b,
p.135) used frequency of wilderness use as a “rough and partial measure of commitment.”
These early studies employed various measures of wilderness use, beliefs, and feelings.
They represented a burgeoning scholarly interest in the perspectives of wilderness users.
Wilderness Purism
In the late 1960s and early 1970s, researchers (Hendee et al., 1968; Stankey, 1973)
began to systematize their measures of wilderness concepts in the form of attitude scales.
John Hendee, William Catton, and their associates at the University of Washington (1968)
devised a scale to measure “wilderness purism.” Their objective was to identify differences

10
between wilderness-purists and other visitors in order to better predict users’ management
preferences. They argued that since “the use of popular preference to guide wilderness
management is limited by physical constraints” (1968, p.2), and purists are more cognizant of
and sensitive to these constraints, managers should pay greater attention to the attitudes and
beliefs of the purists.
Hendee et al.’s questionnaire presented 60 questions tapping preferences for various
activities, benefits, and characteristics the researchers thought were associated with
wilderness. Hendee et al. coded a positive response to certain items (e.g. bathing beaches,
private cottages) as “urbanist” and a positive response to other items (e.g. absence of man-
made features, solitude) as “wildernist.” They retained the 30 items with the highest
interitem correlations for the final “wildernism scale”: wilderness users were placed on a
continuum from “urbanists” to “strong wildernists” based on the sum of their preference
responses. Hendee et al. found that moderate and strong wildernists were more highly
educated, more likely to have been raised in urban areas, more likely to belong to
conservationist or outdoors organizations, and had more close friends who also participated
in wilderness recreation.
George Stankey (1973) created a similar attitude scale, which he called the
“wilderness purism” scale. The measurement items he used differed from those of Hendee et
al.: Stankey attempted to link them as closely as possible to aspects of the Wilderness Act.
The wilderness purism scale has been widely cited and replicated, even as recently as 1998
(Higham 1998, for example).

11
Beliefs and Attitudes
Heberlein (1973) criticized the “wildernism scale” of Hendee et al. for having little
grounding in attitude theory. Social psychological theories about attitudes all generally agree
that an attitude is a mental state that refers to a specific object. Many theorists differentiate
attitudes into two components: affect and beliefs 1
Attitude theory portrays the relationship of beliefs and attitudes as a vertical structure.
In this configuration, multiple beliefs may be combined in people’s minds to form higher
order beliefs. For example:
(Heberlein 1973). Affect refers to an
emotional state, and is usually measured in questionnaires by a scale of liking-disliking in
regard to the particular object. Beliefs, on the other hand, indicate cognitive states, or “facts”
that an individual presumes to “know” about an object. Beliefs can pertain to the component
parts, characteristics, qualities, or attributes of an object, or the object’s relations with other
objects. To accurately tap attitudes requires that one understand both of these components.
Heberlein argued that “Before a user study can have any strong application it has to show just
what people believe, how they feel about these beliefs, and how these beliefs and feelings are
related” (Heberlein 1973, p.23).
Belief 1: The Apostle Islands is a wilderness. Belief 2: People use motorized boats in the Apostle Islands. New Belief: Motorized travel is acceptable in wilderness. Furthermore, beliefs and affect can combine to generate attitudes. Here is a simple example:

12
Belief: The Apostle Islands is a wilderness. Affect: I like the Apostle Islands. Attitude: I like wilderness.
People’s attitudes are, of course, more complex than these models portray. Attitude
theorists also identify horizontal structure, as “the degree to which different combinations of
cognitions and affect lead to the same conclusion” (Heberlein 1973, p.24). An individual’s
attitude toward wilderness, therefore, is probably based on more than his or her beliefs and
feelings about the Apostle Islands. It is based on experiences (s)he and has had in other
wilderness areas, and on broader social influences such as the portrayal of wilderness in
magazines and on television.
Heberlein argued that the “wildernism” scale only measures affect. The researchers
identified 60 characteristics, activities, and benefits that they presumed to be associated with
wilderness, and asked people to indicate how much they liked or disliked each one. They did
not first ask people whether or not they believed each item to be related to wilderness.
Furthermore, Heberlein observed, “the attitude object itself was highly differentiated and not
unidimensional” (p.25). That is, the researchers assumed that a single attitude (toward
wilderness) underlies people’s responses to all 60 items. This assumption was problematic:
“a factor analysis of the original 60 items showed seven clusters of items, suggesting as many
unidimensional attitude scales” (p.25).
Wilderness Beliefs
1 Most contemporary theorists tend to identify three dimensions of attitudes: affect, beliefs, and behavioral intentions (Albrecht et al. 1987, p.188). The distinction between affect and beliefs, however, is sufficient for the present discussion.

13
Insights from social psychology such as those described above suggest two ways in
which attitude scales may produce confusion. First, if not carefully pre-tested, a multi-item
scale might measure attitudes toward more than one object. Second, failing to measure
beliefs and affect separately may create confusion as to what people’s feelings are really
about. For example, Hendee et al.’s question about how much people like solitude says
nothing about whether or not they believe they could experience solitude in the wilderness.
To avoid such confusion, I follow Heberlein (1973) in advocating that beliefs and affect be
separated both conceptually and operationally. The present study will only consider beliefs
about a particular “wilderness” landscape.2 As such, this investigation only considers one
component of visitors’ attitudes toward wilderness. I will consider beliefs alone in order to
examine the question of changing wilderness definitions.3 My concern is only with people’s
beliefs about the qualities that constitute a wilderness. Bringing the affective component of
attitudes into this analysis would needlessly complicate the issue.
I will now turn to examine the literature on wilderness beliefs. Researchers have
considered general levels of knowledge about wilderness, beliefs about the attributes of
wilderness, beliefs about acceptable activities in wilderness, and beliefs about the wilderness
qualities of particular landscapes. Young (1980) investigated the relationship between
knowledge about wilderness and level of approval. To tap knowledge, he asked respondents
eight multiple-choice questions regarding the definition of wilderness and its management as
specified in the Wilderness Act of 1964. He found that those who were most informed about
the particulars of the Act were more likely to approve of wilderness protection. Some
2 “Wilderness “ is in quotation marks here because the landscape under study, the Apostle Islands National Lakeshore, is not an officially designated wilderness area.

14
reseachers (Yankelovich, Skelly & White Inc., 1978; Lucas, 1964a) have asked people what
elements they believe characterize wilderness. Yankelovich, Skelly & White Inc. found that
“over half the public believed developed campgrounds with sanitary facilities were
permitted, 42 percent believed sightseeing by car was permitted, 41 percent thought
commercial harvesting of trees was permitted, and 32 percent thought motorcycling and
jeeping were permitted” (Stankey and Schreyer, 1986, p.261). Another approach (Field
Research Corporation, 1977; Beaulieu, 1984) has been to ask respondents to describe what
characterizes a particular environment for them. Results indicate that nature and beauty,
solitude, and freedom are important qualities of wilderness environments. Shreyer and
Nielson (1978) assessed visitor perceptions of wilderness qualities by asking people if they
considered the area they were visiting to be a wilderness. George Stankey and Robert Lucas
(1984) argued that visitors’ beliefs about environmental conditions can and should be used to
inform wilderness management decisions.
The present study seeks to expand on the existing literature by investigating how
wilderness beliefs have changed over the last two decades. This research is timely, as studies
about wilderness concepts are recently beginning to resurface. James Higham (1998) argued
that “an understanding of tourist perceptions of wilderness is crucial to the management of
wilderness tourism.” Higham observed that many New Zealand tourists hold beliefs that do
not correspond to the legal definition of wilderness. He then examined tourists’ wilderness
perceptions and, following Stankey (1973), classified them by their level of “purism.”
Higham created a scale of wilderness purism for international tourism, and concluded that
3 Sometimes I use the terms “perceptions,” “definitions” and “meanings,” all of which I equate with “beliefs.”

15
wilderness management should provide experiences for people throughout the purism
spectrum.
Two Canadian geographers and a psychologist (Lutz et al., 1999) measured both
attitudes and beliefs about wilderness. They investigated attitudes with a survey using a
modified version of Dunlap and Van Liere’s (1978) New Environmental Paradigm (NEP)
Scale. To assess beliefs (or perceptions), the authors showed respondents “a set of eight
photographs of natural areas with varying levels of activity or human impact” (1999, p.262),
and asked them to characterize each picture as wilderness or nonwilderness. Lutz et al.
compared urban and rural residents and found that they did not differ in their attitudes toward
protecting the wilderness, as measured by the modified NEP scale. However, results of the
photo task revealed differences in perception between rural and urban residents. Thus, the
two groups may show the same concern for wilderness protection, but they are operating
from different understandings of what wilderness is. The rural dwellers on average had
higher standards for what they considered wilderness. “Unlike the urbanites, who often
regarded depicted areas as wilderness notwithstanding evidence of logging activity, ranging,
grazing, villages, roads, and hydroelectric dams, the rural respondents generally considered
areas with any such activities as nonwilderness” (1999, p.265). The authors conclude that
such discrepancies in perception are often at the core of land-use conflicts.
Change Over Time in Wilderness Beliefs
The studies of Higham and Lutz et al. demonstrate that wilderness beliefs are of
contemporary interest to recreation researchers. However, the dynamics of wilderness

16
definitions are not well understood because few researchers have collected time-series data.
Observers have lamented the lack of longitudinal data in the field of recreation research. For
example, Louviere and Timmermans’ (1990) review of the recreation choice literature asserts
that “all of the preceding types of models historically have been strictly cross-sectional:
preferences or choices are observed and modeled at a single point in time.” Similarly,
Hellerstein and Mendelsohn (1990) review research on the economic impacts of travel and
note that “knowledge could be gained by going beyond this ‘single snapshot’ of the world, by
augmenting the experiment with multiple samples. One obvious source for different samples
is in the time dimension – with different samples gathered at different points in time.” By the
1995 Trends Conference in Outdoor Recreation, use of time-series data had increased
somewhat. However, most of these studies relied on multiple cross-section designs; very
little panel data exists in the recreation research field.
Specifically, longitudinal data can help place wilderness research into the context of
the “New Wilderness Debate.” Roderick Nash, William Cronon, and others have offered
evidence that the concept of wilderness has changed over the past two centuries of American
history. They thereby support the position that wilderness is, to some extent at least, a social
construction. If social science research were to demonstrate that wilderness concepts are
changing, then the social constructionist argument would enjoy substantial support.
However, research that traces wilderness beliefs and attitudes over time at the same site is
rare. Watson, Cole and Roggenbuck (1995) assert that “the only study before 1990 with
comparable data across time at a single [wilderness] location was by Lucas (1985), which

17
included comparisons for Bob Marshall Wilderness Complex (BMWC) users in 1970 and
1982” (p.68).
In the early 1990’s, the Aldo Leopold Wilderness Research Institute of the USDA
Forest Service conducted and funded studies “intended to measure aspects of wilderness
visits and visitors at places where there were comparable data from earlier studies” (Watson
et al. 1995, p.68). A review article identifies characteristics of wilderness visitors that have
changed over time and those that have remained stable. Studies at five wildernesses
consistently found that users were significantly older in the 1990s than in the 1960s and
1970s. They were also better educated (more so than the general U.S. population), more
likely to be female, and had more previous wilderness experience. Residence did not change,
nor did number of days spent in wilderness, typical distance traveled off-trail, number of
groups encountered, or ability to find desired solitude. Visitors’ perceptions of general “wear
and tear” did not change significantly. However, concern for litter decreased over time.
Support for specific management practices – such as outhouses, cement fireplaces,
interpretive signs, natural fisheries, and use restrictions – remained constant.
Watson, Hendee and Zaglauer (1996) compared visitors in Oregon’s Eagle Cap
Wilderness in 1965 to those in 1993 with a focus on values and behavioral norms. They
“concluded that 1993 Eagle Cap visitors showed a deeper commitment to wilderness and a
more purist attitude toward appropriate behaviors in wilderness” (Watson et al. 1995, p.70).
The 1993 visitors were also older (62% in the 35-54 age group, compared to 48% in 1965
and only 33% in the 1993 U.S. population), better educated, and more likely to be members
of conservation organizations. This study suggests a relationship between changing socio-

18
demographic characteristics of visitors and the wilderness values they hold. The authors do
not, however, disentangle the influences of these characteristics by controlling for multiple
variables in their analysis.
The Context: Changing Environmental Attitudes
Because the literature on changing wilderness attitudes and beliefs is limited, we
might also consider more general studies of environmental attitudes. Dunlap (1992)
analyzed trends in public opinion toward environmental problems from 1965-1990. He
found that environmental concern developed rapidly from 1965-1970, dropped off in the
1970s, and then increased steadily through the 1980s to an unprecedented high in 1990. Can
we assume that wilderness beliefs would follow a similar trend? As public concern for
environmental protection has grown, would people become more discriminating about what
they would consider a wilderness, and would they perceive more environmental damage
within a particular wilderness landscape?
The Apostle Islands Study: 22 Years of Changing Wilderness Beliefs
Earlier in this chapter, I examined Heberlein’s (1973) social psychological critique of
the “wildernism” concept. His interest in the attitudes and behaviors of outdoor
recreationists led him to conduct a 22-year study of boaters in the Apostle Islands National
Lakeshore in northern Wisconsin. Heberlein began to survey Apostle Islands visitors in
1975. He chose the Apostle Islands because it had just been designated a National Lakeshore

19
five years earlier4 and was certain to undergo significant changes over the coming decades as
visitors diversified and increased in number. In 1975, Heberlein’s research team surveyed
846 visitors (648 boaters) about their behaviors, experiences, motivations and attitudes vis-à-
vis the Apostle Islands National Lakeshore. For details of the 1975 findings, see Heberlein
and Vaske (1979).
In 1985 Heberlein returned to the islands with a new research team to survey a second
cross-section of visitors. Unlike in 1975, when all people who boated around or set foot on
the islands were considered for study, the 1985 investigators only included overnight
sailboaters and powerboaters in the sample. Three hundred seventy-seven boaters responded
to the 1985 questionnaire. A comparison of the two groups indicated that the 1985 visitor
population differed from the 1975 visitors in several ways. For instance, the 1985 visitor
tended to be less experienced with boating and with the Apostle Islands, more interested in
the social aspects of the boating activity, more likely to charter than to own their own boat,
and more likely to come from an urban area (for a more detailed comparison of the two
boater populations, see McKinnel 1986). These personal characteristics were found to
influence individuals’ social psychological experience of the islands, for instance their
perception of crowding (McKinnel 1986).
I got involved with the project near the beginning of its third phase, late in the
summer of 1997. During that summer Heberlein, co-P.I. Walter Kuentzel of the University
of Vermont, and assistants, replicated the 1985 sampling strategy. The following winter I
managed a mail survey to a cross-sectional sample of 565 boaters.5 The 1997 questionnaire
4 The Lakeshore was designated in 1970, but did not receive its first operational budget until 1972. 5 There were 387 usable returned surveys.

20
was more comprehensive than either of the earlier two. It repeated many questions from both
1975 and 1985 and included a few new sections measuring, for example, social identity,
recreational conflict, and “sense of place.” The questions pertaining to beliefs about the
wilderness quality of the islands were asked in all three survey years.
In addition to the cross-sectional surveys, a panel survey followed the 1975 visitor
group over time (Figure 1). Members of the 1975 group of visitors were relocated and sent
follow-up questionnaires in 1985 and again in 1997. The panel surveys included most of the
same questions that were asked in the original questionnaires; therefore we have responses of
the same individuals to the same questions at three points in time. Panel data examines
change at the individual level, whereas cross-sectional data provides snapshots of
representative groups of visitors to the Apostle Islands in each of the years. Panel data has a
methodological advantage because individuals act as their own control so no complicated
statistical analysis is necessary. I will utilize both types of data in my analysis of changing
wilderness beliefs.

21
Figure 1: Four Data Sets
N=249
PANEL DATA
1975-85-97 N=178
X X X 1975 1985 1997 N=648 N=377 N=389
CROSS-SECTIONAL DATA

22
Changing Wilderness Beliefs and the New Wilderness Debate
The Apostle Islands survey measures wilderness definitions on two levels. The first,
most general level, is people’s agreement with the statement “I would consider the Apostle
Islands a wilderness.” The more specific belief pertains to human impacts on the Apostle
Islands environment. Two questions tapped this specific belief: “The Apostle Islands seem
unaffected by humans,” and “The Apostle Islands’ environment is not being damaged by
overuse.” I reverse-coded and combined these two items into a single indicator of “impacts
perception” (see measurement section for more details). My first hypothesis concerns the
relationship between the general and specific beliefs about the Apostle Islands landscape.
Hypothesis 1
General (wilderness) and specific (human impacts) beliefs about the Apostle Islands
landscape are inversely correlated. If one belief grows stronger, the other grows weaker. If
one remains stable, the other does too.
:
Assuming that these two beliefs will act in concert, there are three possibilities for
how they could change over time. First, beliefs about the wilderness quality of the islands
could decrease – that is, visitors could become less likely to agree it’s a wilderness and more
likely to perceive impacts. Second, the wilderness belief could increase: visitors could
perceive more wilderness and fewer impacts over time. Or, the belief could remain stable.6
6 Since there are three data points, the pattern could be more complicated such as increasing from 1975 to 1985 then decreasing from 1985 to 1997 (or vice versa).

23
If the wilderness beliefs changed over time, this would support the social construction
argument. Cronon, Nash, Tuan, etc. view wilderness as a subjective concept that is
vulnerable to the winds of social change. As society changes, wilderness definitions change.
If, on the other hand, beliefs about the wilderness quality remained stable, this would support
the biological fact argument of Waller, Sessions, etc. In their minds, wilderness can be
objectively defined. Its definition resides in the ecological condition of the resource, not in
people’s minds. Therefore, barring any catastrophic changes to the Apostle Islands
landscape between 1975 and 1997 (see following section), its “wilderness status” should
remain stable. What was wilderness in 1975 is still wilderness in 1985 and in 1997.
I adhere to the social constructionist viewpoint that wilderness definitions are
susceptible to changing social conditions. Based on the literature cited above, it appears
much more likely that this change would occur in a negative direction, toward less perceived
wilderness and more perceived impacts. This is what Watson et al. (1996) found in the form
of increasing “wilderness purism” and, on a broader level, what Dunlap (1992) found in the
form of increasing environmental concern. We would expect, thus, that as society has
changed through the eighties and nineties, people would develop more purist standards
regarding wilderness and environmental impacts.
Hypothesis 2
Over time, visitors will become less likely to agree that the Apostle Islands is a wilderness
and more likely to consider the environment impacted by humans.
:

24
Has the resource changed or have the people changed?
These data, however, will tell a more complicated story than simply whether
wilderness beliefs decreased or stayed the same. Changing definitions of wilderness can
potentially be confused with changes in the visitor population and/or actual physical changes
in the National Lakeshore. If we observe that people are becoming less likely to agree that
the islands are a wilderness, this could be because characteristics of the visitors – such as age,
education, gender, residence, and so forth – are changing. If this were the case, then
changing wilderness definitions could be explained by changes in individuals (the
explanation offered by Watson et al. 1995, Watson et al. 1996). Much of my result section
will aim at establishing whether changes in the visitor population account for any observed
change in landscape beliefs. This will require controlling for a number of socioeconomic,
behavioral / experiential, and attitudinal variables. My analysis will thus go beyond the
change studies cited earlier (Watson, Cole, and Roggenbuck 1995; Watson, Hendee, and
Zaglauer 1996), which did not control for multiple variables.
Hypothesis 3
Wilderness-related perceptions differ among different categories of users. Higher wilderness
purism has been linked to age, education, gender, membership in conservation organizations,
and experience in the wilderness (Hendee et al. 1968, Watson et al. 1995, Higham 1998).
These characteristics will change over time among the Apostle Islands visitor population, and
will account for some of the change toward more “purist” beliefs.
:

25
Any change that is unaccounted for by changes in the visitor population would seem
to indicate that the resource has changed physically, or broad social definitions of wilderness
have changed, or some combination of the two. In order to separate these influences, I will
examine the effect of continued contact with the Apostle Islands on landscape perceptions.
We would expect that physically observing the landscape would influence people’s beliefs
about it. If the landscape undergoes changes and a person witnesses them, then this person
will be likely to change his or her perceptions of the landscape.
Hypothesis 4
Continual contact with the Apostle Islands landscape will lead to a greater likelihood that
individuals will change their beliefs about the wilderness quality of the landscape. Those
who had contact will be more likely to change their beliefs, particularly in the negative
direction (toward less wilderness and more impacts).
:
I will use the panel data to test this hypothesis. People who made no trips to the islands after
1975, but continued to respond to the 1985 and 1997 panel surveys, would be answering the
survey questions based on that one single experience at the islands. They would presumably
have no reason to change their perception of the landscape over the years. People who
continued to visit, on the other hand, saw all of the physical changes that occurred on and
around the islands over the years. I will describe these changes in the next chapter. Since
use levels increased substantially and development increased somewhat, we would expect

26
people who witnessed these changes to come to see the area as more impacted by humans
and as less of a wilderness.
Summary
This paper will contribute to the nascent literature that employs longitudinal data to
understand changing wilderness beliefs. In examining how wilderness definitions change
over time, it will speak to the more general question posed by the “Great New Wilderness
Debate.” This analysis will extend beyond past studies in two ways: first, by controlling for
multiple variables in the cross-sectional analysis, and second, by including an analysis of
panel data. I will aim at disentangling the influences of individual visitor characteristics and
physical changes in the landscape on wilderness beliefs. In so doing I hope to offer a more
complete understanding of dynamic wilderness definitions in a particular natural area. The
next chapter will describe the landscape in question: the Apostle Islands National Lakeshore.

27
Chapter 3 The Study Area
The Apostle Islands National Lakeshore is located off Wisconsin’s Bayfield
peninsula on the southern shore of Lake Superior. It consists of 2,500 acres of mainland
shoreline and a 21- island archipelago. The islands cover 42,000 acres of land7 (Strzok 1981)
spread over 720 square miles of water (NPS Handbook 141, 1987). They range in size from
3-acre Gull Island to 10,000-acre Stockton Island. The largest of the Apostles, Madeline
Island, is home to a year-round community and is not part of the national lakeshore.
The archipelago was formed approximately 12,000 years ago during the last great Ice
Age. The terrain of the islands is gently sloping. A boreal forest colonized the Apostle
Island region after the retreat of the glaciers, and as temperatures rose the northern hardwood
forest advanced. Before settlement of the islands, about 90 percent of the land was covered
by a mixed hardwood forest, dominated by hemlock, white pine, sugar maple, yellow birch
and white birch. Today there are few stands of white pine and hemlock left, and most of the
islands are covered by second-growth aspen and birch forests. Unique features of the
Apostle Islands landscape include brown sandstone cliffs, beaches, sandspits and tombolos (a
sandbar that connects two islands), and wetlands that provide habitat for many species of
birds, amphibians and plants (NPS Handbook 141, 1987).
The Apostle Islands provide breeding habitat for more than 140 species of birds,
including the threatened bald eagle. The lakeshore is also a stopover point for more than 215
7 This number – 42,000 acres – was measured before the addition of Long Island to the Lakeshore in 1986. The current acreage is slightly higher.

28
migratory bird species (NPS Handbook 141, 1987). Approximately 30 black bears have been
counted, mostly on Stockton Island and occasionally on Sand and Oak islands. Other
mammals include whitetail deer, coyote, red fox, snowshoe hare, and a small population of
beavers.
Soon after the retreat of the glaciers, nomadic Indians began to make their homes in
the Apostles. During the fur trade the islands were a cross-roads for numerous native bands,
and by 1700 the Ojibway had made Madeline Island their tribal home. French explorers and
missionaries arrived in the Apostle Islands in the mid-1600’s and for the next two centuries
the islands were a center of commerical activity on Lake Superior. After the decline of the
fur trade, commercial fishing, sandstone quarrying, and logging continued on and around the
islands into the mid-twentieth century. There was also agricultural activity on a few of the
islands beginning in the 1860’s after the Homestead Act. Because of the dense forest and the
isolation of the islands, however, farming in the Apostles did not last. For more detail about
the history of agriculture and resource extraction on the islands, see Alanen and Tishler
(1996) and Twining (1983).
The islands became a popular resort destination in the late nineteenth century.
Tourism declined during the 1930s due to the Great Depression and the over-exploitation of
the islands’ resources, but picked up again in the post-war era. By the 1950s, human
extractive activity in the Apostles had diminished, and a new tourism emerged around the
natural beauty of the islands. Today, the national lakeshore is a popular summertime
vacation and boating area. The Apostle Islands are approximately 200 miles from the Twin
Cities, 300 miles from metropolitan areas of Southern Wisconsin, and 450 miles from

29
Chicago.
Designation
In the 1960s federal and state officials and environmentalists began urging that the
Apostle Islands become part of the National Park system. There was some debate over the
extent of protection the area should be given. Gaylord Nelson, former Wisconsin governor
(1959-1963), U.S. Senator (1963-1981), and the founder of Earth Day, first introduced a bill
to Congress in 1965 for the designation of the Apostle Islands as part of the National
Wilderness Preservation System. Under the Wilderness Act of 1964, such a designation
would restrict human impacts such as road construction and motorized travel. The
Wilderness Society, led at the time by Sigurd F. Olson, and local chapters of the Sierra Club
supported a wilderness designation for the islands (Wiland 1996). However, according to
Harold “Bud” Jordahl, retired professor of urban and regional planning at the University of
Wisconsin and former chairman of the Wisconsin Natural Resources Board, “The islands
were not pristine wilderness by any stretch of the imagination. They had been logged,
mined, burned, and exploited for many years, so at the time they really didn’t fit the criteria
or the image of true wilderness” (Wiland 1998, see also Alanen and Tishler 1996, Twining
1983).
At odds with the voices for wilderness designation was a strong local desire to
encourage tourism to stimulate the area’s economy. A new category of National Park
Service land – the “recreation area” – allowed for a compromise solution. This designation
provided protection yet permitted more recreational impacts than the wilderness designation.

30
The Apostle Islands National Lakeshore was designated as a recreation area in 1970.
“Wilderness advocates did affect the design of the lakeshore, however” (Wiland 1998). In
the words of Jordahl, “in effect, we zoned the vast majority of the islands as wilderness.” An
official wilderness designation did not seem necessary at the time.
Uses have changed since the 1960s, however. High-impact activities such as
snowmobiling and jetskiing are becoming more common. Visitation to the park is increasing
(see below). The number of sea-kayakers is proliferating in the area, and consequently the
campsites on the islands are subject to increasing use. Managers have recently drafted a new
backcountry management plan (Scott 1999) to address the increasing impacts on the islands
and lakeshore. There is presently a bill in Congress calling for the National Park Service to
study the suitability of 97% (41,054 acres) of the land area in the Apostle Islands for
wilderness designation (Wiland 1998). Presently the National Lakeshore is aiming to
manage these lands “to preserve their potential wilderness values until a formal wilderness
study has been completed and forwarded to Congress” (Scott 1999).
Changes in the lakeshore 1975-1997 The Apostle Islands were designated as a national recreation area in 1970 and
received their first operational budget in 1972. The budget in that year was $68,000 and in
1975 it was $211,200. By 1997 the operational budget had increased to $1,677,800
(Superintendent’s Annual Report, AINL; See Appendix A for the AINL operational budget
from 1972 to 1998).
Use Level:
31
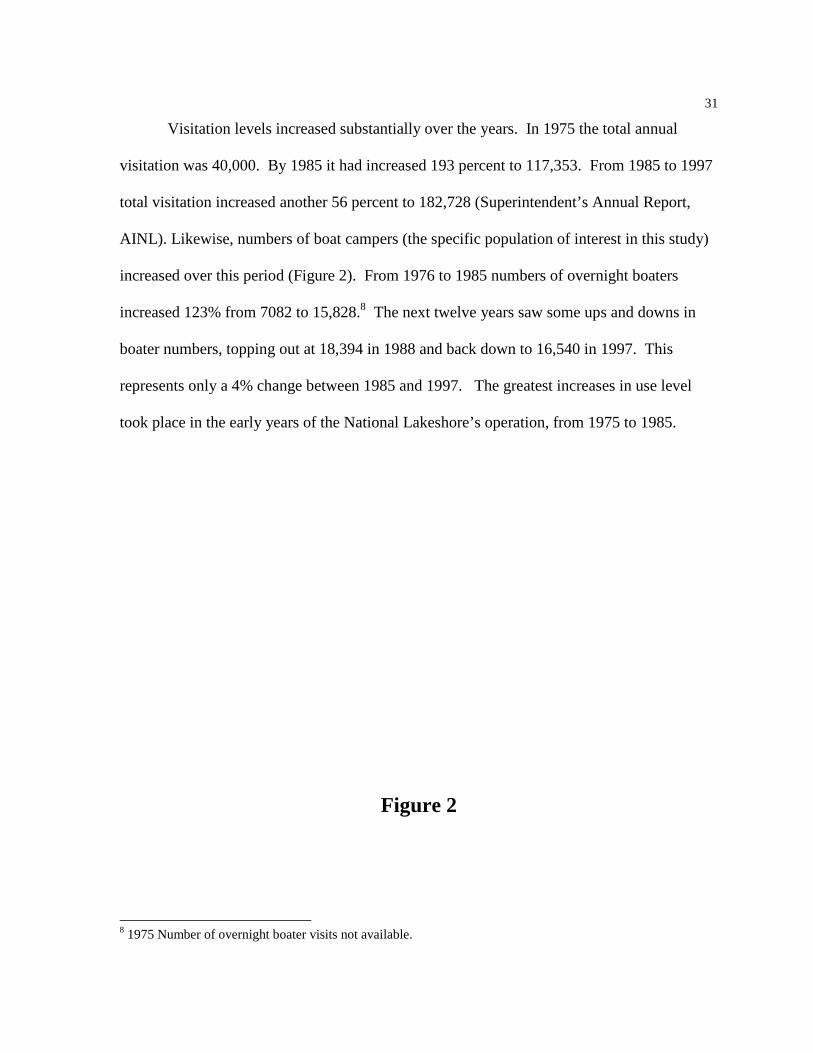
Visitation levels increased substantially over the years. In 1975 the total annual
visitation was 40,000. By 1985 it had increased 193 percent to 117,353. From 1985 to 1997
total visitation increased another 56 percent to 182,728 (Superintendent’s Annual Report,
AINL). Likewise, numbers of boat campers (the specific population of interest in this study)
increased over this period (Figure 2). From 1976 to 1985 numbers of overnight boaters
increased 123% from 7082 to 15,828.8 The next twelve years saw some ups and downs in
boater numbers, topping out at 18,394 in 1988 and back down to 16,540 in 1997. This
represents only a 4% change between 1985 and 1997. The greatest increases in use level
took place in the early years of the National Lakeshore’s operation, from 1975 to 1985.
Figure 2
8 1975 Number of overnight boater visits not available.

32
Facility Construction:
Most of the developments on the islands date from the days of logging and mining camps (Robert
Brander, former NPS Ecologist, personal communication, March 1999). When the Park Service took control of
the land in the 1970s it made use of the buildings and docks left over from the days of resource exploitation and
resort tourism on the islands. Many of the present facilities have been renovated and rebuilt over the years, but
their presence is not new. According to Apostle Islands National Lakeshore Supervisory Ranger Jeff Hepner,
“There was a significant amount of upgrading, replacement, or additions to existing developments which the
park inherited at the time the park was established. These include docks at Devils Island, Outer Island, South
Twin Island, Rocky Island, Otter Island, Little Sand Bay, Raspberry Island, Sand Island, Basswood Island, and
Oak Island” (personal communication, November 1999).
The dock on Michigan Island was rebuilt in 1987 due to significant damage from waves (Julie Van
Stappen, AINL Supervisor of Resource Management, personal communication, June 1999). The reconstruction
1975 1977 1979 1981 1983 1985 1987 1989 1991 1993 1995 19970
5000
10000
15000
20000Apostle Islands Overnight Boater Visits

33
has made the island slightly more accessible to boaters. The Stockton Island Presque Isle docking facility was
expanded between 1985 and 1988. Space was added to accomodate, on the average 12 to 14 boats (this
depends on the boat size and how they moor). The tri-plex ranger facility at Presque Isle Bay was also built
between 1985 and 1987. Previously the ranger quarters there consisted of a smaller two-bedroom cabin. In the
late 1980s and early 1990s the Park Service received housing funding which it used to build new ranger quarters
on Stockton (Quarry Bay), Sand, Oak, and Rocky Islands. In addition, a small cabin was built on Cat Island,
intending to serve as “an emegency shelter for boaters or winter users who might become stranded in that part
of the park” (Jeff Hepner, pers. comm., Nov. 1999).
Deconstruction: During the study period, 1975 to 1997, there was also significant deconstruction of buildings on the
islands. Hepner reported that many buildings have been removed since he began to work at the Lakeshore in
1977. He explained, “Most of these were old dwellings or outbuildings like sheds and such.” He identified at
least eight buildings on the mainland unit, three at Stockton Island, five at Sand Island, two at Rocky Island,
three at South Twin Island, and one at Cat Island that were removed. Furthermore, Hepner continued: “There
are quite a few more buildings which will probably end up going when leases (held by the previous owners)
expire. These are at primarily at Sand Island and Rocky Island but there are also some on the mainland unit that
will eventually be removed so that the land can be restored to its natural state. Prior to removal the structures
are studied first, to determine if they have some significance to the park which would made it appropriate to
keep them.” (personal communication, November 1999).
Construction in the surrounding area: Development around the Apostle Islands can also potentially influence visitors’ perceptions of the
wilderness quality of the area. Most of the marinas in the Apostle Islands area were constructed shortly before
the National Lakeshore designation. More were built over the years, and the total number of slips increased
from 535 in 1981 to at least 974 in 1997 (Table 1). This growth in development affects the accessibility of the
islands and may influence visitors’ perceptions of the area. Other changes in the area, such as second home

34
construction, lakeshore development, and tourism business influx into Bayfield and surrounding communities,
are likely to influence visitors’ views of the area as well.
Table 1. Marinas Near the Apostle Islands National Lakeshore Marina Year Built # Slips 1981a # Slips 1985 # Slips 1997
Apostle Islands Y.C. 1956 30 30 32
Madeline Island 1968 128 128 140
Apostle Islands 1969 125 125 131
Port Superior 1969 172 199 201
Red Cliff 1976 45 45 50
Schooner Bay 1977 45 45 50
Washburn 1984 -- 136 139
Roy’s Point 1992 -- -- 42
Ed Erickson 1992 -- -- 48
Ashland
1988b -- -- 141
Total 535 708 974c
a. 1975 statistics are not available. 1981 and 1985 slip counts are from Heberlein et al., 1986. 1997 slip counts are from phone calls to each marina made September, 1999.
b. 1988 is an approximate date for the construction of the Ashland Marina. c. This total does not include two small marinas in Cornucopia, for which information could not be found.
Conclusion
These descriptions of construction and deconstruction only produce a vague picture of change in the
islands. However, it seems that the overall level of change was not monumental. Many of the structures were
already in place in 1975, and were merely upgraded in the following years. This kind of development would
probably not alter visitors’ perceptions of the wilderness quality of the islands. Furthermore, the process of

35
removing buildings would, if anything, make the lakeshore appear as more of a wilderness than it had
previously. There were some significant structures added, however, in particular the dock and ranger facilities
at Presque Isle Bay. We cannot say for certain whether this construction shaped people’s views of the
landscape, but it is a potential influence to keep in mind when we interpret the data about change.

36
Chapter 4 Methods
Sampling Strategy
The Apostle Islands National Lakeshore presents a substantial logistical challenge for a researcher
gathering a representative sample of overnight visitors to the area. The Apostle Islands includes 21 islands on
the Northern tip of Wisconsin within roughly a 600 square mile area of Lake Superior. Boaters, who travel
primarily in sailboats, power boats, and sea kayaks, move at various paces between the islands. They stop
frequently to sunbathe or beach comb on a deserted sandy beach, visit the many historic sites (light houses, fish
camps, logging camps, quarries), participate in Park Service interpretive programs, hike the many trails on the
islands, or picnic on the islands. At night, they may choose to anchor in a protected bay, tie to a Park Service
dock, or camp at a designated campsite on one of the islands. The boater population therefore is a moving
target, and the distance over water that is necessary to contact them, coupled with Lake Superior weather,
makes sampling a challenge.
1975 Sampling and Survey Strategy In the summer of 1975, the population of interest was anyone who boated around or
set foot on the islands (McKinnel 1986). This included three types of recreationists:
campers, day visitors, and boaters (For a more detailed discussion of the 1975 methodology,
see Heberlein and Vaske (1979), Appendix 1). Sampling took place from June 15 until
November 1, 1975. Census cards asking visitors for their name and mailing address were
distributed, with the goal of registering all visitors age 14 or older. Registration took place
on Michigan Island, Rocky Island, and at two locations on Stockton Island. On Stockton,
self-registration stands were set up, and on the other two islands rangers helped with
registration. Observation of the self-registration stands indicated that the method was much
more effective for contacting campers and day visitors than boaters. Only 38 percent of the

37
boaters who walked past the stands filled out census cards. So in addition to the island
registration, Bayfield area marinas were requested to furnish the names and addresses of
people who had rented boats or boat slips from them. Three of the four marinas provided
boaters’ addresses, and these individuals mailed a set of census cards to identify themselves
and anyone who had been boating with them during the 1975 season.
The combined on-site and mailed census yielded 2,253 returned census cards,
representing the 1975 Apostle Islands population. From this population of users, a
systematic random sample of 1,200 individuals was selected to receive questionnaires. Four
specialized versions of the questionnaire were mailed: a general background questionnaire
and special user surveys for each of the three groups: campers, boaters and day visitors. An
advance letter and two reminder mailings were sent. Usable questionnaires were received
from 70.5 percent of the original 1,200 in the sample, or 74 percent of those who received
questionnaires. Out of the 846 visitors for whom we have usable data, this study will only
consider the 648 boaters (not campers or day visitors), in order to achieve comparability with
the 1985 and 1997 samples (only boaters were surveyed in those years).
1985 Sampling and Survey Strategy
In 1985 the population under consideration was reduced to include only those
individuals who anchored or docked a boat overnight at any of the islands during the summer
(McKinnel 1986). Due to the limitations of the 1975 self-registration procedure for sampling
boaters, field interviewers were used to register boaters in 1985. The five most popular sites
for boaters to moor or dock were selected using two methods: flights over the islands on 27

38
randomly sampled days in the summer of 1981 (see Heberlein & Alfano 1983), and the
National Park Service records of overnight stays. The sites were Anderson and Quarry Bays
on Stockton Island, Rocky / South Twin, Raspberry and Oak Islands.
Because of the high costs of staffing each location with an interviewer for the entire
summer, the summer was divided into periods based on use levels (Heberlein & Alfano
1983). The peak season was from July 3 to August 20 and the off-peak season was May 1 to
July 2 and August 21 to October 31. The research team made four trips to the islands during
the summer of 1985 – two trips during the peak season and two trips during off-peak. Each
trip attempted to cover both high use days (Fridays and Saturdays) and low use days (Sunday
through Thursday). Of the total 1,265 people who were approached by the interviewers, 96
percent (1,217) agreed to fill out the census cards. For a more detailed description of the
1985 sampling procedures, see McKinnel (1986).
A sample of 500 boaters was selected from the 1,217 who were registered. This
sample was stratified using NPS records of actual numbers of overnight stays that occurred at
each location during each of the four use-level periods. A single 33-page questionnaire was
designed to be comparable with the 1975 survey instruments. Surveys were mailed after an
advance letter, followed by two reminder mailings. The final response rate was 75.4 percent
of the sample of 500, or 78.4 percent of those people who received a questionnaire.
1997 Sampling Procedure
The 1997 method for registering boaters closely followed that used in 1985.
We employed a stratified random sample that was proportionate to overall overnight boater use of the Apostle
Islands. The design used 1996 Park Service visitor counts to devise a sample selection procedure. We stratified

39
the sample on three dimensions. First, the sample was stratified based on the low use or shoulder boating season
(June and September) and high use season (July and August). Table 2 shows that one-fourth (24.8%) of the
1996 overnight visitors came in the shoulder months of either June or September, while three fourths of the
sample (75.2%) visited during the high use months of July and August. Only 5% of the 1996 overnight boaters
made visits during months outside of this 4-month boating season.
Table 2. Proportion of overnight visits in the high use season and low use season - From 1996 Apostle Island National Lakeshore visitor counts.
# of Overnight Visitors Proportion of Total Use Low Use (June, September)
3869 24.8%
High Use (July, August) 11,739 75.2%
The sampling design also stratified by overnight use at each of the islands. Table 3 shows that use is
concentrated at only a few of the islands. Because of boaters’ desire to find well protected anchorages, 92.78%
of the overnight boater visits were recorded at only six islands: Stockton, Rocky, South Twin, Raspberry, Sand
and Oak. Stockton Island contains two protected bays where overnight boaters frequently anchor: Presque Isle
Bay (formerly Anderson Bay), which had 44.8% of the total 1996 overnights, and Quarry Bay, which had
10.3% of the 1996 overnight visits. The sample selection process was therefore built around these seven sites.
The few people who anchored at places like Cat Island or York Island (just over 7%) did so because weather
conditions were just right on that particular night. We then assumed that because most trips in previous studies
were multi-night trips, these people were just as likely to be selected at one of the seven sites on a subsequent
night of their trip. We therefore placed as many as five people in the field on any given sampling day: one
person at Sand, one person at Raspberry, one person at Oak, one person at Stockton who covered both Presque
Isle and Quarry Bays, and one person at Rocky and South Twin, which are approximately a mile apart.

40
Table 3. Proportion of overnight visits by Island - From 1996 Apostle Island National Lakeshore visitor counts. Island
# of Overnight Visitors Proportion of Total Use
Basswood 76 0.49% Bear 136 0.87% Cat 64 0.41% Devil’s 131 0.81% Hermit 20 0.13% Ironwood 36 0.23% Long 0 0.00% Manitou 153 0.98% Michigan 42 0.27% Oak 631 4.04% Otter 248 1.59% Outer 49 0.31% Raspberry 1148 7.36% Rocky 2157 13.82% Sand 1056 6.76% South Twin 884 5.66% Stockton 8607 55.14% York 170 1.09% Note. The Park Service prohibits camping or mooring near Eagle, Gull, or North Twin Islands.
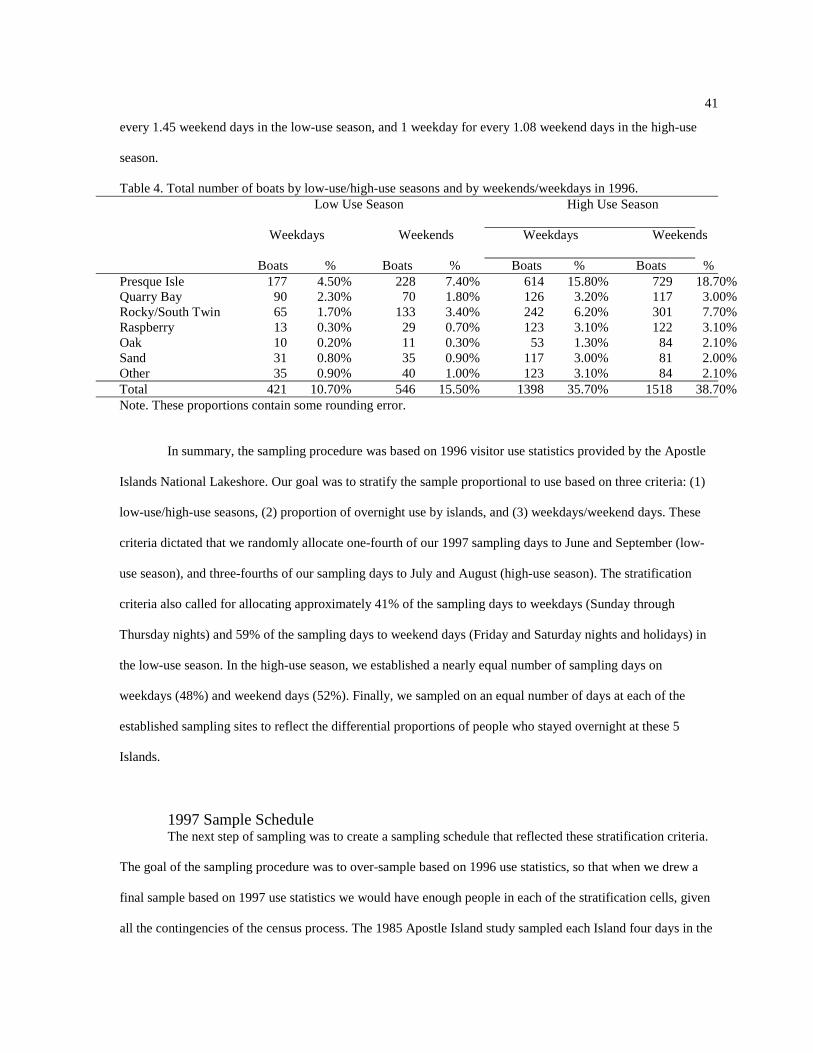
Next, the sample was stratified by weekday use (Sunday through Thursday nights) and weekend use
(Friday and Saturday nights and holidays - July 4th and Labor Day). Table 4 shows Park Service daily counts for
the total number of boats that visited the islands on weekdays and weekends during both the low use months
(June and September) and the high use months (July and August). The proportions shown in this table are
percent of total use of the islands. As expected, weekend days (Fridays and Saturdays) received slightly more of
the total 1996 overnight visits than weekdays (Sunday through Thursday nights), with a ratio of 1 weekday for
41
every 1.45 weekend days in the low-use season, and 1 weekday for every 1.08 weekend days in the high-use
season.
Table 4. Total number of boats by low-use/high-use seasons and by weekends/weekdays in 1996. Low Use Season High Use Season Weekdays Weekends Weekdays Weekends Boats % Boats % Boats % Boats % Presque Isle 177 4.50% 228 7.40% 614 15.80% 729 18.70% Quarry Bay 90 2.30% 70 1.80% 126 3.20% 117 3.00% Rocky/South Twin 65 1.70% 133 3.40% 242 6.20% 301 7.70% Raspberry 13 0.30% 29 0.70% 123 3.10% 122 3.10% Oak 10 0.20% 11 0.30% 53 1.30% 84 2.10% Sand 31 0.80% 35 0.90% 117 3.00% 81 2.00% Other 35 0.90% 40 1.00% 123 3.10% 84 2.10% Total 421 10.70% 546 15.50% 1398 35.70% 1518 38.70% Note. These proportions contain some rounding error.
In summary, the sampling procedure was based on 1996 visitor use statistics provided by the Apostle
Islands National Lakeshore. Our goal was to stratify the sample proportional to use based on three criteria: (1)
low-use/high-use seasons, (2) proportion of overnight use by islands, and (3) weekdays/weekend days. These
criteria dictated that we randomly allocate one-fourth of our 1997 sampling days to June and September (low-
use season), and three-fourths of our sampling days to July and August (high-use season). The stratification
criteria also called for allocating approximately 41% of the sampling days to weekdays (Sunday through
Thursday nights) and 59% of the sampling days to weekend days (Friday and Saturday nights and holidays) in
the low-use season. In the high-use season, we established a nearly equal number of sampling days on
weekdays (48%) and weekend days (52%). Finally, we sampled on an equal number of days at each of the
established sampling sites to reflect the differential proportions of people who stayed overnight at these 5
Islands.
1997 Sample Schedule The next step of sampling was to create a sampling schedule that reflected these stratification criteria.
The goal of the sampling procedure was to over-sample based on 1996 use statistics, so that when we drew a
final sample based on 1997 use statistics we would have enough people in each of the stratification cells, given
all the contingencies of the census process. The 1985 Apostle Island study sampled each Island four days in the

42
low-use season, and 10 days in the high use season. With this schedule, they were able to census a total of just
under 1200 boaters, and therefore come up short on a few of the stratification cells when they drew the final
sample that was sent questionnaires. Therefore, our target was to census at least 1500 sail boaters and power
boaters, and as many sea kayakers as we encountered during the 1997 season. We therefore decided to increase
the 1997 sampling days to 18 days at each island - five days during the low-use season and 13 days during the
high-use season. This meant sampling three weekend days and two weekdays at each Island during the low-use
season, which meant approximately one trip to each Island in June and one trip to each in September. We also
scheduled seven weekend days and six weekdays of sampling at each Island during the high-use season, which
meant approximately two trips to each Island in July and two trips to each Island in August.
Because of the many contingencies of sampling at the Apostle Islands such as high
seas, fog, sick workers, unreliable workers, or boat maintenance problems, we did not always
reach these targets for each of the Islands. Table 5 shows the actual number of days sampled
at each of the sites. This table shows that the number of days sampled during the high-use
season was reasonably close to the original schedule. The only Island undersampled during
July and August was Oak. The sampling went a little less smoothly during the low-use
season. Sand was not sampled at all, Rocky was undersampled, and Raspberry was
oversampled on weekend days during the low use season. During this low-use season, June
suffered because of boat problems and the learning curve of coordinating the sampling
process. The September sampling season suffered because of some severe weather. When
there is bad weather, there are no boaters to census. Otherwise, our actual days of sampling
during the 1997 season came close to the target number of days of sampling.
Table 5. Actual number of sampling days at each of the 5 sampling sites during the 1997 season. Low Use Season High Use Season

43
Weekdays Weekends Weekdays Weekends Stockton 2 3 7 6 Raspberry 1 4 7 5 Oak 2 2 5 1 Rocky 1 2 6 7 Sand 0 0 6 6
1997 Census Counts The sampling procedures employed in this study yielded a census of 1802 boaters during the 1997
season. This total included 809 passengers on sail boats (62%), 198 passengers on power boats (15%), 228
people with sea kayaks (18%), and 64 people in Voyageur Canoes (5%). There were another 503 people in
unspecified crafts. These were names gathered before we instructed the census workers to specify whether
respondents were in sail boats or power boats. We also gathered 840 names from Stockton Island (46.6%), 355
names from Rocky/South Twin (19.7%), 242 names from Raspberry (13.4%), 198 names from Oak Island
(11.0%), and 167 names from Sand (9.3%). Table 6 also shows the number and percent of boaters gathered by
island, season, and weekday/weekend.
Table 6. Total number of people in the 1997 census by island, low-use/high-use seasons, and weekends/weekdays. Low Use Season High Use Season Weekdays Weekends Weekdays Weekends People % People % People % People % Stockton 12 0.006% 122 6.7% 218 12% 488 27.0% Rocky/South Twin 23 1.3% 11 0.006% 57 3.1% 275 15.2% Raspberry 1 0.001% 44 2.0% 83 4.6% 114 6.3% Oak 8 0.4% 16 0.008% 115 6.3% 59 3.3% Sand 0 0% 0 0% 87 4.8% 80 4.4% Total* 44 2% 182 9% 560 31% 1016 56% *Totals are rounded to nearest percent.
With all the contingencies of sampling at the Apostle Islands, our census during 1997
did not fit the stratification categories very well. When comparing Table 6 with Table 4, one
can see that our 1997 census oversampled high-use season visitors and undersampled low-
use season visitors. Overall, the full 1997 census oversampled boaters at Raspberry, Oak, and

44
Sand Islands, and undersampled boaters at Stockton Island. Finally, the census oversampled
boaters on weekend days and undersampled boaters on weekdays. It was these contingencies
of sampling that motivated us to census three times the number of people that would receive
a mailed questionnaire. With the number of boaters oversampled in each stratification
category, we could then send a follow-up questionnaire to a sub-sample of boaters who
matched the proper proportions generated from 1997 Park Service boater counts.
Selecting From The 1997 Census In selecting a final sample of people to receive mailed questionnaires, we obtained the 1997 boater
counts from the Park Service in October of that year. In the final selection, we stratified on only two
dimensions: low-use/high-use seasons and by island. We chose not to stratify on weekdays and weekend days
because in 1985, the average trip length was four days, so most people made trips across both weekdays and
weekend days. Further, only 60 people out of 377 in that sample (16%) made weekend-only trips during the
1985 season. Even fewer – 55 people or 14.5% – made weekday-only trips during the 1985 season. Therefore
the census strategy used in the 1997 study should have been able to account for those who take weekend only or
weekday only trips, in spite of the fact that only 34% of our census were contacted on weekdays during the
1997 season.

We next established our sample size base on Park Service boater counts for 1997. Table 7 shows the
ratio of use in 1997 by Island and by season. Our stratified sample attempted to replicate the ratios as closely as
possible. The selection of a sample size was constrained by the cell with the lowest number of names. Table 7
shows that our census during the low-use season was the biggest constraint. In our sample selection, we slightly
undersampled Rocky and Sand, and slightly oversampled Raspberry and Oak during the low use season. The
remaining cells followed the Park Service ratios fairly closely. With this established sample size, we then
randomly drew names from each of the cells of the sampling framework. Duplicate names and duplicate
households were replaced in the selection process.
Table 7. Sample size selection based on 1997 Park Service boater counts. National Park Service 1997 Sample Low-Use High-Use Low-Use High-Use # Boats % # Boats % People % People % Stockton 516 14.19% 1701 46.79% 81 14.34% 263 46.55% Rocky/South Twin 157 4.32% 474 13.04% 8 1.42% 78 13.81% Raspberry 39 1.07% 247 6.79% 18 3.19% 40 7.08% Oak 63 1.73% 174 4.79% 14 2.48% 32 5.66% Sand 40 1.10% 225 6.19% 0 0.0% 31 5.49% Total 815 22.4% 2821 77.6% 121 21.4% 444 78.6% Surveying the 1997 Cross-Section
Through the selection process described above, we drew a stratified random sample
of 565 sailors and power-boaters from the 1510 power-boaters and sail-boaters in the 1997
census. On December 22 of that year, I sent a 32-page questionnaire to these 565 people.
On January 7, 1998, I sent a postcard reminder to all respondents, and on February 16 I sent a
second survey and cover letter to the 281 respondents (50.0%) not yet heard from. This
second wave yielded 57 more responses. In May and June, I contacted non-respondents by
phone and asked if they would be willing to fill out the questionnaire if sent a new copy.
Those who refused were asked their reason, while those who agreed were sent another

1
questionnaire. This third wave yielded 19 additional usable surveys. Finally, we shortened
the questionnaire to 20 pages and sent it out with a new cover letter to the remaining 208
boaters on July 17. After the last surveys were returned on October 12 and January 15, the
final return stood at 389 out of 562 (3 were removed from the original sample as they turned
out to be kayakers) or 69.2%. When adjusted to include only those individuals who received
a questionnaire, the final response rate was 69.8%.
Table 8. Apostle Island Cross-Sectional Surveys Response Rates
Year
Number Mailed
Usable Total
Percent Adjusted Percent*
1975 1200 846 71% 74%
1985 500 377 75% 79%
1997 562 389 69% 70%
* Adjusted Percent: this is the percent of completed surveys out of those people who we believe received the questionnaire (deceased respondents and those questionnaires returned as “undeliverable” were removed from the total).
Weighting Procedures
The 1997 sampling design employed a stratified random sample that was
proportionate to overall boater use of the Apostle Islands during the summer. We drew the
sample in proportion to the distribution of boat-days at each island and within each of the
four time strata. Boat-days, however, are different from boaters, and the study required a
random sample of boaters. Boats (boaters) spending more days in the Islands had a higher
probability of being in the sample than those spending fewer days. Therefore, it was
necessary to compensate by weighting each boater in inverse proportion to the number of

2
days (s)he spent in the Islands. For example, a boater spending 10 days in the Apostles
should get a relative weight one-fifth as large as a boater spending only two days. Such a
weight was created using the following formula:
Weight = (WD*N)/W
Where WD = 1 / # of days in the islands, W= sum (WD), and N = the sample
size.
For cases with missing data, we substituted the median number of days. We applied this
weighting procedure for both the 1997 and 1985 cross-sections of boaters, as they had the
same sampling design. Since the 1975 sample was drawn from a complete enumeration of
the boaters in the islands that summer, it did not necessitate weighting; each 1975 respondent
was simply given a weight of “1”.
Methods for Tracking and Surveying Panel Respondents
1985 Tracking Procedures
The 1975 questionnaire asked respondents to give the name of a close friend and a relative who would
know their whereabouts in the future. The first step in tracing the respondents was to mail a letter to their 1975
address asking them to confirm that it was still their address. If there was no reply or if the letter was returned
undeliverable, then the friend and relative were contacted and asked to provide the respondent’s current address.
Of the original 648 boaters, 13 (2.0%) were found to be deceased, 501 (77.3%) were located, and 134 (20.7%)
were never found. The 501 respondents were mailed an advance letter, followed by the questionnaire one week
later. Three hundred ninety-seven (79.2%) completed the questionnaire. Of the original 648 boaters, 61.3%
filled out both the 1975 questionnaire and the 1985 questionnaire (Heberlein & Ervin 1990).

3
1997 Tracking Procedures
The process of relocating 1975 respondents in 1997 took place from August 1997 until April 1998. I
created a database to keep track of the status of each person. The first stage was to look up each respondent at
their former addresses. This was done using CD-rom “Phone Discs” and Internet search engines “Four One
One,” “WhoWhere” and “Infoseek.” If a respondent was still at the same address, or had moved but was easily
identifiable (i.e. an unusual last name in a small town), then I coded them as “found” in the database. If the
search engine revealed more than one listing that could conceivably be the respondent in question, then I coded
that person “to be called.” In the 1975 and 1985 surveys, respondents were asked to give the name of a relative
and a friend who would know their location in the future. If the search for the respondent’s own name yielded
nothing, then I looked up these friends and relatives using the same method. If I found nothing at all, I coded
that respondent “search” and left them with little hope of being located.
My assistants and I made the phone calls systematically. As each number was tried, wrong numbers
and wrong people were eliminated from the list, so that at the next attempt the caller would have fewer options.
If the caller reached the respondent or a relation who was willing to provide the respondent’s address, then (s)he
was changed to “found” in the database. If a relation informed us that (s)he had passed away, we coded his/her
status as “deceased.” If none of the calls were fruitful, then the respondent was coded “search.”
Six hundred forty-six boaters were surveyed in 1975, of which 472 had been successfully relocated in
1985. In April 1998, at the end of the above-described tracking process, 411 of the total 646 respondents were
found. I located an additional 33 with some degree of uncertainty: either confirming phone calls did not go
through, or the best bet appeared to be to send the survey to a friend or relative of the respondent. I included
these additional 33 respondents in the mailing, bringing the total number of located respondents to 444.
Divided by the original 1975 n of 646, this is 68.7%. Thirty were found to be deceased, however, which brings
the percentage up to 72.1%. Moreover, when one considers only those respondents who had been tracked down
in 1985, the 1997 search located 369 out of 472, or 78.2%. Of those who had not been found in 1985, my
search located 75 out of 174, or 43.1%.

4
1975-97 Panel Follow-Up Survey
On April 17, 1998, I sent questionnaires to the 444 respondents in the 1975 sample who had been
located. As described above, 33 of these people were located with some degree of uncertainty. In those with
uncertain addresses, I enclosed a postcard to be returned in case it was the wrong person. Those that were sent
in care of a relation included a stamped envelope for them to forward the questionnaire on to the respondent.
After the first mailing, 181, or 40.8%, returned their questionnaires. I sent a postcard on May 13, and sent the
second survey mailing on June 1. Fifty more people returned the survey. We sent a shortened questionnaire
(from 27 to 22 pages) on July 25 and received 21 more, adding up to a final 252 out of 444, or 56.8%. When
adjusted to include only those respondents who received the survey, the response rate is 252 out of 409, or
61.6%. Out of the original 648 boaters who participated in the study, 178 (27.5%) filled out all three
questionnaires (Table 10).
Table 9. 1997 Apostle Islands Panel Survey Response Rates, Based on the Number of Questionnaires Mailed.
Survey
Number Mailed
Usable
Percent
Adjusted Percent*
1975 Cross-section 1200 846 71% 74%
1975-85 Panel 500 397 79% 83%
1975 –97 Panel 444 252 57% 62%
* Adjusted Percent: this is the percent of completed surveys out of those people who we believe received the questionnaire (deceased respondents and those questionnaires returned as “undeliverable” were removed from the total).
Table 10. Attrition Rate of 1975-85-97 Panel Survey.
1975 1985 1997
Completed all 3 questionnaires
No Response in 1985
Number Completed 648 397 178 74
Percent 100.0% 61.3% 27.5% 11.4%

5
Analysis Strategy
I will be using two data sets in the following analysis. The first consists of cross-
sectional data – that is, three samples representing the population of Apostle Island visitors in
each of the survey years: 1975, 1985, and 1997. Cross-sectional data allow us to assess
aggregate change in the population of visitors. Specifically, I will use it to examine whether
changing landscape perceptions from 1975 to 1997 were due to changes in the visitor
population (Hypothesis 3). In the second part of my analysis, I will use panel data. The
1975-85-97 panel measures the responses of the same individuals – the 1975 boaters – at
three points in time. Panel surveys allow us to assess cognitive changes within individuals.
This data will allow me to answer a second question: how does continued contact with the
Apostle Islands resource affect an individual’s propensity to alter his/her perception of the
landscape (Hypothesis 4)?
Cross-Sectional Data
Three cross-sectional samples of Apostle Islands visitors will be used in the analysis:
1975 (n=648), 1985 (n=377), and 1997 (n=389). The starting point of my analysis will be to
consider how aggregate beliefs about the wilderness quality of the landscape have changed
over time. I will then compare the three cross-sections on a number of socio-economic,
experiential, and attitudinal variables. Values will be presented either as means (for
continuous variables) or percentages (for categorical variables). To compare the visitor
populations I will employ one-way ANOVA (analysis of variance) test with Scheffe post-hoc

6
test. Significant differences among groups will be reported in bold type, and the letters – a,
b, or c – in superscript indicate post-hoc differences.
After reporting the descriptive statistics, I will examine the influence of each of the
individual control variables on landscape perceptions. I will first present the variables that
changed over time, followed by those that remained stable. For this analysis I will combine
the three cross-sections and present the general relationship between each variable and
landscape perceptions. I will again use one-way ANOVA with Scheffe post-hoc test for all
but the attitudinal variables. As the five attitudinal variables are measured on continuous
scales and cannot be categorized, single linear regressions will be used to determine their
marginal effects on the landscape beliefs. Finally, I will run a multiple regression including
the independent variable, time, and several control variables that have marginal effects on
landscape perceptions.
Panel Data
After testing Hypothesis 3 with the cross-sectional analysis, I will turn to the panel
data to examine change over time in individuals’ beliefs about the Apostle Islands landscape.
I will first examine how this sample of 178 boaters changed – both on the aggregate and
individual levels – in their views of the wilderness quality of the islands. I need not consider
all of the control variables, since the cross-sectional analysis served that purpose. With the
panel data, I will look at only two independent variables: time and repeated contact with the
resource. The individuals resurveyed at three points in time behave as their own controls and
a multiple regression analysis is not necessary. Rather, one must simply divide the sample

7
into categories based on number of return visits and compare the percentages in each
category who changed their beliefs. T-tests and one-way ANOVAs will be used to test for
significance.
Summary
Cross-sectional survey data were collected in 1975, 1985, and 1997. In 1975, the
population under study included overnight boaters, day visitors, and campers at the islands.
Only the boaters are considered in this analysis, because in 1985 and 1997 overnight boaters
were the only group surveyed. In 1975 a systematic random sample was drawn from a
census of boaters. In 1985 and 1997 stratified random samples were collected that were
proportionate to overall overnight boater use at the islands. The sample was stratified on
three dimensions: season (high use/low use), day (weekday/weekend), and overnight use at
each of the islands. A sample of 565 boaters was drawn from the 1510 power-boaters and
sail-boaters in the 1997 census; this final selection was stratified by season, island, and Park
Service boater counts. A mail survey of 32-pages was sent to these 565 individuals. The
cross-sectional response rates were: 74% in 1975 (N=846 total; 648 boaters), 79% in 1985
(N=377), and 70% in 1997 (N=389).
In addition to the cross-sectional data, panel data were obtained by following up the
1975 boaters in 1985 and again in 1997. One hundred seventy-eight panel respondents filled
out all three surveys. Analysis in this paper will rely on both the cross-sectional and the
panel data sets. The cross-sectional data will be used to examine the influence of a changing
visitor population on aggregate changes in visitors’ landscape beliefs (Hypothesis 3). The

8
panel data will serve to investigate the influence of a changing landscape on people’s
perceptions of that landscape (Hypothesis 4).

9
Chapter 5
Measurement
This chapter details the measurement of all the variables used in the cross-sectional
and the panel analyses. I will first describe the measurement of the dependent variables,
which are the same in both sets of data. Then I will describe the independent and control
variables for the cross-sectional analysis, followed by those used in the panel analysis. The
key independent variable, time, is measured differently in each set of data. In addition to the
time variable, the cross-sectional analysis will employ three categories of control variables.
The panel analysis will use only one control variable.
Dependent Variables
The dependent variable consists of two beliefs about the wilderness quality of the
Apostle Islands landscape, one general and one specific. The general belief taps the broad
meaning of the word “wilderness” in people’s minds. It is measured by agreement with the
statement: “I would consider the Apostle Islands a wilderness.” Responses were provided on
a five-point scale, where:
1= Strongly disagree 2 = Probably disagree 3 = Neutral 4 = Probably agree 5 = Strongly agree
This measure is similar to that used by Shreyer and Nielson (1978), who “asked river floaters
in Desolation and Westwater Canyons in Utah if they felt they had been in a wilderness while
10
on the trip” (Stankey & Shreyer 1986, p.261). Likewise, Lutz et al. asked people to
characterize landscape photographs as either wilderness or nonwilderness. A single question
about whether a landscape is a wilderness is more direct than the multi-dimensional attitude
(“purism”) scales used by other researchers. Our measure allows the respondents to define
wilderness, rather than defining it for them with a number of pre-constructed items.
The more specific belief concerns characteristics of a landscape that are typically
associated with wilderness. Most definitions of wilderness include the idea that human
impacts are non-existent or at least minimal (see, for example, Marshall 1930, Wilderness
Act of 1964, Woods 1998). For example, the legal definition of wilderness in the U.S., as
stated in the Wilderness Act of 1964, asserts:
A wilderness, in contrast with those areas where man and his own works dominate
the landscape, is hereby recognized as an area where the earth and its community of life are
untrammeled by man, where man himself is a visitor who does not remain.
While not every American is familiar with the Wilderness Act, it seems reasonable to assume
that most make a general connection between wilderness and lack of human impacts.
Therefore, in addition to measuring people’s belief that the islands constitute a wilderness, I
will consider visitors’ perceptions of environmental damage due to human presence. This
specific belief about wilderness is measured as the combined agreement with the two
statements:
• The Apostle Islands seem unaffected by humans.
• The Apostle Islands’ environment is not being damaged by overuse.

11
The same five-point scale allowed respondents to indicate the extent to which they agreed or
disagreed with each statement. The questions about effects and damage were reverse-coded
to avoid double negatives. A preliminary analysis indicated that most of the control variables
influenced the “affected” and “damaged” beliefs in the same way. The zero-order correlation
between them is .490 (p < .01). To simplify the analysis the two indicators were summed to
create an “awareness of impacts” scale. Scores range from two to ten, with higher scores
indicating a greater awareness of social and environmental impacts in the islands.
Independent Variable: Time
The goal of the following analysis is to understand how these beliefs about the
Apostle Islands landscape have changed over time. Time is measured in different ways in
the cross-sectional and panel data. I will discuss the panel data in the last section of this
chapter. In the cross-sectional data, three distinct groups of respondents are indicated by the
year – 1975, 1985, or 1997 – in which they visited and filled out a survey about the Apostle
Islands. In the regression analysis of the cross-sectional data, dummy variables are used to
control for the effect of the survey year. One dummy variable is coded 1 = 1985 sample, 0 =
1975 or 1997 sample. A second dummy variable is coded 1 = 1997 sample, 0 = 1975 or
1985 sample. We can control for the effects of time by including one or both of the dummy
variables in the regression model.

12
Control Variables in Cross-sectional
Analysis
Since cross-sectional data
compares different groups of
individuals, understanding trends in
the dependent variable requires
holding other variables constant.
Changes in the way visitors think
about wilderness may be confounded
by changes in the composition of the

13
visitor population. That is, we must
ask: if people have different
perceptions of wilderness in 1997
than they did in 1975 or 1985, is it
because they come from different
socio-economic or educational
backgrounds? Is it because they
have different levels of experience
with the Apostle Islands or with the
recreational activity they engage in

14
there? Or have their motivations in
visiting the islands changed and
thereby altered their perception of
the landscape? If none of these
visitor characteristics accounts for
the change, then what is driving
change over time in beliefs about the
wilderness quality of the Apostle
Islands? In order to answer these
questions, I will consider three

15
categories of control variables: socio-
economic background, Apostle
Islands experience and boating
experience, and enjoyment of
solitude and nature.
1. Socio-Economic Background
Past research (Hendee et al. 1968,
Watson et al. 1996) has demonstrated
an effect of socio-economic

16
background on wilderness attitudes
and beliefs. For this reason I will
consider eight socio-economic
variables: age, education, gender,
marital status, number of children,
income, current residence, and
residence in childhood. I will also
consider membership in conservation
or recreation organizations.

17
Age is measured by subtracting
the year of birth (provided by the
respondent) from the survey year –
1975, 1985, or 1997. A second age
variable, which does not take into
account the survey year, indicates
whether the respondent falls in the
pre-babyboom (born in 1945 or
earlier), babyboom (born 1946 to
1964), or post-babyboom (born in

18
1965 or later) generation. Education
level is indicated by the respondent
as years of school (s)he has
completed: 1-12, 13 = some college,
14 = B.A. or equivalent, 15 = M.A. or
equivalent, 16 = Advanced degree
(M.D., Ph.D., etc.). Gender is coded
1 for male and 2 for female.
Marital status was originally
measured in five categories: single,

19
married, separated or divorced, not
married but living with partner,
widowed. Twenty-two percent of the
total combined 3 cross-sections are
single, 70.2% are married, 1.6% are
living with a partner, 4.6% are
divorced or separated, and 0.9% are
widowed. To simplify analysis this
variable was condensed into two
categories: 1 = presently single

20
(includes divorced and widowed), 2 =
married or living with a partner. By
this measure, 27.9% are single and
72.1% married. The respondent also
indicates how many children (s)he
has.
Total family income was measured in
1975 with a 13-point scale ranging
from under $3,999 to over $48,000 in
$4,000 increments. In 1985 and 1997

21
total family income was measured
with a 14-point scale ranging from
under $7,999 to more than $150,000
in increments of $8,000. All
measures were standardized to the
1992 dollar amounts, using GDP
inflators and deflators for that year.
The GDP inflator (a so-called
"chained" index) used to calculate
constant dollars can be found at the

22
Department of Commerce, Bureau of
Economic Analysis web site:
http://www.bea.doc.gov/bea/dn/1299
nip2/maintext.htm.
The formula for standardizing dollar
values is (100/GDP Inflator *
$Amount).
Residence was determined by two
survey questions. Respondents were
asked to describe the place they

23
presently live as one of the following:
rural area, small town, small city,
suburban area, or large city. They
were also asked to categorize the
place where they lived most of the
time while growing up. The five
categories were combined into a
dichotomous variable, with “rural” =
rural area or small town, and

24
“urban” = small city, suburban area,
or large city.
I will consider one additional
background indicator: membership
in conservation or recreation
organizations. Past researchers
(Hendee et al. 1968, Watson et al.
1996) have established a link between
conservation group membership and
wilderness “purism;” it seems likely

25
that this variable would also
influence visitors’ beliefs about
wilderness in the Apostle Islands.
We measured organization
membership with one question: “Are
you now a member of any recreation
or conservation organizations such as
a sailing club or Sierra Club, etc.?”
As such it is an approximate
indicator of conservation behavior,

26
yet it is problematic because it lumps
conservation and recreation
organizations together. For our
purposes it would be better to
separate them, but it was asked this
way in 1997 in order to be
comparable with the 1975 and 1985
measures.
2. Apostle Islands Experience and Boating Experience

27
Experience with the Resource
A person’s level of experience in
the wilderness has been found to
influence his/her attitudes about
wilderness toward greater “purism”
(Hendee et al. 1968, Higham 1998).
We would likewise expect visitors’
experience with the Apostle Islands
to affect their beliefs about the area’s
wilderness quality. Survey

28
respondents indicated the year that
they first started boating in the
Apostle Islands area. This measure
will be applied to the analysis in two
ways. First, it will be used as an
absolute indicator of year of first
visit. People who first boated in the
islands in 1975 or earlier (52.3%) will
be compared with those whose first
visit was after 1975 (47.7%). Second,

29
following Vaske et al. (1980), the year
of first visit was subtracted from the
survey year to yield a length of
visitation history variable. This
variable was condensed into three
categories: first visit was in survey
year, 1-5 years prior to survey year,
and more than 5 years prior.
Respondents were also asked how
many boating trips they had made
30
prior to the survey season. The
responses were recoded into three
groups: no previous trips, 1-10
previous trips, and more than 10
previous trips.
Boating Experience People’s boating choices affect their on-the-water experience while at the Apostle
Islands, and therefore have the potential to influence their perceptions of the landscape. Two
distinctions that I will consider are between sailboaters and power-boaters, and between
charterers (those who rent a boat from a local company) and boat owners.
Respondents were asked to describe the boat they used on their “single best trip” as
one of the following: runabout or speedboat, cabin cruiser, cruising sailboat, or day sailor.
This variable was collapsed: the first two boat types were both coded 1 = power-boat, and the
second two were both coded 2 = sailboat. Sailboating is significantly correlated with higher
family income (Pearson correlation =.109, p<.01), higher education (.170, p<.01), urban
residence (.173, p<.01), and younger age (.057, p<.05). Respondents also reported the boat

31
ownership on their best trip. This was coded one for charterers, zero for private owners.
Chartering is correlated with high education (Pearson correlation=.202, p<.01), urban
residence (.140, p<.01), younger age (.082, p<.01), and unmarried status (.094, p<.01).
3. Enjoyment of Nature and Solitude
In addition to background and experience, psychological variables need to be
considered as potential influences on wilderness beliefs. People’s reasons for visiting the
Apostle Islands and the aspects of the experience that they most enjoy may be coloring their
perceptions of the landscape. I will therefore consider psychological variables that are
relevant to the wilderness experience: preferences for solitude and a “pristine” natural
environment.
The questionnaire included twelve items measuring preferences for solitude and
natural beauty. Nine questions concerned general aspects of sailing or boating trips; the
respondent indicates on a five-point scale how much (s)he enjoys each one. The solitude-
related aspects were: “getting away from it all,” “not seeing any other boats on the horizon,”
“being the only boat anchored in a harbor,” and “getting away from tourists.” The nature-
related aspects were “seeing birds or wildlife nearby,” “sailing in pure, clear water,”
“viewing pristine scenery,” “watching the stars at night,” and “watching the sunrise or sunset
over the water.”
Three additional items concerned aspects of the Apostle Islands that attract visitors to
boating there. These were qualities both that appeal to the respondent and that the
respondent believes to characterize the islands. They were “to be away from crowds,” “the
beauty of the area,”and “clean air and water.” All were measured on a four-point scale, with

32
1 = definitely not attracted by this quality, 2 = probably not attracted, 3 = probably attracted,
4 = definitely attracted. These 12 items were factor analyzed using the alpha factoring
extraction method and varimax rotation. The rotated matrix is presented in Table 11.
Table 11. Rotated Factor Matrix for Solitude and Nature Items.
Factor 1 Factor 2 Factor 3
Nature Enjoyment
Solitude
Nature Attraction
Getting away from it all .315 Not seeing any other boats on the horizon .739
Being the only boat anchored in a harbor .707
Getting away from tourists .501
Seeing birds or wildlife nearby .544
Sailing in pure, clear water .601
Viewing pristine scenery .659
Watching the stars at night .485
Watching the sunrise or sunset over the water .679
To be away from crowds (.386) .434
Clean air and water .578
Beauty of the area .649
Alpha .760 .711 .621
Extraction Method: Alpha Factoring. Rotation Method: Varimax with Kaiser Normalization. a. Rotation converged in 5 iterations.

33
Table 12 presents descriptive statistics for the three summated variables suggested by
this factor analysis. Factor one represents an aesthetic appreciation for the natural
environment. When the six items were added together, 33% of respondents had the highest
possible score of 30. Clearly, Apostle Islands boaters enjoy the natural setting of their
activity. The three items loading in factor two were likewise summed to create an
“enjoyment of solitude” variable. Scores ran the full range, from a low of 3 to a high of 15.
A fairly high mean score of 10.7 indicates that boaters tend to enjoy a solitary experience, but
there is greater variation on this item than on the nature enjoyment indicator. The three
remaining items differ from the others in that they measure specific attractive qualities of the
Apostle Islands, rather than general activities that could be enjoyed anywhere. I named this
summated variable “nature attraction.” Scores range from 5 to 12, and like the “nature
enjoyment” scores, weigh heavily toward the positive side. Sixty percent scored either 11 or
12. Mean score is 10.6, and the standard deviation is 1.3.
Table 12. Descriptive Statistics for Solitude, Nature Enjoyment, and Nature Attraction.
N Minimum Maximum Mean Std. Deviation Solitude
Enjoyment
752 3
15
10.67
2.28
Nature Enjoyment
745
14
30
27.88
2.20
Nature Attraction
737
5
12
10.59
1.34
Variables Used in Analysis of Panel Data

34
Dependent Variables
The dependent variables are measured the same way in the panel data as in the cross-
sectional data. The questions about wilderness, human effects, and environmental damage
were asked in all three surveys of the panel respondents. I will again examine the general
belief about wilderness and the specific belief about impacts in my analysis.
Independent Variable: Time
In the panel analysis, the time variable signifies one of three years – 1975, 1985, or
1997 – in which the same individuals respond to questions about the landscape. The panel
data sets were matched on individuals’ ID numbers, and I assigned different variable names
to each item in the different survey years. For example, the belief about wilderness in 1975
was named aiwild7; in 1985 aiwild8, and in 1997 aiwild9. I then created change variables by
subtracting individual responses in one year from those in another. For example, I measured
change from 1985 to 1997 as “aiwild9 – aiwild8.” I used the same process to create variables
for change in perception of impacts. Differences in this specific belief have greater variation
than in the wilderness belief, since the former is measured on a nine-point rather than a five-
point scale.
Contact with the Resource
I will examine one additional independent variable in the panel analysis: visitors’
contact with the Apostle Islands resource from 1985 to 1997. Contact is measured by two
questions on the 1997 survey. First is whether people made any visits in 1997, the year in

35
which they are responding to the survey. The second measure is the question: “Since 1985,
how often have you boated among the islands?” Ten response categories were provided:
0 = My last visit was in (or before) 1985 5 = 5 visits since 1985 1 = 1 visit since 1985 6 = 6-10 visits since 1985
2 = 2 visits since 1985 11 = 11-20 visits since 1985 3 = 3 visits since 1985 21 = 21-30 visits since 1985 4 = 4 visits since 1985 30 = More than 30 visits since 1985
This coding system was collapsed into three categories:
0 = No visits since 1985 1 = 1-5 visits since 1985 5 = More than 5 visits since 1985
I will compare visitors who returned over the years with those who did not on their likelihood
to alter their beliefs about the wilderness quality of the Apostle Islands landscape.
Summary
The dependent variables are general and specific beliefs about the Apostle Islands
landscape. The general belief is measured by agreement with the statement: “I would
consider the Apostle Islands a wilderness.” The specific belief is the combined responses to
the two statements: “The Apostle Islands seem unaffected by humans” and “The Apostle
Islands’ environment is not being damaged by overuse.” These responses are reverse-coded
and summed together to create a “perception of impacts” variable. The key independent
variable, time, is examined in two different ways for the cross-sectional and panel data. For
the cross-sectional analysis, a multiple regression model will include the survey year as a
dummy variable. The control variables for the cross-sectional analysis fall into three
categories:
36
1.) Socio-economic background: age, education, gender, marital status, number of
children, income, current residence, residence in childhood, and membership in
conservation organizations.
2.) Apostle Islands experience and boating experience: year of first visit to the
islands, number of previous visits, boat type (sail or power), and boat ownership
(chartering or private ownership).
3.) Enjoyment of nature, attraction to the islands’ natural attributes, and enjoyment of
solitude. These three psychological variables were created through a factor
analysis of 12 items on the questionnaire tapping preferences for a variety of
specific activities and attributes of the islands.
In the panel analysis, the time variable is measured as the difference between individuals’
responses to the wilderness questions in the different survey years. One additional
independent variable will be examined in the panel analysis: visitors’ numbers of trips to the
Apostle Islands between 1985 and 1997.

37
Chapter 6 Results
Changing Wilderness Beliefs, 1975-1997
Hypotheses 1 and 2 concern the relationship between the general and specific beliefs
and the direction in which they will change over time. Over the 22-year period from 1975 to
1997, visitors’ general beliefs that the Apostle Islands is a wilderness remained stable.
Between 62% and 64% of respondents agreed that the area was a wilderness in each of the
three survey years, not a significant difference (F=.63, df=2, p=.53). Turning to more precise
indicators, however, we do see a change over time. In 1997, fewer people believed both that
the islands were “unaffected by humans” and that the “environment [was] not being damaged
by overuse” (Figure 3). When combined into the perception of impacts indicator, there was a
16% increase between 1985 and 1997 (Figure 4). This difference is significant (F=33.40,
df=2, p<.001).
Visitors’ perceptions of the quality of wilderness in the Apostle Islands are changing,
although they continue to believe it is a wilderness. These appear to be two different types of
beliefs: one (impacts) responds to the effects of time while the other (wilderness) is stable.
The zero-order correlation between the wilderness and impacts beliefs is -.252, which is
significant at the .01 level (but not very high). This provides some support for Hypothesis 1,
which states that the two beliefs will be inversely related. Hypothesis 2, which states that
beliefs will change toward more impacts and less wilderness, is only half supported.
Figure 3
Wilderness Beliefs of Apostle Islands Boaters(Cross-sections)
Year Surveyed
199719851975
Perc
ent A
gree
80
70
60
50
40
30
20
10
0
Wilderness
Unaffected by Humans
Not Damaged
By Overuse
32
4847
30
43
52
636462

38
Table 13. Mean responses to general and specific wilderness beliefs, by year surveyed
Figure 4General and Specific Beliefs of Apostle
Islands Boaters (Cross-sections)
Year Surveyed
199719851975
Perc
ent W
ho A
gree
100
90
80
70
60
50
40
30
20
100
General Belief:
Wilderness
Specific Belief:
Impacts
47
3130
636462

39
(Cross-sections) General Specific Wilderness* Impacts**
Year 1975 3.47 5.61a
Surveyed 1985 3.55 5.83a
1997 3.51 6.74b
One-way ANOVA with Scheffe post-hoc test. All differences reported (in bold) are significant at at least the p<.05 level. Different letters after the means indicate significant inter-group differences. * General Belief measured on a 5-point scale. ** Specific Belief measured on a 9-point scale.
Explaining Change and Stability in the Cross-sections: 1985 to 1997
Since visitors’ beliefs changed between 1985 and 1997, I will focus on that period in
the following cross-sectional analysis. Between these years visitors came to believe that the
islands were more “affected by humans” and “damaged by overuse.” Was the shift in beliefs
due to changes in the visitors or changes in the resource? The general belief about
wilderness remained stable from 1985 to 1997. Is this stability explained by the fact that the
visitor population did not change? Or is a changing wilderness definition masked because
the population changed? To answer these questions I will control for variables pertaining to
visitors’ socio-economic backgrounds, experience in the Apostle Islands, and feelings about
solitude and the natural beauty of the islands. My goal is to determine if any of these factors
account for the change in impacts perception or the stability in wilderness perception from
1985 to 1997.
Changes in the Visitor Population The composition of the Apostle Islands boater population changed in several ways
over the 22-year period from 1975 to 1997. The tables in this section (Tables 14-16) present
averages and percentages on each of the variables for all three groups of visitors. My

40
analysis will focus on the 1985 and 1997 samples, since my aim is to explain why these two
groups differ in their beliefs about the Apostle Islands landscape (I will present 1975
statistics as well but not treat them in detail since 1975 and 1985 visitors were similar in their
landscape beliefs.) In presenting the following descriptive statistics, I will consider
characteristics of the visitors that theoretically influence their ideas about wilderness and
human impacts. Hypothesis 3 predicts that age, education, gender, membership in
conservation organizations, and experience in the Apostle Islands “wilderness” will influence
wilderness beliefs. I will look at these as well as a few other socio-economic, experiential,
and attitudinal variables. In the next section I will examine which of these variables do in
fact relate to landscape perceptions.
1. Socio-Economic Background
The 1997 visitors tended to be older, more likely to be in the post-babyboom
generation, more highly educated, and had more children than 1985 visitors (Table 14). A
majority of all three samples was male, and there was no change in gender distribution over
time. The percent of single people increased from 1975 to 1985 and then remained stable at
slightly over 30% from 1985 to 1997. There was also no change in income or residential
distributions between 1985 and 1997. Membership in conservation or recreation
organizations decreased between 1975 and 1985 (p<.001), then increased slightly (p<.07)8
from 1985 to 1997.
8 This statistic is from ANOVA with Scheffe post-hoc test. An independent samples t-test, however, confirms a significant (p<.02) difference between 1985 and 1997 levels of organization membership. For this reason I will treat it as a variable that did change from 1985 to 1997.

41
Table 14. Change in Socio-Economic Characteristics of Apostle Islands Boaters,
1975-1997 (Cross-sections) 1975 1985 1997
Age (mean) 37.0a 35.9a 44.3b
Generation Pre-Babyboom (1945 or earlier)
68.5%a 30.7%b 27.9%b
Babyboom (1946-1964)
31.3%a 61.0%b 54.2%b
Post-Babyboom (1965 or later)
.2%a 8.3%b 17.9%c
Education* (mean) 13.7a 13.7a 14.0b
Gender Male 63.6% 63.1% 60.8%
Female 36.4% 36.9% 39.2%
Marital Status Single 22.6%a 33.6%b 31.8%b
Married 77.4% 66.4% 68.2%
Number of Children (mean)
1.9a 1.3b 1.8a
Total Family Income** (mean)
$71,310 $71,490 $67,590
Current Residence Rural, Small Town
21.9% 17.7% 21.3%
Urban 78.1% 82.3% 78.7%
Childhood Residence
Rural, Small Town
N/A 32.3% 38.0%
Urban N/A 67.7% 62.0%
Club Membership***
Members 37.8%a 22.0%b 29.8%b
Non-members 62.2% 78.0% 70.2%
One-way ANOVA with Scheffe post-hoc test. All differences reported (in bold) are significant at at least the p<.05 level. Different letters after the values indicate significant inter-group differences. * Education is measured by five categories, from 12=high school or less to 16=professional or advanced degree. ** Income is standardized to the 1992 dollar. *** Membership in conservation or recreation organizations.

42
2. Apostle Islands Experience and Boating Experience:
Visitors in 1997 tended to have more experience at the Apostle Islands than earlier
visitor populations (Table 15). The 1975 and 1985 visitors both averaged around four years
since their first boating trip in the islands, while 1997 visitors averaged eight years. The
1997 visitors had made significantly more previous trips there than the 1985 visitors, but the
same amount as the 1975 group. The 1985 and 1997 visitors did not differ in their likelihood
of first visiting before 1975. All three groups contained a large majority of sail-boaters, but
the 1985 percent was significantly higher (91%) than the other two (74% and 80%,
respectively). The 1985 boater was also more likely to charter than either of the other two
groups. This shift was pronounced from 1975 (31% charterers) to 1985 (73% charterers).
Percentage of charterers dropped from 1985 to 1997 (56%), but still remained higher than it
was in 1975.
Table 15. Change in Apostle Islands and Boating Experience Among Apostle Islands Boaters, 1975-1997 (Cross-sections)
1975 1985 1997 Year of 1975 or Earlier 100.0%a 12.8%b 9.1%b
First Boat Trip After 1975 0% 87.2% 90.9% Years AI Experience
(mean) 4.4a 3.8a 8.0b
# Previous Visits (mean)
7.7a 3.6b 7.8a

43
Boat Type Sail 73.6%a 90.9%b 79.6%a Power 26.4% 9.1% 20.4%
Boat Charter 31.3%a 72.9%b 55.7%c Ownership Private 68.7% 27.1% 44.3%
One-way ANOVA with Scheffe post-hoc test. All differences reported (in bold) are significant at at least the p<.05 level. Different letters after the values indicate significant inter-group differences.
3. Enjoyment of Solitude and Nature
The 1985 and 1997 visitor groups did not differ in their preference for a solitary
experience (Table 16). The 1997 visitors were, however, significantly more likely to enjoy
the natural setting of their activity, and to be attracted to the Apostle Islands specifically for
the area’s natural qualities.
Table 16. Change in Attitudes Toward Solitude and Nature Among Apostle Islands Boaters, 1975-1997 (Cross-sections)
1975 1985 1997
Solitude Enjoyment
N/A 10.6 10.8
Nature Enjoyment N/A 27.6a 28.2b
Nature Attraction N/A 10.4a 10.8b
One-way ANOVA with Scheffe post-hoc test. All differences reported (in bold) are significant at at least the p<.05 level. Different letters after the values indicate significant inter-group differences.
Do Visitor Characteristics Influence Landscape Perceptions?
The 1997 visitor tended to be older, more highly educated, more likely to be a
member of a conservation organization, more experienced with the resource, and more
interested in the natural attributes of the islands than the 1985 visitor was. All of these

44
variables would appear to influence people’s beliefs about the environmental conditions in
the National Lakeshore. Do they? In this section I will examine the degree to which each of
the control variables correlates with landscape perception. I will look first at the variables
whose distributions changed from 1985 to 1997, and will then consider the visitor
characteristics that did not change from 1985 to 1997.
Variables whose distributions changed significantly from 1985-1997
The visitor characteristics whose distributions changed from 1985 to 1997 are:
1.) Socio-economic variables:
Visitors in 1997 were older, had a different generational distribution, were more
highly eduated, had more children, and were somewhat more likely to be members of
conservation organizations.9
2.) Apostle Islands and boating experience variables:
The 1997 visitor had been boating at the Apostle Islands longer, had made more
previous trips, was more likely to be a power-boater than in 1985 (although still a
large majority was sail-boaters), and was more likely to be on a privately-owned boat.
3.) Enjoyment of Nature:
The 1997 visitor expressed a greater enjoyment of the natural beauty of the
islands, and was more attracted by the area’s natural attributes.
1.) Socio-economic variables

45
Age at the time of the survey does not correlate with either general or specific
wilderness beliefs (Table 17). Generation, on the other hand, does influence perception of
the landscape. Visitors born after 1964 are more likely to consider the Apostle Islands a
wilderness. People born before 1946 are significantly less likely than babyboomers to
perceive social and environmental impacts. Education influences both beliefs: lesser-
educated visitors tend to believe the landscape is a wilderness, while those with higher
education are more likely to see impacts. People with no children are slightly (p=.07) more
likely than others to perceive impacts. Membership in a conservation or recreation
organization does not influence visitors’ landscape beliefs.
9 See footnote on page 71.

46
Table 17. Mean Responses to General and Specific Beliefs, By Socio-economic and Experiential Categories (Cross-sections) Variables Where Change Occurred, 1985-1997
General Specific Wilderness Impacts
Age* NS NS Generati
on Pre-Babyboom (1945 or earlier)
3.52a 5.65a
Babyboom (1946-1964)
3.42a 6.24b
Post-babyboom
3.88b 5.81ab
Education High School 3.85a 5.52a
Some College 3.59ab 6.05ab
B.A. 3.45b 5.81a
M.A. 3.35b 6.33b
Advanced Degree 3.35b 5.96ab
Number 0 3.46 6.14a (p=.07) Of 1-2 3.56 5.81b
Children 3 or More 3.49 6.00 Club Members 3.45 5.90
Membership Non-members 3.52 5.94 Years AI Survey Year 3.54ab 5.95ab
Experience 1-5 Years Prior 3.41a(p=.10) 5.74a
>5 Yrs. Prior 3.56b 6.22b
Number of 0 3.55 5.84a (p=.11) Previous 1-10 3.46 5.94
Visits >10 3.52 6.17b
Boat Type Power 3.67 5.87 Sail 3.46 5.99
Boat Charter 3.51 6.00 Ownership Private 3.50 5.94
One-way ANOVA with Scheffe post-hoc test. All differences reported (in bold) are significant at at least the p<.05 level. Different letters after the values indicate significant inter-group differences. * Since age is a continuous variable, categorical means cannot be reported. The standardized regression coefficient of age on the general belief is -.027 (p=.32), and on the specific belief is -.014 (p=.61).

47
2.) Apostle Islands Experience and Boating Experience
People with less experience at the Apostle Islands (first visit one to five years before
the survey) are somewhat less likely (p=.10) to consider the area a wilderness than those with
more than five years of experience. Likewise, more experience with the resource
significantly relates to a perception of a flawed, impacted landscape. Number of previous
boating trips to the islands does not influence the belief that the area is a wilderness, but it
has a slight influence on perception of human impacts. Boaters who had made no previous
trips to the islands tend to notice less impacts (p=.11) than those who had boated there more
than 10 times before.
Sail-boaters are less likely than power-boaters to consider the Apostle Islands to be a
wilderness. No significant difference exists, however, between sailors and power-boaters’
awareness of human effects and environmental damage in the islands. Charterers and boat
owners do not hold different beliefs about the quality of the Apostle Islands landscape.
3.) Enjoyment of Nature and Solitude
Enjoyment of nature does not influence one’s belief that the Apostle Islands is a
wilderness (Table 18). However, attraction to the islands’ natural amenities has a slight
(p=.08) tendency to do so. Enjoyment of nature does predict the more specific belief: people
who express a greater appreciation for the natural quality of the landscape are more likely to
recognize its flaws. Attraction to the Apostle Islands because of its natural values does not
influence perceptions of impacts.

48
Table 18. The Effects of Nature Enjoyment on Landscape Beliefs Standardized Regression Coefficients of Single Linear Regressions (Cross-sections) General Specific Wilderness Awareness of Impacts Nature Enjoyment .036 .127
Nature Attraction .07 (p=.08) .007
All coefficients reported (in bold) are significant at at least the p<.05 level.
.
Variables whose distributions did not change from 1985 to 1997
Even variables that did not change can mask a change in beliefs that may have
occurred from 1985 to 1997. This is called a suppression effect.
1.) Socio-economic variables
Among the socio-economic variables that remained stable from 1985 to 1997, three
of them affect perception of impacts and one slightly affects perception of wilderness (Table
19). Single people, people with lower incomes, and those who grew up in urban areas are
more likely to consider the environment of the islands impacted. People who currently live
in urban areas are somewhat (p=.09) less likely to believe the islands to be a wilderness.
Gender has no significant effect on either belief.

49
Table 19. Mean Responses to General and Specific Beliefs, By Socio-economic and Experiential Categories (Cross-sections) Variables Where Change Did Not Occur, 1985-1997
General Specific Wilderness Impacts
Gender Male 3.48 5.91 Female 3.53 5.94
Marital
Single 3.51 6.20 Married 3.50 5.81
Total < $40,000 3.51 6.57a
Family $40,000-$59,999 3.52 5.86b
Income $60,000-$79,999 3.49 5.85b
$80,000-$99,999 3.54 6.09ab
$100,000+ 3.45 5.56b
Current Rural,
3.60(p=.09) 5.83 Residence Urban 3.48 5.95
Childhood Rural,
3.55 5.94 Residence Urban 3.52 6.35
Year of 1975 or Earlier 3.50 5.77 First Boat Trip After 1975 3.50 6.11
One-way ANOVA with Scheffe post-hoc test. All differences reported (in bold) are significant at at least the p<.05 level. Table 20. The Effect of Solitude Enjoyment on Landscape Beliefs Standardized Regression Coefficient of Single Linear Regression (Cross-sections)
General Specific Wilderness Impacts Solitude Enjoyment -.036 .139
All coefficients reported (in bold) are significant at at least the p<.05 level. 2.) Apostle Islands and boating experience
People who first boated in the islands pre-1975 are just as likely as those who came
later to consider the area a wilderness, but are less likely to identify either human impacts or
environmental damage (Table 19).

50
3.) Enjoyment of solitude
The enjoyment of solitude positively influences an awareness of impacts in the
islands. That is, those who appreciate the solitary experience the most are also those who
perceive the most impacts on the landscape (Table 20).
Results of Multiple Regression I computed multiple regression equations to see if time continues to play the same
role when other variables are simultaneously considered (Table 21). I found that changes in
the distributions of visitor characteristics do not explain the perceptions of wilderness or
impacts observed across the years. Year continues to have no effect on the perception of
wilderness, even controlling for 13 socio-economic, experiential, and psychological
variables. In other words, fluctuations in the visitor population were not concealing a change
in the meaning of wilderness. Furthermore, visitor characteristics do not account for the
1985-1997 change in beliefs about impacts. The 1997 visitors still report seeing more
impacts in the islands, even with all these variables controlled for. While year of visit and
the other 13 variables explain 10.6% (p<.001) of the variance in belief about impacts, the 13
variables explain less than 3% of the variance in the wilderness belief (not significant,
p=.40).

51
Table 21. The Effects of Visitor Characteristics on Landscape Beliefs Standardized Regression Coefficients from Multiple Regression10 General Specific Wilderness Impacts 1997 Visitor -.059 .153 Age -.011 -.049 Higher Education -.065 .107 Female Gender .016 -.067 Married .048 -.048 More Children .010 -.016 Higher Income .002 -.122 Grew up Urban -.079 .081 Member of Organization -.014 -.016 More Years AI Experience .074 .101 Sail-boaters -.088 .084 (p<.06) Charterers .040 -.018 Enjoy Solitude -.040 .074 (p<.10) Enjoy Natural Beauty .054 .071 (p<.11) R-squared .027 .106
All differences reported (in bold) are significant at at least the p<.05 level.
Five variables significantly predict people’s belief about impacts in the islands.
Visitors who have more experience in the islands, those who grew up in cities and those with
a higher education are more likely to perceive impacts. Wealthier visitors are less likely to
be aware of impacts. Sail-boaters are slightly (p<.06) more likely to believe the landscape is
affected and damaged. Those who enjoy solitude and natural beauty more are also slightly
(p<.10, p<.11) more cognizant of impacts in the islands. Finally, when all 13 variables are

52
controlled, 1997 visitation still predicts a greater awareness of impacts. Changes in the
visitor population do not explain the shift between 1985 and 1997. It appears that something
must have changed in the Apostle Islands landscape during these years to influence visitors’
perceptions.
Contact with the Resource Over Time
Did change occur in the Apostle Islands landscape between 1985 and 1997 that was
significant enough to lead people to view the area as a more impacted wilderness? We can
answer this question by observing how individuals changed their beliefs in response to
repeated contact with the landscape over these years. Hypothesis 4 states that respondents
will be more likely to change their beliefs about the landscape if they have continued contact
with it. To test this hypothesis, we must turn to the panel data.
Change Within Individuals
The analysis thus far has focused on aggregate change among cross-sections of
Apostle Islands visitor populations. Another way of looking at change is within individuals.
Did people who boated in the Apostle Islands in 1975 alter their perceptions of the landscape
over the next two decades? If so, how? Specifically, I will consider changes between 1985
and 1997, in order to tie this analysis to the previous cross-sectional analysis. Table 22
presents the change on the individual level for the general and specific wilderness beliefs
10 Variables that were used in analysis were left out of the regression model due to conceptual redundancy and significant inter-correlations: generation, current residence, year of first visit, number of previous visits, and nature attraction.

53
from 1985 to 1997. Forty-six percent of the respondents did not change their belief about the
wilderness quality of the islands, while 21% came to believe it was more of a wilderness and
33% saw it as less of a wilderness over time. As for the specific belief, 46% changed toward
a higher awareness of impacts. A quarter did not change their belief, and 30% believed there
were fewer impacts in 1997 than in 1985. We see, therefore, that individuals differed in the
process of changing their beliefs
.
Table 22. Individual Change on Wilderness Beliefs From 1985 to 1997
(1975-85-97 Panel)
General Belief
Frequency Percent Less Wilderness 55 33.1 No Change 76 45.8 More Wilderness 35 21.1 Total 166* 100.0
Frequency Percent Less Impacts 53 29.8 No Change 43 24.2 More Impacts 82 46.1 Total 178 100.0
* Twelve respondents provided no response to the wilderness question in 1997 and are therefore excluded from the analysis.

54
Contact with the Resource 1985-1997
Some of the 178 panel respondents continued to boat in the Apostle Islands from
1985 to 1997. Others did not. They either found other places to boat or quit the activity all
together because of age, lack of interest, or various other reasons. Hypothesis 4 assumes that
people who continued to visit the area from 1985 to 1997 would be more likely than others to
change their beliefs. Presumably, a person who never returned between 1985 and 1997
would be stating their belief based on identical images of the islands in both survey years;
their belief would theoretically remain stable. The visitors who returned, however, have seen
the actual ways in which the islands’ landscape has changed over the years. Since there has
been an increasing human presence in the area, we would expect return visitors to be more
likely than others to change their beliefs, particularly in the negative direction – toward less
wilderness and more impacts.
I will use two ways of measuring contact with the landscape from 1985 to 1997: first,
whether people made any visits in the survey year 1997, and second, how many visits they
made since 1985. Figures 5 and 6 show that there is no significant difference between people
who visited in 1997 and those who did not in their likelihood to alter their beliefs. The chi-
squared statistic for the general belief is .990 (p=.61) and for the specific belief is 1.51
(p=.47).
Figure 5: Individual Change
On General Wilderness Belief
By 1997 Visit
More WildernessNo ChangeLess Wilderness
Per
cent
60
50
40
30
20
10
0
No 1997 Visit
1997 Visit
20
4139
21
48
31

55
The second measure of contact with the resource is number of trips between 1985 and
1997. Respondents fall into three categories: those who made no visits since 1985, those
who made 1-5 visitis, and those who made more than 5 visits. Figure 7 presents the
distribution of the three groups’ likelihood to change their general wilderness belief. It
Figure 6: Individual Change
On Specific Wilderness Belief
By 1997 Visit
More ImpactsNo ChangeLess Impacts
Per
cent
60
50
40
30
20
10
0
No 1997 Visit
1997 Visit
43
21
36
47
2627

56
appears that people who made more trips were more likely to change toward less wilderness
(the hypothsized relationship), however this difference is not statistically significant. The
chi-squared statistic is 3.98 (p=.41). Furthermore, number of visits since 1985 did not
influence a person’s likelihood to alter their perception of impacts (Figure 8). The chi-
squared statistic for the specific belief is 1.14 (p=.89).
Figure 7: Individual Change
On General Wilderness Belief
By Number of Visits Since 1985
More WildernessNo ChangeLess Wilderness
Per
cent
60
50
40
30
20
10
0
No Visits Since 1985
1-5 Visits
>5 Visits
19
4041
21
48
31
24
52
24
Figure 8: Individual Change
On Specific Wilderness Belief
By Number of Visits Since 1985
More ImpactsNo ChangeLess Impacts
Per
cent
60
50
40
30
20
10
0
No Visits Since 1985
1-5 Visits
>5 Visits
45
22
32
50
2327
43
2828

57
Neither of the measures of 1985-1997 contact correlated with individuals’ belief
changes. These results do not support Hypothesis 4, that more contact would lead to a
greater likelihood to change beliefs (particularly in the negative direction). People were just
as likely to comment that the islands were less of a wilderness and more impacted in 1997
than in 1985 whether or not they actually saw the resource during that time. They were also
just as likely to change in the opposite direction – toward more wilderness and less impacts.
And, they were just as likely to retain the same perception of the landscape from 1985 to
1997. Amount of contact with the resource played no significant role in affecting people’s
belief changes.
Summary The cross-sectional and panel data offered two different approaches to the question of
change. First, through a detailed analysis of 18 control variables in the cross-sectional data, I
examined the influence of specific characteristics on visitors’ aggregate beliefs about
wilderness in the Apostle Islands. I extended my analysis beyond that of previous reseachers
by controlling for multiple variables. The general belief did not change over the 22-year
period, while the specific belief did, despite fluctuations in the composition of the visitor
population.
After answering the question about changing visitor characteristics, I then used the
panel data to examine a hypothesis about contact with the landscape. The panel data made it
possible to look at change within individuals. Specifically, I investigated the influence of
one independent variable – contact with the landscape – on people’s propensity to change

58
their beliefs. I found it to have no significant influence in any direction. The results of this
two-phase analysis suggest:
1. Fluctuations of visitor characteristics do not account for aggregate change in
visitors’ wilderness beliefs.
2. Contact with a changing landscape does not necessarily lead individuals to alter
their beliefs about the landscape.
In the concluding chapter, I will consider another possible explanation: more ubiquitous
social change. First I will discuss the details of the findings about general and specific
beliefs about wilderness.

59
Chapter 7
Discussion
Beliefs About Wilderness: Stability and Change
Hypothesis 1 predicted that general (wilderness) and specific (human impacts) beliefs
about the Apostle Islands landscape would be inversely correlated; Hypothesis 2 predicted
specifically that the beliefs would change in the direction of less wilderness and more
impacts. The cross-sectional data did not support Hypothesis 1, and only half-supported
Hypothesis 2. From 1975 to 1997, Apostle Islands visitors consistently agreed that the
Apostle Islands was a wilderness, while more people came to believe that the islands were
affected and damaged by humans. From these results, it appears that the two beliefs act
independently of each other.
The Apostle Islands is Still a Wilderness
The general belief about what constitutes a wilderness remained stable from 1975 to
1997 among Apostle Islands visitors. Even as the visitors changed over the years, six out of
ten respondents continued to agree that the islands were a wilderness. The changes that took
place in the islands between these years did not alter visitors’ general beliefs. It seems that
among the population of study, the meaning of wilderness at the Apostle Islands is obvious
and static. What was wilderness in 1975 still was in 1985 and in 1997. Most of the boater
population apparently considers the issue as obvious as Superintendent Jerry Banta

60
commented in a September 1999 article in the Wisconsin State Journal: “Banta said people
can argue different definitions of what a wilderness is, but ‘I’ve always thought if these
islands aren’t wilderness, I don’t know what is.’” This finding lends support to the biological
fact side of the New Wilderness Debate. Wilderness seems to be an objectively definable
concept that retains its meaning over time.
Not everyone holds the same personal definition of wilderness, however. In every
year of our survey, 30-35% of visitors disagreed that the Apostle Islands was a wilderness.
People with more education, born in the earlier (pre-babyboom and babyboom) generations,
sail-boaters, and urban residents were less likely to characterize the islands as a wilderness.
The distribution of the visitor population changed along these and other characteristics.
Among other things, the 1997 visitor was more highly educated and more likely to be a sail-
boater; on their own, each of these variables tended to decrease people’s belief that the
Apostle Islands was a wilderness. With several other things held constant, however,
education and boat type do not influence people’s general wilderness beliefs. Nor do any of
the other visitor characteristics I have considered. The multiple regression shows that
changes in these key variables do not explain the stability of the beliefs: there appear to be no
suppressor effects. Regardless of changes in the composition of the visitor population, the
general tendency of people to agree that the Apostle Islands was a wilderness remained
stable.
The specific finding that urban residents were less likely to consider the Apostle
Islands a wilderness, although only statistically significant at p=.10, is worth noting because
it contradicts earlier findings. Lutz et al. (1999) found that rural residents were more
discriminating than urban residents in what they would consider to be a wilderness. This

61
finding appears intuitive: people judge landscapes based on their experiences. City residents
are accustomed to developed landscapes and therefore would characterize a less developed
landscape as a wilderness more readily than rural residents would. The contradictory results
between Lutz et al. and the present study are attributable to differences in the samples. First
of all, our “urban” category included suburban and small city residents, whereas Lutz et al.’s
urban sample consisted only of inner-city residents. Second, our sample consisted uniquely
of people who boat in the Apostle Islands. There may be specific differences between the
rural and urban members of our sample, aside from their places of residence. Perhaps rural
residents tend to be locals who primarily boat in northern Wisconsin, whereas the city and
suburban residents may visit and/or boat in a variety of natural areas. Income, education, and
experience in the wilderness should be controlled before one makes a statement about the
effect of residence on wilderness beliefs.
Changing Wilderness Quality
While the general wilderness belief remained constant, the more specific belief about
human impacts in the islands changed between 1985 and 1997. Contrary to Hypotheses 1
and 2, these two beliefs did not act in concert. Rather, the specific belief changed
independently of the general belief. This finding speaks to the New Wilderness Debate.
Nash, Cronon, and others of the constructionist bent, argue that the meaning of wilderness
changes over time. Our results seem to indicate that beliefs pertaining to wilderness are
changing, but people’s fundamental definitions of wilderness are not. People continue to
look at the Apostle Islands and see a wilderness; on that general level the definition is not

62
problematic. However, over time they have begun to consider the area to be a more impacted
wilderness.
How high could the perception of impacts go before the islands lose their
fundamental wilderness quality? If, over the coming years, visitors come to see more and
more impacts on the Apostle Islands landscape, will there come a moment when they stop
considering it a wilderness? This is unlikely to happen in the Apostle Islands. The National
Park Service manages most of the land in the National Lakeshore “to preserve [its] potential
wilderness values” (Scott 1999), and past trends suggest that use of the islands will probably
not increase much in the upcoming years. However, other natural landscapes may be
changing enough to influence visitors’ perceptions. For instance, visitors to the crowded
areas of Yosemite and Yellowstone National Parks are probably less likely to believe they
are in a wilderness than they would have been 30 or 40 years ago. The threshold at which an
area loses its “wilderness status” deserves to be better understood.
The Causes of Change
In addition to the two hypotheses about what change would look like, I made two
predictions about the causes of changing beliefs. Hypothesis 3 concerned the influence of a
changing visitor population, and Hypothesis 4 concerned the effects of a changing landscape.
Changes in the Visitor Population
Hypothesis 3 followed the “wilderness purism” literature in predicting that wilderness
beliefs will be linked to certain characteristics of visitors. Specifically, age, education,
gender (female), membership in conservation organizations, and experience in the

63
wilderness, have all been linked to greater degrees of wilderness purism (Watson et al. 1995).
Hypothesis 3 had two parts. First, it predicted that the distribution of the visitor population
would change over time along the dimensions listed above. Second, Hypothesis 3 predicted
that changes in wilderness beliefs could be explained by changes in the distributions of
visitors along these characteristics. The first part of this hypothesis was supported: the 1997
visitors were older, more highly educated, and had more years of experience at the Apostle
Islands. However, the second stipulation found no support: none of these characteristics, nor
the several others included in the analysis, explained the change in wilderness beliefs from
1985 to 1997. Therefore, we cannot conclude (as earlier studies did) that beliefs change
primarily because individuals change.
Contact with a Changing Resource
If changing beliefs were not due to changes in the visitor population, were they
caused by actual changes in the landscape? Maybe the reason more people in 1997 viewed
the islands as “affected by humans” and “damaged by overuse” was because, quite simply,
they were. Based on information about changes in the Apostle Islands between 1975 and
1997, Hypothesis 4 predicted that people who had more contact with the Apostle Islands
landscape over the years would be more likely than others to change their views.
Specifically, they would come to believe the Apostle Islands to be less of a wilderness and
more impacted by human presence.
What changes to the landscape might have influenced people’s perception? On the
most basic level, there were more visitors in the islands in 1997 than in 1985. However, use
level increased much more substantially between 1975 and 1985 than between 1985 and

64
1997, so it is curious why beliefs changed during the later rather than the earlier period. It
does not seem, therefore, that increasing use level is the most plausible explanation. Maybe
it was the increase in visitor numbers combined with other changes in and around the
lakeshore. There was construction on a few of the islands in the late 1980s, including the
dock and ranger facilities at Stockton Island’s Presque Isle Bay. In addition, new marinas
were built in the surrounding area, with a total of at least 266 new boat slips (refer to Table
1). These developments had the potential to influence people’s views of the wilderness
quality of the islands.
I used the panel data to answer the question posed by Hypothesis 4: does continual
contact with the landscape over time make an individual more likely to change his/her beliefs
about the landscape’s wilderness qualities? The answer was “No.” No matter how many
visits people made to the islands between 1985 and 1997, about one-third of them considered
it less of a wilderness in 1997, nearly half did not change, and the rest (21%) actually thought
it was more of a wilderness in 1997. Likewise, contact with the resource had no influence
on visitors’ likelihood to change their specific beliefs: nearly 50% perceived more impacts in
1997, a quarter did not change, and 30% considered the islands less impacted. A person who
never returned to the islands between 1985 and 1997 was just as likely to modify her/his
memory of the islands as the person who continued to visit was to modify her/his perception
of the islands. Therefore, there must be some process beyond the Apostle Islands that is
driving this change.
The question of individual change over time demands further research. As mentioned
in Chapter 2 of this thesis, there has hardly been any panel research in the recreational
literature. Furthermore, the New Wilderness Debate demands longitudinal data because one

65
of its central tensions concerns the dynamic nature of wilderness definitions. I have
examined one variable – continued contact with the resource – in my analysis of individuals’
belief changes, and found it to have no effect.
I am left wondering what does influence a person to alter his or her beliefs about a
particular landscape over time. What life course factors would influence a person’s
wilderness beliefs? Education about and experience with more “true” wilderness areas
would likely influence a person to view an area like the AINL as less of a wilderness.
Perhaps growing older and spending less time in the wilderness would have the opposite
effect. Do changes observed over time indicate that people’s personal definitions of
wilderness are changing on a general level, or only in reference to a particular object such as
the Apostle Islands? This type of research can also speak to the question of cognitive
stability over time. Is it reasonable to assume that people’s beliefs or attitudes would change
in a coherent manner over a ten or twenty year period? Or is there a high degree of
arbitrariness in how people respond to the same questions at different points in time?
Social Change
In my analysis, I approached the data in two different ways and thereby shed doubt on
the two hypotheses about the causes of changing beliefs. Hypothesis 3, which I tested with
the cross-sectional data, was that beliefs change primarily because individuals change. I
found that the composition of the visitor population did change. However, people's general
beliefs remained the same and their specific beliefs about impacts changed irrespective of
specific characteristics like age, education, club membership, etc.

66
Next, I considered changes in the landscape as a cause of belief change. I used the
panel data to test whether physical changes to the resource are a major influence on people’s
changing perceptions (Hypothesis 4). This explanation also turned out to be unsatisfactory.
Something beyond the particular context of the Apostle Islands influenced the ways in which
people observed and judged the landscape. More specifically, something about the year 1997
differed from the year 1985 in how it influenced people’s wilderness beliefs.
These data suggest that broad social definitions of environmental impacts may be
changing. The 1997 observer was more critical than the 1985 observer, regardless of actual
contact with the landscape. This is possibly a result of the maturing and diversifying of the
environmental movement over the last half of the 1980s and through the 1990s. Concern for
the environment has become more widespread through many segments of society (Dunlap
1992). The present analysis gives evidence that this trend has continued through the 1990s,
at least within the narrow segment of society represented by Apostle Islands boaters. By the
late 1990s, it has become common knowledge that almost none of the Earth remains
untouched by human hands. This is the idea that Bill McKibben (1990) popularized in The
End of Nature, for example. Let us recall the wording of the statements posed to the Apostle
Islands boaters: “The Apostle Islands seem unaffected by humans.” “The Apostle Islands’
environment is not being damaged by overuse” (emphasis added). Few people are willing to
agree with negative statements such as these anymore, since everybody knows that our
environment is affected and damaged by humans. Apparently, though, this knowledge does
not rule out the existence of wilderness areas. Even if the entire planet is affected by the
presence of humans, there still remain areas we can legitimately call wildernesses.

67
The Great New Wilderness Debate
This research started from the notion that wilderness definitions are socially
constructed. Simply by asking the question “Would you consider the Apostle Islands a
wilderness?” I have assumed that wilderness is a subjective concept. However, I do not
conceive of wilderness as merely an abstract idea in the minds of individuals and society. By
posing and testing my fourth hypothesis, about contact with the landscape, I call attention to
the real physical changes in the Apostle Islands National Lakeshore. By bringing in the
landscape, I ground the social constructionist argument. Wilderness definitions are dynamic
in the minds of individuals and of society, but they are always connected to a particular
landscape.
My results show mixed support for both sides of the New Wilderness Debate. First,
they substantiate the claim that wilderness is a subjective concept: not everybody agrees that
this particular landscape is a wilderness. Moreover, my empirical analysis establishes that
beliefs pertaining to wilderness do, indeed, change over time. On the other hand, the
fundamental definition of wilderness seems to be stable and enduring in the minds of Apostle
Islands boaters. This finding lends support to the notion that wilderness is something real
and unchanging.
The New Wilderness Debate, however, is more than a discussion about changing
wilderness definitions. Most critics of the social constructionist perspective do not disagree
with the notion that wilderness meanings change over time (Waller 1998, for example).
Rather, they contest the implications of the social construction argument. Arguing that

68
wilderness is “just an idea” can be dangerous for conservationists. For example, Cronon’s
article “The Trouble With Wilderness” was printed in the New York Times Magazine in
1995, in a political climate that was unfriendly to wilderness protection (Greenberg 1999).
By grounding more research in specific landscapes, as the present study has done, we can
avoid the dangers of an abstract social constructionist argument.
Future Research
This study only considered the beliefs of recreational sail-boaters and power-boaters
in the Apostle Islands and is therefore limited in its generalizability. In the context of the
Apostle Islands, we should also study the growing population of sea-kayakers. In 1997, we
collected pilot data on this group of users and are presently beginning to compare them to the
boaters in their backgrounds, behaviors, attitudes and beliefs. Furthermore, the general
visitor to the Apostle Islands – who only has access to the islands by the commercial tour
boat – also deserves to be better understood. The present study is also spatially limited
because it only examines change at the Apostle Islands National Lakeshore. In order to truly
make a general statement about how wilderness definitions are or are not changing, we must
consider people’s beliefs vis-à-vis a wide range of natural areas.
For a more complete understanding of subjective wilderness concepts, qualitative
research methods should be used to complement survey research. The analysis of
questionnaire items portrays the overarching trends, but does not capture the complexity
behind people’s beliefs. In-depth interviews could fill in the gaps in this research by
examining the sources of people’s beliefs about wilderness.

69
Changing People, Changing Park
While suggesting that broad social change may have occurred, these data also paint a
concrete picture of change within the specific context of the Apostle Islands National
Lakeshore. I have considered the changes among the boater population merely as a single
step in my analysis process, but these changes are also important in and of themselves. In
several respects, the types of visitors seem to be swinging back to how they were in 1975.
The 1997 visitor had on average more children, and (not analyzed here) was more likely to
travel with family rather than friends. They were more likely to own their own boat and had
more experience boating. These findings suggest that the present and future boating
population at the Apostle Islands may be more stable and committed to boating. However,
one of the most striking findings was that the population aged by an average of eight years
between 1985 and 1997. This trend implies that future visitation to the Apostle Islands may
decline: people in their forties, fifties, and sixties are continuing to return to the islands, but
the younger visitors are not filling in behind them (See graph in Appendix B). For a more
detailed discussion of changes among the Apostle Islands boater population, see Heberlein et
al., 1999.
The 1997 return to an 8:2 ratio of sailors to power-boaters suggests that as people age
they may be switching from sailing to motorized travel around the islands. If this trend
continues, conflicts between boater types may increase at the island docks and on the open
water. The proportion of people who chartered boats also changed over the years, more than
doubling between 1975 and 1985 and then decreasing by 1997. This finding corresponds
with the trends in the charter industry (Heberlein et al. 1999). The local charter companies,
to some extent, control access to the Apostle Islands, since many people would not be able to

70
visit them otherwise. To understand visitors to the Apostle Islands, we must take
institutional factors such as this into account.
Finally, as I have emphasized in this paper, boaters’ beliefs about environmental
conditions in the islands are changing. People are becoming more critical of the
environmental conditions and, in some cases, of the management of the Lakeshore. Some
boaters commented that they do not want the islands to become like Isle Royale National
Park, which they see as overly-regulated and unaccomodating to recreational boaters. If this
feeling is widespread, then perhaps those people will gradually stop returning, especially as
the management of the Lakeshore moves toward more of a wilderness model in the
upcoming years. Such a self-selection process would cause the trend toward what we might
call “wilderness purism” to persist among Apostle Islands boaters. Furthermore, sea-
kayakers are becoming an ever-more visible presence in the islands. Their preference for
self-propelled travel is more in synch with the wilderness concept than sailing or power-
boating. As the changing values of the visitors dovetail with more wilderness-oriented
management, perhaps the Apostle Islands is actually becoming more of a wilderness, at least
in the minds of the people who experience it.

71
References
Alanen, Arnold R. and Tishler, William H. 1996. “Farming the Lake Superior Shore:
Agriculture and Horticulture on the Apostle Islands, 1840-1940.” The State Historical
Society of Wisconsin.
Beaulieu, J.T. 1984. “Defining the Components of Environmental Image for Use as a
Predictor of Decision to Participate.” Logan, UT: Utah State University; Ph.D. Dissertation;
171 p.
Callicott, J. Baird and Nelson, Michael P. 1998. The Great New Wilderness Debate, a collection of writings defining wilderness from John Muir to Gary Snyder. Athens: University of Georgia Press. Chief Luther Standing Bear. 1933. Land of the Spotted Eagle. In Callicott and Nelson, eds. The Great New Wilderness Debate. Athens: University of Georgia Press. 1998. Copp, J.H. 1967. “Discussion of Wildernism – The Development, Dimensions and Use of an Attitude Scale.” Paper presented at the annual meeting of the Rural Sociological Society, San Fancisco, CA. Cronon, William. 1995. “The Trouble with Wilderness; or, Getting Back to the Wrong Nature.” In Cronon, William, ed. Uncommon Ground. New York: W.W. Norton. 69-90. Dunlap, Riley E. 1992. “Trends in Public Opinion Toward Environmental Issues: 1965-1990.” In Dunlap, R.E. and Mertig, A.G. eds. American Environmentalism: The U.S. Environmental Movement 1970-1990. New York: Taylor & Francis. 89-116. Dunlap, Riley E. and Van Liere, Kent D. 1978. “The New Environmental Paradigm.” Journal of Environmental Education, 9: 10-19. Field Research Corporation. 1977. “California Public Opinion and Behavior Regarding the California Desert.” Technical Report. San Francisco, CA. Foreman, Dave. 1998. “Wilderness Areas for Real.” In Callicott and Nelson, eds. The Great New Wilderness Debate. Athens: University of Georgia Press. 1998.

72
Greenberg, Jerry. 1999. “Wilderness: Changing Definitions, Perspectives, and Priorities.” Session Organizer for Session C-5. Building on Leopold’s Legacy: Conservation for a New Century. Monona Terrace Community and Convention Center, Madison, Wisconsin on October 4-7, 1999. Guha, Ramachandra. 1989. “Radical Environmentalism and Wilderness Preservation: a Third World Perspective.” In Callicott and Nelson, eds. The Great New Wilderness Debate. Athens: University of Georgia Press. 1998.
Heberlein, Thomas A. 1973. “Social Psychological Assumptions of User Attitude Surveys: the Case of the Wildernism Scale.” Journal of Leisure Research, 5 (Summer), 18-33. Heberlein, Thomas A. and Jerry J. Vaske. 1979. “The Apostle Islands Visitor in 1975.” Working Paper No. 11. Center for Resource Policy Studies, School of Natural Resources, College of Agriculture and Life Sciences, University of Wisconsin-Madison. Heberlein, Thomas A., G.E. Alfano, and L.E. Ervin. 1986. “Using a Social Carrying Capacity Model to Estimate the Effects of Marina Development at the Apostle Islands National Lakeshore.” Leisure Sciences, 8 (3): 257-274. Heberlein, Thomas A. and Laurie H. Ervin. 1990. “Life Course Changes and Continued Boating at the Apostle Islands.” Paper presented at the Outdoor Recreation TRENDS Symposium III, Indianapolis, IN, March 30, 1990. Heberlein, Thomas A., Walter F. Kuentzel, and Rebecca A. Grossberg. 1999. “Changing
Patterns of Recreation over Time: What Can Be Learned from Panel Studies?” Paper
presented at the International Symposium on Society and Resource Management, Brisbane,
Australia, July 9, 1999.
Hellerstein, D. and R. Mendelsohn. 1990. “Analyzing Outdoor Recreation Over Time.” In J.T. O’Leary, Ed. Proceedings of the Outdoor Recreation Trends Symposium III. Hendee, J.C., W.R. Catton, Jr., L.D. Marlow, and C.F. Brockman. 1968. “Wilderness Users in the Pacific Northwest: Their Characteristics, Values and Management Preferences.” Pacific Northwest Forest and Range Experiment Station. U.S. Department of Agriculture. Portland, OR.

73
Higham, James. 1998. “Sustaining the Physical and Social Dimensions of Wilderness Tourism: The Perceptual Approach to Wilderness Management in New Zealand.” Sustainable Tourism, 6(1): 26-51. Louviere, J. & H. Timmermans. 1990. “Preference Analysis, Choice Modeling and Demand Forecasting.” In J.T. O’Leary, Ed. Proceedings of the Outdoor Recreation Trends Symposium III. Lucas, Robert C. 1964a. “Wilderness Perception and Use: The Example of the Boundary Waters Canoe Area. Natural Resources Journal, 3(3): 394-411. Lucas, Robert C. 1964b. “The Recreational Capacity of the Quetico-Superior Area.” Lake States Forest Exp. Sta. U.S. Forest Service, Res. Pap. LS-15, 34 pp. Lucas, Robert C. 1985. “Visitor characteristics, attitudes, and use patterns in the Bob Marshall Wilderness Complex, 1970-1982.” Res. Pap. IN-I-345. Ogden, UT: USDA Forest Service, Intermountain Research Station. Lutz, Allison R.; Simpson-Housely, Paul and DeMan, Anton F. 1999. “Wilderness: Rural and Urban Attitudes and Perceptions.” Environment and Behavior, March 1999, 259-266. Marshall, Robert. 1930. “The Problem of the Wilderness.” In Callicott and Nelson, eds. The Great New Wilderness Debate. Athens: University of Georgia Press. 1998. McKibben, Bill. 1990. The End of Nature. New York: Anchor Books. McKinnell, Trudy A. 1986. “Increasing Use Level and Perceived Crowding at the Apostle Islands Natonal Lakeshore: An Analysis of Change over Ten Years.” M.S. Thesis. University of Wisconsin-Madison. Muir, John. 1901. Our National Parks. In Callicott and Nelson, eds. The Great New Wilderness Debate. Athens: University of Georgia Press. 1998. 48-62. Nash, Roderick. 1982. Wilderness and the American Mind, 3rd Edition. New Haven: Yale University Press; 425 p. National Park Service. Apostle Islands: A Guide to Apostle Islands National Lakeshore, Wisconsin. Washington, D.C.: U.S. Department of the Interior. Olson, Sigurd. 1938. “Why Wilderness?” In Callicott and Nelson, eds. The Great New Wilderness Debate. Athens: University of Georgia Press. 1998. Outdoor Recreation Resources Review Commission. 1962a. “Outdoor Recreation for America: A Report to the President and to the Congress by the ORRRC.” Washington D.C., 246 pp.

74
Outdoor Recreation Resources Review Commision. 1962b. Wilderness and Recreation – A Report on Resources, Values, and Problems. ORRRC Studey Report No. 3, Univ. Calif. Wildland Resource Center, 352 pp. Pyne, Stephen J. 1982. Fire in America: A Cultural History of Wildland and Rural Fire. Princeton, N.J.: Princeton University Press. Schreyer, Richard and Nielson, Martin L. 1978. “Westwater and Desolation Canyons: Whitewater River Recreation Study.” Logan, UT: Utah State Uiniversity, Department of Forestry and Outdoor Recreation, Institute for the Study of Recreation; 196 p. Scott, John C. 1999. Campsite Management Plan: Apostle Islands National Lakeshore. Approved by Alford J. Banta, Superintendent, Apostle Islands National Lakeshore.
Sessions, George. 1997. “Reinventing Nature? The End of Wilderness? A Response to William Cronon’s Uncommon Ground.” Wild Earth, Winter 1996/97, 46-52. Soule, Michael and Gary Lease. 1995. Reinventing Nature? Responses to Postmodern Deconstructionism
. Washington, D.C.: Island Press.
Soule, Michael and Reed Noss. 1998. “Complementary Goals for Continental Conservation.” Wild Earth, Fall 1998, 19-27. Stankey, George H. 1973. “Visitor Perception of Wilderness Recreation Carrying Capacity.” Research Paper INT-142. Ogden, UT: USDA Forest Service, Intermountain Forest and Range Experiment Station; 61 p. Stankey, George H. and Lucas, Robert C. 1984. “The Role of Environmental Perception in Wilderness Management.” Unpublished Manuscript, Wilderness Management Research Unit, USDA Forest Service, Missoula MT; 21 p. Stankey, George H. and Schreyer, Richard. 1986. “Attitudes Toward Wilderness and Factors Affecting Visitor Behavior: A State-of-Knowledge Review.” In Proceeding – National Wilderness Research Conference: Issues, State-of-Knowledge, Futre Directions. Fort Collins, CO, July 23-26, 1985. Compiled by Lucas, Robert C., Intermountain Research Station, USDA Forest Service. Taves, Marvin, William Hathaway, and Gordon Bultena. 1960. “Canoe Country Vacationers.” Minn. Agr. Exp. Sta. Misc. Rep. 39, 28 pp. Tuan, Y-Fu. 1974. Topophilia: A Study of Environmental Perception, Attitudes, and Values. New Jersey: Prentice-Hall; 260 p.

75
Twining, Charles. 1983. “The Apostle Islands and the Lumbering Frontier.” The State Historical Society of Wisconsin. Vaske, Jerry J., Maureen P. Donnely, and Thomas A. Heberlein. 1980. “Perceptions of Crowding and Resource Quality by Early and More Recent Visitors.” Leisure Sciences 3(4): 367-381. Waller, Donald M. 1998. “Getting Back to the Right Nature: A Reply to Cronon’s ‘The Trouble with Wilderness.’” In Callicott and Nelson, eds. The Great New Wilderness Debate. Athens: University of Georgia Press. 1998. 540-567. Watson, Alan E.; Cole, David N. and Roggenbuck, Joseph W. 1995. “Trends in Wilderness Recreation Use Characteristics.” In Proceedings of the Fourth International Outdoor Recreation and Tourism Trends Symposium and the 1995 National Recreation Resources Planning Conference. May 14-17, 1995, St. Paul, MN. Compiled by J.L. Thompson, D.W. Lime, B. Gartner, and W.M. Sames. University of Minnesota, College of Natural Resources and Minnesota Extension Service. Watson, Alan E.; Hendee, John C. and Azglauer, Hans P. 1996. “Human Values and Codes of Behavior: Changes in Oregon’s Eagle Cap Wilderness Visitors and their Attitudes.” Natural Areas Journal 16 (2): 89-93. Wiland, Laurence. 1998. “Wild Islands: Wilderness in the Apostles. Horizons: Sigurd Olson Environmental Institute, Fall/Winter 1998-99: 1-2, 19. Woods, Mark. 1998. “Federal Wilderness Preservation in the United States: The Preservation of Wilderness?” In Callicott and Nelson, eds. The Great New Wilderness Debate. Athens: University of Georgia Press. 1998. Worster, Donald. 1990. “Seeing Beyond Culture.” The Journal of American History 76 (4), March 1990, 1142-1147. Worster, Donald. 1997. “The Wilderness of History.” Wild Earth, Fall 1997, 9-13. Yankelovich, Skelly & White Inc. 1978. Research on Public Attitudes Toward the Use of
Wilderness Lands. New York; 127 p.
Young, Robert A. 1980. “The Relationship between Information Levels and Environmental Approval: The Wilderness Issue.” Journal of Environmental Education, 11(3): 25-30.

76
Appendix A
Apostle Islands National Lakeshore Operational Budget 1972-1998
Year Operational Budget 1972 $ 68,000.00 1973 $ 234,400.00 1974 $ 234,400.00 1975 $ 211,200.00 1976 $ 362,610.00 1977 $ 513,334.00 1978 $ 531,200.00 1979 $ 667,300.00 1980 $ 710,900.00 1981 $ 680,700.00 1982 $ 742,400.00 1983 $ 808,327.00 1984 $ 866,100.00 1985 $ 1,163,800.00 1986 $ 1,060,600.00 1987 --* 1988 -- 1989 -- 1990 $ 1,165,900.00 1991 -- 1992 $ 1,405,600.00 1993 $ 1,428,300.00 1994 $ 1,595,800.00 1995 $ 1,683,000.00 1996 -- 1997 $ 1,677,800.00 1998 $ 1,919,660.00
*Data not available in 1987-1989, 1991, and 1996.

77
Appendix B
Age Distribution of Apostle Islands Boaters in 1975, 1985, and 1997
Life Stage by Year
< 29 Years Old 30 to 39 Years old 40 to 49 Years old50 to 59 Years old 60 or more
31.5%29.8%
12.8%
30.1%
39.5%
22.1%20.1%
17%
30.7%
13.4%
10.1%
20.6%
4.9%3.6%
13.9%
1975 1985 19970%
5%
10%
15%
20%
25%
30%
35%
40%

78