changing landscape of higher education in india
TRANSCRIPT


Changing Landscape of Higher Education in India: The Case of Engineering Education in Tamil Nadu
P. Geetha Rani°
Abstract
The self financing institutions of higher technical education in Tamil Nadu exploit the circumstances and emerge as something similar to the for-profit higher education in the United States wherein students and families buy higher education services. The private institutions have grown sporadically within a very short span covering more than 90 percent of the total engineering and management colleges in the state. Given this dominant share of private self-financing institutions in higher education with a focus on technical education, the paper attempts to look at the growth of such institutions over a period of time from 1985-86 to 2008-09. The changing nature of higher and technical education is much more nuanced and cumulative across time but also multi-woven in terms of policy paradigms at global, macro economic, sector specific and sub-sector level. The present paper makes an attempt to look at these changing dynamics of higher education, using engineering education in Tamil Nadu as a case of reference. The paper attempts to marshal the emerging salient characteristics of private higher education focusing on technical education in the state. While doing so, it brings out the major issues of the private colleges in the state. Later, it discusses the policy responses to the changes in the higher technical education in the state.
°Associate Professor, National University of Educational Planning and Administration, 17-B, Sri Aurobindo Marg, New Delhi 110 016. The author would like to thank Prof. A. Vaidyanathan, Prof V.K. Natraj and Prof. Ramakrishnan for the critical discussions and for the encouragement which hleped in improving the paper immensely. The author also wants to thank the anonymous referee of the NUEPA Occasional Paper series.
1

Changing Landscape of Higher Education in India: The Case of Tamil Nadu
P. Geetha Rani
Introduction Knowledge is the key resource for global competitiveness. The processes of liberalization,
privatization and globalization (LPG), along with technological revolution have further
strengthened the significance of a knowledge-based society. Globalization and education are
mutually supportive. It is a two way process, as globalization presupposes competitiveness
and efficiency in the system and efficiency, in turn, is achieved upon the latest technology or
knowledge accessible to the system. The entire process of globalization is technology-driven
and knowledge-driven. In order to realize India’s aspirations to become a Knowledge
Superpower by 2010 and a Developed Nation by 2020, the country requires highly
specialized human capital to create, share, use and manage knowledge. It presents both an
opportunity – demographic dividend of its youth, especially in the 18-25 age group and the
challenge of channelising them through the present confusing to chaotic situation of higher
education in India.
Higher education in India and the educationally advanced state of Tamil Nadu needs
to be viewed in this fast changing global context. Indeed, the Government of Tamil Nadu
devotes special attention to strengthen the higher education system in the state and to respond
to the emerging demands of the new century (GoTN, 2006a). The Government of Tamil
Nadu is committed to a range of objectives, including economic growth, distributional goals,
social inclusion, etc. Higher education is directly relevant to all these, besides the pursuit of
knowledge for its own sake. For higher education, these imply that in order to support
growth, the sector needs to be large enough, of high quality, and responsive to a rapidly-
changing environment. In addition, to support distributional objectives, the needs of the
weaker sections of the society including women, rural population, socially and economically
backward communities are to be taken care of (GoTN, 2006a).
Achieving the objective of growth with equal access requires not only the full
responsibility of the ‘state’ but also huge investments on the education sector, especially on
2

higher education. In an era of declining government finances for higher education, private
sector plays a dominant role, especially in professional higher education in India and Tamil
Nadu in particular. In this light, the paper concentrates on the rapid growth of private sector
in higher education, which led to the changing landscape of higher education in Tamil Nadu.
The changing nature of higher education is much more nuanced and cumulative not only
across time period but also multi-woven in terms of policy paradigms at the global, macro
economic, sector specific and sub-sector levels. The present chapter makes an attempt to look
at these changing dynamics, using Tamil Nadu as a case of reference. The plan of the
chapter is outlined in four sections. The first section deals with the growth of the higher
education system in Tamil Nadu. The second section presents the trends across the structure
and institutional types of higher education. Section III attempts to marshal the emerging
salient characteristics of private sector higher education with a focus on engineering
education in the state. The final section brings out the concluding remarks.
I. Growth of Higher Education:
The system of higher education in India is one of the largest in the world. The system of
education in India inherited a poor educational infrastructure from the colonial masters. The
colonial policy focused neither on mass education nor on higher education. As a
consequence, the country had to begin from scratch soon after its Independence. In order to
meet the requirements of professional and technical manpower in a developing economy, the
government set up the Indian Institutes of Technology, regional engineering colleges,
medical colleges, arts and science colleges and universities. However, to begin with, there
were only 20 universities and 500 colleges at the time of Independence. In 1990-91, there
were only 179 university level and research institutions which grew to 511 in 2006-07.
During the same period, the colleges grew from 4,152 to 19,812 in the country (see Table 1).
The growth of the colleges during this period was high at 7.16 percent per annum compared
to 4.58 percent at the university level. Tamil Nadu, the second industrialized state after
Maharashtra, has registered a higher growth rate both at university level and also at college
level than at the national level (see Table 1).
3

Table 1 Growth of Higher Educational Institutions and Enrolment in India and Tamil Nadu
India Tamil Nadu Univs& R. instns
Colleges HEIs Enrolment* Univs & R. instns
Colleges HEIs Enrolment*
1980-81 179 4152 4358 2.76 8 382 390 0.19 1985-86 198 5232 5043 3.83 8 395 403 0.21 1990-91 233 6627 6289 5.03 16 608 624 0.24 1995-96 290 9033 8247 6.38 20 716 736 0.36 2000-01 331 11304 10515 10.00 23 986 1009 0.42 2001-02 351 14232 11497 9.74 26 989 1015 0.59 2002-03 385 14913 12161 10.01 28 1558 1586 0.56 2003-04 389 15274 10716 10.23 28 1530 1558 0.61 2004-05 443 16009 16452 11.77 42 1642 1684 0.81 2005-06 490 19495 20769 14.32 36 1436 1645 1.32 2006-07 511 19812 21108 15.55 38 1530 1759 1.59 Gth. Rates 4.58 7.16 7.23 7.44 5.47 7.24 7.64 11.34
Note: * enrolment in millions; Growth rates (in %) are estimated by fitting a semi log liner trend regressions from 1990-91 to 2003-04. Source: Selected Educational Statistics, various issues
A similar trend can also be found at the growth of enrolment that it has been 7.44
percent per annum at the all India level, while it was 11.34 percent in Tamil Nadu. However,
the bulk of higher education enrolment around half of the enrolled students are in general arts
and science colleges with another 18 percent in engineering and 13 percent in medical
courses (Chart 1). It is important to note this lower distribution compared to the general arts
and science colleges as most “private investment” in higher education is concentrated in
engineering, medicine and management.
Chart: 1 Distribution of Higher Educational Institutions by Discipline in 2006-07 in Tamil Nadu
Medical13%
Poly tech15%
Engg colleges18%
Teacher trng colleges
10%
Arts & science Collges 44%
Source: Same as Table 1
4

In recent years, women’s enrollment has been in higher proportion in higher
education institutions. During 2006-07, about 42 percent of the student strength of the State
was women, which was only 37 percent during 1990-91. It is also a policy of the State to
promote the participation of women at all levels of higher education, especially the levels
that require special talents, knowledge and skill. The annual growth rates of female students
enrolment is 10 percent and while the growth rate of male students is around 6 percent during
the period between 1990-91 and 2006-07 (see Table 2).
Table 2 Enrolment in Higher Educational Institutions by Gender in Tamil Nadu (in 000s)
Boys Girls All % of Girls in Total 1990-91 149.91 90.04 239.95 37.5 1995-96 202.85 153.87 356.71 43.1 2000-01 215.43 203.84 419.27 48.6 2001-02 326.60 266.14 592.74 44.9 2002-03 302.63 255.87 558.50 45.8 2003-04 321.60 291.57 613.18 47.6 2004-05 283.51 260.19 543.70 47.9 2005-06 769.68 554.68 1324.36 41.9 2006-07 916.53 671.00 1587.53 42.3
GR 6.01 9.85 7.60 Source: same as Table 1
This increase in girls’ enrolment could be on account of the realization of the
significance of girl’s education and the expanding labour market opportunities for girls. The
Government of Tamil Nadu is also considering providing special incentives to women
students who wish to pursue doctoral studies (GoTN, 2006a). Despite this growth of
institutions and enrolment in higher education in India, the enrolment ratio1 in higher
education was only 12.39 percent in India and 20.12 percent in Tamil Nadu during 2006-07.
However, the gross enrolment ratio in higher education in Tamil Nadu is higher than the
national average but only behind states like Maharashtra and Himachal Pradesh (see Table
3). The enrolment ratio of girls is much lower than boys at the national level as well as across
states. It is important to note that the age group entering higher education in countries like the
U.S.A and Canada is above 80 percent. It is above 50 percent in majority of the developed
countries. If India aspires to become a developed nation by 2020, the threshold level of the
1 Students between the ages of 17 and 24
5

age group entering higher education must at least be 25 percent. Neither India nor Tamil
Nadu is near this threshold level.
Table 3 GER in higher Education* in Selected States in India during 2001-02 and 2006-07
2001-02 2006-07 States Boys Girls All Boys Girls Total
Mahrashtra 14.0 9.7 12.0 16.58 12.52 14.74Himachal 13.7 10.0 11.8 15.55 16.33 15.93Tamil Nadu 12.4 8.9 10.7 23.39 16.89 20.12Haryana 11.5 9.2 10.5 13.05 12.56 12.84Karnataka 11.2 7.5 9.4 17.78 12.96 15.47Gujarat 9.8 8.1 9.0 9.53 7.76 8.70Andhra 10.3 6.4 8.4 19.15 12.09 15.64Punjab 7.5 9.4 8.4 13.03 12.69 12.87Orissa 10.8 5.7 8.3 15.94 3.96 10.00India 9.3 6.7 8.1 14.53 10.02 12.39
Note: * includes polytechnics Source: Selected Educational Statistics, 2001-02; 2006-07
In order to attain this threshold levels of gross enrolment ratio in higher education,
there need to be a concomitant qualitative expansion not only in higher education but also in
school education. But what is happening is a sheer quantitative expansion of private unaided
sector. The policy changes paved the way for expanding self-financing or the private unaided
sector. Further, state funding was highly inadequate with just 3.5 percent of its GDP invested
on education. With the combined forces of macro economic reform polices, LPG and the rise
in social demand, the private sector and also the ‘private’ aspect of higher education has been
growing. To what extent, the private unaided sector has grown in Tamil Nadu since 1990s is
examined in the following section.
II. Management Structure and Institutional Type
The structure of higher education in India and in many states including Tamil Nadu consists
of universities, research institutions, deemed to be universities which are at the highest level
of higher educational institutions. At the next level, it is the colleges by disciplines such as
general arts and science, professional including engineering, management, medical,
agriculture and law colleges. These structures and distribution of higher education in Tamil
Nadu is presented row wise for the year 2006-07 in Table 4. There are 35 university level
6

institutions comprising general higher education universities, technical universities,
agricultural, law and medical universities during 2006-07(see column 5 of Table 4).
Table 4 Structure of Higher Educational Institutions by Type of Management in
Tamil Nadu in 2006-07 Institutions Govt.
(in %) Pvt. Aided
(in %) Self-fing.
(in %) Total (in numbers)
% of Institution type in total Institutions
(2) (3) (4) (5) (6) Univs. including DU. 57.1 11.4 31.4 35 2.48 Arts and Science colleges 12.2 27.1 60.6 490 34.78 Engineering Colleges 4.0 1.2 94.8 248 17.60 Polytechnics 10.3 18.2 71.5 214 15.19 Medical colleges 60.0 0.0 40.0 25 1.77 Ayurveda colleges 0.0 40.0 60.0 5 0.35 Dental colleges 5.9 0.0 94.1 17 1.21 Homoeopathy 10.0 0.0 90.0 10 0.71 Law colleges 72.7 0.0 27.3 11 0.78 Management* 8.2 1.4 90.4 146 10.36 Agriculture Colleges 72.7 27.3 0.0 11 0.78 Colleges of Education 4.4 8.8 86.9 160 11.36 Colleges of Physical edn 0.0 37.5 62.5 8 0.57 Others** 6.9 41.4 51.7 29 2.06 All 11.8 15.3 73.0 1409 100.00 Note: PA – private aided; DU – Deemed Universities; * Management institutes are part of the existing institutions except 44 additional individual business schools (includes hotel mgt) (see Saravanan, 2007); ** others include Source: www.ugc.nic.in; based on Government of Tamil Nadu (2007a); Statistical Handbook of Tamil Nadu, 2006.
A large number (490) of general higher education colleges namely arts and science
colleges exist which are affiliated to universities that are under the overall purview of the
University Grants Commission (UGC). These general colleges occupy the highest share of
35 percent (see column 6 of Table 4) of all higher educational institutions2. The professional
colleges include engineering, medical, pharmacy, agriculture, law, management (constitute
another 35 percent) and a few others like colleges of education, etc. The professional colleges
fall under the purview of various bodies - engineering, pharmacy and management colleges
and computer application programmes are to get the approval of AICTE, medical colleges
the Medical Council of India and Law colleges - the Bar Council of India. There is an
overlap of various regulatory bodies in higher and professional education.
2 Even though UGC is the regulatory body of all such colleges in the country at the federal level, the state governments equally play a vital role at the policy level.
7

For instance, the management and computer application courses attached to general
arts and science colleges, which fall under the purview of UGC, need to get the approval of
the AICTE also. As noted by Singh (2004) and a few others, the Centre has set up more than
twelve professional councils. Each one of them has specific powers relating to the area with
which it is concerned. Each one of them has a specific role to play and it is for the Ministry
of Human Resource Development to deal with how they coordinate their functioning with
one another.
Yet another dimension presented vertically in Table 4 is the institutional type by
management. The educational institutions in India and in states are of three basic types based
on funding and provision: (i) government provision and financing of higher educational
institutions; (ii) private provision and government financing referred as private aided
institutions and (iii) private provision and financing referred to as self-financing institutions.
Internationally, three most prominent types, such as culturally pluralistic type, consisting of
religious, charity, and philanthropy – termed as the fused private-public entities. These are
somewhat similar to the private aided sector in many states in India. This type of
management reflects simultaneous dominance of private aided institutions in Tamil Nadu
during 1970s until middle of 1980s. The third type is the self-financing institutions which are
in the nature of non-elite but demand absorbers. Their growth is accelerated in recent decades
especially since 1990s primarily because of the excess of demand over supply (Geiger, 2004:
Levy, 2006).
The self financing institutions in Tamil Nadu exploit the circumstances and emerge as
something similar to the for-profit higher education in the United States wherein students and
families buy higher education services in the market place (Morey, 2004; Kinser and Levy,
2007). It has developed sporadically within a very short span covering more than 90 percent
of the total engineering and management colleges in the state (see column 4 of Table 4).
Even among the general arts and science colleges 60 percent are self-financing. Among the
higher educational institutions, about three fourth are self-financing type of institutions.
Given this dominant share of private self financing institutions in higher education, the
8

following section attempts to look at the growth of such institutions over a period of time that
is from 1990-91 to 2006-07.
II. (a) Pattern of Growth: The Trend
This section examines the pattern of growth of higher education under various levels from
university level institutions to colleges by disciplines in the state.
Universities
University level institutions comprise Institutions of National Importance; State Universities;
Deemed to be Universities with government funds, Deemed Universities without government
funds or self-financing or private universities. Two institutions of national importance, Indian
Institute of Technology and Dakshina Bharti Hindi Prachar Sabha, both funded by the
Ministry of Human Resource Development (MHRD), and another two deemed universities
getting UGC funds are located in Tamil Nadu. Higher education is in the concurrent list with
the Centre having an important role. But, the federal commitment to higher education as
institutions of importance and deemed universities remained stagnant since 1990-91 or much
earlier since 1959 in the case of IIT, and 1964 with regard to Dakshina Bharti Hindi Prachar
Sabha. Among 18 state universities only 12 get plan funds or development assistance from
the UGC (see Table 5).
Table 5 Growth of University Level Institutions by Funding Type in Tamil Nadu
Type 1990-91 1995-96 2000-01 2006-07 Funding Source Institutions of National Importance 2 2 2 2 MHRD State Universities 13 14 16 18 State govt/UGC DUs with govt funds 2 2 2 2 State govt/ UGC DUs (self financing) 7 10 10 13 Self-financing All 24 28 30 35 Source: Based on UGC Annual Reports, various issues and www.ugc.nic.in downloaded as on 17.05.2007 The state universities are primarily funded by the state government and they get a
meager share of plan assistance from the UGC. It is to be noted that the new state
universities established since 1990-91 do not get any central assistance. Unfortunately, no
central university exists in the state for a full funding of plan and non-plan assistance by the
9

UGC. Centre allocation to states for higher education take place via MHRD and UGC3. The
share of UGC funds in total higher education expenditure in the state was as low as from 7.5
percent to around 12.5 percent in the last one and a half decade(see Chart 2).
Chart 2 Share of Expenditure on General Higher Education by Government of Tamil Nadu
and University Grants Commission
9 8 11 8 9 11 9 13
91 92 89 93 91 89 91 87
0%
20%
40%
60%
80%
100%19
90-9
1
1995
-96
1997
-98
1999
-00
2000
-01
2001
-02
2002
-03
2003
-04
UGC Funds TN State govt
Source: Based on Analysis of Budgetary Expenditure on Education and UGC Annual Reports various issues.
It has also been a policy of shifting greater responsibility for funding and managing
public higher education from federal to state governments; state government to private
sector.
None of the 13 deemed universities in the state in 2006-07 got the UGC plan funds.
The number of deemed universities almost doubled in the state from 2003 to 2006-07. Under
section 3 of the UGC Act, 2003, deemed universities are required to possess viability and a
management capable of contributing to university ideas and traditions. Under this scheme, a
number of private institutions have been granted the status of a deemed university. In
addition, the AICTE had also given deemed university status to many private engineering
colleges. It is to be noted that the expansion is predominantly under self-financing
universities. Private institutions that initially specialized in one academic field expanded into
3 The information on total central government transfers to higher education by states is not readily available. From UGC annual reports, one can cull out information from the fund allocation to state universities and colleges in Tamil Nadu. However, similar information is not available from MHRD annual reports.
10

other revenue generating disciplines and virtually became self-financing universities. As a
result, some of the engineering and also medical colleges in the State have metamorphosed
into deemed universities. These were small institutions that were clearly demand-absorbing
and transformed into a university by the policy changes. Such policy changes seem to have
been happening elsewhere. For instance, a similar policy change in UK made all polytechnics
to become degree awarding universities in 1992 (Shottock, 2001).
Arts and Science Colleges
Against the general belief that de facto private sector expansion takes place in the
professional education (Kapur and Mehta, 2004), the share of private arts and science
colleges is about two third of (61 percent) of the total arts and science colleges in Tamil
Nadu (see Table 7). Opening of self-financing general arts and science colleges started in the
state in 1994-95 (GoTN, 2003). The annual growth rate of private unaided or the self
financing colleges is rapid at the rate of 20 percent during the period from 1990-91 to 2004-
05. Share of government and private aided colleges during 1990-91 was 86 percent which
drastically came down to 43 percent during 2004-05. The self-financing colleges started to
occupy more than 50 percent share since 2000-01(see table 6).
Table 6 Growth of Arts and Science Colleges and Enrolment therein in General Higher
Education by Type of Management in Tamil Nadu (in %) Institutions Enrolment
Govt PA PUA Total* Govt PA PUA Total* 1990-91^ 25 61 13 215 27.2 69.1 3.7 207042 1995-96 21 47 32 280 26.7 63.0 10.3 317213 2000-01 14 31 55 426 21.7 54.2 24.1 410508 2001-02 14 30 56 440 21.4 54.0 24.5 421012 2002-03 14 30 56 440 21.0 54.2 24.9 436642 2003-04 14 30 56 441 21.1 53.6 25.3 461026 2004-05 13 30 57 444 19.2 51.5 29.3 513222 Growth Rate** 1.0 0.1 20.4 7.1 2.3 3.9 15.8 6.0
Note: * total in numbers; ^ prior to 1990-91 there is no separate information available between private aided and unaided colleges; ** Growth rate is estimated by fitting a semi log linear trend regression.
Source: Statistical Hand book of Tamil Nadu, Chennai
Even though the number and proportion of self financing or the private unaided colleges
have been outgrowing government and private-aided institutions, more than 70 percent of the
students are enrolled in government and private aided colleges even in 2004-05. And also the
11

extent of cost recovery is severe in the professional self-financing colleges than in general
arts and science colleges. The extent of cost recovery further varies within these colleges and
across courses. For instance, arts and science colleges are not self-financing except for job
oriented courses, like BBM, MBA, Bio-technology, and the like.
Engineering Colleges The growth of private engineering education has been spectacular in a few southern states
such as Andhra Pradesh, Tamil Nadu and Karnataka along with Maharashtra, reflecting the
global trend. Indeed, the engineering discipline in these states is de facto under the private
sector with provision for almost full recovery of costs. The fast growth in the private sector is
on account of the fact that during the Sixth Five Year Plan (1980-85), when the central and
state governments were finding it difficult to expand technical education in the country, a
few state governments, especially the governments of Karnataka, Maharashtra, Tamil Nadu
and Andhra Pradesh took a bold decision to permit private registered societies and trusts to
establish and run technical institutions on a self-financing basis. These are institutions of a
new generation unlike the previous set of private institutions started under the charity
motives. As a result, a large number of private self-financing institutions came into existence
in the above four states in the early 1980s itself (AICTE, 1999).
All these institutions were established with the permission of the respective state
governments and were affiliated to the universities of the region with the approval from both
the State Boards of Technical Education and AICTE. The expansion in engineering
education in Tamil Nadu, has been only in the private sector from the middle of 1990s. Even
though private initiatives in education is an old phenomenon in the state with the initiatives
of Christian missions and Nattukottai Chettiar community, but in the 1980s, it was the turn of
politicians, industrialists and other individuals. This trend led the self-financing colleges to
occupy a share of three fourth of the total engineering colleges in the state. Eventually,
private sector exhibits almost full presence in engineering education in Tamil Nadu in 2008-
09 (see Chart 3).
12

Chart 3 Growth of Engineering Colleges by Management Type in Tamil Nadu
0
50
100
150
200
250
300
1985
-86
1987
-88
1989
-90
1991
-92
1993
-94
1994
-95
1995
-96
1996
-97
1997
-98
1998
-99
1999
-00
2000
-01
2001
-02
2002
-03
2003
-04
2004
-05
2006
-07*
2007
-08
2008
-09
Govt Govt aided Self -f inancing Inst itut ions Total
Source: Statistical Hand book of Tamil Nadu, Chennai
This unfettered trend grew to occupy more than 95 percent of the total engineering
colleges during 2008-09. The self-financing colleges grew at an annual rate of 18.14 percent
during the period from 1993-94 to 2008-09. It is the private sector that is providing
engineering education in the state. Tamil Nadu, with about 249 private engineering colleges,
has the second largest number of engineering colleges in the country. The Government and
private aided colleges are a mere 13 in number and constitute five percent of the total
engineering colleges. Even though there is no evidence, government colleges have
significantly better facilities and quality of education than the self-financing engineering
colleges4. Almost a similar rapid growth has been observed in the management disciplines as
well.
Management Colleges Management Education in colleges affiliated to universities started at Calcutta in 1954,
quickly followed by Universities of Bombay, Delhi and Madras. In order to meet the growing
demand for management education, the AICTE permitted from 1993-94 a large number of
MBA and Post Graduate Diploma in Business Management programmes on self-financing
4 However, all government and aided engineering colleges offer courses that are accredited by National Board of Accreditation (www.nba.org).
13

basis. Tamil Nadu was again in the race along with Maharashtra and Andhra Pradesh, these
three states alone accounted for nearly 60 percent of the full-time seats. The private societies
and trusts in these states had the experience of establishing and managing diploma and
degree level engineering colleges and, therefore, were quick in taking the lead in the sector of
self-financing management education (AICTE, 1999). The management educational
institutions first began to appear in 1987-88 in Tamil Nadu and grew many fold between
1994 and1999 and then the growth gradually stagnated. Among the 146 institutions in 2005-
06, ninety one percent of them are self-financing institutions and do not get any grant from
state or Central government (see Table 7).
Table 7 Management Educational Institutions by Type of Management in Tamil Nadu
1990s Since 2001 1990s Since 2001 Management Type (in numbers) (in per cent)
Govt (state colleges, univ depts.. DU, Central govt) 4
8
3.9
5.4
Private aided 1 2 1.0 1.4 PUA (including private DUs) 98 138 95.1 93.2 Total 103 148 100 100
Source: based on www.aicte.nic.in downloaded as on 20.5.2007
Almost a similar trend could be observed in medical and para medical education as well.
Medical Colleges
A total of 243 Medical and Para-Medical institutions including siddha, homeopathy, unani,
ayurveda, dental, pharmacy, nursing, physiotherapy and others institutions existed in Tamil
Nadu in 2006-07. Both government and private unaided institutions are affiliated to the
Tamil Nadu MGR Medical University. Government medical and para medical colleges in the
state occupy 11 percent, while medical colleges owned and run by private unaided
managements share 88 percent (see Table 8). Out of these 243 institutions, 91 institutions
offer post graduate/diploma courses. Of these 91 post graduate institutions, the majority that
is 82 percent are in the private sector. Almost all the para medical courses such as Dental,
Pharmacy, Nursing Physiotherapy, and Occupational Therapy are with the private sector
(www.tnmgr.univ.org).
14

Table 8 Medical colleges and Enrolment by Management in Tamil Nadu as on 2006-07
Colleges Enrolment Courses Govt. Private Total Govt. Private Total
Medical 66.7 33.3 21 78.6 21.4 1965Siddha 40 60 5 62.5 37.5 240Homeopathy 10 90 10 10 90 500Unani 100 0 1 100 0 26Ayurveda 0 100 5 0 100 150Dental, Pharmacy, Nursing 5.9 91.3 132 9.5 90.5 5175Physiotherapy & Others 4.3 95.7 69 2 98 2782Total 11.1 88.5 243 19.3 80.7 10072
Source: based on www.tnmgr.univ.org
The Government of Tamil Nadu plans to start three new medical colleges in the state.
Besides, it proposes to increase M.B.B.S. seats in five medical colleges. The Government has
accorded sanction for the creation of an additional 315 seats in the MBBS Course (GoTN,
2004). Despite this expansion, private sector plays a major role in allied and para medical
fields.
Agricultural Colleges
Agriculture education in Tamil Nadu has been primarily state funded. There are 11
government and two affiliated agricultural colleges (GoTN, 2007b). However, the
privatization process has already begun there as well. For instance, the Tamil Nadu
Agricultural University (TNAU) has introduced master degree and doctoral programmes on a
self-supporting basis (www.tnau.ac.in).
Law Colleges
There are five Government Law Colleges in Tamil Nadu at present that are affiliated to
Tamil Nadu Dr. Ambedkar Law University (see Table 9). Besides a few of the university
departments provide legal education at the post graduate level. There is only one private law
colleges in the state. (GoTN, 2006b). The private sector in legal education, like that of
agricultural education is limited in the state.
15

Table 9 Law Colleges having Deemed/Permanent/Temporary approval of affiliation of the Bar
Council Of India as on 1.1.2006 Name of the College Courses Imparted Establishment Year Central Law College, Salem 3 Year & 5 Year 1982 Government Law College, Thiruneveli 3 Year & 5 Year 1996 Government Law College, Thirchy 3 Year & 5 Year 1979 Government Law College, Coimbatore 3 Year & 5 Year 1979 Dr. Ambedkar Government Law College, Chennai
5 Year (B.A.B.L.) Hons. 1891
Source: website of Bar council of India, downloaded in June 2007
As the growth pattern suggests, private sector in the case of Tamil Nadu is found to
have substituted the public sector by absorbing the excess demand. It is important to note that
this period coincides with economic reforms and the policy changes at the macro economic
level and also at the micro or sub-sectoral level in higher education. This is primarily the
impact of economic reforms initiated during the beginning of 1990s. The five major
components of the new economic policy initiated in the beginning of 1990s include
Liberalization, Privatization and Globalization (LPG), currency convertibility and reduced
role of the state. These reform packages imposed a decline on the public budgets on the
education sector, more specifically on higher education. The macro economic reforms also
resulted in severe cuts on the education budget reflecting in several policy directions. Such
policy changes have paved the way to several alternatives, including self-financing courses in
government and aided colleges besides the rapid expansion of the private sector in higher
education.
From 2000 onwards, the second generation economic reforms, which percolate down
to the state level in terms of the Fiscal Responsibility and Budget Management (FRBM) Act
notified on August 2003, that aims to eliminate the revenue deficit by 2008-09. Tamil Nadu
has enacted the FRBM Act in the same year as that of the Central Act. This fiscal reform has
reflected on the public expenditure on education sector, more specifically so on higher
education. With the rapid increase in social demand for higher education and the declining
budgets have resulted in several policy directions such as the expansion of self-financing
colleges. It strongly encourages for full cost recovery (user pays principle).
16
It is clear that the institutional landscape of higher education is changing drastically.
The number and share of government colleges and universities are declining while self-
financing institutions are growing in strength, strongly tied to broader processes of LPG. An
important aspect of this LPG policy has been to allow the private sector to attract a growing
number of students who do not qualify the entrance exams to public institutions. Even though
this has not been an explicitly stated policy, but by limiting the intake of public higher
education institutions without expanding the government institutions gave a green signal to
the expansion of the private sector. Given this trend, the thrust of the rest of the paper is on
elucidating the salient characteristics which emerge from the self-financing engineering
colleges in the state and what has been the response from the regulatory authorities.
III. Emerging Characteristics and Major Issues of Self-financing Engineering Colleges in the State: This section examines two major aspects of the self-financing engineering colleges, viz.,
major characteristics and major issues relating to self-financing colleges. The characteristics
of the self financing engineering colleges are examined in terms of provision. The major
aspects covered under this include:
o number of institutions and intake by location o background of sponsors o affiliation o single and multiple discipline institutions o size and composition of faculty at different levels and qualifications and o infrastructure (extent of campus, presence of major facilities such as library, labs,
etc.)
Further, the major issues relating to self financing colleges are examined in terms of – o admission criteria and procedures o fees o quality o performance o performance evaluation and o functioning of regulatory authorities
The information used for this analysis primarily comes from the websites of the
individual institutions, besides the AICTE website and the Statistical Abstract and Policy
Notes on Higher and Technical Education in Tamil Nadu. The individual websites of 43 self-
17

financing engineering colleges (courtesy: tamilnow.com; list of colleges attached in
Appendix Table - A7) has been meticulously looked at to decipher the information on
various aspects examined here. In each of the aspects, the kind of information provided by
the colleges in their websites vary at great deal. Such variation is found despite the fact that
AICTE has stipulated to provide the mandatory disclosure of information by each of the self-
financing engineering colleges in a standard proforma.
III. 1. Salient Characteristics:
III. 1. i.(a) Number of Institutions by Location Universities in the State range from the traditional ones that offer arts and science courses to
those offering technological, law, medical, veterinary and animal science courses. But, the
private deemed universities offer courses in engineering, medicine and management. Some
of the self-financing engineering and medical colleges in the State have metamorphosed into
deemed universities since 2003. In these 13 private universities, seven exclusively cater to
professional education. Another six cater to a mix of arts and science, pharmacy, para-
medical, engineering and management subjects. Among the 13 private universities, seven
universities have been located in Chennai itself, besides Chennai having eight public
universities (see Table 10).
Table 10 Self-financing Deemed Universities by Location and by Year of Establishment
in Tamil Nadu in 2006-07 Sl.No. Name of the college Location Year of Estt.
1 Meenakshi Academy of Higher Education and Research Chennai 20042 S.R.M. Institute of Science & Technology Chennai 20023 Sathyabama Institute of Science and Technology Chennai 20014 Saveetha Institute of Medical and Technical Sciences Chennai 20055 Sri Ramachandra Medical College and Research Institute Chennai 19956 Bharath Institute of Higher Education & Research Chennai 20037 M.G.R. Educational and Research Institute Chennai 20038 Amrita Vishwa Vidyapeetham Coimbatore 20039 Karunya Institute of Technology and Sciences Coimbatore 1986
10 Sri Chandrasekharendra Saraswathi Viswa Mahavidyalaya Kancheepuram 199411 Vinayaka Mission's Research Foundation Salem 200012 Shanmugha Arts Science, Technology & Research Academy Thanjavur 200113 Vellor Institute of Technology Vellor 2001
Source: Based on www.ugc.org, other university websites, downloaded as on 14.5.2008
18

The adjacent districts of Chennai, such as Kancheepuram and Vellore house another
two private universities. Amrita Institute of Technology and Science; and Karunya Institute
of Science and Technology, all located in Coimbatore, where three government universities
already exist. Vinayaga Mission Institute of Technology in Salem district, which has a state
university and Shanmugha Arts, Science, Technology and Research Academy (SASTRA) in
Thanjavur which houses a state university.
It is important to note the nexus between public and private participation in education.
In almost all the places wherein the private university is coming forward houses either one or
many public university. On the contrary, it is also important to note no private university is
located in backward districts like Sivaganga or Ramnad. The private sector comes forward to
participate in such locations where the public sector had already invested and are
economically prosperous.
A similar trend can be observed by looking at the number of private engineering
colleges across districts in the state. In 2002-03, there were 241 private engineering colleges
situated in different parts of the State. These had increased to 255 and 261 during 2004-05
and 2006-07 respectively (see Table 11). Kancheepuram has the highest number of private
engineering colleges covering 25 percent of the total private colleges in the state (see Table
11). The number of colleges have increased from 58 in 2002-03 to 63 in 2004-05 to 64 in
2006-07. The official statistics from the Statistical Abstract do not report the private
engineering colleges in Chennai. However, the information from AICTE show that Chennai
and surrounding areas (including Kancheepuram and Thiruvallur) alone have 87 engineering
colleges (see Appendix Table - A1).
19

Table 11 Number of Self-financing and Total Engineering Institutions by Districts in
Tamil Nadu in 2002-3, 2004-05 and 2006-07 2002-03 2004-05 2006-07
District Self-Finan-
Total
Propn. PUA to total**
Self-Finan-
Total
Propn. PUA to total**
Self-Finan-
Total
Propn. PUA to total**
Kancheepuram 58 58 25.33 63 63 25.93 64 64 25.70 Thiruvallur 27 27 11.79 27 27 11.11 23 24 9.24 Coimbatore 17 20 7.42 18 21 7.41 21 24 8.43 Namakkal 10 10 4.37 10 10 4.12 14 14 5.62 Vellore 11 12 4.80 11 12 4.53 11 12 4.42 Thirunelveli 10 11 4.37 10 11 4.12 11 12 4.42 Kanniyakumari 7 7 3.06 10 10 4.12 11 11 4.42Thiruchirappalli 9 10 3.93 10 11 4.12 10 10 4.02 Erode 9 9 3.93 9 9 3.70 8 8 3.21 Virudhunagar 5 5 2.18 5 5 2.06 8 8 3.21 Pudukkottai 8 8 3.49 8 8 3.29 7 7 2.81 Villupuram 6 6 2.62 6 6 2.47 6 6 2.41 Sivagangai 5 6 2.18 5 6 2.06 6 7 2.41 Thiruvannamalai 6 6 2.62 6 6 2.47 5 5 2.01 Dindigul 5 5 2.18 5 5 2.06 5 5 2.01 Thoothukudi 4 4 1.75 4 4 1.65 5 5 2.01Other districts* 32 37 14.0 36 41 14.8 34 39 13.7Tamil Nadu 229 241 100 243 255 100 249 261 100
Note: * Districts having less than 5 self-financing colleges are not reported in the table. This districts include Thanjavur, Salem, Cuddalore, Madurai, Perambalur,Chennai, Dharmapuri, Nagapattinam, Ramanathapuram, Theni, Thiruvarur, Krishnagiri, Karur, and The Nilgiris .
** indicates proportion of private unaided colleges in a district to that of the total private unaided colleges in the state
Source: Policy Notes, Higher Education, 2003-04; 2004-05 and 2006-07.
The next highest number of private engineering colleges are located in Coimbatore
having 21 colleges covering eight percent of the total private unaided engineering colleges. It
clearly emerges that not only the private deemed universities but also the private engineering
colleges breed in and around Chennai and Coimbatore, the two business and industrial
centers in the state. On the contrary, the backward districts neither have a government or
aided nor private engineering colleges. This brings out the fact that the private sector
flourishes only in those districts which are economically prosperous and also where the
20
public investment has been made not only in the higher educational institutions but also in
the infrastructure facilities such as good roads, connectivity, airports, etc.
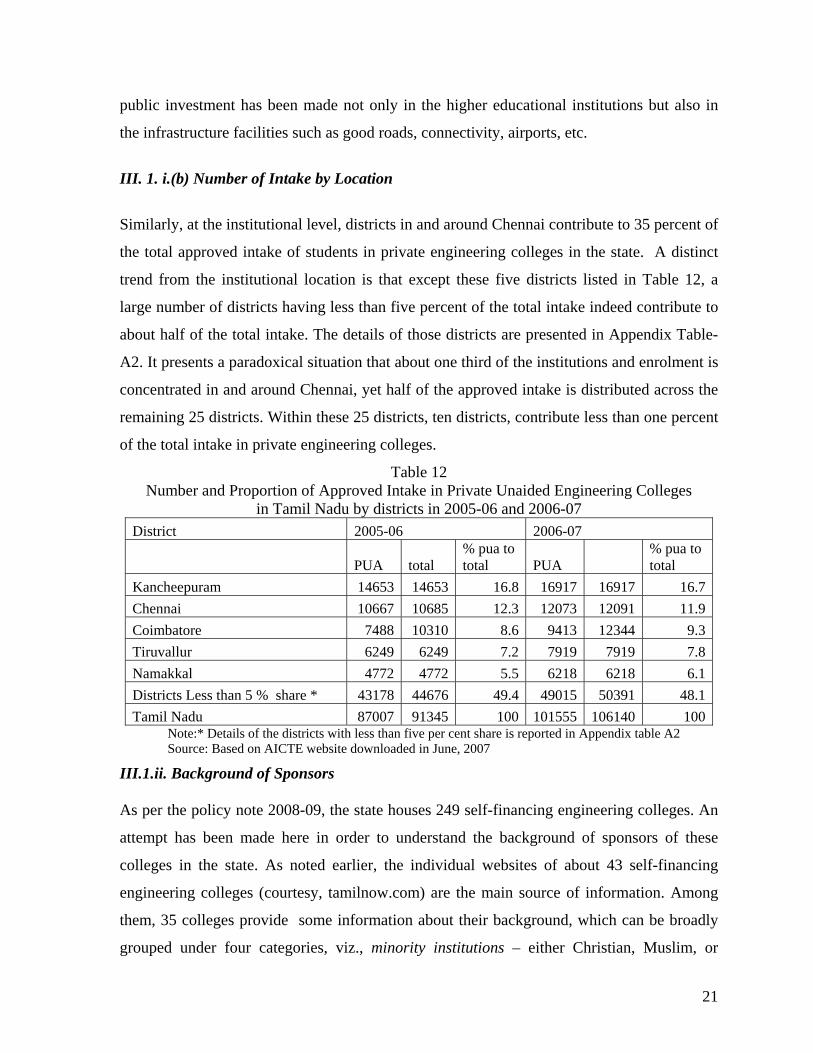
III. 1. i.(b) Number of Intake by Location
Similarly, at the institutional level, districts in and around Chennai contribute to 35 percent of
the total approved intake of students in private engineering colleges in the state. A distinct
trend from the institutional location is that except these five districts listed in Table 12, a
large number of districts having less than five percent of the total intake indeed contribute to
about half of the total intake. The details of those districts are presented in Appendix Table-
A2. It presents a paradoxical situation that about one third of the institutions and enrolment is
concentrated in and around Chennai, yet half of the approved intake is distributed across the
remaining 25 districts. Within these 25 districts, ten districts, contribute less than one percent
of the total intake in private engineering colleges.
Table 12 Number and Proportion of Approved Intake in Private Unaided Engineering Colleges
in Tamil Nadu by districts in 2005-06 and 2006-07 District 2005-06 2006-07
PUA total % pua to total PUA
% pua to total
Kancheepuram 14653 14653 16.8 16917 16917 16.7Chennai 10667 10685 12.3 12073 12091 11.9Coimbatore 7488 10310 8.6 9413 12344 9.3Tiruvallur 6249 6249 7.2 7919 7919 7.8Namakkal 4772 4772 5.5 6218 6218 6.1Districts Less than 5 % share * 43178 44676 49.4 49015 50391 48.1Tamil Nadu 87007 91345 100 101555 106140 100
Note:* Details of the districts with less than five per cent share is reported in Appendix table A2 Source: Based on AICTE website downloaded in June, 2007
III.1.ii. Background of Sponsors As per the policy note 2008-09, the state houses 249 self-financing engineering colleges. An
attempt has been made here in order to understand the background of sponsors of these
colleges in the state. As noted earlier, the individual websites of about 43 self-financing
engineering colleges (courtesy, tamilnow.com) are the main source of information. Among
them, 35 colleges provide some information about their background, which can be broadly
grouped under four categories, viz., minority institutions – either Christian, Muslim, or
21
Telugu Linguistic minority institutions; chain of institutions – having at least more than five
educational institutions under the same trust; industrial background, and others5 (see
appendix Table - A3). It is to be noted that these grouping is among the sub-sample of 34
colleges in which eight are minority institutions.
Among these eight minority colleges, three institutions own more than two
educational institutions. Besides these three colleges, another 17 colleges run a minimum of
five and above educational institutions. For instance, Arulmigu Meenakshi Amman College
of Engineering under Meenakshi University runs 23 educational institutions in the state as
per the information provided in their websites. Yet another Vel's group of institutions, which
began with the Vel's College of Pharmacy in 1992, became a group now with 11 different
colleges on three campuses in and around Chennai. They also offer a one-year Diploma in
Nautical Science, and a two-year Higher National Diploma in Nautical Science. Students of
the Higher National Diploma spent the first year at VGAMS, and the second year at Glasgow
College of Nautical Studies (GCNS), U.K. Vel's Academy of Maritime Education and
Training (VAMET) offers B.E. in Marine Engineering, a one-year Graduate Mechanical
Engineering, a two-year Diploma in Mechanical Engineering, and a Higher National
Diploma in Marine Engineering. Students of Higher National Diploma spend the first year at
VAMET and the second year at GCNS, U.K. These courses are affiliated to Vinayaka
Mission Institute of Technology, a deemed university at Salem. All the courses at VAMS and
VAMET are residential.
Another eight colleges are under the industrial category ranging from software to real
estate. In one college information regarding the political background was visible. Yet another
five colleges fall in other category wherein no specific similarity could be found among
them. All of these are single institutions run by people from different backgrounds.
5 It is indeed difficult to assign some of the colleges into a particular group for instance only minority institutions but runs more than three educational institutions. Similarly, the colleges which run many educational institutions do have industrial and political background as well. That real estate business people also run an engineering college.
22

III.1. iii. Affiliation One of the earliest technological universities to be established in the country is Anna
University. All the private engineering colleges are affiliated to Anna University. Besides,
the University has four constituent colleges. Also affiliated to it are five government-run
engineering colleges and three government-aided ones. Almost all the self-financing colleges
in the state are affiliated to public universities or part of the private universities. Prior to
2001, the private engineering colleges were affiliated to Madras University. But with the
policy change since 2001, all the private engineering colleges in the state are now affiliated
to Anna University as there is only one state technical university in the state besides a
number of mushrooming private engineering or multi-disciplinary universities.
III.1. iv. Single and Multiple Discipline Institutions The market forces have become very active and apparent within the private engineering
colleges. In the total number of 249 self-financing engineering colleges in the state, 23
percent of them provide an MBA course which is multi-disciplinary. Similarly another 13
percent of private colleges provide MCA. About nine percent of the total private engineering
colleges offer both the courses (see Chart 4).
Chart 4
Percentage of Self-Financing Engineering Colleges offering MBA and MCA among Total Self-financing Colleges in Tamil Nadu
22.67
12.96
8.91
0
5
10
15
20
25
MBA MCA Both
Source: based on AICTE website, downloaded in June 2007
23

It may be found that the single discipline engineering colleges transform into a
multiple discipline institutions by adding management and applied courses like MCA
(Master of Computer Applications) which are again market oriented.
Looking at 146 management institutions in the state only 41 (28 percent) are single
discipline institutions in Tamil Nadu. The remaining 72 percent of the institutions are part of
the already existing engineering colleges. This comprises 32 percent of government (which
are few in number) and private unaided colleges. Another 26 percent of the institutions are
under the category of private arts and science colleges. That denotes the extent of private
sector participation in the existing self-financing institutions. Government arts and science
colleges, university departments constitute another seven percent of the management
institutions. This indicates the privatization of already very few public colleges and
universities (see Chart 5 ).
Chart 5 Type of Management Institutions in Tamil Nadu in 2005-06
Pvt Engg. CollegeDepts32%
Individualbusiness schools
28%
.Univ. depts5%
Pvt arts andscience
26%
& Govt. artsscience
2%
DU6%
Central govtinststs
1%
Source: Based on Saravanan (2007)
III.1. v. Size and Composition of Faculty at Different Levels and Qualifications With regard to teachers in engineering colleges, there is no published information available
on the numbers and many other characteristics of teachers such as their grade and
qualifications, years of experience, salary, etc. An attempt has been made here to collect the
information on teachers in self-financing engineering colleges in Tamil Nadu. The websites
24

of 17 colleges provided information on teachers by grade or designation and qualification.
Among these 17 colleges very few provided information on experience, age, and salary
details. The available information is based upon a total sample of 2,172 teachers teaching in
17 self-financing engineering colleges in Tamil Nadu. However, the information on teachers
by grade was available only from 1,708 and the grade wise distribution suggest that a
majority of them (67 percent) are at the lecturer level (see Chart 6). Senior lecturers
constitute another eight per cent, who are likely to be in the teaching profession. Many of
them join at the entry level as they could not find any other immediate job offers. The
assistant professors with at least more then five years of experience constitute another 15
percent. The professor level constitute a mere 10 percent who are also in many of the cases
heads of the departments.
Chart 6 Distribution of Faculty by Grade in 2007-08 in Tamil Nadu
Sr. Leturer8%
Lecturer67%
Professor10%
Asst. Prof15%
Source: based on websites of sample colleges
Technical education was facing acute shortage of qualified faculty. “In engineering
alone, the demand is for 1.20 lakh teachers, but the system today has hardly 7,000 Ph.Ds,
20,000 M.Techs and the rest fresh B.Tech degree holders. This is mainly because
engineering graduates consider teaching as the last career option. (The Telegraph, 06. Feb,
2006). Because of the rapid growth of professional education, there is an acute shortage of
experienced and qualified faculty, on account of which most of the colleges have to depend
heavily on fresh graduates and post graduates. From the data available on teachers with a
sample of 1,708 at various grades and by qualification reveal that about 50 percent of the
lectures hold PG qualification (see Table 13). Another 30 percent are with UG qualification.
25

Above the lecturer level, PG qualification becomes a pre-requisite. Senior lecturers having
PG qualification constitute above 60 percent. Another 30 per cent hold above PG level
qualifications either M.Phil. or Ph.D. It may also be noted that teachers holding M.Phil. are
primarily from non-engineering disciplines. At the assistant professor level, 57 percent of the
teachers have PG qualification and another 38 hold above PG qualification. Unlike the
middle and junior grades, at the professor level above 50 percent of the teachers have a
doctorate. It may be noted that very few colleges provided the information about the part-
time and visiting faculty. Even if reported, such part-timers are found to be very few.
Table 13 Percentage of Faculty by Grade and by Qualification in the Sample Self-financing
Engineering Colleges in Tamil Nadu Grade UG PG M.Phil. Ph.D. Total Colleges Lecturer 32.5 49.3 16.4 1.7 1143 17 Sr. Lecturer 7 62.2 17.5 13.3 143 15 Asst. Prof 5.6 56.8 20 17.6 250 17 Professor 4.7 30.2 12.8 52.3 172 17 All 23.6 49.6 16.7 10.1 1708 17
Source: based on websites of sample self-financing colleges downloaded in May-June 2008
Attracting qualified students into teaching is a challenge in itself, but retention of
good qualified teachers is a major problem. Even though there is no information available on
mobility of teachers, some trends can be deciphered based on the distribution of years of
experience of teachers by grade. Very few colleges provide information on the experience of
teachers that in the 43 colleges, only seven colleges provide the details of years of experience
for about 509 teachers that is only 30 percent of the information available on teachers by
grade (see Table 14). Major share of the lecturers (61 percent) are with less than three years
of teaching experience at the lecturer level. Another 27 percent have experience between four
to seven years of experience. But 45 percent of the senior lecturers have four to seven years
of experience. Similar picture can be observed at the assistant professor level as well. As they
move up on the grade, the years of experience is also high. At the professor level, majority of
them (above 60 percent) have more than ten years of experience. It may be noted that many
of the professors are also heads of the departments and many of them are retired professors
from other colleges.
26

Table 14 Percentage of Faculty by Grade and by Experience in the Sample Self-financing
Engineering Colleges in Tamil Nadu Grade less than 3 4 to 7 7 to 10 above 10 All No data Grand total Colleges Lecturer 61.0 27.6 9.6 1.9 323 71.7 1143 6 Sr. Leturer 26.3 44.7 18.4 10.5 38 73.4 143 5 Asst. Prof 19.2 17.9 21.8 41.0 78 68.8 250 5 Professor 5.7 20.0 10.0 64.3 70 59.3 172 7 All 44.4 26.3 12.2 17.1 509 70.2 1708 7
Source: based on websites of sample self-financing colleges downloaded in May-June 2008
Competent faculty can be retained only at higher and attractive levels of salary which
is a serious hindering factor in the private engineering colleges. With very limited salary data
available from the websites that only three colleges provide information for about 149
teachers, it can be found that the minimum salary of a lecturer is as low as Rs.3,500 which is
one fifth of the salary paid by the State at the entry level (see Table 15). The maximum salary
paid at the lecturer level is Rs. 20,000 and the average salary is Rs.9,680. Similarly, the
salary at other levels is also lower than the state pay and much lower than the pay that would
have otherwise been available in the market.
Table 15 Average Salary by grade in the Sample Self-financing
Engineering Colleges in Tamil Nadu (in Rs.) Grade Minimum Maximum Average All* No data** Grand total* Colleges* Lecturer 3500 20000 9680 131 88.5 1143 3 Sr. Leturer 14750 -- -- 1 99.3 143 1 Asst. Prof 13360 34000 19570 10 96.0 250 1 Professor 6550 33860 23286 7 95.9 172 2 all 9540 29287 17512 149 91.3 1708 3
Note: * in numbers; ** in per cent to the grand total Source: same as the above table.
III. 1.vi. Infrastructure The private institutions invested heavily on the physical infrastructure. As far as the area of
the campus is concerned, the land area ranges from 25,000 square meter to a vast 800 acre
campus (see Table 16).
27
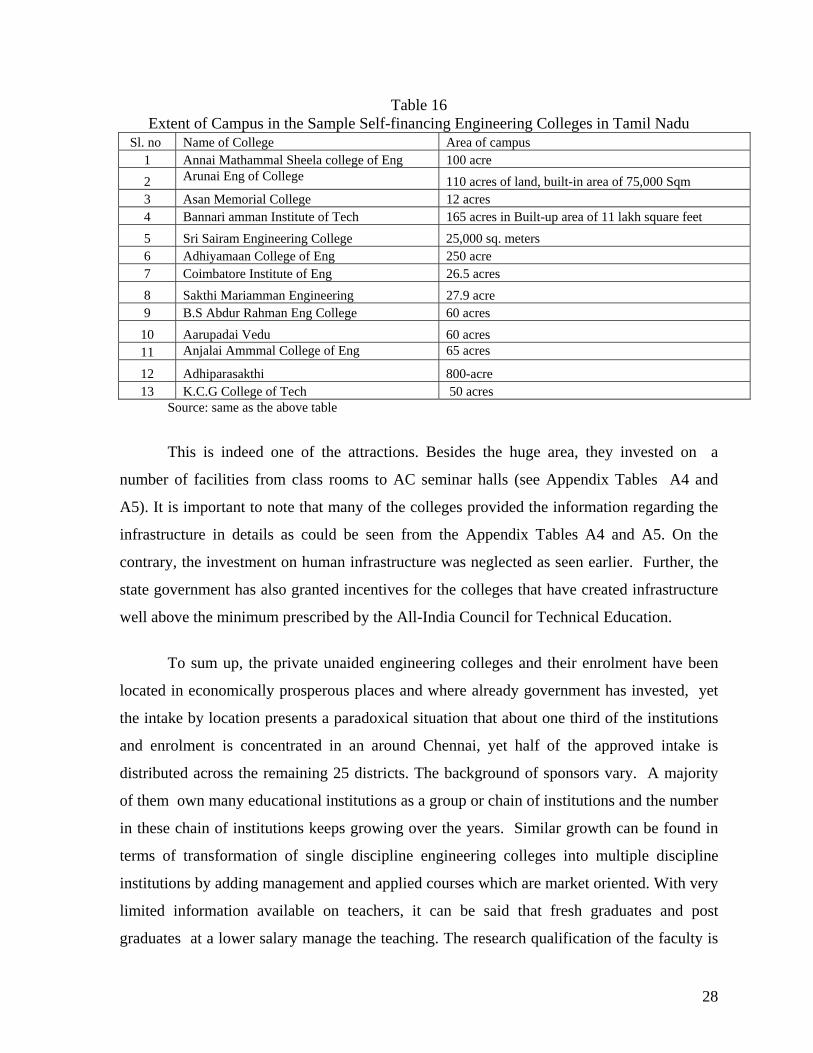
Table 16 Extent of Campus in the Sample Self-financing Engineering Colleges in Tamil Nadu
Sl. no Name of College Area of campus 1 Annai Mathammal Sheela college of Eng 100 acre 2 Arunai Eng of College 110 acres of land, built-in area of 75,000 Sqm 3 Asan Memorial College 12 acres 4 Bannari amman Institute of Tech 165 acres in Built-up area of 11 lakh square feet 5 Sri Sairam Engineering College 25,000 sq. meters 6 Adhiyamaan College of Eng 250 acre 7 Coimbatore Institute of Eng 26.5 acres 8 Sakthi Mariamman Engineering 27.9 acre 9 B.S Abdur Rahman Eng College 60 acres
10 Aarupadai Vedu 60 acres 11 Anjalai Ammmal College of Eng 65 acres
12 Adhiparasakthi 800-acre 13 K.C.G College of Tech 50 acres
Source: same as the above table
This is indeed one of the attractions. Besides the huge area, they invested on a
number of facilities from class rooms to AC seminar halls (see Appendix Tables A4 and
A5). It is important to note that many of the colleges provided the information regarding the
infrastructure in details as could be seen from the Appendix Tables A4 and A5. On the
contrary, the investment on human infrastructure was neglected as seen earlier. Further, the
state government has also granted incentives for the colleges that have created infrastructure
well above the minimum prescribed by the All-India Council for Technical Education.
To sum up, the private unaided engineering colleges and their enrolment have been
located in economically prosperous places and where already government has invested, yet
the intake by location presents a paradoxical situation that about one third of the institutions
and enrolment is concentrated in an around Chennai, yet half of the approved intake is
distributed across the remaining 25 districts. The background of sponsors vary. A majority
of them own many educational institutions as a group or chain of institutions and the number
in these chain of institutions keeps growing over the years. Similar growth can be found in
terms of transformation of single discipline engineering colleges into multiple discipline
institutions by adding management and applied courses which are market oriented. With very
limited information available on teachers, it can be said that fresh graduates and post
graduates at a lower salary manage the teaching. The research qualification of the faculty is
28

limited. The information on physical infrastructure is available from more than 50 percent of
the colleges. As far as the extent of campus, presence of major facilities such as library, labs,
etc., vary a great deal. Yet, the physical infrastructure appears to be in place.
III. 2. Major issues relating to self financing colleges
Major issues relating to self financing colleges are examined in terms of admission criteria
and procedures, fees, quality, performance, performance evaluation and functioning of
regulatory authorities.
III.2.i.Admission criteria and procedures
III.2.i . (a).Eligibility Criterion
The Government of Tamil Nadu has abolished common entrance test which was the
eligibility criterion for admission till 2006-07. Due to various factors, there has been a large
number of vacancies under payment category and this is on the increase year after year,
putting the managements of engineering colleges under financial strain. The Government has
reduced the eligibility marks followed by representations from the Tamil Nadu Self-
Financing Engineering Colleges Association (Chennai, The Hindu, July 19, 2007). Hence, in
a Government Order in 2007, the minimum eligibility marks for admission into the
engineering colleges has been reduced. Accordingly, the minimum eligibility marks will be
(with basic qualification of higher secondary (academic)/higher secondary
(vocational)/diploma holders) 60 percent average in the related subjects for Other Caste
(OC), 55 percent average in the related subjects for BC, 50 percent average in the related
subjects for Most Backward Caste (MBC)/De Notified Caste (DNC), and mere pass for
Scheduled Caste (SC)/Scheduled Tribe (ST)6. There is no variation as far as the private
engineering colleges are concerned in terms of the eligibility criterion for admissions (see
Table 17).
6 as per GO No. 115 dated 25.05.2007
29

Table 17 Minimum Required Percentages of Marks for Admission in the Sample
Self-financing Engineering Colleges in Tamil Nadu Sl. No. Colleges OC BC MBC SC/ST
1 A.V.C Collegeof Engineering 60% 55% 50% mere pass 2 Adhiparasakthi 60% 55% 50% mere pass 3 Adhiyamaan College of Eng 60% 55% 50% Pass in + 2 4 Anjalai Ammmal College of Eng 60% 55% 50% Mere Pass 5 Asan Memorial College 60% 55% 50% Mere Pass 6 B.S Abdur Rahman Eng College 60% 55% 50% Pass in + 2 7 Coimbatore Institute of Eng 60% 55% 50% Mere Pass 8 Dhanalakshmi College of Eng 60% 55% 50% Mere Pass 9 K.S.R College of Eng 60% 55% 50% Mere Pass 10 S.K.R Engineering College 60% 55% 50% Pass in HSC or equivalent 11 St. Peter's Engineering College 60% 55% 50% Pass in + 2
Source: Same as the above table III.2.i. (b). Seat Sharing
Unaided engineering colleges in Tamil Nadu entangle on the issue of seat sharing with the
government for admissions under the management quota. There are two categories.
Category-I consists of seats in government engineering colleges and seats in aided courses in
government aided engineering colleges. Category-II comprises seats in the self supporting
courses in government aided engineering colleges and seats surrendered by the self financing
engineering colleges. 50 percent seats are filled up by the state governments and the
remaining seats by the management. The self-financing engineering college Association also
wants that admission under free-seat and payment seat categories ought to be maintained
equally to sustain the economic viability of the self financing colleges. The unaided non-
minority engineering colleges gave an undertaking to surrender 50 percent of their sanctioned
seats to the government (that is filled by the single window system under Category-II), and
the minority-run colleges' undertaking stated that they would surrender 30 percent of their
intake to the government. The Higher Education Department had proposed that the colleges
surrender 70 percent of the seats to the single window pool. The seat sharing varies across
institutions. Some of the colleges surrender about 92 percent of the seats to government
allotment (see Table 18). It could be because in the initial years of establishment of the
colleges, the seats are being surrendered to government. Once the colleges establish
themselves, they slowly reduce the number of seats surrendered to the government.
30

Table 18 Percentage Share of Government and Management Quota in Intake of Students in the Sample
Self-financing Engineering Colleges in Tamil Nadu Govt. Quota Management Quota Sl.
No College Names 2004-05 2005-06 2006-07 2004-05 2005-06 2006-07 1 Adhiparasakthi 51 55 -- 49 45 -- 2 Anjalai Ammmal College of Eng 60 49 44 40 51 56 3 Coimbatore Institute of Eng 81 43 45 19 57 55 4 Adhiyamaan College of Eng -- 30 49 -- 70 51 5 Bhajarang Eng College 46 43 52 54 57 48 6 Sakthi Mariamman Engineering -- 52 56 -- 48 44 7 S.K.R Engineering College -- 46 59 -- 54 41 8 St. Peter's Engineering College 92 46 62 8 54 38 9 B.S Abdur Rahman Eng College 37 40 63 63 60 37
10 K.S.R College of Eng 56 65 64 44 35 36 Source: Same as above table
III.2.ii. Fees To finance the physical and human infrastructure fee income is the main source for private
unaided institutions. From the private institutional perspective, these institutions charge
commercial fee rates and “capitation” fees and are neither accounted by receipts nor follow a
transparent admission procedure. In addition, the private institutions collect exorbitant and
compulsory fees of many forms and kinds in the name of transport, canteen, library, text
books, mark sheets, caution deposits; degree certificates; hall tickets; association fees, etc. It
would be extremely difficult to estimate these costs based on very limited and scanty
knowledge except from the NSSO7.
Tamil Nadu Government has revised the fees payable by students for admission to
self-financing engineering colleges. The revised fee is fixed under two heads — tuition fees
and development fees. The tuition fees include special fees and laboratory fees. It is also be
inclusive of library expenditure, maintenance expenditure, training cost and contingent
expenditure such as stationery, sports, water and other recurring expenditure. The institutions
are not permitted to collect any other fees. According to the GO, the fee per annum for B.E.,
B.Tech., M.E., M.Tech. and MCA in self financing (unaided) engineering colleges will be:
Rs 15,250 (Rs 12,250 tuition fees and Rs 3,000 development fees) for free seat category and 7 There is some information available on the Private or Unorganized Education Services in terms of their Size, type, workers by full time and part time and by male and female, income generated (value added) by enterprise and by worker (NSSO, 2003a; 2003b). The major problem here is the whole of education sector is considered here without really looking at them by levels of education.
31

Rs 49,750 per annum (Rs 41,750 as tuition fees and Rs 8,000 as development fees) for the
payment seat category. Whereas the details of fee, as approved by the State Fee Committee,
for the self-financing engineering colleges amount to Rs.52,500 (see Table 19).
Table 19 Fee as Prescribed by Government and State Fee committee in Tamil Nadu
Details State fee committee*
Govt Order**
Admn. & Tuition Fee 40000 41750 Text Books 3000 Insurance Postage Charges P & T 4500 Self Devl. Course 1000 8000 Caution Deposit 4000 Total 52500 49750
Note: * correspond to the year 2006-07; ** correspond to the year 2004-05 Source: Based on websites
The variation with the self-financing colleges in terms of the ratio of the fees of
management seat to free seat is 3.26 times higher. For the MBA course in self financing
(unaided) engineering colleges the total fees will be Rs 27,000 (Rs 24,000 as tuition fees and
Rs 3,000 as development fees) for the free seat category and Rs 44,000 (Rs 36,000 as tuition
fees and Rs 8,000 as development fees) for the payment seat category. In the case of
Government-aided engineering colleges, the total fee to be charged is Rs 8,500 inclusive of
Rs 4,000 as tuition fees, Rs 1,500 as special fees and Rs 3,000 as development charges.
Between government and self-financing free seat, the variation of fees in terms of the ratio
of the fees of government colleges to free seat in self financing colleges is 3.17 times
higher. Similarly, the variation of fees in terms of the ratio of the fees of government
colleges to management seat in self financing colleges is as high as 5.17 times higher. But
the fees charged as provided in the websites of various colleges vary. The minimum fee
charged for UG is Rs.32,500 in nine colleges and a maximum fee is Rs.77,500 (see Table
20). Similarly, for PG the minimum fee is Rs.25,000 and a maximum of Rs.50,000. It is to be
noted that these are besides the capitation fee.
32
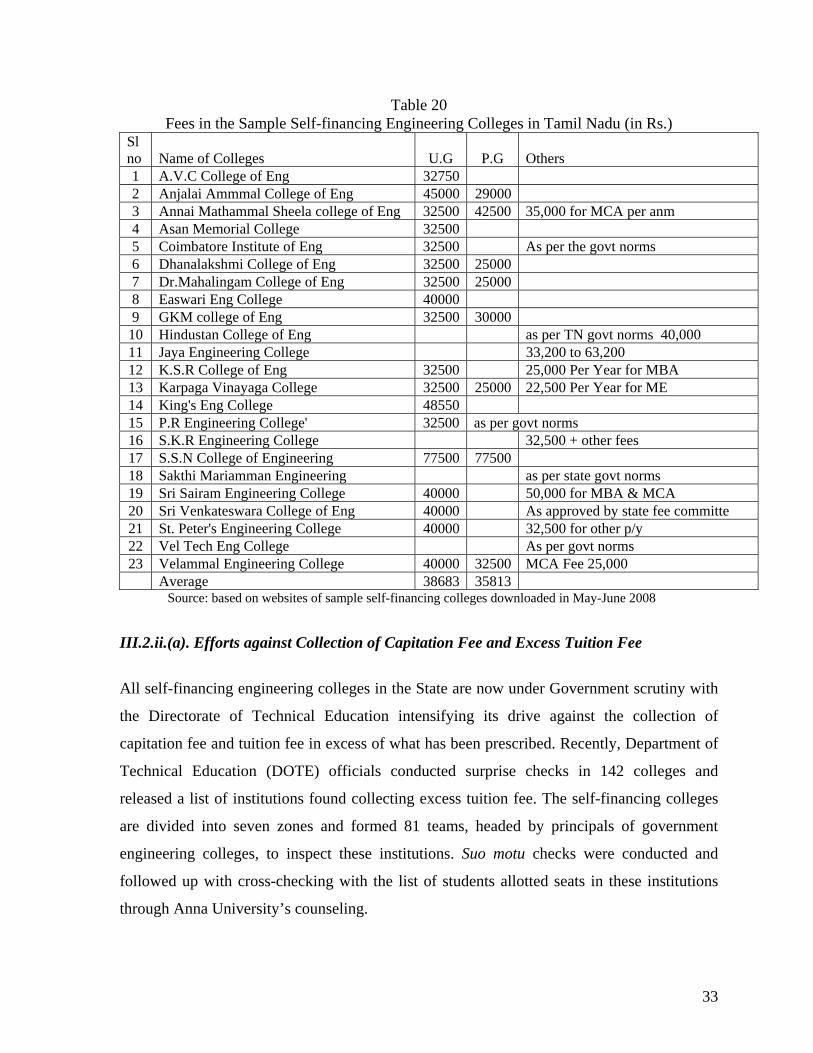
Table 20 Fees in the Sample Self-financing Engineering Colleges in Tamil Nadu (in Rs.)
Sl no Name of Colleges U.G P.G Others 1 A.V.C College of Eng 32750 2 Anjalai Ammmal College of Eng 45000 29000 3 Annai Mathammal Sheela college of Eng 32500 42500 35,000 for MCA per anm 4 Asan Memorial College 32500 5 Coimbatore Institute of Eng 32500 As per the govt norms 6 Dhanalakshmi College of Eng 32500 25000 7 Dr.Mahalingam College of Eng 32500 25000 8 Easwari Eng College 40000 9 GKM college of Eng 32500 30000
10 Hindustan College of Eng as per TN govt norms 40,000 11 Jaya Engineering College 33,200 to 63,200 12 K.S.R College of Eng 32500 25,000 Per Year for MBA 13 Karpaga Vinayaga College 32500 25000 22,500 Per Year for ME 14 King's Eng College 48550 15 P.R Engineering College' 32500 as per govt norms 16 S.K.R Engineering College 32,500 + other fees 17 S.S.N College of Engineering 77500 77500 18 Sakthi Mariamman Engineering as per state govt norms 19 Sri Sairam Engineering College 40000 50,000 for MBA & MCA 20 Sri Venkateswara College of Eng 40000 As approved by state fee committe 21 St. Peter's Engineering College 40000 32,500 for other p/y 22 Vel Tech Eng College As per govt norms 23 Velammal Engineering College 40000 32500 MCA Fee 25,000 Average 38683 35813
Source: based on websites of sample self-financing colleges downloaded in May-June 2008
III.2.ii.(a). Efforts against Collection of Capitation Fee and Excess Tuition Fee
All self-financing engineering colleges in the State are now under Government scrutiny with
the Directorate of Technical Education intensifying its drive against the collection of
capitation fee and tuition fee in excess of what has been prescribed. Recently, Department of
Technical Education (DOTE) officials conducted surprise checks in 142 colleges and
released a list of institutions found collecting excess tuition fee. The self-financing colleges
are divided into seven zones and formed 81 teams, headed by principals of government
engineering colleges, to inspect these institutions. Suo motu checks were conducted and
followed up with cross-checking with the list of students allotted seats in these institutions
through Anna University’s counseling.
33

DOTE officials found evidence of 14 colleges violating the prescribed fee structure.
The sample colleges among them are, Vel Sri Rangarajan Sakunthala College of Multimedia,
Vel Tech Engineering College and Vel Sri Rangarajan Sakunthala Hitech Engineering
College, Dhanalakshmi College of Engineering, Sri Sairam Engineering College and
Adhiyaman College of Engineering. The surprise checks could find that a donation of Rs. 5
lakh was paid by a student through demand draft to a trust was an unregistered entity linked
to the college. The government may initiate legal action against the college and also ask
AICTE to cancel recognition from next year.
The high cost of technical education is a major issue. The annual fee for a "payment
seat" in self-financing colleges in Tamil Nadu amount to more than Rs.50,000. This is in
addition to the capitation and other fees that many private colleges invariably charge. A
major disturbing feature has been a lack of motivation on the part of some educational
entrepreneurs to serve the cause of education leading in turn to a lack of commitment to
intellectual excellence. This was because their focus was ‘profit making’. Since the norms for
fixation of fees are not adhered, the quantum of fees charged has no rational basis and it is an
attempt to cover more than the full cost of engineering education. While the illegal capitation
fees range from Rs. 2 to 8 lakh for some of the courses, the regular fees also vary
considerably among courses and across colleges as well (Anandakrishnan, 2006). Since,
private institutions are privately owned and financed, they are governed less by the state. In
other words, since they are owned and financed by private groups (either business, minority,
chain of institutions or family) and it is these groups that tend to govern and demand
accountability (Levy, 1992) and not the academic excellence.
III.2.iii. Quality There is wide variation in the quality of education offered by different private engineering
institutions. The engineering courses are accredited by the National Board of Accreditation
(NBA) an autonomous body under the AICTE. An attempt is made here to look at whether
34

the sample colleges have accredited8 their courses under the NBA or not. From the
information available out of 43 colleges, only (see Appendix Table A6) 29 colleges have
accredited their UG and PG programmes. Among them five colleges obtained five year
validity of the courses which indicate a better score (above 75 %) in the accreditation.
Accredited for five years indicate an excellent/very good score, which indicates meeting all
accreditation criteria or exceeding them. If accredited for three years, then it is good implying
meeting the minimum criteria with deficiencies being marginal and can be improved within a
short time.
However, it is to be explored whether even these 29 colleges accredited all of their
courses. It needs to be further explored that in which of the colleges and which of the courses
the accreditation is not valid. However, an attempt has been made here to highlight the extent
of regulation of quality at the central level. As far as the incentives for colleges that have
created infrastructure well above the minimum prescribed by the AICTE, the state
government provides an incentive that colleges that have got accreditation from the NBA to
be permitted to collect 10 percent more fees; the accredited colleges that have got `A' grade
(five year validity) in five or more courses will be allowed to collect 20 percent more fees.
However the same is not mandatory to run the courses at the state level.
Accreditation of programmes is to regulate quality from the supply side. An outcome
of quality can be known from the number of successful candidates who pass out from the
system. An attempt is made here to look at the distribution of pass percentage of self-
financing colleges, a proxy measure of quality. In Tamil Nadu, the minimum percentage of
mark required to pass the final examination is about 40 percent. The average pass rate was
42.6 percent for all the 229 private unaided engineering colleges (see Table 21). It may be
noted that only 21 percent of the private unaided colleges could get more than 50 percent
pass rate. 32 out of 229 private unaided engineering colleges had less than 16 percent pass
8 The evaluation parameters for accreditation are elaborate and consist of eight components viz, organization and governance, financial resources, allocation and utilization, physical resources, human resources, human resources-student welfare, teaching-learning processes, supplementary processes (extra curricular) and R&D and interaction effort having the total score of 1000.
35

rate. In majority of the colleges that is 65 percent of the private unaided colleges, the pass
percentage ranged between 25 and 50 percent.
Table 21 Pass percentage of Private Unaided Engineering colleges in Tamil Nadu 2003-04 Pass % Range No. of
Colleges No. Appeared No. Passed Pass %
80-100 0 - - - 70-80 5 6669 4983 74.7 60-70 21 24826 15872 63.9 50-60 22 21861 11866 54.3 40-50 31 24457 11168 45.7 30-40 66 42502 15087 35.5 20-30 52 26680 6926 26.0 10-20 27 10364 1629 15.7 0-10 5 1343 132 9.8 Total 229 158702 67663 42.6
Source: Anna University as reported in Anandakrishnan (2004) Lack of qualified, experienced and competent teachers is found to be the major factor
as shown earlier. The evidence clearly brings out that private sector has increased
stupendously, but, their quality is extremely fragile as there is no accountability of these
institutions in terms of performance. While a few of them make significant contributions to
the need for a highly skilled work force, others merely exploit the situation.
III.2.iv. Performance Performance of the institution in terms of the job market absorption has been examined here.
Most private institutions claim to be commercially-oriented, preparing graduates for the job
market. Professional institutions promise potential students lucrative positions in their field
of choice upon graduation. The number of students placed in various companies include a
minimum of 25 to a maximum of 1,444 in the year 2007 (see Table 22).
36

Table 22 Number of Students placed and the Number of companies visited for Campus Interviews
across the Sample of Self-financing Engineering Colleges in Tamil Nadu S.NO Name of the College 2005 2006 2007 Visited No. of Companies*
1 A.V.C College of Eng 70 101 132 2 Aarupadai Vedu 30 3 Adhiparasakthi 44 83 152 4 Adhiyamaan College of Engg 40 121 151 86 5 Anjalai Ammmal College of Engg 27 56 76 6 Annai Mathammal Sheela college 146 146 146 7 Arunai Eng College 78 158 166 27 8 B.S Abdur Rahman Eng College 308 353 409 105 9 Bannari amman Institute of Tech 136
10 Dhaanish Ahmed College of Eng 25 11 Dhanalakshmi College of Eng 29 48 170 12 Dr. M.G.R Group of College 142 318 13 Dr.Mahalingam College of Eng 182 337 258 55 14 Hindustan College of Eng - - - 49 15 Jaya Engineering College 149 88 117 50 16 Jeppiaar Eng College 211 51 17 Jerusalem College of Eng 189 274 45 18 K.C.G College of Tech 50 19 K.S.R College of Eng 107 187 213 20 King's Eng College 159 21 P.R Engineering College' 147 18 22 S.S.N College of Engineering 425 471 504 - 23 Sakthi Mariamman Engineering 41 29 35 24 Sathyabama Institute of Science and Tech 1444 132 25 Sri Venkateswara College of Engg 28 26 St. Peter's Engineering 104 138 257 - 27 vel Tech Engineering college - - - 384
Note: * for campus interview Source: based on websites of sample self-financing colleges downloaded in May-June 2008
However, this needs to be examined in terms of the proportion of students placed in
the total intake in the college. But no such information is available from the websites. The
individual colleges report that each year the number of students they have placed in various
companies keep rising except a very few which show either stagnant or declining numbers.
Besides, the number of students placed, number of companies visited the college campus
range from a minimum of 25 to a maximum of 384.
As an endeavor to attract students towards the private colleges, the information on
average expected salary is also provided in many of the colleges’ websites. The minimum
37

expected salary range from Rs.3500 to a maximum of Rs.18,000 per month for fresh
graduates. The variation in the maximum salary is from a minimum of Rs.15000 to a
maximum of Rs.56,250. Even the average expected salary ranges from Rs. 8000 to
Rs.36,500 (see Table 23).
Table 23 Average expected salary in the Sample Self-financing Engineering Colleges
in Tamil Nadu
S.NO College Placement Minimum salary
Maximum salary
Average salary
1 Adhiyamaan College of Eng 14,200 20,203 17,202 2 Anjalai Ammmal College of Eng 11,500 15,000 8,000 3 Annai Mathammal Sheela college of Eng 6,000 30,000 18,000 4 B.S Abdur Rahman Eng College 10,000 41,000 25,500 5 Dhanalakshmi College of Eng 15,000 25,000 20,000 6 Dr.Mahalingam College of Eng 14,583 26,667 20,625 7 GKM college of Eng 6,000 18,000 12,000 8 Jaya Engineering College 3,500 22,500 13,000 9 K.S.R College of Eng 9,000 25,000 17,000
10 King's Eng College 6,000 18,000 12,000 11 P.R Engineering College' 8,000 22,000 15,000 12 S.S.N College of Engineering 16,667 56,250 36,500 13 Sakthi Mariamman Engineering 14,583 25,833 20,208 14 vel Tech Engineering college 18,000 26,500 22,500
Source: based on websites of sample self-financing colleges downloaded in May-June 2008 III.2.v. Performance Evaluation The State has the second largest intake capacity in the country in engineering education.
Challenges for self-financing engineering colleges in Tamil Nadu are how to tackle
decreasing demand which is to the tune of above 25 percent of the intake capacity. Based on
the market forces of demand and supply, colleges are now offering much lower fees (price)
than that fixed by the Government to attract students and yet there aren't many takers (The
Hindu, July 28, 2003). In 2003-04, the seats remained vacant in self-financing colleges was
33 percent of the sanctioned seats(see Table 24).
38

Table 24 Sanctioned and Admitted Seats in Engineering Colleges in Tamil Nadu
Sanctioned Intake
Admitted Vacancy Vacancy as % intake
1997-98 22192 22594 -402 -1.81 1998-99 22192 22873 -681 -3.07 1999-00 32735 31463 1272 3.89 2000-01 42892 38893 3999 9.32 2001-02 60470 48887 11583 19.15 2003-04 71460 48106 23354 32.68 2004-05 68190 49466 18724 27.46
Source: Statistical Hand book of Tamil Nadu, Chennai
It is because, the sanctioned intake has grown three and a half times from 22,192
students in 1997-98 to 71,460 students in 2003-04. As discussed earlier, the most prominent
reason is many engineering colleges do not have trained faculty. With these serious
constraints, it is surprising to find that the total number of seats have increased from 47,417
in 2003 to 69,100 in 2004 despite the fact that 21,505 seats remained vacant in 2003. Why
has the capacity increased despite the steep fall in demand? This raises the structural issue of
economic viability of the institutions. This kind of expansion leads to a lack of accountability
by private higher education providers.
The state government and the All India Council of Technical Education have not
seriously looked into permitting so many engineering colleges in the state, without relating
the capacity creation for engineering education to the pattern of industrial growth in the
state/country and requirements of qualified engineers. This also speaks of the approach of the
Government of Tamil Nadu in promoting higher education, mainly higher technical
education is to create manpower for export. There is no performance evaluation in place
either by AICTE or by the state government.
It may be noted that the central and state governments stipulate on a number of major
aspects from eligibility criteria, admission procedure, sharing seats, maximum fees to be
charged and quality, etc., but not on the terms and conditions of recruiting teachers – the vital
input for education. The self-financing colleges do not seriously follow even many of those
39

stipulations except the eligibility criterion. Eventually there is no performance evaluation in
place.
III.2.vi. Functioning of Regulatory Authorities Need for regulation of the private self-financing colleges from both the centre and state has
to be ensured. Although the AICTE was legally equipped with sufficient powers for
enforcement of standards, it has hardly lived up to the task that was envisaged for. It is
important to note that the Government of Tamil Nadu plays an active role in governance if
not in regulation. A couple of interventions namely single window system and abolition of
common entrance test are noteworthy in this context.
III.2.vi. (a) Single Window System of Admission
The state regulation has been in an incremental approach, resulting in piece-meal additions to
programs that are already in place. When private self-financing institutions came in large
numbers in the eighties in the four States of Andhra Pradesh, Tamil Nadu, Karnataka and
Maharashtra, there was no effective mechanism to control their functioning, nor was there a
systematic admission procedure, except in Andhra Pradesh, where all seats were filled up by
the Government on merit basis. In other states, 50 percent seats were filled up by the
respective governments and for the remaining seats, large sums of money were collected as
donations. Since the demand for admissions continued to increase and there was no effective
control, the situation led to a sort of commercialization of technical education. The above
situation continued even after all institutions were brought under the AICTE control. Later,
the Supreme Court, in a historical judgment in 1993, defined the norms for admission and the
fee structure for all self-financing engineering colleges. As per the Supreme Court directive,
all admissions to self-financing private colleges are to be done by the respective state
governments based on merit. 50 percent of the seats are “free seats” for which the fee
structure is the same as those of government institutions in the state government (AICTE,
1999, p.151).
40

Following this, the State Government of Tamil Nadu has introduced a single window
system of admission of students to engineering colleges during 1997–98 and streamlined the
admission procedure on the basis of merit of the students. The planning and execution of the
single window system of engineering admissions has been executed by the Anna University
(GoTN, 2006a). However, in conducting examinations and evaluation, these colleges were
under the Madras University and operating independently until 2002. In 2003, the state
government brought all these colleges under the Anna University. The State Legislature has
passed an Amendment Bill disaffiliating all the engineering colleges from the six general
purpose universities of the State and affiliating the same to the Anna University. The Bill
also contains a provision for transfer of all the Government engineering colleges to the Anna
University as constituent colleges. Belatedly in 2001, the state came up with a common
entrance test covering all management colleges along the line of engineering colleges when
the Anna University Amendment Bill was passed. Not only the engineering colleges, but also
all arts and science colleges are part of an affiliating university, whose main function is to act
as a regulating and an examining body in Tamil Nadu.
III.2.vi.(b). Abolition of Common Entrance Test
The common entrance test (CET) system for admissions to professional courses in Tamil
Nadu was introduced in 1984 in order to infuse transparency in the admissions process, at
least with regard to the government quota seats in unaided professional education
institutions. The CET system evolved over time and got its present structure in the early
1990s. Admissions to courses in medical, paramedical, engineering, veterinary and
agriculture and allied sciences were based on a combination of marks obtained in the higher
secondary examinations and the CET. This CET is largely urban biased and did not consider
large interest and welfare of the student community. This resulted in mushrooming of
coaching centres and fleecing parents in the name of entrance examination. To lessen the
burden and hardship faced by students in view of CET, the government constituted a high-
level expert committee headed by former Anna University Vice-Chancellor M
Anandhakrishnan to recommend measures to be taken for abolition of CET from 2007-08.
41

Following the recommendations of the committee, the State Government enacted the
Tamil Nadu Regulation of Admission in Professional Courses Act 2006 whereby the CET
was abolished for students clearing the State Board Examination. The students of other
boards such as the Central Board of Secondary Education were required to write the CET for
admission to professional courses. It may be noted that as in 2007-08, Tamil Nadu is the only
state which abolished CET. The major thrust behind the CET abolition is an attempt to place
the rural students at parity with that of urban students. In addition, it is also important to note
that rural Tamil Nadu's biggest provider of higher secondary education is public-funded
institutions run by the state government and local bodies, wherein the quality need to be
enhanced.
However, these are a few lukewarm measures taken at the state or aggregate level.
Given the intensity of the nexus between high fees combined with poor quality and no
accountability of the private institutions, the state does make an attempt but an effective one
because of the nature of dynamic and complex relationship among education, finance and
polity.
IV. Concluding Remarks
Tamil Nadu’s higher education in engineering with the 70 percent share with above 50
percent share of enrollments in the private sector, still operates in a largely effectively under
regulated space. The most acute problem is quality on account of lack of competent faculty.
This coupled with a lack of accountability raises serious doubts as to its ability to address the
huge latent demand for quality higher education in the state. As aptly put, “There is a place
for the market, but the market must be kept in its place” (Krip, 2007). Hence, a more
effective regulatory framework needs to be developed to address the problem of imperfect
information on the quality of teaching and student learning. While improved information
sharing on academic quality would be an obvious regulatory mechanism, some form of
“enforced self-regulation” is needed for more effective private higher education. This would
entail government incentives and sanctions designed to reform and strengthen institutional
and professional mechanisms for assuring academic quality, expressed as early as in the
middle of nineteenth century by J.S. Mill (1965).
42

Hence, it is important to regulate market through both short-term and long-term
policies. In the short run, it needs to focus on ensuring quality and accountability of the
private higher education system immediately. In the long run, the ‘state’ should raise some
fundamental and forgotten intrinsic values such as positive externalities, the social purpose
that higher education serves, the nation building role it performs, the public good and the
human right natures of higher education are to be brought back. Given these inherent and
intrinsic values of higher education, some basic questions like - Should the expansion of
private higher education continue? How much responsibility does it owe to the public good?
How to revive the abandoned scholarship? How to save the core of the ideals of modern
higher education in the face of market forces serving private interests rather than the public
good? etc., are to be the policy concerns in the middle to long run.
43

References:
Anandakrishnan, M. (2004). Equity, Quality and Quantity in Higher Education, in Issues in Higher Education, Vol. II. ICFAI University Press. Hyderabad.
Anandakrishnan, M (2006): ‘Privatization of Higher Education: Opportunities and
Anomalies’, presented at National Seminar on Privatization and Commercialization of Higher Education, NUEPA, New Delhi, May 2, 2006.
AICTE, (1999) Technical Education in India in Independent India: 1947-1997 A
Compendium to Commemorate the 50th Anniversary of Independence, All India Council for Technical Education, New Delhi.
Geiger L. Roger (2004), The Publicness of Private Higher Education, CHER Meeting: Enschede, Netherlands.
Government of Tamil Nadu (2003), Tamil Nadu Human Development Report, Social Science Press, Delhi.
Government of Tamil Nadu (2004), Health and Family Welfare Department, Policy Note: Demand No.18 Chapter 2, Medical Education 2004-05.
Government of Tamil Nadu (2006a), Policy Note: Demand No: 20, Higher Education, 2006-07, Higher Education Department of Government of Tamil Nadu, Chennai.
Government of Tamil Nadu (2006b), Policy Note: Legal Education, 2006-07, Tamil Nadu,
Chennai. Government of Tamil Nadu (2007a), Policy Note: Demand No: 20, Higher Education, 2007-
08, Higher Education Department of Government of Tamil Nadu, Chennai. Government of Tamil Nadu (2007b) Policy Note, 2006-07, Agriculture Department,
Demand No. 5, Policy Note 2007-08). Government of Tamil Nadu (2008), Policy Note: Demand No: 20, Higher Education, 2008-
09, Higher Education Department of Government of Tamil Nadu, Chennai. Government of Tamil Nadu, Statistical Handbook of Tamil Nadu, various issues. Government of Tamil Nadu, Economic Appraisal of Tamil Nadu, 1999-2000 and 2000-01. Kapur, D and P B Mehta (2004): ‘Indian Higher Education Reform: From Half-Baked
Socialism to Half-Baked Capitalism’, working paper No 108, Centre for International Development, Harvard University, September.
44

Kinser K and D.C. Levy, (2006), For-Profit Higher Education: U.S. Tendencies, International Echoes, in International Handbook of Higher Education, ed. James J. F. Forest and Philip G. Altbach, Springer, Netherlands.
Kirp, D. (2007) The Corporation of Learning: Nonprofit Higher Education Acquires Lessons
from Business, CSHE Research & Occasional Paper Series. Levy, D. C. (1992). Private Institutions of Higher Education. In B. Clark & G. Neave (Eds.),
The Encyclopedia of Higher Education (Vol. 2, pp. 1183-1195. New York, NY: Pergamon Press.
Levy, D.C. (2006) “The Unanticipated Explosion: Private Higher Education’s global surge”,
Comparative Education Review, 50(2), 218-240. Mill, J. S. (1965). Principles of Political Economy With Some Applications to Social
Philosophy (Collected Works, vols. II and III). Toronto: University of Toronto Press and Routledge.
Morey, A. (2004), Globalization and Emergence of For Profit Higher Education Higher
Education, 48(1), pp.131-150. MHRD, Selected Educational Statistics, Government of India, New Delhi, various issues. MHRD, Analysis of Budgetary Expenditure on Education 2004-05, various issues,
Government of India, New Delhi. NSSO, (2003a), Unorganised Service Sector in India 2001-02, Salient Features, Report
No.482, NSS 57th Round, Government of India. NSSO, (2003b), Unorganised Service Sector in India 2001-02, Characteristics of
Enterprises, Report, No. 483, NSS 57th Round, Government of India. NSSO (2006), Status of Education and Vocational Training in India 2004-05, Report No
517, NSS 65th Round, Government of India. Saravanan, S. (2007) A Study on Mush-room growth of Two-year Management Programme
and its Impact on Quality of Management Education in Tamil Nadu, W.P. No.2007-02-01, February 2007, Indian Institute of Management, Ahmedabad, India
Shattock, Michael (2001), “The Machinery for Determining Academic Pay: Illusion and
Reality in a `Nationalised Industry': Higher Education Quarterly, Volume 55, Number 1, January, pp. 62-77(16)
Singh, A (2004), Challenges in Higher Education, Economic and Political Weekly, vol. 34
(21), pp. 2155-58.
45

The Telegraph, 06 February, 2006 www.ugc.nic.in www.aicte.nic.in www.tnmgr.univ.org www.tnau.ac.in. www.nba.org
46

Appendix Tables Table A1
Number of Engineering Institutions by Management and by Districts in Tamil Nadu in 2006-07
Districts Govt PA PUA % PUA to total 1 Kancheepuram 40 17.17 2 Chennai 1 23 9.87 3 Coimbatore 2 3 18 7.73 4 Tiruvallur 19 8.15 5 Namakkal 14 6.01 6 Tiruchirappalli 1 10 4.29 7 Kanniyakumari 11 4.72 8 Erode 7 3.00 9 Virudhunagar 7 3.00
10 Vellore 1 10 4.29 11 Tirunelveli 1 8 3.43 12 Tiruvannamalai 6 2.58 13 Madurai 5 2.15 14 Villupuram 6 2.58 15 Dindigul 5 2.15 16 Pudukkottai 6 2.58 17 Sivagangai 5 2.15 18 Thanjavur 4 1.72 19 Salem 1 3 1.29 20 Perambalur 3 1.29 21 Thoothukkudi 4 1.72 22 Cuddalore 3 1.29
Others * 1 16 6.87 Tamil Nadu 7 4 249 269
*Others include Karur, Dharmapuri, Ramanathapuram, Nagapattinam, Theni, Chidambaranar, Tiruvarur, Mayiladuthurai, The Nilgiris, and Muthuramalingam, Krishnagiri having less than one % share of institutions and hence not reported in this table, together they account for 6.87 % with 16 PUA colleges Source: Based on information downloaded from www.aicte.org in June, 2007
47

Table A2 Number and Proportion of Approved Intake of Less than five percent in total Private Unaided
Engineering Colleges in Tamil Nadu by districts in 2005-06 and 2006-07 District 2005-06 2006-07
PUA total % PUA to total PUA
% PUA to total
Tiruchirappalli 4041 4341 4.6 4507 4807 4.4Kanniyakumari 3486 3486 4 4326 4326 4.3Erode 3489 3489 4 3963 3963 3.9Virudhunagar 3212 3212 3.7 3458 3458 3.4Vellore 2911 3031 3.3 3364 3484 3.3Tirunelveli 2550 2986 2.9 3084 3658 3Tiruvannamalai 2625 2625 3 2991 2991 2.9Madurai 2345 2345 2.7 2345 2345 2.3Villupuram 1844 1844 2.1 2264 2264 2.2Dindigul 2083 2083 2.4 2083 2083 2.1Pudukkottai 1770 1770 2 1950 1950 1.9Sivagangai 1405 1405 1.6 1585 1585 1.6Thanjavur 1219 1219 1.4 1459 1459 1.4Salem 1128 1510 1.3 1368 1750 1.3Krishnagiri 1068 1068 1.2 1308 1308 1.3Perambalur 810 810 0.9 1236 1236 1.2Thoothukkudi 1005 1005 1.2 1086 1086 1.1Sub-total 36991 38229 42.3 42377 43753 41.6Others* 6187 6447 7.1 6638 6638 6.5Tamil Nadu 87007 91345 100 101555 106140 100
* others include Cuddalore, Karur, Ramanathapuram, Dharmapuri, Nagapattinam, Theni, Chidambaranar, Tiruvarur, Mayiladuturai and The Nilgiris having less than one % share of approved intake and hence not reported in this table, together they account for 7.1 % and 6.5 during 2005-06 and 2006-07 respectively. Source: Based on information downloaded from www.aicte.org in June, 2007
48

Table A3 Background of the Sponsors of a Sample of Self-financing Engineering Colleges
in Tamil Nadu Sl. No Name of the College Mission Background Minority
1 Jaya Engineering College Telugu Minority
Arts and Science college, business, dentistry and paramedical -pharmacy and physiotherapy.
2 Dhaanish Ahmed College of Engineering Muslim minority
Ayanavaram Educational Trust in 1980 - aim of promoting, social, technical and higher education.
3 Bhajarang Engineering College, Alwarthirunagar
Telugu Linguistic Minority
Bhajarang Educational & Social Trust, a Telugu Linguistic Minority Trust established Engg, Arts Colleges, Medical Colleges and other instns
4 Jerusalem College of Engineering, Pallikkarani Charity Jerusalem Educational Trust in 1993
5 St. Peter's Engineering College Philanthropists St. Joseph Educational Trust in 1992 Chain of Institutions
6 Arulmigu Meenakshi amman college of Eng (23) Deemed univ Meenakshi Ammal Trust, part of Meenakshi Univeristy
7 S.R.M Institute of Science & Tech (17) S.R.M. Group, DU, family
35 year old SRM Group of Educational Institutions, sponsored by the Valliammai Society 3 campus in Chennai and a Delhi campus, campus also has a 3 star Hotel "Royal Southern" other institutions, Blossom Infotech, Geetha Constructions, Chennai, SRM Benefit Fund Ltd., SRM Eswari Travels & Tours India (P) Ltd. SRM Hospital - SRM Printers, SRM Systems & Software, Royal Southern Hotels
8 Sri Sairam Engineering College (16)
various other enterprises such as Real Estate, Industry
Established in 1995, Sapthagiri Educational Trust, is a non-profitable, and non-minority institution. Sri Sai Ram Institute of management and Computer Applications, 1997, Indian Medicine namely Siddha, Ayurvedha & Homeopathy-all under one roof.
9 Aarupadai Vedu (13)
to serve the society in general &needy
Vinayaka mission univ (DU) 27 years of estbt, Medical, Dental, Para-medical, Engg. Mgt Course,Thirumuruga Kirupananda Variyar Thavathiru Sundara Swamigal Medical, Educational and Charitable Trust 1981
10 Velammal Engineering College (12) Velammal Educational Trust, 10 of them schools and another hr education institutions
11 Vel Tech Eng College (11) group of ed instns Vel.Sri.R.Rangarajan
12 Adhiparasakthi (7) Religious, charity
1984 by Adhiparasakthi Charitable, Medical, Educational and Cultural Trust, in 1978; Secondary, Polytechnic, Engineering, Physiotherapy, Pharmacy, Nursing, Science and Agriculture
13 Adhiyamaan College of Eng (7) backward dt-Dharampuri
One of the Institutions under Adhiyamaan Educational & Research Institution - Trust 1987-1988
14 Karpaga Vinayaga College (7) political
Trust was initiated by the philanthropic spurts exerted by Thiru S. Regupathy, Honourable Minister for State for Home in association with a group of like -minded patrons
15 Sathyabama Institute of Science and Tech (7)
DU,Christian minority
Jeppiaar Educational trust founded in 1987, former leading politician
16 Annai Mathammal Sheela college of Eng (6)
Christian Minority
Needy on non-commercial basis Mathammal Sheela Trust Christian Educational Development Trust is a unit of Annai Mathammal Sheela Engineering College
17 Asan Memorial College (6)
Mahakavi Kumaran Asan, late poet
youngest of Asan Memorial group governed by Asan Memorial Association, in 1965
18 B.S Abdur Rahman Eng College (6) Muslim minority
All India Islamic Foundation - members are from education, research, industry, business and administration.
49

19 P.R Engineering College' (6)
Ponniyah Ramajayam group of instns
Sri Ponnaiyah Ramajayathammal Education & Charitable Trust Ricst (Ram Institute of Computer Science & Technology) in 1985, 8 other instns.
20 Hindustan College of Eng (5) Hindustan Group Hindustan Group of Institutions , Deemed Univ
K.C.G. College of Technology, Perungudi, Chennai
Hindustan Group
latest addition to the Hindustan Group of Institutions in 1998.
Industrial
21 Bannari Amman Institute of Technology
Industrial Bannari Amman Group
Expertise in sectors like sugar, distillery, textiles, garments, agro-products, finance, automobile, transport etc.
22 Dr.Mahalingam College of Engineering & Technology
industrial family
Mahalingam in Legislative Assembly of TN for 15 years. Chairman TN State Planning Commission.
23 S.K.R. Engineering College Industries Srinivasa Educational Trust.
24 S.S.N. College of Engineering
Shri S. S Nadar Educational & Charitable Trust’ in 1994, industry
SSN Institutions of Padma Bhushan Dr. Shiv Nadar’s give back to the society, HCL Group of Companies, not-for-profit basis
25 King's Engineering College, Rajam Group of Companies
Minority Self-financing college, Queensland Amusement Park and Pleasant Days resort hotel. Run by a philanthropic charitable and religious trust Chartian Educational & Health Trust. Andhra Pradesh based companies
26 K.S.R. College of Engineering Philanthropist
Aarthi Educational and Charitable Trust" in 1997, K.S.R. Exports, K S R Textile Mills Pvt Ltd. K S R Warping and Auto Sizing Mills; K S R Benefit Fund Ltd; Summer India Textile Mills Pvt Ltd.Sri Gokulam Hospital Pvt Ltd
Others
27 Anjalai Ammal Mahalingam Engineering College Railway trade unionist,
28 Sakthi Mariamman Engineering College,
Kannammal Educational Trust,Founder Chairman,Sri K.N.Ramachandran, a Humanist, Self-made man, Educationist and a Philanthropist “Rashtriya Rattan Award”
29 Sri Venkateswara College of Engineering
Unit of Sri Venkateswara Educational and Health Trust (SVEHT) in 1984 Kanchi Kamakoti Peetadhipathi Sri Jayendra Saraswathi Swamigal.
30 A.V.C College of Engineering,
social vision, educational mission
AV Charity, Registered Society 1955 with AVC aided arts and science college, AVC Polytechnic in 1983, and AVC College of Engineering in 1996
31 Coimbatore Institute of Engineering and Information Technology
educationalists and agriculturalists
2001 by the Kovai Kalaimagal Educational Trust (KKET)Charitable, educational trust in 1992; KK arts and secicen college, KK I of mgt &tech,
32 Dhanalakshmi College of Engineering
TN Profnl Courses Entrance Exam (TNPCEE)
started in 2001 former prof of Anna Univ Dr.V.P. Ramamurthi, DCE sister institution of IIPE, associated with TNPCEE
33 Arunai Engineering College Thiru vannamali
Saraswathi Ammal Educational Trust, 1993, Kamban College of Arts & Science For Women, Kumaran Polytechnic College
34 GKM College Of Engineering & Technology GKM Group
in 1996, many Education Institutions and run by Suganthi Educational Trust.
Source: Based on information downloaded from college websites in June, 2008
50

Table A4 Nature and Size of Basic Infrastructure in the Sample Self-financing Engineering Colleges
in Tamil Nadu
code Name of College Class room Tutorial Halls Lib/Lab
Drawing Hall
1
A.V.C College of Eng
31class rooms (each 83.67 Sqm)
10 tutorial halls size of each 83.67 Sqm
22 lab size of each 200 Sqm
2 Drawing halls size of 249.78 sqm
2 Adhiparasakthi 37 39 33 Anjalai Ammmal College of Eng 24 Class
room Total size of area 2504.58aqm
10 Tutorial halls (826.02 sqm)
29 Lab (4549 sqm)
2 Drawing halls (349.2 sqm)
4
Asan Memorial College
15 class rooms - 98 sq.m each 17 4
2 Drawing Hall 190 sq.m each
5
Bannari Amman Institute of Tech 36
50, lib- MCA Lib (173 Sq.m)
6
Bhajarang Eng College
20 class rooms (1506 sq.m)
16 Tutorial rooms (490 sq.m.)
16 Labs (2608.5 sq.m.)
2 Drawing halls (428 sq.m.)
7
Coimbatore Institute of Eng 14 in (Sq.M) 75.1 each
9 in (Sq.M) 75.1 each
16 in (Sq.M) 250 each
1 in (Sq.M) 175
8
Dhanalakshmi College of Eng
23 size of each 101 sq.m
15 size of each 36 sq.m
23 Lab size of each 250 sq.m
1 Drawing hall (250 sq.m)
9
Dr.Mahalingam College of Eng 26 17 9
2 Drawing halls (296.32 sq.m)
10
Easwari Eng College
41 Nos size of each 9.2 m X 9.2 m
7 size of each 9.2 m X 6 m
32 Nos size of each 23 m X 9.2 m
3 Drawing halls (each 16 m X 12.2 m)
11
Hindustan College of Eng
69 Class rooms each 113 sq.m
10 Tutorial Halls 70 sq. m each
8 Drawing Halls
12 Jaya Engineering College 37 17 2 lib; 40 labs 213
Jeppiaar Eng College
54 class room size of each 120sqm
8 rooms of 120sqm
2 Drawing halls size of 300sqm
51

14 K.S.R College of Eng
46 class room size of each 85 sq.m
10 Tutorial room size of each 85 sq.m
3 library size of each 600 sq.m
4 Drawing halls size of each 175 sq.m
15 Karpaga Vinayaga College 31Nos 15 nos
16 S.K.R Engineering College 25 & 70 sq. m
14 & 40 Sq.m
32 Labs & 250 sq.m
4 nos – 350 sq.m
17 Sri Venkateswara College of Engineering
62 Nos. (65/71/89/97 sqm.) each
37 Nos. (34/64 sqm.) each
46 Nos. (136/166/245 sqm.) each
4 Nos. (158/210 sqm.) each
18 Velammal Engineering College 51 nos size of each 90.00 sq.m
6 Nos Library size of each 356.00 sq.m;31 Nos size of each 422.145 sq.m
2 Nos drawing halls size of each 315.90 sq.m
Source: Based on information downloaded from college websites in June, 2008
52

Table A5 Nature and Size of Additional Infrastructure in the Sample Self-financing Engineering
Colleges in Tamil Nadu
Sl. No. Name of College
Computer Centre
Seminar / Conference Hall
No of Computers Workshop Others
1
A.V.C College of Eng 1 size 293.8 Sqm
3 (each 249.78 Sqm) 466
play ground 7 Acres
2 Aarupadai Vedu 3 250 3
Adhiparasakthi 4 434 play ground 5 Acres
4 Anjalai Ammmal College of Eng
4 computer center total size of 588 sqm
1 Exam Hall size fo 604.78 496
5 Asan Memorial College 3 244 6
Bannari amman Institute of Tech
6 AC Seminar Halls 250-seat
hostels with capacity for 1800 students
7
Bhajarang Eng College
3 Computer Center 892 sq.m.
Exam Section and confidential room . Exam cell - size 32 sq.m
405
2 Workshops are available with the total size is 608 sq.m.
Total area of the play ground 23.32 acres, Multi purpose Indoor Stadium facilities Area 923 sq.m Cost 40 Lakhs
8
Coimbatore Institute of Eng 1 in (Sq.M) 310
1 Exam Center size is 175.1 sq.m 260 1
9 Dhaanish Ahmed College of Eng 5 240
10 Dhanalakshmi College of Eng
2 computer center size of each 200sq.m 467
11
Dr.Mahalingam College of Eng 1058
Indoor Stadium : 2500 Sq.mt.
land for sports - 12 Acres, Gym Facilities: (60ft X 60ft size hall ), Multi purpose Sports Auditorium – 212.ft.X 120.ft.X.40.ft ( 25440 Sq.ft. ).
12 Easwari Eng College 9 762 13
Hindustan College of Eng
7 Computer Labs 1075.29 sq. m 2 Internet Lab 13.84 sq. m 802
53

14 Jaya Engineering College 1 645 1 workshop 15
Jeppiaar Eng College 1 room of 1200sqm 900
Total Area of the Play ground 17600 Sq. Ft.
16
K.S.R College of Eng
9 computer centres size of each 200 sq.m 752
11 workshop total size 13000 sq.m
17
Karpaga Vinayaga College
Central Exam Facility, 31 rooms each 25 / 50 for 435
18
King's Eng College 5
3 Central Exam Halls Total Area – 824.25 sq.m
19 S.K.R Engineering College
3 computer center 550
20 S.S.N College of Engineering 912 24 hour dispensary
21
Sri Venkateswara College of Engineering
3 Nos. 136 sqm. Each
Central Exam Facility, 8 rooms - capacity 1500 660
Workshop available
10 acres of Play field for playing various games.
22 Velammal Engineering College 8 computer
center size of each 268.00 sq.m
1 Central Exam Facility total size 90 Sq.m
530
Source: Based on information downloaded from college websites in June, 2008
54

Table A6 Courses Accredited and Period of their Validity in the Sample Self-financing Engineering
Colleges in Tamil Nadu Sl. No. Colleges Programmes Level
Period of Validity Status w.e.f.
1 Adhiparasakthi Engg. College, Melmaruvathur,
Civil, Mech.,EEE, ECE & Chem(†)
UG 3 Yrs Sept. 10, 2004
2 Adhiyamaan College of Engg. Chem, Civil(†), Mech (†), Prod. EEE (†), ECE (†), Instru. & Control (†), Comp Sci (†), IT
UG 3 Yrs Sept. 12, 2007
3 Anjalai Ammal Mahalingam Engg. College,
Mech (†), ECE(†),Comp Sci (†),IT, EEE (†),Chem (†)
UG 3 Yrs. 4-May-07
4 Arulmigu Meenakshi Amman College of Engg.,
Chem, EEE, Civil, Mech UG 3 Yrs. 27-Jul-06 11-Jun-04
5 Arunai Engg. College,Velu Nagar,
IT,Chem, EIE, Mech, EEE, Comp Sci, ECE, MCA
UG 3 Yrs. 27-Jul-06 12-May-99
6 B.S. Abdur Rahman Crescent Engg. College,
Instru. & Control Engg. (†), Comp Sci (†), IT, MCA(†), MBA(†), ECE (†), Mech (†) ElEE (†), Civil (†), Polymer Tech
UG 5 Yrs. 27-Jul-06 30-Mar-06
Aug. 6, 2002
7 Bannari Amman Institute of Technology,
Mech (†),Textile Tech (†) UG 3 Yrs. 16-Mar-07
8 Coimbatore Institute of Technology,
Civil, ECE, Comp Sci, EEE Mech, Chem
UG 3 Yrs Jan. 12, 2005
9 Dhanlakshmi Srinivasan Engineering College,
Comp Sci, ECE, UG 3 Yrs Sept. 12, 2007
10 Dr. M.G.R. Engg. College Chem, ECE, Prod., Instru. & Control, Engg, Mech, EEE, Comp Sci, MBA, MCA, ME Applied, Electronics,
UG PG
3 Yrs. 5 Yrs.
24-Apr-02 Aug. 6, 2002
11 Dr. Mahalingam College E&T Comp Sci, ECE, Mech, MCA, UG, PG
3 Yrs.
4-May-07
12 Easwari Engg. College, Comp Sci, (†), ECE (†), EEE (†), EIE (†), IT, MBA, MCA,
UG, PG
3 Yrs.
Jan. 22, 2008
13 G.K.M. College of Engg.& ech Comp Sci, ECE, EEE, UG 3 Yrs Sept. 12, 2007 14 Hindustan College of Engg.,
Civil, Mech, ECE, Automobile, Comp Sci, Aeronautical, EEE, EIE, IT,
UG 3 Yrs Feb. 15, 2005
15 Jaya Engg. College, Textile Tech, Comp Sci, ECE, UG 3 Yrs. 27-Jul-06 16 Jerusalem College of Engg. Comp Sci, ECE, EEE, UG 3 Yrs. 7-May-03 17 KCG College of Technology, Comp Sci, EEE, Mech, UG 3 Yrs. 27-Jul-06
18 K.S. Rangasamy College of Technology
Mech, EEE, ECE, Comp Sci, Mechat, IT, Textile, MBA, MCA,
UG PG
3 Yrs
Feb. 15, 2005 16-Mar-07
19 Madha Engg. College, Mech, EEE, UG 3 Yrs. 11-Jun-04
55

20 S.R.M. Engg. College Mech, MCA, Structural, ECE, EEE, Instru & Control, Chem, MBA, Architecture, Civil (†), Comp Sci (†), Comp Sci,
UG, PG
5 Yrs. 3 Yrs.
Feb. 21, 1998, 1-Apr-01, 24-
Apr-02
21 Sri Sivasubramaniya Nadar College of Engg.
Comp Sci, EEE, ECE MCA MBA
UG, PG
3 Yrs.
4-May-07
22 Sathyabhama Engg. College, Mech, Prod., ECE, Instrumentation & Control Engg, Comp Sci, EEE,
UG 5 Yrs. 12-May-99
23 Sri Muthukumaran Institute of Technology,
Comp Sci, Mech, EEE, ECE,
UG 3 Yrs. 11-Jun-04
24 Sri Sai Ram Engg. College, EEE, Comp Sci, ECE, Instru& Control Engg, IT, Mech,
UG 3 Yrs. 16-Mar-07
25 Sri Venkateswara College of Engg.,
Comp Sci,(†), EEE, MCA, IT (†)Mech,(†), ECE (†), Thermal, Marine, Automobile, Chem ,(†),
UG,PG
5 Yrs., 3 Yrs.
24-Apr-02 Sept. 12, 2003
27-Jul-06 26 St. Peter's Engg. College, EEE(†), Chem, Comp Sci(†),
Mech(†), ECE(†), EIE(†), Prod, (†), MBA, (†), IT, Civil, Bio-Tech,
UG, PG
3 Yrs. .
27-Jul-06, Sept. 12, 2007, 11-
Jun-04 Jan. 22, 2008
27 Vel Tech Engg. College Comp Sci, ECE., EEE, IT, MCA,MBA, Mech, EIE
UG, PG
3 Yrs. 5 Yrs.
27-Jul-06, 16-Mar-07
28 Velammal Engg. College,
IT, ECE (†), EEE. (†) EIE & Instru., .Mech, Comp Sci (†)
UG
3 Yrs, 5 Yrs.
4-May-07
Note: Programmes Accredited by NBA as on Jan 2008Source: Based on www.nba.org, downloaded as on 15.6.2008
56

Table A7 List of Sample Self-financing Colleges by Location in Tamil Nadu
1 A.V.C College of Eng 2 Aarupadai Vedu 3 Adhiparasakthi 4 Adhiyamaan College of Eng 5 Anjalai Ammmal College of Eng 6 Annai Mathammal Sheela college of Eng 7 Arulmigu Meenakshi amman college of Eng 8 Arunai Eng of College 9 Asan Memorial College
10 B.S Abdur Rahman Eng College 11 Bannari amman Institute of Tech 12 Bhajarang Eng College 13 Coimbatore Institute of Eng 14 Dhaanish Ahmed College of Eng 15 Dhanalakshmi College of Eng 16 Dr. M.G.R Group of College 17 Dr.Mahalingam College of Eng 18 Easwari Eng College 19 GKM college of Eng 20 Hindustan College of Eng 21 Jaya Engineering College 22 Jeppiaar Eng College 23 Jerusalem College of Eng 24 K.C.G College of Tech 25 K.S.R College of Eng 26 Karpaga Vinayaga College 27 King's Eng College 28 Madha Engineering College 29 Magna College of Eng 30 Measi Academy of Architecture 31 P.R Engineering College' 32 S.K.R Engineering College 33 S.R.M Institute of Science & Tech 34 S.S.N College of Engineering 35 Sakthi Mariamman Engineering 36 Sathyabama Institute of Science and Tech 37 Sri Muthukumaran Institute of Tech 38 Sri Sairam Engineering College 39 Sri Venkateswara College of Engineering, Sriperumbudur 40 St. Peter's Engineering College, Avadi, Chennai 41 Vel Tech Engineering College, Chennai 42 Velammal Engineering College, Chennai
Source: Based on information downloaded from Tamilnow.com in May, 2008
57
